Back to Journals » Clinical Interventions in Aging » Volume 17
An Easy-to-Implement Clinical-Trial Frailty Index Based on Accumulation of Deficits: Validation in Zoster Vaccine Clinical Trials
Authors Andrew MK ![]() , Matthews S, Kim JH, Riley ME, Curran D
, Matthews S, Kim JH, Riley ME, Curran D
Received 10 March 2022
Accepted for publication 2 July 2022
Published 19 August 2022 Volume 2022:17 Pages 1261—1274
DOI https://doi.org/10.2147/CIA.S364997
Checked for plagiarism Yes
Review by Single anonymous peer review
Peer reviewer comments 2
Editor who approved publication: Prof. Dr. Nandu Goswami
Video abstract of "An easy-to-implement CT-FI based on accumulation of deficits" [ID 364997].
Views: 89
Melissa K Andrew,1 Sean Matthews,2 Joon Hyung Kim,3 Megan E Riley,3 Desmond Curran4
1Department of Medicine (Division of Geriatric Medicine), Dalhousie University, Halifax, Nova Scotia, Canada; 2Freelance C/O GSK, Wavre, Belgium; 3GSK, Rockville, MD, USA; 4GSK, Wavre, Belgium
Correspondence: Melissa K Andrew, C/O Department of Medicine (Division of Geriatric Medicine), Dalhousie University, Veterans Memorial Building, 5955 Veterans Memorial Drive, Halifax, NS, Canada, Tel +1 902 473-4995, Fax +1 902 473-7133, Email [email protected]
Purpose: Despite being among those most in need of protection, frail older adults are often not well represented in clinical trials. Although frailty likely influences responses to treatments and vaccines, frailty may not be explicitly considered in trials even when frail participants are enrolled due to the perception that frailty is difficult to measure effectively and efficiently without adding to participant or data collection burden. We developed an easy-to-implement frailty index, the Clinical Trial-Frailty Index (CT-FI), based on baseline medical history and standard patient-reported outcomes using data from clinical trials of recombinant Zoster vaccine (the ZOE-50 and ZOE-70 studies). Our objective was to demonstrate that the CT-FI is a robust measure that may be used retrospectively or prospectively in clinical trials where sufficient patient data have been collected.
Methods: The CT-FI was based on baseline medical history and Quality of Life questionnaires (SF-36 and EQ-5D). Items meeting criteria for inclusion were scored from 0 to 1, then summed for each participant and divided by the total number of deficits considered. Validation analyses included descriptive verification of distribution and age- and sex-associations in relation to usual patterns of the frailty index, regressions in relation to outcomes hypothesized to be related to frailty, and resampling methods within the index.
Results: The CT-FI distribution was well represented by a gamma distribution with a range of 0– 0.70. Deficit accumulation increased with chronological age and was higher for females. Multivariate Cox regression survival analysis showed that the CT-FI, age, and sex were significant predictors of mortality. Jackknife and Bootstrap resampling methods highlighted the robustness of the CT-FI, which was not sensitive to inclusion/exclusion of specific individual or groups of variables.
Conclusion: We have developed a reliable, robust and easy-to-implement CT-FI with potential retrospective or prospective application in other clinical trials.
Keywords: frailty, frail elderly, older adults, herpes zoster, quality of life, vaccine, clinical trial
Introduction
Older adults are not a homogeneous population: while many people maintain a high degree of independence and good health as they age, many other older individuals become “frail”, a state of decreased physiologic reserve and increased vulnerability for morbidity and mortality.1,2 Frail older adults often have different clinical presentations (including with infectious illnesses) and/or respond differently to interventions and treatments than their less frail counterparts;3–5 Classifying frailty has therefore become an important topic within healthcare and clinical trial fields in recent years. This has become especially poignant in the current COVID-19 era, with the devastating impact of COVID-19 on frail older adults, and the need to understand differential responses to treatments and vaccines.6 Frail participants and those with multiple morbidities are often under-represented in randomized controlled trials (RCTs), and frail people are likely to have different outcomes and responses to the interventions being studied, raising questions about vaccine or drug effectiveness in real-world settings.7 This is being recognized by regulatory authorities, who increasingly request that efficacy and safety of a vaccine or drug be demonstrated in a frail cohort within a clinical trial setting. For instance, the European Medical Agency guidelines emphasize that treatments for vulnerable groups, such as frail individuals, should be appropriately studied for unique treatment effects.7
Even so, inclusion of frailty measures in clinical trials is rare, with barriers including a perception that measuring frailty is difficult or will add to participant and data collection burden. The fact that no consensus exists on frailty measurement may also contribute to such nihilism. It is true that multiple tools have been proposed in the literature to measure frailty.8,9 Some approaches, such as the Frailty Phenotype10 and the Clinical Frailty Scale11–13 require specific data collection at baseline (ie, the initial study visit). In contrast, the Frailty Index (FI) approach is based on accumulation of deficits and calculated using a wide-ranging set of deficits. Many (if not most) published deficit accumulation FI are generated from existing datasets, and thus do not require specific items to have been collected prospectively. This offers clear benefits for use of FI in clinical trials, including of vaccines, where detailed baseline health data tend to be collected along with measures of quality of life and symptoms in order to assess impact on possible illness outcomes, safety and reactogenicity.
With the aim of studying frailty in relation to performance of the recombinant Zoster vaccine, we constructed a FI based on data from clinical trials of using a large and relatively diverse sample of clinical study participants (N = 26,976, ≥50 years of age). This Clinical Trial-FI (CT-FI) was shown to be an accurate measure of frailty status compared with a prospectively defined FI (NCT02979639) and has also been applied in the ZOE-Frailty study (NCT03563183).14,15
In the present manuscript, we aimed to describe and present the CT-FI as an achievable frailty measure for use in vaccine clinical trials, and to validate the CT-FI in relation to characteristics that are known to be preserved across different frailty indices. We also aimed to demonstrate that the CT-FI is a robust measure that is not sensitive to the choice of individual included/excluded deficits.
Methods
Study Design and Participants
The CT-FI was applied in the ZOE-Frailty study (NCT03563183) in order to examine vaccine efficacy, immunogenicity, safety and reactogenicity, with analyses stratified by level of frailty as a retrospective analysis of the ZOE-50 (NCT01165177) and ZOE-70 (NCT01165229) vaccine studies, which were RCTs of adjuvanted recombinant zoster vaccine compared with placebo in the prevention of herpes zoster illness and complications.16,17 A full description of the ZOE-Frailty study is found at the study’s clinicaltrials.gov registration: https://clinicaltrials.gov/ct2/show/NCT03563183?term=064andcond=Zoster&draw=2andrank=1. The previously published ZOE-Frailty study was a retrospective analysis of 26,976 ZOE-50 and ZOE-70 participants (mean age 68.8 years, range: 48–96). Participants were found to represent a range of frailty from non-frail to frail. Vaccine efficacy against herpes zoster was robust (>90%) across frailty subgroups.15 For the present analyses further exploring and validating the CT-FI, all ZOE-Frailty participants with known baseline frailty were included, regardless of vaccine group assignment or vaccination status in the RCTs. Of the total 26,976 participants, 137 (0.5%) were missing the full FI, but of these, 6 had enough data to be defined as frail (FI >0.25) so only 131 had to be excluded because frailty status was unknown.
Generating the CT-FI
According to published guidelines, in order to be a candidate for inclusion in a deficit accumulation FI, any health deficit must fulfill the five basic criteria:23
- It must associate with health status.
- Prevalence must generally increase with chronological age.
- The deficit must not saturate too early in the general population.
- Deficits must cover a range of systems.
- Only when using a FI to serially track a given population over time, the deficits used to make up the FI need to remain constant from one iteration to the next; comparisons between samples, or drawn from different contexts or datasets, do not need to include the same deficits.
Accordingly, we identified 41 health deficits: 12 from the participant’s medical history, 25 from responses to the Short Form Survey-36 (SF-36)18 and 4 from responses to the EuroQol-5 Dimension (EQ-5D)19 questionnaires completed at baseline. The included comorbidities (defined based on the participant’s medical history) were selected as per prior published FI work.20 These were not intended to be an exhaustive list of all possible medical conditions, but rather to represent a broad range of illnesses.
In order to avoid duplication of concepts included in both QoL measures, we selected 25 items from the SF-36 covering the domains: physical functioning, general health, vitality and mental health,18 and from the EQ-5D we included items for mobility, self-care, usual activities and anxiety/depression.19
According to established methods for FI generation, items are scored from 0 (deficit absent) to 1 (deficit present) and each participant’s deficits are summed and divided by the total number of potential deficits considered (here 41), with an adjustment for missing SF-36 or EQ-5D items, to generate a continuous index in the range of 0–1.21,22 After each study participant’s continuous FI value was calculated, for the purposes of stratified analyses participants were also assigned to one of three frailty subgroups based on previously published cutoffs: FI ≤0.08 was classified as non-frail; FI >0.08 to ≤0.25 pre-frail; FI >0.25 frail.15,20 Full details of the included deficits and scoring of CT-FI components are provided in Supplementary Methods and Tables S1 and S2.
Validation Methods
We employed a series of well-known methods to validate the CT-FI.21–23
- Distribution and associations with age and sexThe FI should increase monotonically with chronological age and based on literature generally follows a gamma distribution with a sub-maximal limit of approximately 0.70 that is independent of age.24,25 We analyzed the relationship between the CT-FI and chronological age by means of a general linear model and obtained an estimate of the rate of deficit accumulation per year of age. Our approach was to fit a piecewise linear model in which we chose 70 years of age as the cutoff point. We also examined differences in frailty by chronological age. It is well established in the literature that frailty tends to be higher in women than in men (while mortality is higher in men at any given level of frailty),26 so we examined sex differences in the CT-FI.27,28
Statistical analyses were conducted using SAS Desktop 9.4 software.
Role of the Funding Source
This work was sponsored by GlaxoSmithKline Biologicals SA. GlaxoSmithKline Biologicals SA was involved in all stages of the study conduct and analysis, and took responsibility for all costs associated with the development and publishing of the present manuscript. GlaxoSmithKline Biologicals SA does not veto ongoing publications or control the decision about what journal to submit to, with ultimate decision on the target journal made by the coauthors. The lead and corresponding author MKA received no payment related to any aspect of this study.
Ethics
The parent ZOE studies were approved by Research Ethics Boards at participating sites; participants provided written informed consent in accordance with the Declaration of Helsinki. The present analyses, done as part of the ZOE Frailty Study (NCT03563183), were approved by Research Ethics Boards at ZOE frailty participant sites. The full list of sites participating in the ZOE frail study is found in the clinicaltrials.gov registration at: https://clinicaltrials.gov/ct2/show/NCT03563183?term=064andcond=Zoster&draw=2andrank=1.
Results
CT-FI Distribution and Associations with Age and Sex
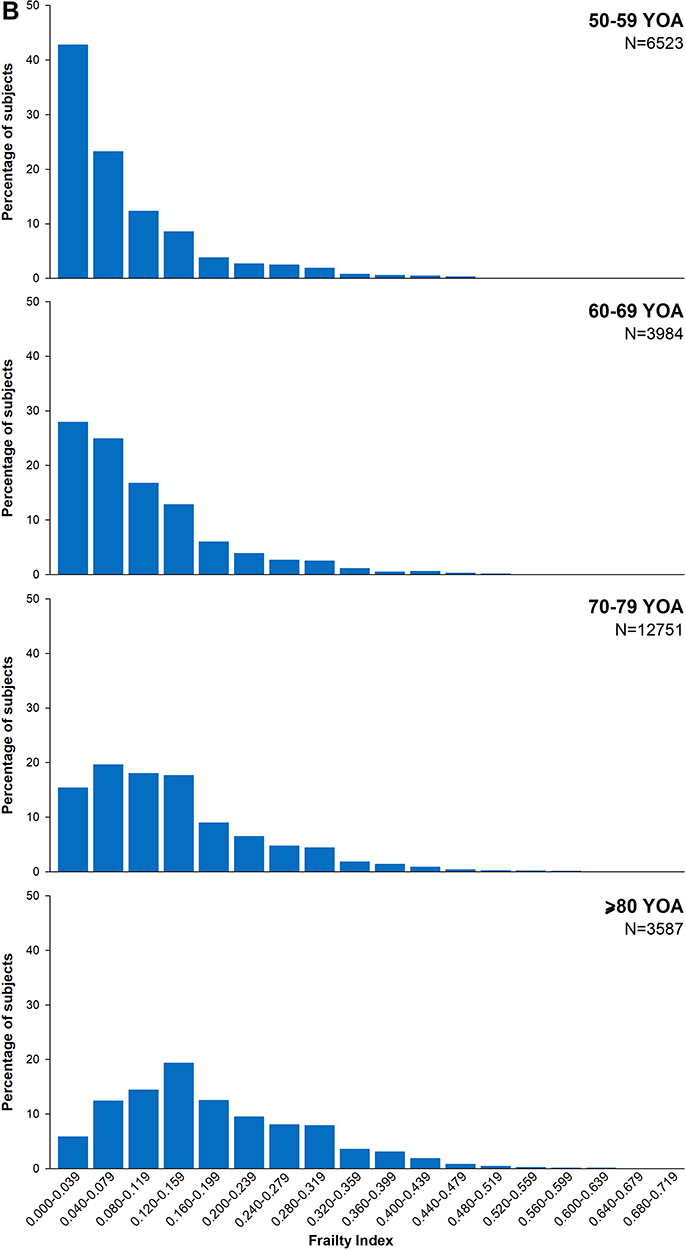
The CT-FI followed a gamma distribution tailing to the right with maximum 0.70 and median 0.10 (Interquartile Range 0.05–0.17) (Figure 1A). The CT-FI was distributed more symmetrically as age increased (Figure 1B); mean score increased with age (Figure 2). Age was a significant factor in the piecewise linear model (p < 0.0001) with a rate of mean deficit accumulation per year of 0.0021 for participants <70 years and 0.0052 for those aged ≥70. There was also a significant “sex by chronological age” interaction effect in both age categories with the average rate of deficit accumulation per year for males and females being 0.0016 and 0.0025, respectively, for participants under 70 years and 0.0047 and 0.0058, respectively, for participants ≥70 years (Table S3). Figure 1 Continued. Figure 1 Clinical Trial Frailty Index (CT-FI) distribution. (A) Presents the CT-FI distribution in the entire sample. (B) Presents CT-FI distributions stratified by age category. Abbreviations: N, number of subjects in each age category; YOA, years of age.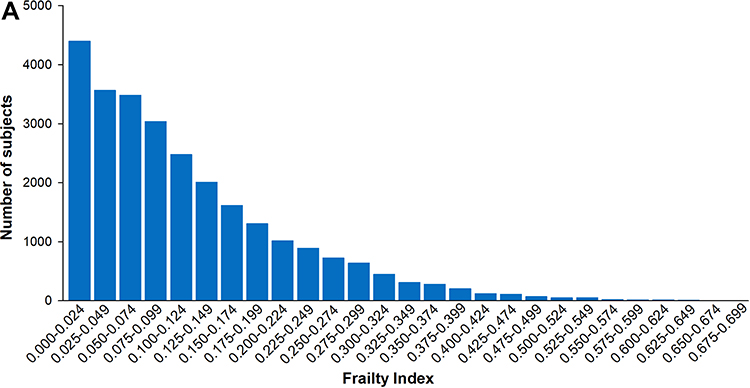
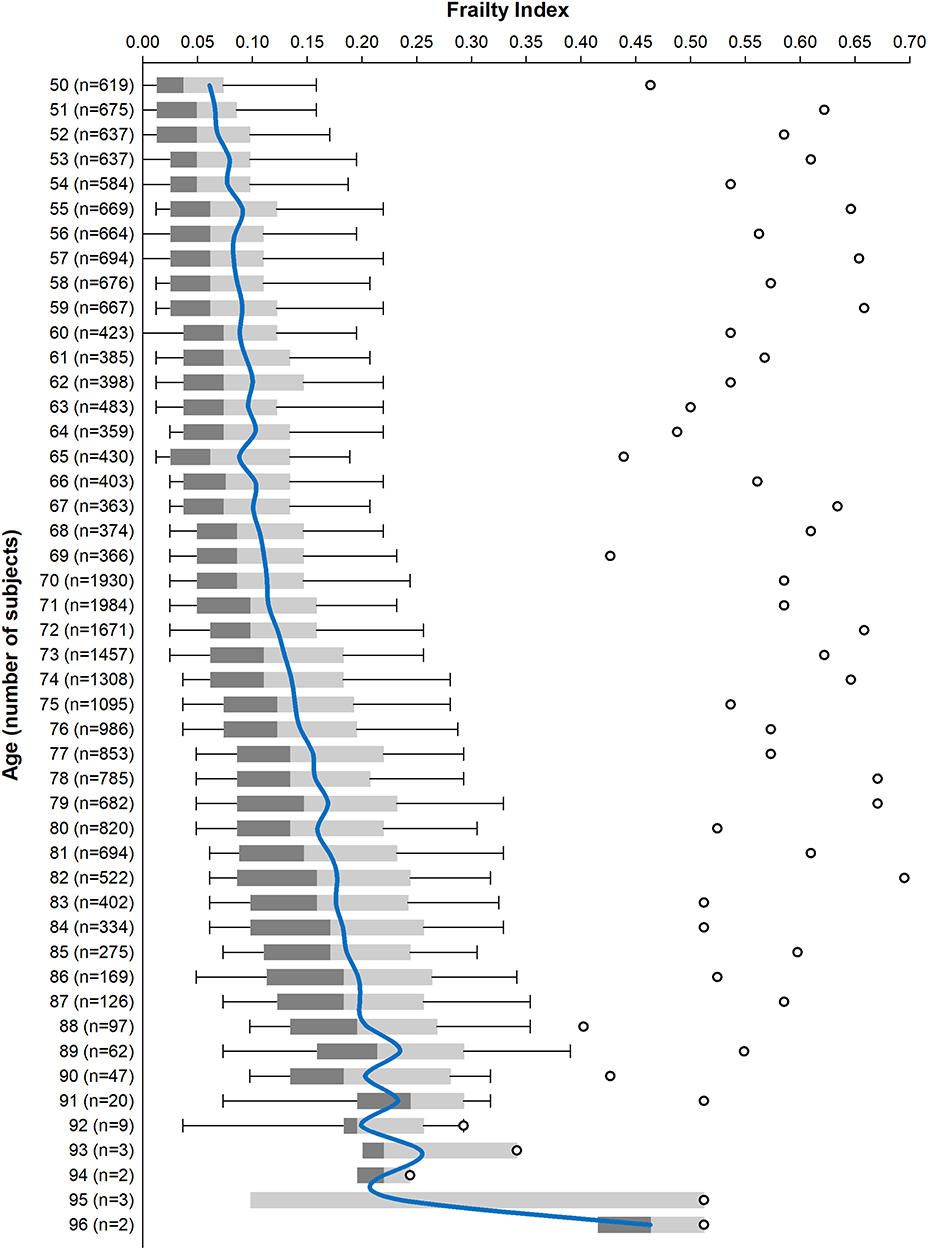 |
Figure 2 Box and whisker plot of Clinical Trial Frailty Index by years of age. Abbreviation: N, number of subjects at each age. Notes: The boxes represent the 25% and 75% percentiles. The whiskers extend from the 10th to the 90th percentile. The line joins the mean value at each age. The dots represent the maximum values at each age group. |
The percentage of individuals classified as non-frail, pre-frail and frail was 42.7%, 45.6% and 11.3%, respectively. The most common medical history deficits were hypertension and arthritis reported by 53.4% and 32.4% of all participants, respectively, while the least common medical history deficits were congestive heart failure and migraine reported by 3.6% and 2.6% (Table S4).
Mortality in Relation to the CT-FI
Table 1 presents the number of deaths by frailty status and sex. The percentage of participants who died during study follow-up (and who were classified per protocol as experiencing a fatal serious adverse event [SAE]) was 2.0%, 5.2%, and 11.7% in the non-frail, pre-frail, and frail subgroups, respectively. Although the rate of deficit accumulation was higher for females than males, the proportion of deaths among frail males was higher compared to frail females (ie, 16.0% versus 9.4%). Figure S1 presents the Kaplan–Meier estimates of the survivor function by frailty and sex.
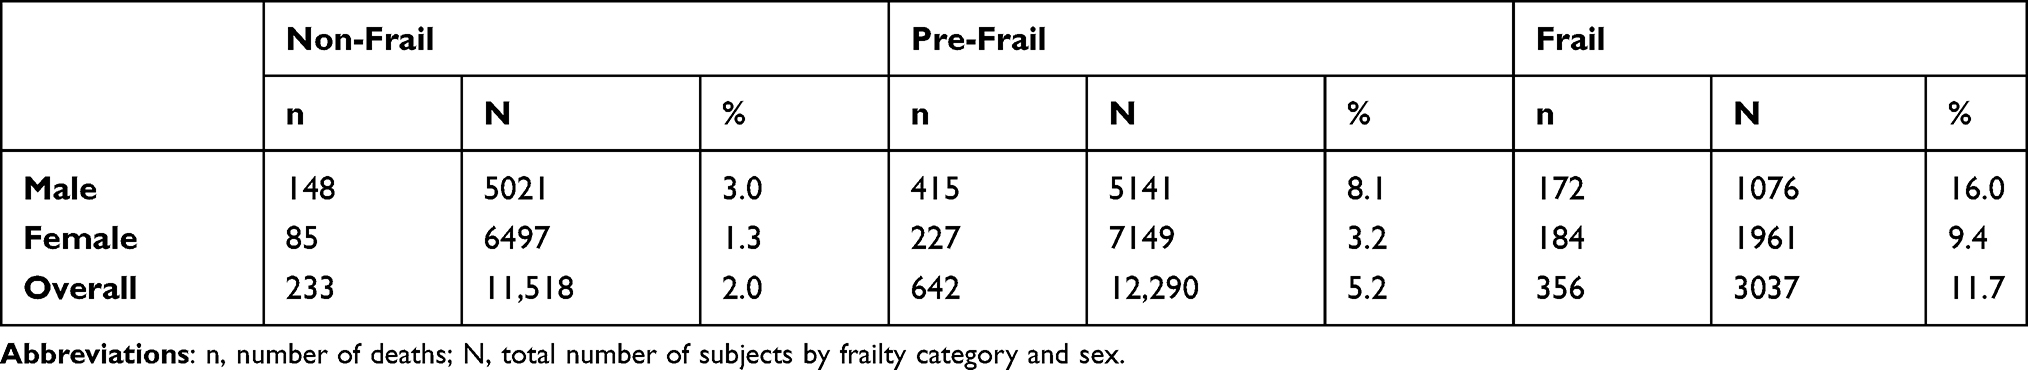 |
Table 1 Number of Deaths by Frailty Status and Sex |
In the univariate Cox regression analysis, sex, chronological age, and CT-FI were each significant predictors of survival. In the multivariable model, the FI hazard ratio remained significantly (p < 0.001) related to mortality even in the presence of chronological age and sex (Table 2).
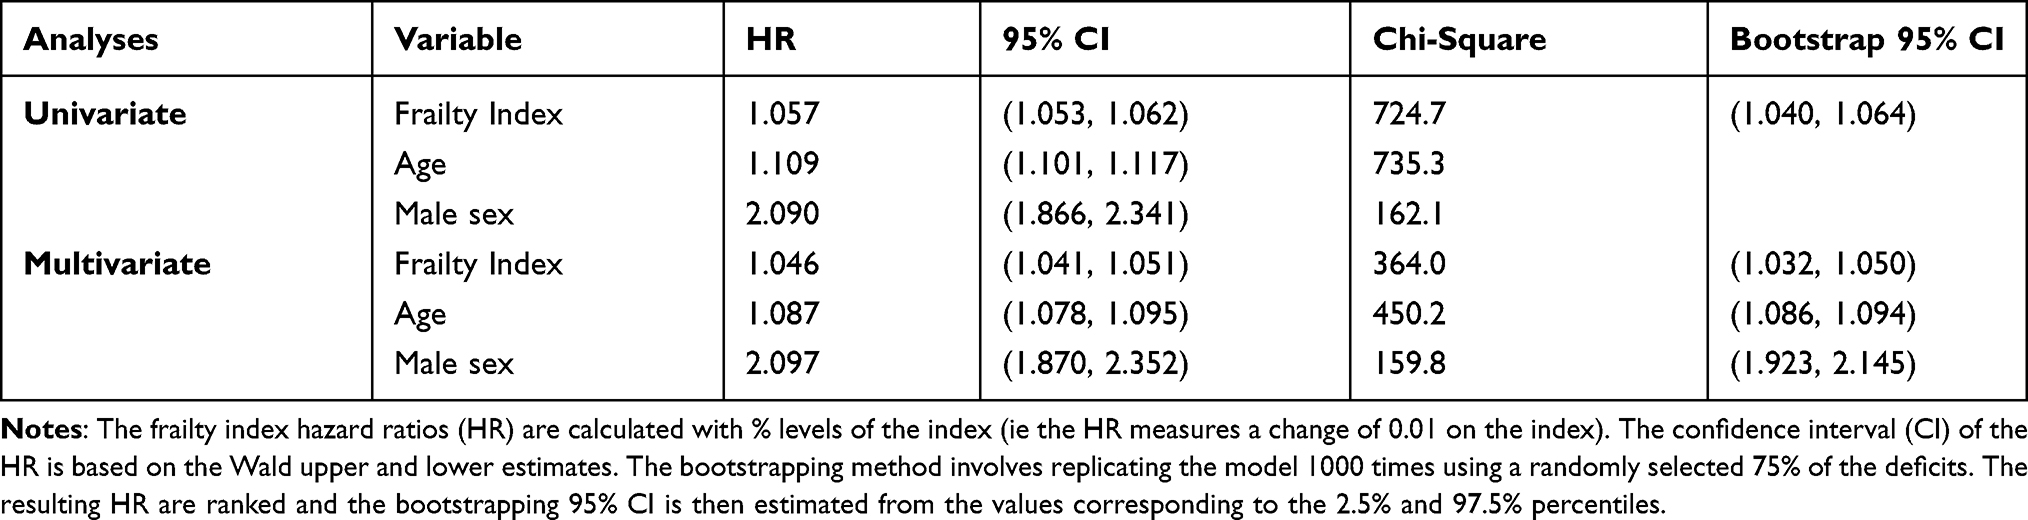 |
Table 2 Survival Analyses by Cox Regression |
Resampling Methods
In 1000 iterations of the Bootstrap analysis of the Cox proportional hazards univariate model, the CT-FI remained significantly related to mortality (HR 95% CI: 1.040, 1.064), demonstrating that the CT-FI was not sensitive to inclusion or exclusion of specific groups of items; ie, groups of items were not driving the observed association with outcomes (Table 2). Fifty Bootstrap replications (based on random re-selection of 30/41 CT-FI deficits) of the Kaplan–Meier estimates of the survivor function by frailty status are presented in Figure 3. The separation between frailty status categories remained clear for both males and females. The Jackknife analysis also showed consistent results in relation to survival. Across all 41 iterations of the univariate Cox model the FI hazard ratio ranged from 1.055 to 1.059, demonstrating that no single item was driving the observed association with outcomes (Table S5).
 |
Figure 3 Bootstrap analysis of survival by frailty status. Survival curves present 50 replications of 75% resampling. |
Internal Consistency
The three component categories of the CT-FI were moderately correlated with each other. The Spearman correlation between the medical history and the SF-36 and EQ-5D components were 0.32 and 0.22, respectively, while that between the SF-36 and EQ-5D components was 0.57. The overall Cronbach Coefficient Alpha was 0.65.
Known Groups Effects/Comparisons
The mean SF-36 and EQ-5D domain scores recorded at baseline are presented by frailty status in Table 3. All scores decreased consistently with increasing frailty. Of the domain scores that did not contribute to the construction of the CT-FI, the mean SF-36 bodily pain scores were 86.7 in non-frail participants, 72.3 in pre-frail participants and 49.9 in frail participants while the mean SF-36 role emotional scores were 94.5 in non-frail participants, 85.9 in pre-frail participants and 66.4 in frail participants.
 |
Table 3 Mean SF-36 and EQ-5D Domain Scores at Baseline by Frailty Status |
Discussion
Here and in our previous manuscript15 we describe, for the first time to our knowledge, the retrospective creation of a CT-FI from health status and patient reported outcome (PRO) data collected in a large vaccine clinical trial, and its subsequent validation. We have demonstrated that the CT-FI is readily implementable, valid and robust. Replicating known FI properties, the CT-FI increases with age, is higher in women than in men, and conforms to a gamma distribution with a consistent, sub-maximal upper limit to the proportion of deficits that any person can accumulate. The CT-FI is associated with mortality and is internally consistent. Furthermore, using resampling methods within the index, we have demonstrated that the properties and outcome associations of the CT-FI are not dependent on inclusion or exclusion of specific individual variables, in that these characteristics are robust to resampling or deletion of items within the index.
In the measurement of frailty, multidimensional interdisciplinary Comprehensive Geriatric Assessment (CGA) has been used extensively.29,30 However, this is a complex measure that may be impractical in some contexts due to the required time and expertise of the person performing the assessment (ideally a geriatrician). No consensus has been reached on which tools are most suitable for studies or settings where CGA is not feasible or would place a high burden on both health-care staff and participants. It is therefore important to select or develop validated frailty measures that can be implemented efficiently across different settings.
Several distinct methods of assessing frailty in clinical studies have been developed over recent years. Widely used examples include the Frailty Phenotype,10 judgement-based descriptive scales such as the Clinical Frailty Scale,11–13 and the FI based on accumulation of deficits.22,31,32 The Frailty Phenotype is based on a predefined set of five criteria exploring the presence/absence of general signs or symptoms (unintentional weight loss, self-reported exhaustion, slow walking speed, weak grip strength, and low physical activity). From these responses a subject is assigned to one of three frailty categories: frail, pre-frail, or non-frail.10 The Clinical Frailty Scale is based on a global judgment-based assessment of frailty, in which an individual is scored in one of nine categories from very fit to very severely frail or terminally ill.13 Both of these approaches require that specific data collection be undertaken up-front in a clinical trial setting, which may not always have been done (for retrospective analyses) or may not be seen as feasible (for prospective data collection).
Here, we have used the accumulation of deficits approach which has numerous advantages for clinical trial settings. It is a well validated approach, having been used in many international population and clinical datasets.26,33 It includes a wide range of medical conditions such as comorbidities, physical, and mental functioning. Its major distinctive trait is that instead of simply assigning a subject to one of a few categorical frailty states it provides a continuous distribution of frailty that allows a more accurate examination of the associations between frailty, ageing, other characteristics, and outcomes. Also, the deficit accumulation FI approach brings inherent flexibility, in that it can be generated using existing data as long as a sufficient number of deficits have been collected across different systems, which is often the case in clinical trials.21,34 Previous studies have demonstrated that a FI can be constructed using data from existing population and clinical databases, and in particular data that would be collected in routine health assessments of older adults.21 FI have also been generated and used in some cardiovascular and chronic disease clinical trials.35–38 We have extended this to generate and validate a CT-FI using information that is readily available in patient’s health history and PRO instruments that are typically recorded at screening or baseline visits of vaccine clinical trials, which differ from clinical trial of therapeutics in that the focus is on prevention in a cohort that generally does not share specific underlying comorbidity. As such, the FI approach to measuring frailty is eminently achievable to implement in clinical trials without increasing participant and operational burden.
Our CT-FI included 41 variables. In general, the more variables included in a FI, the more precise estimates become. The generally accepted minimum number of deficits is approximately 20, though stability and robust prediction of outcomes is generally best with ≥30 deficits.21,32 By including a large number of health deficits, the FI approach allows for integration of a large amount of data while reducing dimensionality.39 A common question is why the index is not weighted. There are multiple reasons for this. Not weighting enhances ease of calculation and generalizability across data sets. Validations in multiple settings and datasets have demonstrated that weighting is not required.21,40 This can also be understood through the approach of including many deficits across multiple systems, which allows for self-weighting (eg, a serious health condition will likely be associated with functional and symptom impact, hence garnering additional deficits, while a less serious health condition would not). Notably, although this CT-FI was derived from a shingles vaccine study, we did not include shingles-specific risk factors or family history items as these are not generally included in FI based on published criteria.21 It is important to emphasize that the aim of a CT-FI for use in vaccine trials is to develop a general measure of frailty, not a disease-specific measure of susceptibility.
The properties of the CT-FI are consistent with characteristics of FI that have been widely replicated and preserved across datasets. These include the gamma distribution, shift towards more symmetric distribution with increasing age, and the limit to frailty of approximately 0.7.25 Consistent with prior literature on sex differences, frailty was also higher in women than in men.27,28 Survival analyses demonstrated that likelihood of death was higher for frail males compared with frail females. This is consistent with other studies showing that while men accumulate fewer deficits than women, any given level of deficit accumulation is more lethal for men.21 Female sex, younger age and lower CT-FI were all significant predictive factors for survival. Frailty was significantly predictive of survival independent of age (p < 0.001), ie, reflecting a state of increased vulnerability to adverse health outcomes for individuals independent of chronological age.22
The CT-FI is not sensitive to the inclusion or exclusion of specific individual variables. This was demonstrated here by the use of the Bootstrap and Jackknife resampling methods. We observed that associations with mortality remained consistent despite these tests of variable composition, which is consistent with prior experience with these resampling techniques.22,23 In other words, FI need not include a standard checklist of items across studies. This is a powerful and convenient property of the deficit accumulation approach to frailty. As long as a sufficient number of deficits are considered across multiple systems, standard methodology and criteria allow creation of a FI in any dataset or clinical context.21 In the context of clinical trials, this allows a CT-FI to be constructed retrospectively, using data that are already being collected; this has benefits in that A) it allows retrospective (or prospective) analysis of an existing clinical trial population to determine the distribution of frailty represented among participants, B) participant burden is minimized by not requiring additional frailty-specific data collection, and C) clinician judgment is not required to assign participants to frailty categories.
Our study is not without limitations. As frailty was not a pre-specified measure in the initial ZOE studies, the CT-FI was constructed with the available data elements; though indeed the retrospective assessment of frailty is the point of the present exercise. Although we previously demonstrated that the ZOE trials recruited a range of participants from non-frail to frail, as with most clinical trials the frailest individuals would not have met inclusion criteria.15 Strengths include the large study population (>26,000 participants across a wide age range and from diverse international settings), robust data collection for health history, PROs and outcomes in the context of a vaccine clinical trial.
Conclusion
We demonstrate how the CT-FI approach could be useful in other vaccine clinical trials even if they did not plan to evaluate frailty in advance. To our knowledge, this is the first retrospective application of the FI to a large vaccine clinical trial. The potential widespread applicability of this approach is particularly relevant as vaccines targeting older adults are gaining increasing public health prominence and importance; this is the case, for example, with development and testing of COVID-19 vaccines where assessment of the impact of frailty on vaccine efficacy is critical.41,42
Frailty is increasingly recognized by the public, clinicians, decision-makers and regulators to have important impacts on the efficacy and safety of interventions such as vaccines and drugs. Therefore, it is important to be able to characterize frailty in study populations, either descriptively, or to allow a targeted recruitment of study participants across different levels of frailty. Frail individuals are often under-represented in clinical studies, and even when they have been included their degree of frailty remains unknown. Including frailty measures in clinical trials thus represents an important step forward in understanding how and whether interventions will benefit frail older adults. We have demonstrated that a robust and valid CT-FI can be generated retrospectively or prospectively using data already being collected in many vaccine clinical trials, so it does not add to participant burden or trial complexity.
Abbreviations
CGA, Comprehensive Geriatric Assessment; CI, confidence interval; CT-FI, Clinical Trial Frailty Index; EQ-5D, EuroQol-5 Dimension; FI, frailty index/indices; PRO, patient recorded outcome; QoL, quality of life; RCT, Randomized Clinical Trial; SAE, serious adverse event; SF-36, Short Form Survey-36.
Data Sharing Statement
Anonymized individual participant data and study documents can be requested for further research from www.clinicalstudydatarequest.com (study ID 204878). The study protocol, statistical analysis plan and results summary are posted on ClinicalTrials.gov (NCT03563183).
Acknowledgments
The authors thank the study participants, investigators, and study teams involved in the ZOE 50 and ZOE 70 trials. Authors thank the Modis platform for editorial assistance and manuscript coordination, on behalf of GSK. Timea Kiss provided designer support for the figures, Elise Verplancke and Sander Hulsmans coordinated the manuscript development.
Author Contributions
All authors made a significant contribution to the work reported, whether that is in the conception, study design, execution, acquisition of data, analysis and interpretation, or in all these areas; took part in drafting, revising or critically reviewing the article; gave final approval of the version to be published; have agreed on the journal to which the article has been submitted; and agree to be accountable for all aspects of the work.
Funding
This work was sponsored by GlaxoSmithKline Biologicals SA. GlaxoSmithKline Biologicals SA was involved in all stages of the study conduct and analysis, and took responsibility for all costs associated with the development and publishing of the present manuscript. GlaxoSmithKline Biologicals SA does not veto ongoing publications or control the decision about what journal to submit to, with ultimate decision on the target journal made by the coauthors. The lead and corresponding author MKA received no payment related to any aspect of this study.
Disclosure
An earlier version of the abstract of this paper was presented at ID Week 2021 as a poster presentation with interim findings. The poster’s abstract was published in “Poster Abstracts” in Open Forum Infectious Diseases: 8 (Supplement_1, November 2021), Page S133, https://doi.org/10.1093/ofid/ofab466.220; https://academic.oup.com/ofid/issue/8/Supplement_1?page=2#1310105-6449779.
MKA reports grant funding from the GSK group of companies for this study, grants from Sanofi, the GSK group of companies, Pfizer, Merck, the Canadian Frailty Network, Canadian Institutes of Health Research, Foundation for Influenza Epidemiology, and Public Health Agency of Canada, not related to the present study, and honoraria for advisory work from Sanofi, Seqirus, and Pfizer outside the submitted work. JHK, MER, and DC are employees of the GSK group of companies. JHK and DC own the GSK group of companies shares/stock options as part of their employee remuneration. SM works as a freelance consultant on behalf of the GSK group of companies. The authors declare no other non-financial relationships and activities or conflicts of interest in this work.
References
1. Clegg A, Young J, Iliffe S, Rikkert MO, Rockwood K. Frailty in elderly people. Lancet. 2013;381(9868):752–762. doi:10.1016/S0140-6736(12)62167-9
2. Walston J, Hadley EC, Ferrucci L, et al. Research agenda for frailty in older adults: toward a better understanding of physiology and etiology: summary from the American Geriatrics Society/National Institute on aging research conference on frailty in older adults. J Am Geriatr Soc. 2006;54(6):991–1001. doi:10.1111/j.1532-5415.2006.00745.x
3. Rockwood K. Medical management of frailty: confessions of a gnostic. CMAJ. 1997;157(8):1081–1084.
4. Andrew MK, McElhaney JE, McGeer AA, et al. Influenza surveillance case definitions miss a substantial proportion of older adults hospitalized with laboratory-confirmed influenza: a report from the Canadian Immunization Research Network (CIRN) Serious Outcomes Surveillance (SOS) network. Infect Control Hosp Epidemiol. 2020;41(5):499–504. doi:10.1017/ice.2020.22
5. Andrew MK, Shinde V, Ye L, et al. The Importance of frailty in the assessment of influenza vaccine effectiveness against influenza-related hospitalization in elderly people. J Infect Dis. 2017;216(4):405–414. doi:10.1093/infdis/jix282
6. Maltese G, Corsonello A, Di Rosa M, et al. Frailty and COVID-19: a systematic scoping review. J Clin Med. 2020;9(7):2106. doi:10.3390/jcm9072106
7. EMA. Reflection paper on frailty: instruments for baseline characterisation of clinical trial older populations. European Medicines Agency Committee for Medicinal Products for Human Use (CHMP);. 2018. Available from: https://www.ema.europa.eu/en/documents/scientific-guideline/reflection-paper-physical-frailty-instruments-baseline-characterisation-older-populations-clinical_en.pdf.
8. King SJ, Raine KA, Peel NM, Hubbard RE. Interventions for frail older inpatients: a systematic review of frailty measures and reported outcomes in randomised controlled trials. Australas J Ageing. 2021;40(2):129–144. doi:10.1111/ajag.12951
9. Theou O, Brothers TD, Mitnitski A, Rockwood K. Operationalization of frailty using eight commonly used scales and comparison of their ability to predict all-cause mortality. J Am Geriatr Soc. 2013;61(9):1537–1551. doi:10.1111/jgs.12420
10. Fried LP, Tangen CM, Walston J, et al. Frailty in older adults: evidence for a phenotype. J Gerontol a Biol Sci Med Sci. 2001;56(3):M146–156. doi:10.1093/gerona/56.3.M146
11. Rockwood K, Song X, MacKnight C, et al. A global clinical measure of fitness and frailty in elderly people. CMAJ. 2005;173(5):489–495. doi:10.1503/cmaj.050051
12. Church S, Rogers E, Rockwood K, Theou O. A scoping review of the clinical frailty scale. BMC Geriatr. 2020;20(1):393. doi:10.1186/s12877-020-01801-7
13. Rockwood K, Theou O. Using the clinical frailty scale in allocating scarce health care resources. Can Geriatr J. 2020;23(3):210–215. doi:10.5770/cgj.23.463
14. Curran D, Andrew MK, Levin MJ, et al. Evaluation of two frailty indices, with practical application in a vaccine clinical trial. Hum Vaccin Immunother. 2019;15(12):2960–2968. doi:10.1080/21645515.2019.1622974
15. Curran D, Kim JH, Matthews S, et al. Recombinant zoster vaccine is efficacious and safe in frail individuals. J Am Geriatr Soc. 2021;69(3):744–752. doi:10.1111/jgs.16917
16. Cunningham AL, Lal H, Kovac M, et al. Efficacy of the herpes zoster subunit vaccine in adults 70 years of age or older. N Engl J Med. 2016;375(11):1019–1032. doi:10.1056/NEJMoa1603800
17. Lal H, Cunningham AL, Godeaux O, et al. Efficacy of an adjuvanted herpes zoster subunit vaccine in older adults. N Engl J Med. 2015;372(22):2087–2096. doi:10.1056/NEJMoa1501184
18. Ware JE. SF-36 Health Survey: Manual and Interpretation Guide. Boston: The Health Institute; 1993.
19. Rabin R, De Charro F. EQ-5D: a measure of health status from the EuroQol Group. Ann Med. 2001;33(5):337–343. doi:10.3109/07853890109002087
20. Song X, Mitnitski A, Rockwood K. Prevalence and 10-year outcomes of frailty in older adults in relation to deficit accumulation. J Am Geriatr Soc. 2010;58(4):681–687. doi:10.1111/j.1532-5415.2010.02764.x
21. Searle SD, Mitnitski A, Gahbauer EA, Gill TM, Rockwood K. A standard procedure for creating a frailty index. BMC Geriatr. 2008;8:24. doi:10.1186/1471-2318-8-24
22. Mitnitski AB, Mogilner AJ, Rockwood K. Accumulation of deficits as a proxy measure of aging. Sci World J. 2001;1:323–336. doi:10.1100/tsw.2001.58
23. Andrew MK, Mitnitski A, Rockwood K. Social vulnerability, frailty, and mortality in elderly people. PLoS One. 2008;3(5):e2232. doi:10.1371/journal.pone.0002232
24. Theou O, Brothers TD, Pena FG, Mitnitski A, Rockwood K. Identifying common characteristics of frailty across seven scales. J Am Geriatr Soc. 2014;62(5):901–906. doi:10.1111/jgs.12773
25. Rockwood K, Mitnitski A. Limits to deficit accumulation in elderly people. Mech Ageing Dev. 2006;127(5):494–496. doi:10.1016/j.mad.2006.01.002
26. Mitnitski A, Song X, Skoog I, et al. Relative fitness and frailty of elderly men and women in developed countries, in relation to mortality. JAGS. 2005;53(12):2184–2189. doi:10.1111/j.1532-5415.2005.00506.x
27. Hubbard RE. Sex differences in frailty. Interdiscip Top Gerontol Geriatr. 2015;41:41–53.
28. Gordon EH, Hubbard RE. Differences in frailty in older men and women. Med J Aust. 2020;212(4):183–188. doi:10.5694/mja2.50466
29. Ellis G, Gardner M, Tsiachristas A, et al. Comprehensive geriatric assessment for older adults admitted to hospital. Cochrane Database Syst Rev. 2017;9:CD006211. doi:10.1002/14651858.CD006211.pub3
30. Stuck AE, Siu AL, Wieland GD, Adams J, Rubenstein LZ. Comprehensive geriatric assessment: a meta-analysis of controlled trials. Lancet. 1993;342(8878):1032–1036. doi:10.1016/0140-6736(93)92884-V
31. Mitnitski AB, Song X, Rockwood K. The estimation of relative fitness and frailty in community-dwelling older adults using self-report data. J Gerontol. 2004;59(6):M627–632. doi:10.1093/gerona/59.6.M627
32. Rockwood K, Mitnitski A. How might deficit accumulation give rise to frailty? J Frailty Aging. 2012;1(1):8–12. doi:10.14283/jfa.2012.2
33. Navarrete-Villanueva D, Gomez-Cabello A, Marin-Puyalto J, Moreno LA, Vicente-Rodriguez G, Casajus JA. Frailty and physical fitness in elderly people: a systematic review and meta-analysis. Sports Med. 2021;51(1):143–160. doi:10.1007/s40279-020-01361-1
34. Looman WM, Fabbricotti IN, Blom JW, et al. The frail older person does not exist: development of frailty profiles with latent class analysis. BMC Geriatr. 2018;18(1):84. doi:10.1186/s12877-018-0776-5
35. Wilkinson C, Wu J, Searle SD, et al. Clinical outcomes in patients with atrial fibrillation and frailty: insights from the ENGAGE AF-TIMI 48 trial. BMC Med. 2020;18(1):401. doi:10.1186/s12916-020-01870-w
36. Dewan P, Jackson A, Jhund PS, et al. The prevalence and importance of frailty in heart failure with reduced ejection fraction - an analysis of PARADIGM-HF and ATMOSPHERE. Eur J Heart Fail. 2020;22(11):2123–2133. doi:10.1002/ejhf.1832
37. Farooqi MAM, Gerstein H, Yusuf S, Leong DP. Accumulation of deficits as a key risk factor for cardiovascular morbidity and mortality: a pooled analysis of 154 000 individuals. J Am Heart Assoc. 2020;9(3):e014686. doi:10.1161/JAHA.119.014686
38. Hanlon P, Butterly E, Lewsey J, Siebert S, Mair FS, McAllister DA. Identifying frailty in trials: an analysis of individual participant data from trials of novel pharmacological interventions. BMC Med. 2020;18(1):309. doi:10.1186/s12916-020-01752-1
39. Rockwood K, Mitnitski A. Frailty in relation to the accumulation of deficits. J Gerontol. 2007;62(7):722–727.
40. Mitnitski A, Song X, Skoog I, et al. Relative fitness and frailty of elderly men and women in developed countries and their relationship with mortality. J Am Geriatr Soc. 2005;53(12):2184–2189.
41. Salmeron Rios S, Mas Romero M, Cortes Zamora EB, et al. Immunogenicity of the BNT162b2 vaccine in frail or disabled nursing home residents: COVID-A study. J Am Geriatr Soc. 2021;69(6):1441–1447. doi:10.1111/jgs.17153
42. Andrew MK, McElhaney JE. Age and frailty in COVID-19 vaccine development. Lancet. 2021;396(10267):1942–1944. doi:10.1016/S0140-6736(20)32481-8
 © 2022 The Author(s). This work is published and licensed by Dove Medical Press Limited. The
full terms of this license are available at https://www.dovepress.com/terms
and incorporate the Creative Commons Attribution
- Non Commercial (unported, 3.0) License.
By accessing the work you hereby accept the Terms. Non-commercial uses of the work are permitted
without any further permission from Dove Medical Press Limited, provided the work is properly
attributed. For permission for commercial use of this work, please see paragraphs 4.2 and 5 of our Terms.
© 2022 The Author(s). This work is published and licensed by Dove Medical Press Limited. The
full terms of this license are available at https://www.dovepress.com/terms
and incorporate the Creative Commons Attribution
- Non Commercial (unported, 3.0) License.
By accessing the work you hereby accept the Terms. Non-commercial uses of the work are permitted
without any further permission from Dove Medical Press Limited, provided the work is properly
attributed. For permission for commercial use of this work, please see paragraphs 4.2 and 5 of our Terms.
Recommended articles
Combined Vision and Hearing Impairment is Associated with Frailty in Older Adults: Results from the West China Health and Aging Trend Study
Zhao Y, Ding Q, Lin T, Shu X, Xie D, Gao L, Yue J
Clinical Interventions in Aging 2022, 17:675-683
Published Date: 2 May 2022
Experiences of Being Significant Others to Older Adults with Frailty Living Alone in Rural Arctic Norway: A Qualitative Study
Bjerkmo L, Helgesen AK, Blix BH
Risk Management and Healthcare Policy 2022, 15:1283-1292
Published Date: 1 July 2022
Intrinsic Capacity Declines with Elevated Homocysteine in Community-Dwelling Chinese Older Adults
Lin S, Wang F, Zheng J, Yuan Y, Huang F, Zhu P
Clinical Interventions in Aging 2022, 17:1057-1068
Published Date: 7 July 2022
Coexisting Frailty and Cognitive Impairment as a Predictor of Adverse Outcomes in Older Inpatients After Discharge: Results from a One-Year Follow-Up Study
Zeng XK, Shen SS, Guan HL, Chen LY, Chen XJ
Clinical Interventions in Aging 2022, 17:1697-1706
Published Date: 29 November 2022
Recognition and Management of Hospital-Acquired Sepsis Among Older General Medical Inpatients: A Multi-Site Retrospective Study
Barker N, Scott IA, Seaton R, Mehta N, Kalke VR, Redpath L
International Journal of General Medicine 2023, 16:1039-1046
Published Date: 21 March 2023