")
Back to Journals » Cancer Management and Research » Volume 14
A Predictive Model for Qualitative Evaluation of PG-SGA in Tumor Patients Through Machine Learning
Authors Liu X, Li Y, Ji W, Zheng K , Lu J, Zhao Y, Zhang W, Liu M, Cui J, Li W
Received 8 October 2021
Accepted for publication 31 March 2022
Published 12 April 2022 Volume 2022:14 Pages 1431—1441
DOI https://doi.org/10.2147/CMAR.S342658
Checked for plagiarism Yes
Review by Single anonymous peer review
Peer reviewer comments 3
Editor who approved publication: Professor Yong Teng
Xiangliang Liu,1,* Yuguang Li,2,* Wei Ji,1,* Kaiwen Zheng,1 Jin Lu,1 Yixin Zhao,1 Wenxin Zhang,3 Mingyang Liu,2 Jiuwei Cui,1 Wei Li1
1Cancer Center, The First Hospital of Jilin University, Changchun, Jilin, People’s Republic of China; 2College of Instrumentation and Electrical Engineering, Jilin University, Changchun, Jilin, People’s Republic of China; 3Department of Cancer Radiotherapy and Chemotherapy, Zhongnan Hospital of Wuhan University, Wuhan, People’s Republic of China
*These authors contributed equally to this work
Correspondence: Mingyang Liu, College of Instrumentation and Electrical Engineering, Jilin University, Ximinzhu St No. 938, Changchun, Jilin, People’s Republic of China, Tel +8615504318027, Email [email protected] Wei Li, Cancer center, The First Hospital of Jilin University, Xinmin St No. 1, Changchun, Jilin, People’s Republic of China, Tel +8613206282295, Fax +86 431-85619254, Email [email protected]
Objective: Patient-Generated Subjective Global Assessment (PG-SGA) was a nutritional status assessment technique specifically tailored for patients with oncology. The goal of this study was to develop a machine learning (ML) prediction model for predicting PG-SGA categorization of patients with tumor.
Methods: From 2014 to 2020, patients at the First Hospital of Jilin University performed laboratory testing, bioelectrical impedance, physical measures, and the PG-SGA scale. A total of 8230 patients were involved in the study. Patients with missing or partial data were removed, leaving 7287 patients, of which 3743 were males and 3544 were females. ML was used to design a clinical prediction model for PG-SGA categories.
Results: Through the least absolute shrinkage and selection operator (LASSO) and the correlation matrix, 135 variables were screened and 6 variables were retained; ML was performed among the remaining variables. The accuracy of neural network prediction models was 70.3% and 70.4% for males and females in the training cohort, respectively, and 74.4% and 73.2% for males and females in the validation cohort, respectively. The area under curve (AUC) of males was 0.87 for PG-SGA scores “ 0– 3”, 0.70 for PG-SGA scores “ 4– 8” and 0.74 for PG-SGA scores “> 8”. As for females, the AUC was 0.85 for PG-SGA scores “ 0– 3”, 0.65 for PG-SGA scores “ 4– 8” and 0.76 for PG-SGA scores “> 8”. The results of confusion matrix showed that the models were of good predictive validity. The prediction model was nearly 90% accurate for predictions that do not require nutritional support.
Conclusion: We demonstrated that neural network learning is the best clinical prediction model using ML. The model can work as a prediction for the PG-SGA classification of patients with cancer and can be promoted further in the clinic.
Keywords: nutritional assessment, machine learning, PG-SGA
Currently, Patient-Generated Subjective Global Assessment (PG-SGA) is a useful approach for the nutritional assessment of patients with cancer, and it has been universally endorsed by numerous organizations, including the American Society for Parenteral and Enteral Nutrition (ASPEN) and the Chinese Medical Association for Parenteral and Enteral Nutrition (CSPEN).1 However, PG-SGA is characterized by a difficult operation, a lengthy training period for operators, and some subjectivity in actual clinical application, thus it is essential to develop an efficient clinical prediction model to predict PG-SGA categorization, which can be better promoted in the clinic. The collection and analysis of large amounts of data may be an effective approach to develop a clinical model. In the last decades, machine learning (ML) has become a popular method for predicting clinical outcomes and patient health indicators.2 Deep learning has recently emerged as a proficient approach for analyzing enormous amounts of complicated data that standard statistical methods cannot manage. In previous research, deep learning has shown certain effectiveness in improving the prognosis of patients with cancer, including progression free survival (PFS) and overall survival (OS).2–4 However, no viable clinical prediction model has been developed to give an accurate clinical prediction for PG-SGA qualitative diagnosis. In this study, we included 8230 patients with a tumor at the First Hospital of Jilin University from 2014 to 2020, and we attempted to build an accurate and sensitive prediction model incorporating common nutritional indicators of patients. We used ML methods to build reasonable prediction models and compared the optimal machine learning methods, including neural network, support vector machines (SVM), decision tree, k-nearest neighbors (KNN), etc. Finally, we relied on a large amount of data to form a rapid qualitative diagnosis of PG-SGA in patients with a tumor.
Methods
Participants
Original data were obtained from patients, who had completed laboratory tests, bioelectrical impedance, physical measurements, and the PG-SGA scale evaluations from 2014 to 2020 at the First Hospital of Jilin University. A total of 8230 participants were enrolled in this study. The inclusion criteria were as follows: (1) age >18 years; (2) patients with pathologically confirmed malignancy; (3) received laboratory tests, bioelectrical impedance, physical measurements, and PG-SGA scale after admission. The exclusion criteria: (1) failure to complete relevant examinations or missing relevant examinations; (2) merged with 2 or more than 2 types of tumors. Finally, the study included 7287 patients (3743 males and 3544 females). This study was approved by the Ethics Committee of the First Hospital of Jilin University, No. 2017–362.
Variable Selection
The physiological conditions of men and women were found to be different. Therefore, we trained men and women separately in this study and applied the least absolute shrinkage and selection operator (LASSO) method to complete the screening of 135 features, after which we used the correlation matrix method to screen the values obtained from the LASSO. LASSO was performed with a penalty factor at 10. We then added a question—weight loss in 1 month—based on our clinical experiences, in which the question was answered by using categorical variables. Finally, the features to build the PG-SGA classification model were obtained.
Training Cohort and Validation Cohort
In this study, we applied several ML-based approaches, including neural network, to analyze the data. In the first step of model processing, the male and female data were categorized according to the training cohort (70% of participants) and the validation cohort (30% of participants), respectively. We took the training cohort to construct the ML-based PG-SGA classification models for male and female, respectively. Participants in the validation cohort were employed to verify the fitting ability of the models. To improve the fitting ability of the ML model, the training data was preprocessed by subtracting the mean from the data and dividing it by the variance (Equation (1)).

In Equation (1), x in the numerator represents the original data, μ is the mean value, σ in the denominator is the data standard deviation, and x to the left of the equal sign represents the standardized data.
Model Construction
Herein, we adopt a three-layer neural network structure with excellent fitting ability, including an input layer, hidden layer, and output layer. The combination of Kaiming weight initialization and the activation function Relu makes the fitting ability of the neural network stronger. Therefore, Kaiming weight initialization and activation function Relu were used. When training a neural network model, Adam’s optimization algorithm is applied. The Adam optimization algorithm has a learning rate of 0.1–0.001 and a regularized weight parameter of 0.1–0.001. Finally, the cross-entropy loss function and the backpropagation algorithm were used to train the parameters. This training process has been formulated in Equation (2).

In Equation (2), X represents the input data, σ represents the activation function, ω is the matrix of weight parameters, b is the bias-to-vector, and Y represents the output of the PG-SGA category.
Model Validation
To demonstrate the model performance, we compared the predicted PG-SGA categories with the real PG-SGA categories assessed with the clinical data. The features of the validation cohort were input to the neural network to obtain three probabilities of PG-SGA: low, medium, and high. The three probabilities were compared, and the category with the highest probability was considered as the predicted category. The number of correctly predicted categories was divided by the number of validation cohort labels to obtain an accuracy rate to measure the model fitting ability. Receiver operating characteristic curve (ROC) and confusion matrix were also conducted to analyze the predictive accuracy of models.
Statistical Analysis
SPSS 26.0 statistical software and PyTorch (version 1.61) were used for data analysis. The Student’s t-test was used to compare participants’ characteristics between 2 study cohorts with different continuous variables, and the Wilcoxon rank-sum test was applied when the variables did not satisfy the conditions for the test. The χ2 test was used to analyze the categorical variables. All statistical tests were two-sided, and P < 0.05 indicated statistical significance.
Results
Participant Characteristics
There were 8230 entries in the database, of which 7287 were qualified. The average age of enrolled participants was around 50 (±) years. Females constituted 48.54% of the population. 44.18% of patients had a PG-SGA score of 0–3. Scores of 4–8 and >8 represented 34.65% and 21.17% of the participants, respectively (see Table 1 for details).
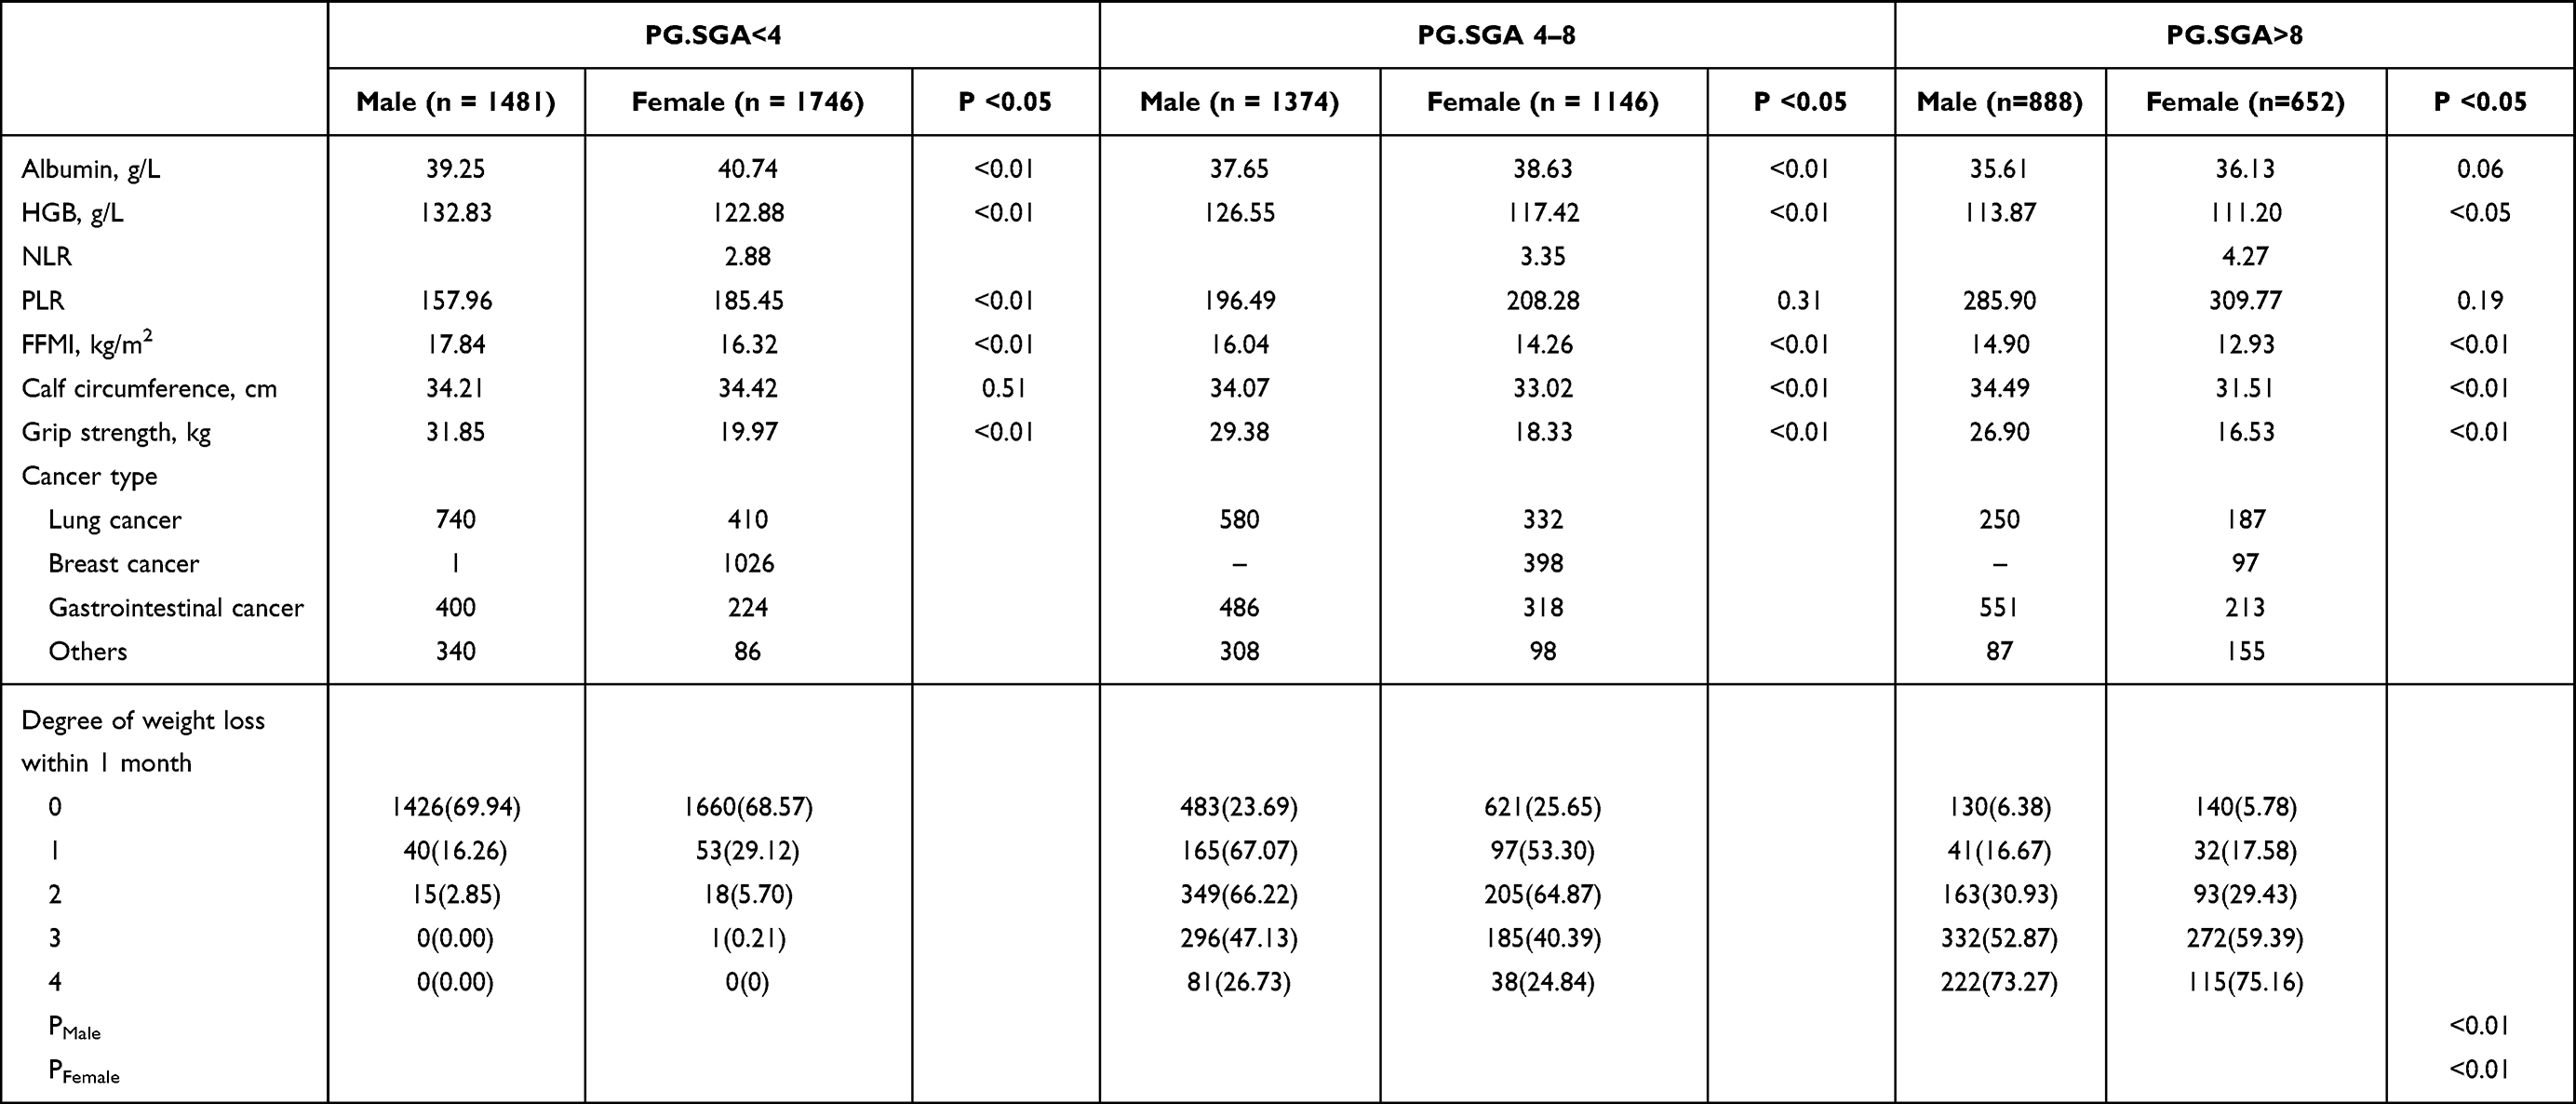 |
Table 1 Demographic and Nutritional Characteristics of Patients |
Variable Selection
First, the LASSO technique was used to screen 135 features for males and females respectively. A total of 7 characteristics were confirmed through LASSO: albumin, fat free mass index (FFMI), hemoglobin (HGB), platelet-to-lymphocyte ratio (PLR), neutrophil-to-lymphocyte ratio (NLR), grip strength and calf circumference. 6 features were yielded for males (albumin, FFMI, HGB, PLR, grip strength, calf circumference) and 6 features for females (albumin, FFMI, HGB, NLR, PLR, calf circumference). Following that, the correlation matrix was built by utilizing these 6 characteristics with PG-SGA according to gender (see Figure 1). We also drew violin plots of these nutritional indicators of participants to show the distribution of each indicator in both genders at baseline (see Figure 2). In addition, generalized additive models for each nutritional indicator with PG-SGA scores were also analyzed (see Figure 3). Finally, 4 characteristics, albumin, FFMI, PLR and HGB were confirmed variables, chosen based on the correlation values of the male and female, along with weight loss within 1 month as a categorical variable based on clinical experience (see Appendix Table 1 for details of degree of weight loss).
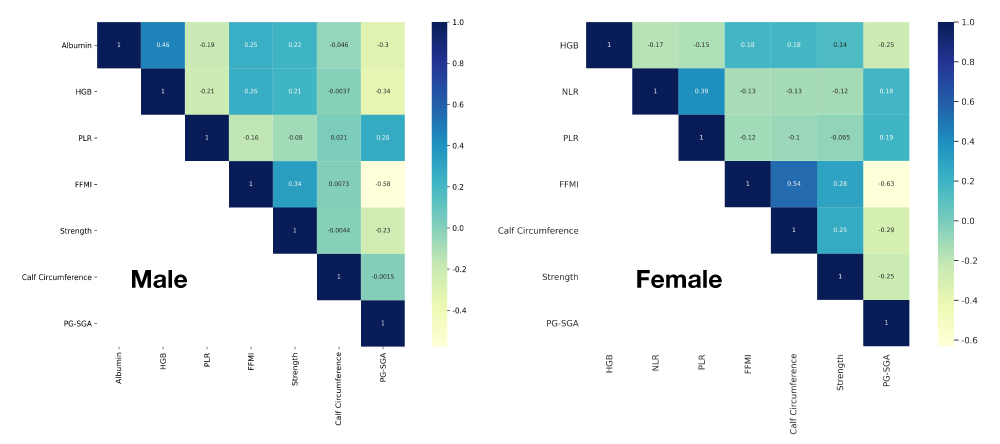 |
Figure 1 Correlation matrix for male and female patients. Abbreviations: HGB, hemoglobin; PLR, platelet-to-lymphocyte ratio; FFMI, fat free mass index; NLR, neutrophil-to-lymphocyte ratio; Strength, grip strength; PG-SGA, patient-generated subjective global assessment. |
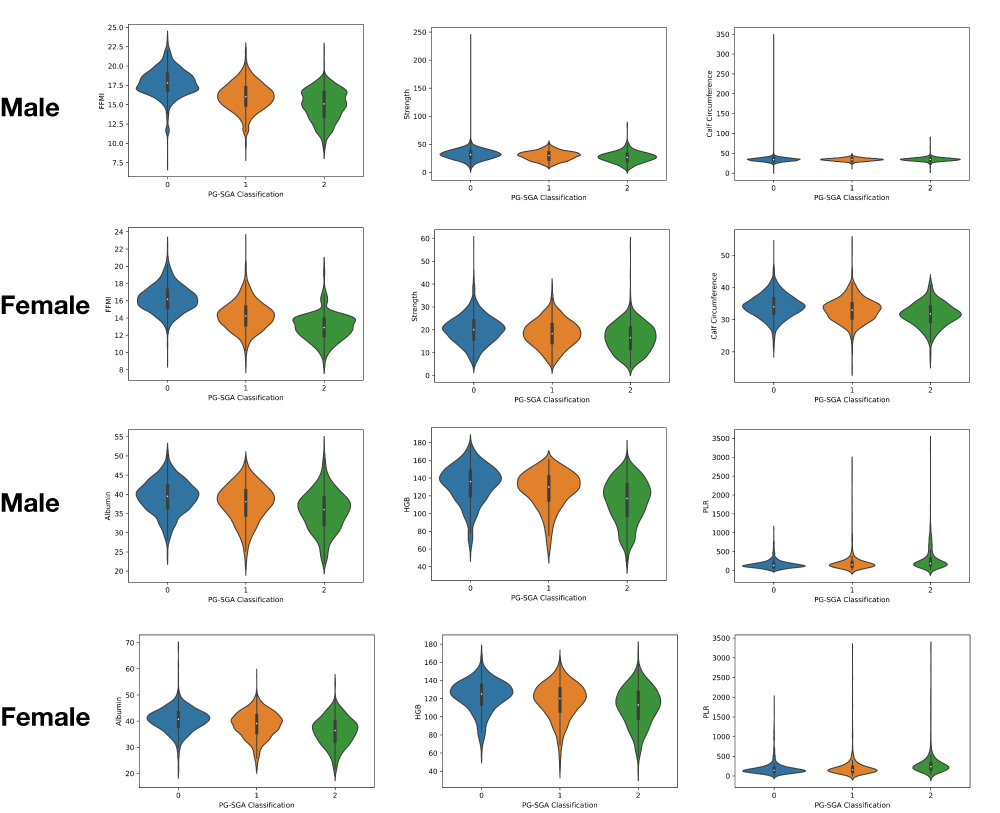 |
Figure 2 Violin plot of nutritional indicators in different nutritional states. Abbreviations: HGB, hemoglobin; PLR, platelet-to-lymphocyte ratio; FFMI, fat free mass index; Strength, grip strength; PG-SGA, patient-generated subjective global assessment. |
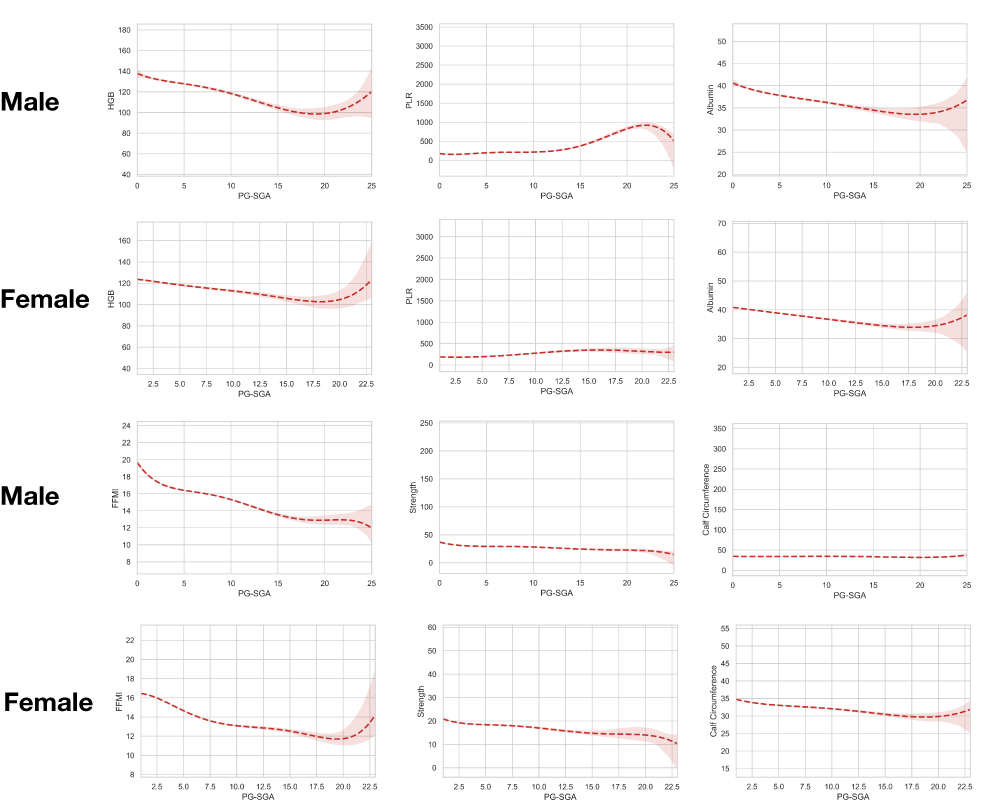 |
Figure 3 Generalized additive model plots of PG-SGA scores with each nutritional index. Abbreviations: HGB, hemoglobin; PLR, platelet-to-lymphocyte ratio; FFMI, fat free mass index; Strength, grip strength; PG-SGA, patient-generated subjective global assessment. Notes: Red dotted lines indicated the fitted smoothing curve of the variables, and the red area indicated the 95% confidence interval of curves. |
Model Construction
We set the neural network’s learning rate at 0.01, the regularization weight at 0.001, and the number of iterations at 1000. The input layer is made up of 5 neurons, and the 5 neurons in the input layer represent 5 filtered characteristics. The hidden layer is made up of 16 neurons, and the output layer is made up of 3 neurons, which represent the 3 PG-SGA categories (Figure 4 shows a snapshot of the neural network).
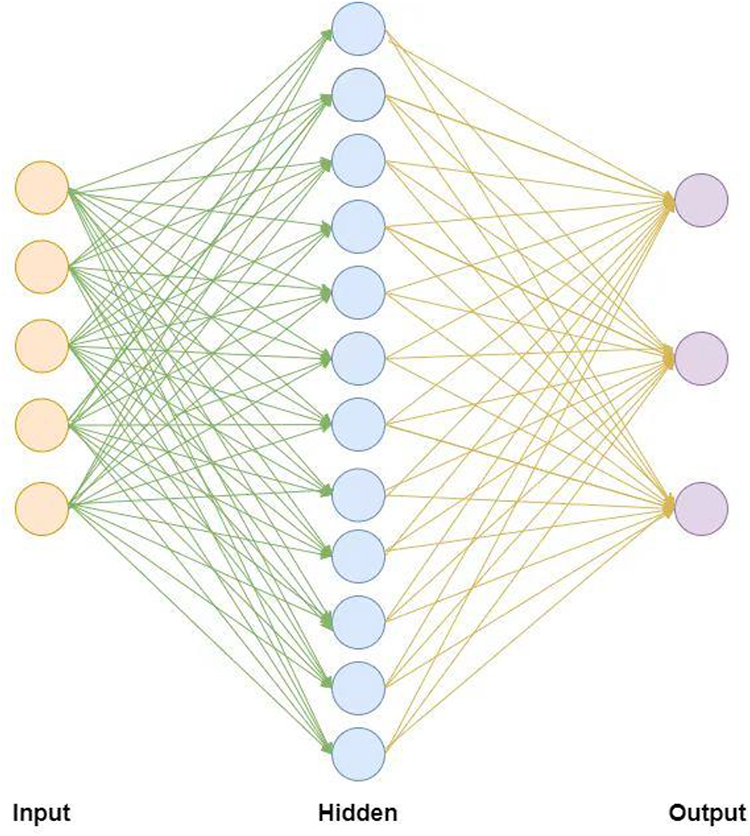 |
Figure 4 Structure of the neural network model in this study. Notes: From left to right are; the input layer, hidden layer, and output layer. The input layer consists of 5 nodes, the hidden layer consists of 12 nodes, and the output layer consists of 3 nodes. The five features of the input layer are: (albumin), (non-fat mass index), (PLR), (HGB), (weight loss in 1 month), and the three nodes of the output layer are PG-SGA high, PG-SGA medium, and PG-SGA low. |
We also compared several approaches in the ML field, including neural network, KNN, decision tree, random forest, extreme gradient boosting (XGBoost), etc., from which we could confirm the neural network was the best approach for model construction (see Appendix Table 2 for details).
Model Validation
The male and female neural network models are iterated for 1000 times, and the ideal male and female models were selected. The predictive values for PG-SGA categories are shown in Table 2. The ideal model’s overall accuracy for male was 70.3%. The model was stronger in predicting PG-SGA scores “0–3” with an accuracy of 87.9% and weaker in predicting scores “4–8” and “>8” with an accuracy of 62.4% and 53.3%, respectively. The overall accuracy of the ideal model for female was 74.4%, which was higher for PG-SGA scores “0–3” with 92.1% and lower for scores “4–8” and “>8” with 50.4% and 68.4%, respectively. The ROC showed area under curve (AUC) of male was 0.87 for PG-SGA scores “0–3”, 0.70 for PG-SGA scores “4–8” and 0.74 for PG-SGA scores “>8”. As for female, the AUC was 0.85 for PG-SGA scores “0–3”, 0.65 for PG-SGA scores “4–8” and 0.76 for PG-SGA scores “>8” (see Figure 5 for details). The results of the confusion matrix are shown in Figure 6, from which we could tell the models were of good predictive validity.
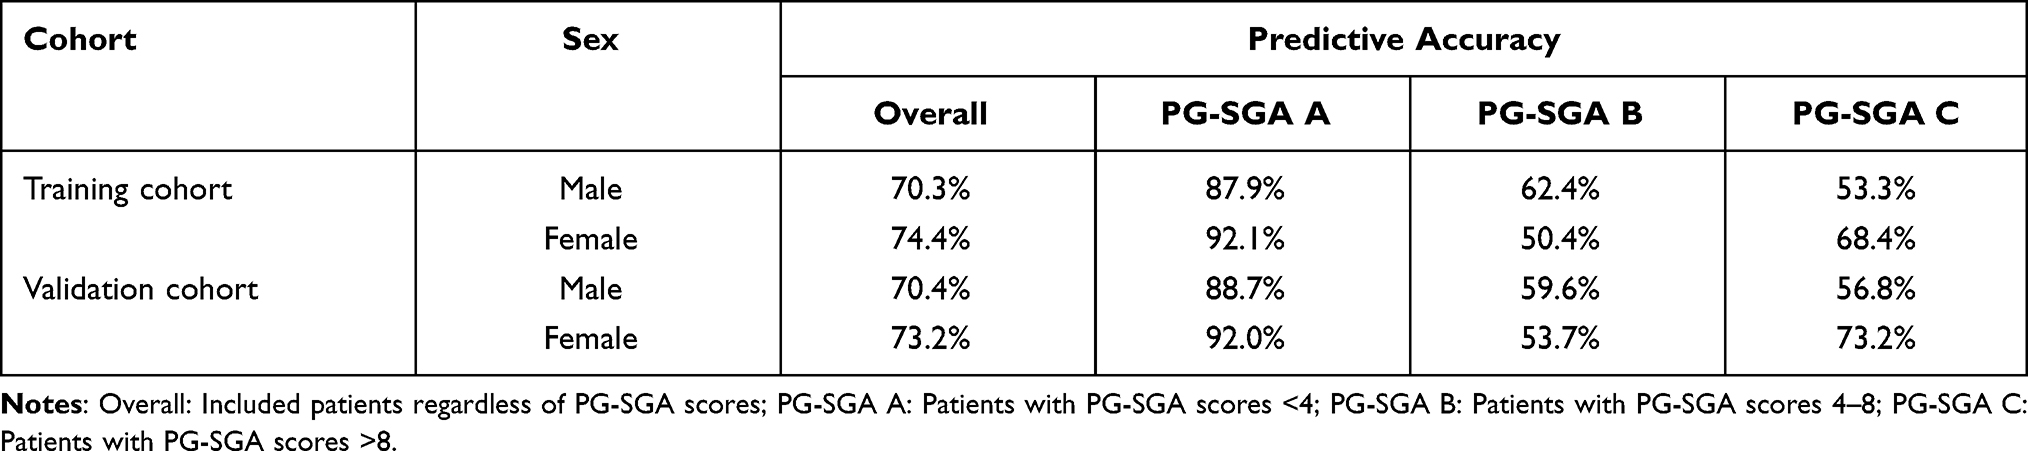 |
Table 2 Predictive Values of the Ideal Models for PG-SGA Categories in Different Sex |
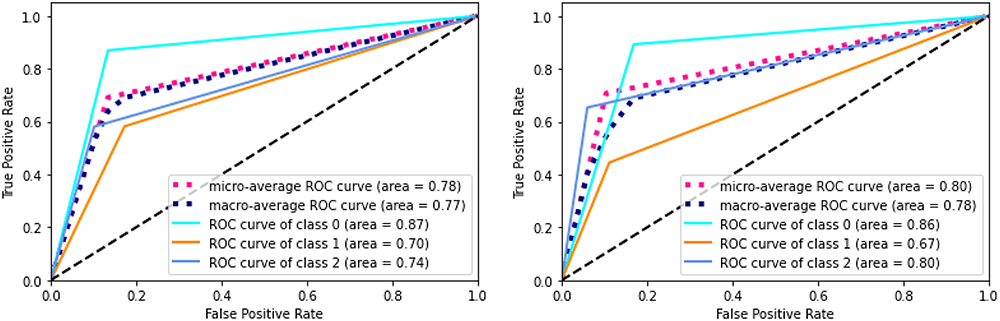 |
Figure 5 The ROC curves of constructed models in male and female. Notes: PG-SGA, patient-generated subjective global assessment. Class 0= PG-SGA scores “<4”; Class 1= PG-SGA scores “4–8”; Class 2= PG-SGA scores “>8”. |
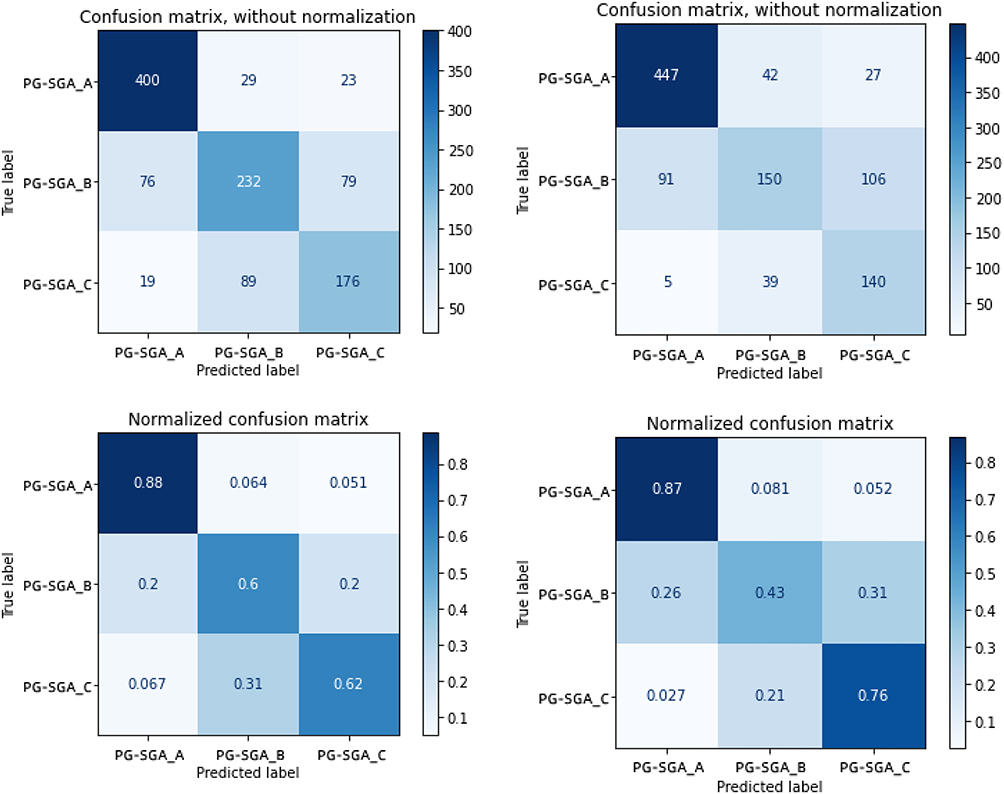 |
Figure 6 The confusion matrix of constructed models in male and female. Notes: PG-SGA, patient-generated subjective global assessment. PG-SGA A= PG-SGA scores “<4”; PG-SGA B= PG-SGA scores “4–8”; PG-SGA C= PG-SGA scores “>8”. |
In the validation cohort, The model’s overall accuracy for males was 70.4%. The model is stronger in predicting PG-SGA scores “0–3” with an accuracy of 88.7% and weaker in predicting scores “4–8” and “>8” with an accuracy of 59.6% and 56.8%, respectively. The overall accuracy of the ideal model for female was 73.2%, which was higher for PG-SGA scores “0–3” with an accuracy of 92.0% and lower for scores “4–8” and “>8” with 53.7% and 73.2%, respectively (see Table 2 for details).
The ML-based PG-SGA classification model has a predictive accuracy of nearly 90% for patients without malnutrition (PG-SGA scores >4), while allowing for the grouping of malnourished patients, and can be used as a rapid screening and nutritional assessment tool in the clinic.
Discussion
Serological nutritional markers, body composition analysis, and physical measurements may all be used to assess patients’ nutritional status, and PG-SGA is still the recommended nutritional evaluation and diagnostic tool for patients with cancer. However, given that this approach is very subjective, we used objective examination findings to build the models. The LASSO regression can assist us in identifying the variables worth investigating from a huge quantity of data.5 In this study, we explored different characteristics that may be excellent predictors for malnutrition, and we used LASSO regression to filter over 135 variables. This section of the data was then subjected to a correlation matrix analysis. Our data-driven approach can be a significant supplement for clinicians when evaluating malnutrition in patients with cancer, and it can be a useful supplemental tool for hospitals that do not conduct PG-SGA assessments or do not have enough personnel due to data training.
In our correlation matrix, nutritional status was linked with albumin, FFMI, PLR, NLR, HGB, calf circumference, and grip strength. While grip strength did not become a significant predictor in women, mainly because the grip strength of females was generally low, making it hard to become a significant indicator. We produced violin plots for men and women with several nutritional parameters based on real PG-SGA classification (Figure 2). The figures showed that for patients with severe malnutrition (PG-SGA scores >8), all nutritional markers were low while inflammatory indicators were high compared with other nutritional statuses. However, the indices for patients with mild/moderate malnutrition (PG-SGA scores 4–8) are poorly defined, which might be owing to the overlap with both the lower and higher scoring subgroups. We also displayed the curves with PG-SGA using the generalized additive model for a single variable (Figure 3). The curves showed that there was a more pronounced decrease in nutritional indicators with increasing PG-SGA scores. As can be seen form the curves, the process of change was not linear, and the degree of dispersion increased gradually with the development of malnutrition, thus the classical prior model (PG-SGA scores) does not fit the occurrence of malnutrition perfectly.
We did not incorporate all of the screening elements in the model for the sake of simplicity and utility. In addition, since men and women have vastly different body compositions and nutritional statuses, our model was built individually for each gender. Finally, we picked the most common used laboratory tests performed on patients, HGB and PLR in blood routine, as well as the traditional nutritional marker albumin.6 Although CRP was closely related to nutritional status, we did not include it in the modeling for two reasons: First, PLR can also reflect the inflammatory status and correlates well with CRP, which means it is a suitable substitute of CRP;7 on the other hand, including CRP may result in a reduction in the number of included patients, which was not conducive to subsequent generalizability. We also included FFMI, which is an index obtained from bioelectrical impedance analysis (BIA) of body composition. BIA can be quick and easy to use while also responding well to the quality of life and prognosis of patients with a tumor.8 Finally, we included the degree of weight loss of patients within 1 month, which is a simple question to answer as well as a quantitative measure. We chose this characteristic as an enrolled variable because it was considered an effective indicator for nutritional status. First, several nutritional scales, including Malnutrition Universal Screening Tool have considered weight change as an objective predictor for nutrition change.9 Also, the patient-completed scale in PG-SGA includes weight loss as an indicator of anabolism or catabolism in screening and assessment of malnutrition.10 Not only that, the Global Leadership Initiative on Malnutrition (GLIM) released in 2018 also emphasized the importance of weight loss.11 Weight loss is regarded as a phenotypic criterion for malnutrition in the GLIM guideline. In addition, patients with cancer often suffer from pain, dysphagia, taste change, etc., known as nutrition impact symptoms (NIS). A large number of studies have suggested that NIS had significant impact on dietary intake, which eventually resulted in weight loss.12–15 In that case, we inferred that weight loss is a sensitive and specific indicator of nutritional status. After integrating the aforementioned variables, our model included a total of five variables: albumin, HGB, PLR, FFMI, and degree of weight loss within 1 month.
To complete the clinical classification model, we employed feed-forward neural networks as the machine model. A feed-forward neural network is made up of many perceptrons and is better suited to fit huge amounts of data. Alternatively, the SVM method struggles with numerous classification issues and is sensitive to missing data. In some noisy classification situations, the random forest technique might result in overfitting. The decision tree model disregards the correlation of various data kinds, which are primarily connected to clinical data. Because we collect a significant quantity of clinical data, the clinical model is implemented using a feed-forward neural network.16,17 The accuracy of developing the PG-SGA grade prediction model with feed-forward neural networks was determined to be the best. We expect that our research may be used in clinical settings to help physicians determine PG-SGA grades. To make it easier for clinicians to utilize the model, we developed a clinical prediction model system that predicts PG-SGA grades by entering only five “()” variables.
In our study, we found a substantial imbalance in the distribution of the three different subgroups, 1481, 1374, and 888 in male patients, 1746, 1146, and 652 in female patients, and 21% in the total proportion of patients with severe malnutrition, which was consistent with prior research. Since the prediction model is trichotomous and the variation in data distribution affects the model’s prediction accuracy, the difficulty of prediction is significantly increased when compared to the dichotomous model. However, the accuracy of model constructed in this study can still reach 70%, even nearly 90% for patients without malnourishment, and the correction may be achieved by balanced data grouping. In future, more study can be done to see whether the performance can be improved by adding more patients and balancing the patient distribution. Moreover, further validation will be carried out.
Ethics Approval and Consent to Participate
This study have been performed in accordance with the principles stated in the Declaration of Helsinki. In accordance with the principles outlined in the Nuremberg Code and the Belmont Report, informed consent have been voluntarily obtained from the participants in this study, and participants have been informed of the study including any of the benefits and risks involved. The study was approved by the Ethics Committee of the First Affiliated Hospital of Jilin University (No. 2017-362).
Data Sharing Statement
Materials described in the manuscript, including all relevant raw data, will be freely available to any scientist wishing to use them for non-commercial purposes, without breaching participant confidentiality.
Disclosure
Dr Xiangliang Liu, Dr Yuguang Li and Dr Wei Ji, are all first authors. The authors report no conflicts of interest in this work.
References
1. Bauer J, Capra S, Ferguson M. Use of the scored Patient-Generated Subjective Global Assessment (PG-SGA) as a nutrition assessment tool in patients with cancer. Eur J Clin Nutr. 2002;56(8):779–785. doi:10.1038/sj.ejcn.1601412
2. Achilonu OJ, Fabian J, Bebington B, et al. Predicting colorectal cancer recurrence and patient survival using supervised machine learning approach: a South African population-based study. Front Public Health. 2021;9:694306. doi:10.3389/fpubh.2021.694306
3. Huang Y, Chen W, Zhang X, et al. Prediction of tumor shrinkage pattern to neoadjuvant chemotherapy using a multiparametric MRI-based machine learning model in patients with breast cancer. Front Bioeng Biotechnol. 2021;9:662749. doi:10.3389/fbioe.2021.662749
4. Wen R, Zheng K, Zhang Q, et al. Machine learning-based random forest predicts anastomotic leakage after anterior resection for rectal cancer. J Gastrointest Oncol. 2021;12(3):921–932. doi:10.21037/jgo-20-436
5. Kang J, Choi YJ, Kim I-K, et al. LASSO-based machine learning algorithm for prediction of lymph node metastasis in T1 colorectal cancer. Cancer Res Treat. 2021;53(3):773–783. doi:10.4143/crt.2020.974
6. Mateu-de Antonio J, Echeverria-Esnal D, Barceló-Vidal J, et al. Propensity-score matched comparative study on effects of intravenous human serum albumin administration in critically Ill adult patients receiving parenteral nutrition. JPEN J Parenter Enteral Nutr. 2019;43(3):357–363. doi:10.1002/jpen.1425
7. Ozmen S, Timur O, Calik I, et al. Neutrophil-lymphocyte ratio (NLR) and platelet-lymphocyte ratio (PLR) may be superior to C-reactive protein (CRP) for predicting the occurrence of differentiated thyroid cancer. Endocr Regul. 2017;51(3):131–136. doi:10.1515/enr-2017-0013
8. de van der Schueren MAE, de Smoker M, Leistra E, et al. The association of weight loss with one-year mortality in hospital patients, stratified by BMI and FFMI subgroups. Clin Nutr. 2018;37(5):1518–1525. doi:10.1016/j.clnu.2017.08.024
9. Rabito EI, Marcadenti A, da Silva Fink J, Figueira L, Silva FM. Nutritional risk screening 2002, short nutritional assessment questionnaire, malnutrition screening tool and malnutrition universal screening tool are good predictors of nutrition risk in an emergency service. Nutr Clin Pract. 2017;32(4):526–532.
10. Jager-Wittenaar H, Ottery FD. Assessing nutritional status in cancer: role of the patient-generated subjective global assessment. Curr Opin Clin Nutr Metab Care. 2017;20(5):322–329. doi:10.1097/MCO.0000000000000389
11. Jensen GL, Cederholm T, Correia MITD, et al. GLIM criteria for the diagnosis of malnutrition: a consensus report from the Global Clinical Nutrition Community. J Parenter Enteral Nutr. 2019;43(1):32–40. doi:10.1002/jpen.1440
12. Jin S, Lu Q, Sun Y, et al. Nutrition impact symptoms and weight loss in head and neck cancer during radiotherapy: a longitudinal study. BMJ Support Palliat Care. 2021;11(1):17–24. doi:10.1136/bmjspcare-2019-002077
13. Farhangfar A, Makarewicz M, Ghosh S, et al. Nutrition impact symptoms in a population cohort of head and neck cancer patients: multivariate regression analysis of symptoms on oral intake, weight loss and survival. Oral Oncol. 2014;50(9):877–883. doi:10.1016/j.oraloncology.2014.06.009
14. Ganzer H, Touger-Decker R, Parrott JS, et al. Symptom burden in head and neck cancer: impact upon oral energy and protein intake. Support Care Cancer. 2013;21(2):495–503. doi:10.1007/s00520-012-1542-4
15. Kubrak C, Olson K, Jha N, et al. Nutrition impact symptoms: key determinants of reduced dietary intake, weight loss, and reduced functional capacity of patients with head and neck cancer before treatment. Head Neck. 2010;32(3):290–300. doi:10.1002/hed.21174
16. Ivanova GS, Golovkov AA, Petrova IS, et al. Withdrawal notice: investigation of the use of neural networks for diagnosing breast cancer on mammograms. Curr Med Imaging. 2021;17. doi:10.2174/1573405617666210707155835
17. Piva F, Tartari F, Giulietti M, et al. Predicting future cancer burden in the United States by artificial neural networks. Future Oncol. 2021;17(2):159–168. doi:10.2217/fon-2020-0359
 © 2022 The Author(s). This work is published and licensed by Dove Medical Press Limited. The full terms of this license are available at https://www.dovepress.com/terms.php and incorporate the Creative Commons Attribution - Non Commercial (unported, v3.0) License.
By accessing the work you hereby accept the Terms. Non-commercial uses of the work are permitted without any further permission from Dove Medical Press Limited, provided the work is properly attributed. For permission for commercial use of this work, please see paragraphs 4.2 and 5 of our Terms.
© 2022 The Author(s). This work is published and licensed by Dove Medical Press Limited. The full terms of this license are available at https://www.dovepress.com/terms.php and incorporate the Creative Commons Attribution - Non Commercial (unported, v3.0) License.
By accessing the work you hereby accept the Terms. Non-commercial uses of the work are permitted without any further permission from Dove Medical Press Limited, provided the work is properly attributed. For permission for commercial use of this work, please see paragraphs 4.2 and 5 of our Terms.