Back to Journals » Diabetes, Metabolic Syndrome and Obesity » Volume 17
A Prediction Model of Preeclampsia in Hyperglycemia Pregnancy
Authors Fang Y, Liu H, Li Y, Cheng J, Wang X, Shen B ![]() , Chen H, Wang Q
, Chen H, Wang Q
Received 5 December 2023
Accepted for publication 12 March 2024
Published 18 March 2024 Volume 2024:17 Pages 1321—1333
DOI https://doi.org/10.2147/DMSO.S453204
Checked for plagiarism Yes
Review by Single anonymous peer review
Peer reviewer comments 2
Editor who approved publication: Dr Konstantinos Tziomalos
Yan Fang,1,2 Huali Liu,1,2 Yuan Li,1,2 Ji Cheng,1 Xia Wang,1 Bing Shen,3 Hongbo Chen,1,2 Qunhua Wang4
1Department of Obstetrics and Gynaecology, Maternal and Child Health Hospital Affiliated to Anhui Medical University, Hefei, People’s Republic of China; 2The Fifth Clinical College of Anhui Medical University, Hefei, People’s Republic of China; 3School of Basic Medicine, Anhui Medical University, Hefei, People’s Republic of China; 4Department of Obstetrics and Gynaecology, the First Affiliated Hospital of USTC, Hefei, People’s Republic of China
Correspondence: Hongbo Chen, Maternal and Child Health Hospital Affiliated to Anhui Medical University, No. 15 Yimin Street, Luyang District, Hefei City, Anhui Province, People’s Republic of China, Email [email protected] Qunhua Wang, Department of Obstetrics and Gynaecology, the First Affiliated Hospital of USTC, Hefei, People’s Republic of China, Email [email protected]
Purpose: To investigate the risk factors associated with preeclampsia in hyperglycemic pregnancies and develop a predictive model based on routine pregnancy care.
Patients and Methods: The retrospective collection of clinical data was performed on 951 pregnant women with hyperglycemia, including those diagnosed with diabetes in pregnancy (DIP) and gestational diabetes mellitus (GDM), who delivered after 34 weeks of gestation at the Maternal and Child Health Hospital Affiliated to Anhui Medical University between January 2017 and December 2019. Observation indicators included liver and kidney function factors testing at 24– 29+6 weeks gestation, maternal age, and basal blood pressure. The indicators were screened univariately, and the “rms” package in R language was applied to explore the factors associated with PE in HIP pregnancy by stepwise regression. Multivariable logistic regression analysis was used to develop the prediction model. Based on the above results, a nomogram was constructed to predict the risk of PE occurrence in pregnant women with HIP. Then, the model was evaluated from three aspects: discrimination, calibration, and clinical utility. The internal validation was performed using the bootstrap procedure.
Results: Multivariate logistic regression analysis showed that cystatin C, uric acid, glutamyl aminotransferase, blood urea nitrogen, and basal systolic blood pressure as predictors of PE in pregnancy with HIP. The predictive model yielded an area under curve (AUC) value of 0.8031 (95% CI: 0.7383– 0.8679), with an optimal threshold of 0.0805, at which point the sensitivity was 0.8307 and specificity of 0.6604. Hosmer–Lemeshow test values were P = 0.3736, Brier score value was 0.0461. After 1000 Bootstrap re-samplings for internal validation, the AUC was 0.7886, the Brier score was 0.0478 and the predicted probability of the calibration curve was similar to the actual probability. A nomogram was constructed based on the above to visualize the model.
Conclusion: This study developed a model for predicting PE in pregnant women with HIP, achieving high predictive performance of PE risk through the information of routine pregnancy care.
Keywords: hyperglycemia in pregnancy, preeclampsia, prediction model, nomogram, internal validation
Introduction
The International Federation of Obstetrics and Gynaecology (FIGO) defined “hyperglycemia in pregnancy” (HIP) as hyperglycemia covering all severity levels, which can be divided into DIP (either preexisting diabetes—type 1 or type 2—which antedates pregnancy or is first identified during testing in the index pregnancy) and GDM.1 According to the latest (10th) edition of the International Diabetes Federation’s Diabetes Map 2021, approximately 16.7% of women of childbearing age worldwide experience varying degrees of elevated blood glucose during pregnancy.2 HIP is associated with a significantly increased risk of adverse perinatal outcomes, including preeclampsia, birth injuries, increased caesarean section rates, and an increased incidence of type 2 diabetes mellitus in offspring.3–5
The International Society for the Study of Hypertension in Pregnancy (ISSHP) defines PE as new onset hypertension and proteinuria after 20 weeks of gestation or with other end-organ damage, that affects 2–8% of pregnancies worldwide, and can lead to preterm delivery, fetal growth restriction, maternal convulsions, damage to vital organs such as the heart, liver and kidneys and in severe cases, maternal and fetal death.6–8
It has been shown that HIP is associated with an increased risk of PE.9 Some studies have shown that mechanisms related to glucose metabolism are involved in the pathogenesis of hypertensive disorders in pregnancy; in addition, PE and HIP share many common risk factors and similarities in pathophysiology, including immune system disorder, vascular endothelial dysfunction, and insulin resistance.10–15 In this study, we focused on pregnant women with HIP, with the hope of screening those at risk of preeclampsia through simple routine pregnancy care information so that we can take more effective interventions.
Method
Participants and Ethics
Information on 951 pregnant women with hyperglycemia who delivered as an inpatient at the Maternal and Child Health Hospital Affiliated at Anhui Medical University from January 2017 to December 2019 was retrieved through the medical electronic medical record system. The inclusion criteria were as follows: (1) singleton live birth; (2) gestational age at delivery ≥34 weeks; (3) having undergone liver and kidney function at 24–29+6 weeks of gestation; (4) without chronic hypertension or chronic hypertension combine with preeclampsia; (5) without gestational hypertension; (6) those with age, number of deliveries and basal blood pressure recorded. HIP includes diabetes during pregnancy and gestational diabetes mellitus. The diagnosis of diabetes in pregnancy was made according to the World Health Organization (WHO) criteria; that is, routine testing at any time during pregnancy, if any of the following cut‐off points was met: fasting plasma glucose (FPG) ≥7.0mmol/L; 2-hour plasma glucose (PG) ≥11.1mmol/L following a 75-g oral glucose load; random PG ≥11.1mmol/L in the presence of diabetes symptom.16 The diagnosis of GDM was made according to the International Association of Diabetes and Pregnancy Study Group (IADPSG) criteria; that is, all patients underwent an oral 75 g glucose tolerance test at 24–28 weeks with overnight fasting for 10 h. Plasma glucose test measurement was performed at 1 and 2 h after oral 75 g glucose tolerance. A GDM diagnosis was made when the plasma glucose values exceeded any of the defined thresholds (fasting: 92 mg/dL (5.1 mmol/L); 1 h: 180 mg/dL (10.0 mmol/L); and 2 h: 153 mg/dL (8.5 mmol/L)).17
This was a retrospective study of routinely collected clinical data, and exemption from informed consent was approved by the Medical Ethics Committee of Maternal and Child Health Hospital Affiliated at Anhui Medical University (approval number YYLL2022-2108085MH260-03-01). All experimental protocols were approved by the Medical Ethics Committee of Anhui Maternal and Child Health Hospital and all methods were carried out in accordance with the Declarations of Helsinki.
Candidate Predictor Variables
General information of the pregnant women were obtained from the medical records, including maternal age, parity, basal systolic blood pressure (SBP), basal diastolic blood pressure (DBP); liver and kidney function indexes obtained at routine pregnancy care at 24–29+6 week of gestation, include albumin (ALB), creatine kinase (CK), alkaline phosphatase (ALP), cystatin C (CYSCL), uric acid (UA), creatinine (CREA), alpha hydroxybutyrate dehydrogenase (HBDH), white globule ratio (A/G), aspartate transaminase (AST), total bile acid (TBA), alanine aminotransferase (ALT), total bilirubin (TBIL), glutamyl aminotransferase (GGT), glucose (GLU), total protein (TP), urea nitrogen (BUN), indirect bilirubin (IBIL), direct bilirubin (DBIL) and globulin (GLO).
Statistical Analyses
R language (R.4.2.2) was applied for analysis and the measurement data were expressed as M (IQR); the Wilcoxon rank sum test was used for comparison between groups, while the count data were expressed as n (%) and the Fisher test was used for comparison between groups. P-value <0.05 in two-tailed tests was considered statistically significant.
Model Development and Internal Validation
Interactions and covariance between the variables were first tested using the occurrence of preeclampsia as the dependent variable. Logistic regression models were developed using stepwise regression. Restricted cubic spline (RCS) was used to examine the association between measurement variables and the risk of PE. Interactions and covariance between the measured variables were also tested. The Bootstrap re-sampling (1000 times) method was used for internal validation. Finally, we used a nomogram to visualise the model.
Model Performance Evaluation
The performance of the model was evaluated around three aspects: discrimination, calibration and clinical utility. In this study, AUC was used to evaluate the model’s discrimination ability. Hosmer–Lemeshow tests and calibration curves were used to determine the degree of agreement between predicted probabilities and observed outcomes. Decision curve analysis (DCA) was used to assess clinical validity. Overall model performance was evaluated by using the Brier score. All analyses in this study were performed using R software (version 4.1.3). All tests were two-tailed, and the difference was statistically significant at P <0.05.
Results
Basic Characteristics of Patient Population
The general information on pregnant women with hyperglycemia was divided into PE and non-PE group according to the occurrence of PE. When comparing the general information of pregnant women in the two groups, the difference in age and parity at conception was not statistically significant (P>0.05); the basal systolic blood pressure and basal diastolic blood pressure in the PE group were both higher than that in the non-preeclampsia group, and the difference was statistically significant (P<0.05). Comparison of liver and kidney function l indicators between the two groups: alkaline phosphatase (ALP), cystatin C (CYSCL), uric acid (UA) and glutamyl aminotransferase (GGT) were all higher in the PE group than in the non-PE group, with statistically significant differences (P<0.05), while the differences in other indicators between the two groups were not statistically significant (see Table 1).
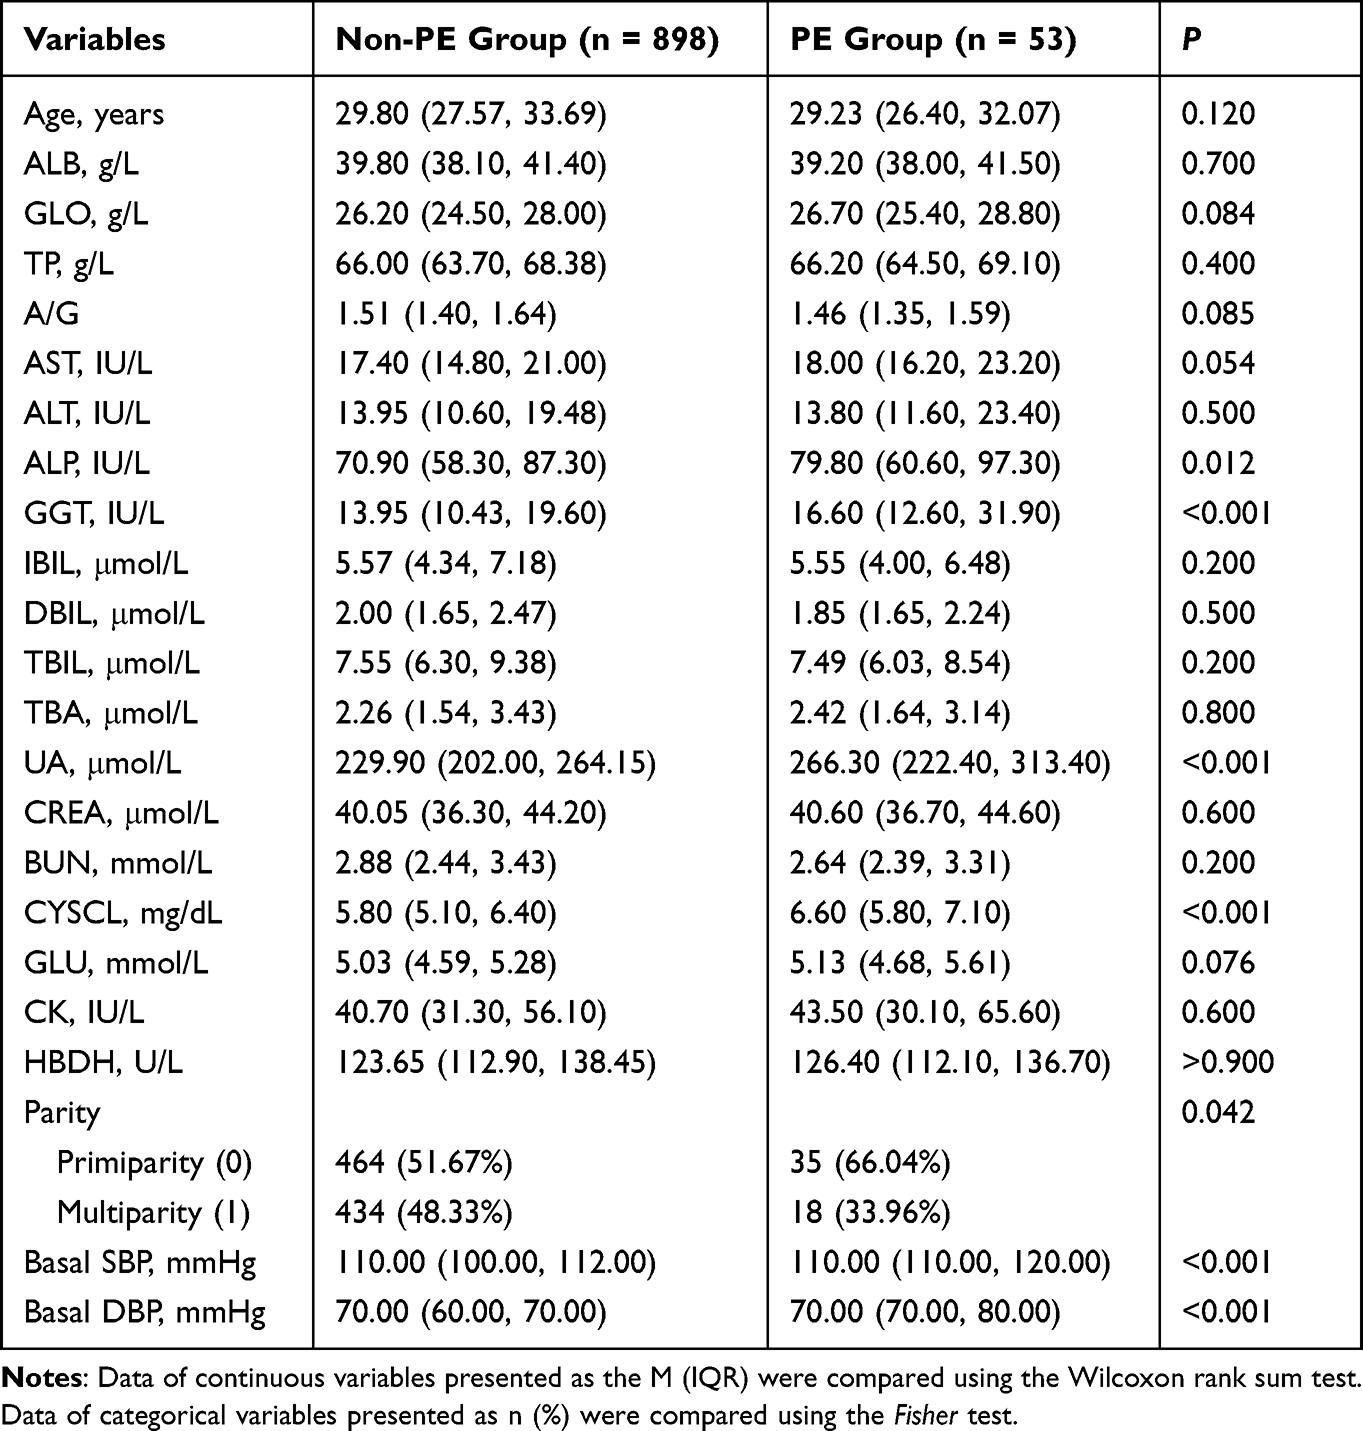 |
Table 1 Basic Characteristics of the Patient Population |
Predictive Model Development
The final mathematical equation determined by the logistic regression model to predict PE was as follows:  . The predictive model was presented using a nomogram, which can be used to quantitatively predict the risk of preeclampsia in pregnant women of HIP (see Table 2 and Figure 1). Furthermore, a webpage calculation tool (model URL: https://preclampsia-predict.shinyapps.io/dynnomapp/) was created and the values of the variables were entered in the left column of the webpage to derive the probability value of the case being preeclamptic.
 |
Table 2 Multivariate Logistic Regression Analysis of Preeclampsia |
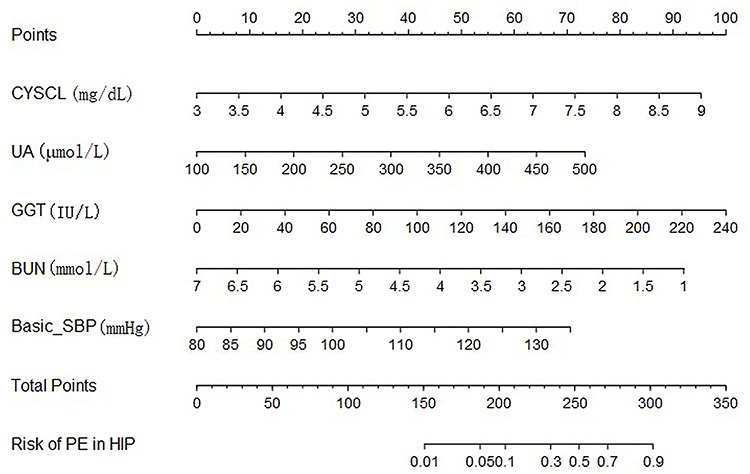 |
Figure 1 A nomogram predicting the risk of preeclampsia in hyperglycemia in pregnancy. |
The variables were evaluated using the variance inflation factor (VIF) and Cook’s distance. The VIF of the models, 1.0352–1.0946, was much lower than 10, suggesting that there was no covariance between the variables of the models. The strong point-of-influence analysis showed that Cook’s distance of models was much lower than 1 (see Figure 2). And Figure 3 displays the linear relationship between variables and the risk of PE (all P for non-linearity >0.05). As shown in Figure 3, the risk of PE in pregnant women with HIP decreased with the increase of BUN. On contrary, there was a positive correlation between the levels of UA, GGT, SBP, and CYSCL and the risk of preeclampsia.
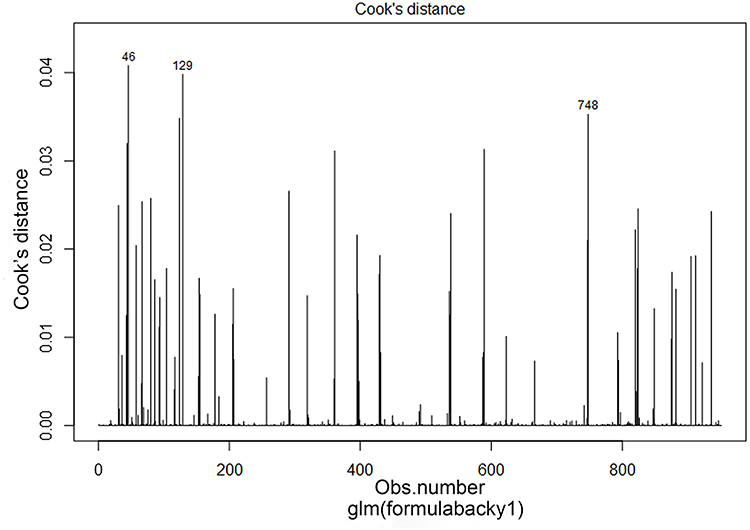 |
Figure 2 Cook’s distance plot of the model. |
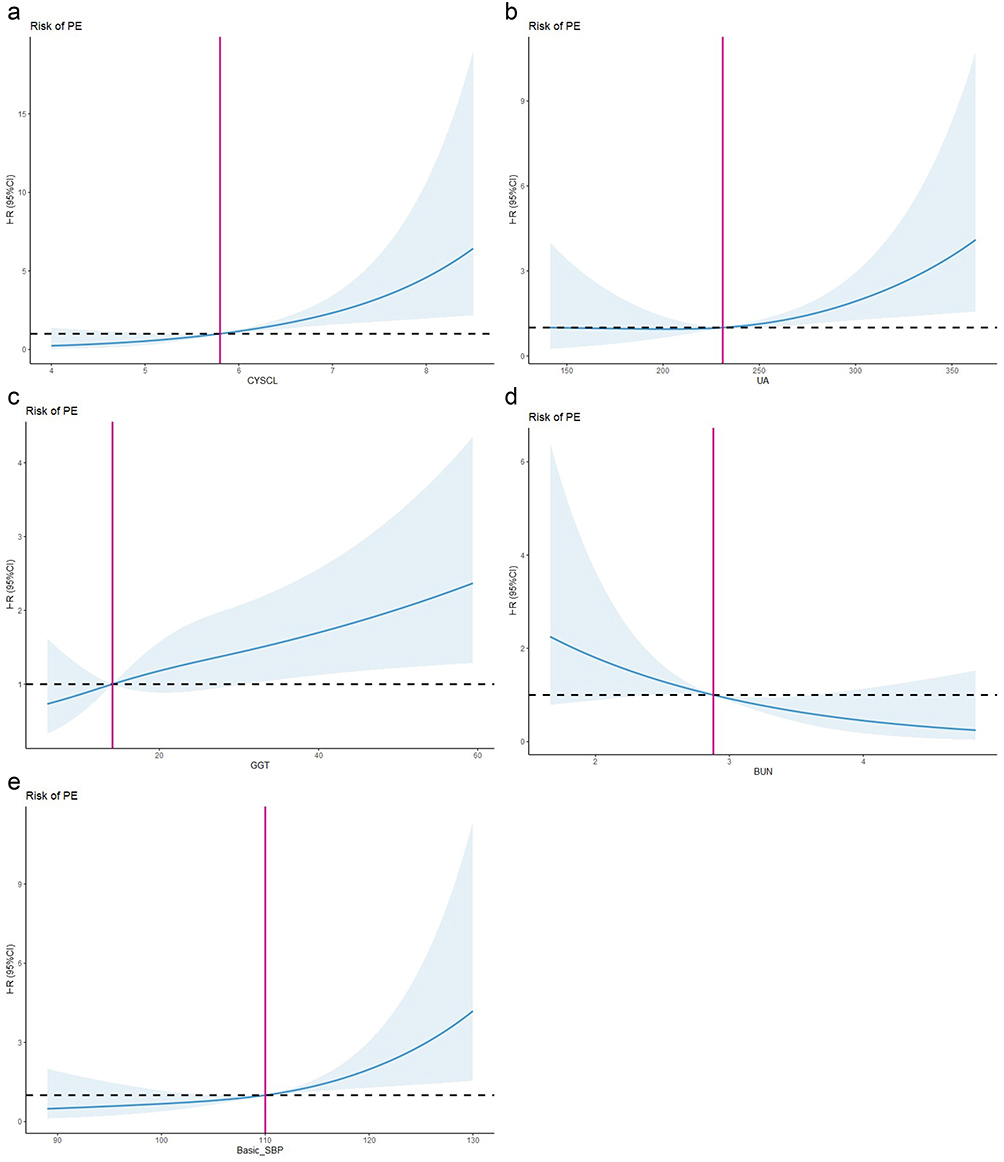 |
Figure 3 The relationship between variables and predicted outcomes. (a) Cystatin C and the risk of preeclampsia. (b) Uric acid and the risk of preeclampsia. (c) Glutamyl aminotransferase and the risk of preeclampsia. (d) Blood urea nitrogen and the risk of preeclampsia. (e) basic basal systolic blood pressure and the risk of preeclampsia. Hazard ratios are indicated by solid lines and 95% CIs by shaded areas. |
Evaluation of the Prediction Model
AUC values were calculated to assess the discrimination of the predictive model by examining the occurrence of preeclampsia with HIP. As shown in Figure 4, the ROC curve showed an AUC=0.8031 (95% CI: 0.7383–0.8679), with an optimal threshold of 0.0805, at which point the sensitivity was 0.8307 and specificity of 0.6604. When the threshold was set at 0.0270, the sensitivity was 0.9057 and the specificity was 0.4644. The result suggested that the line graphs have good discriminatory and predictive value and can correctly identify HIP pregnant with and without PE.
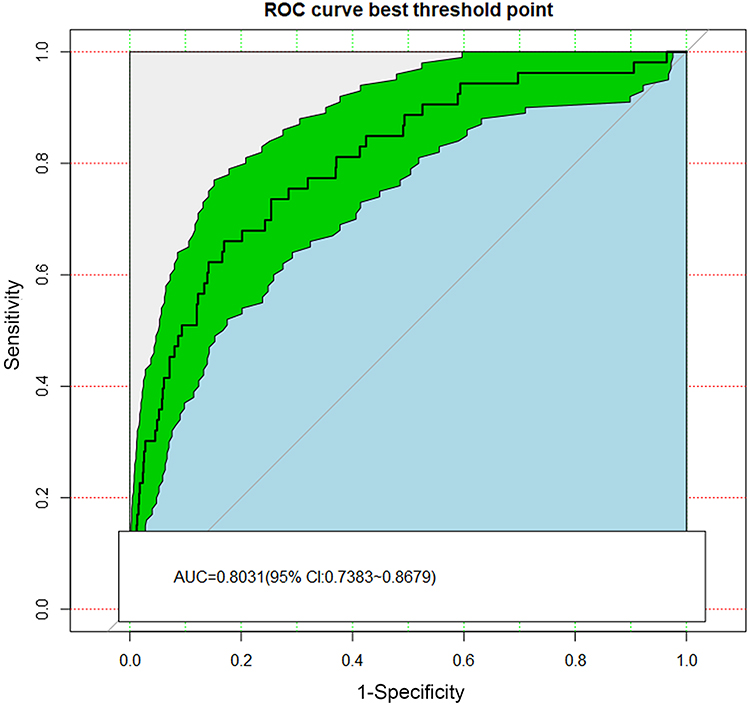 |
Figure 4 Receiver operating characteristic (ROC) curve of the model. The green area represents the 95% confidence interval of area under the ROC curve. |
The Hosmer–Lemeshow test result showed that the model had a very good fit for the model (χ2 = 8.6393, df=8, p = 0.3736). The calibration plot (Figure 5) for the nomogram revealed good predictive accuracy between the actual probability and predicted probability of preeclampsia. Precision was measured by Brier score, which had a value of 0.0461.
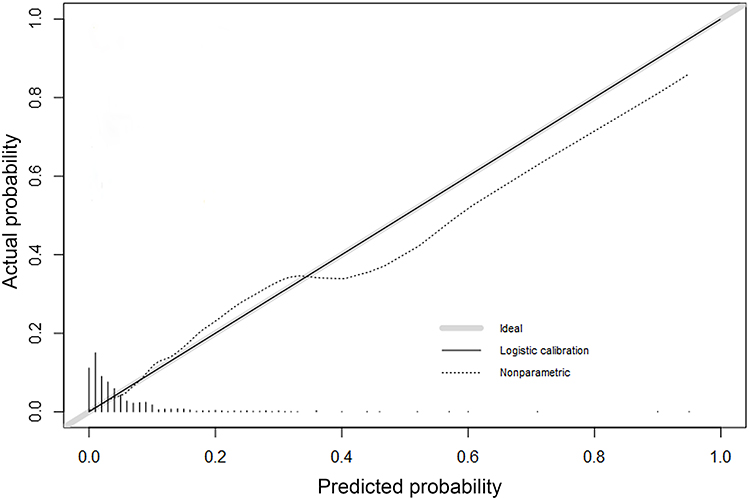 |
Figure 5 Calibration curve plot of the model. |
The clinical utility of the model was evaluated using DCA curves. The results are shown in Figure 6. The decision curves show that the net benefit of the prediction model is significantly higher than the two extreme cases, indicating that the nomogram has a high net benefit and predictive accuracy.
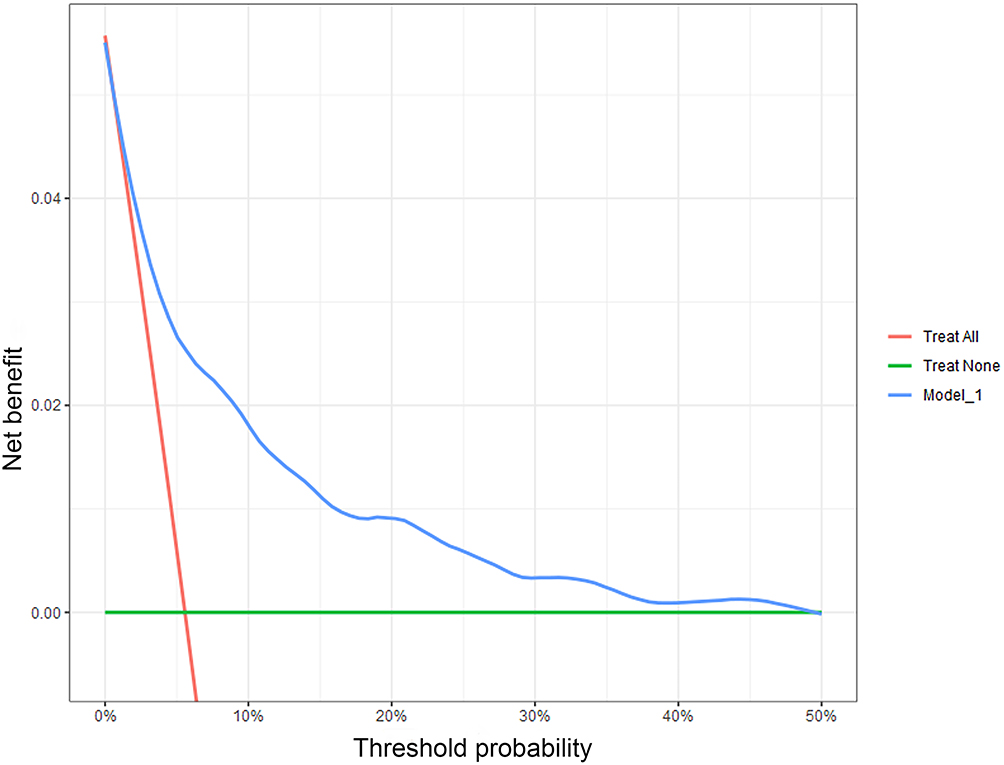 |
Figure 6 Decision curve analysis of the model. |
Internal Validation
The resulting model was internally validated by 1000 bootstrap re-samplings. A similar result was observed between the validation cohort and the training cohort. In the validation cohort, the AUC was 0.7886 (95% CI: 0.7750–0.8043) (Figure 7). Meanwhile, the calibration curve showed a good fit during internal validation (Figure 8), while the Brier score was 0.0478 after bootstrap correction. As a result, the prediction ability of the model is acceptable.
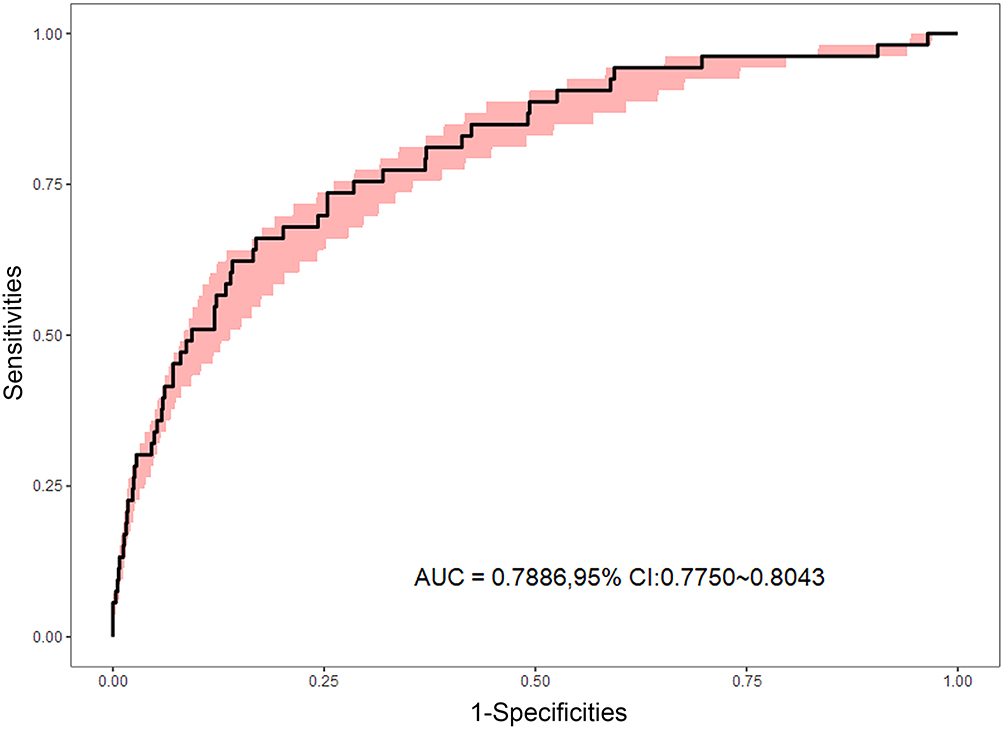 |
Figure 7 Receiver operating characteristic (ROC) curve of the model after 1000 bootstrap re-sampling. The red area represents the 95% confidence interval of area under the ROC curve. |
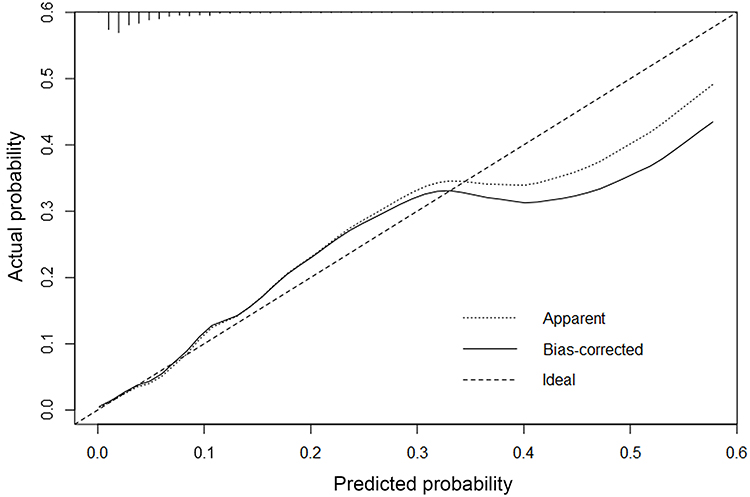 |
Figure 8 Calibration curve plot of the model after internal validation. |
Discussion
Many studies have reported that the risk of preeclampsia was higher in pregnant women with HIP than in those without HIP. For example, the findings of Yogev et al supported the suggestion that HIP promotes the development of PE.18 It has also been suggested that a history of HIP in the first pregnancy is also a risk factor for PE in the second.19–22 HIP and PE are inextricably linked, maybe because they have similar risk factors and pathophysiological changes. For example, High-risk factors for HIP and PE both include obesity and advanced age.23 And study has shown that inflammation and endothelial dysfunction are both involved in the pathogenesis of PE and HIP.24
To date, the early prediction of preeclampsia is challenging because little is known about the aetiology and pathogenesis of PE. Currently, research on the indicators of preeclampsia prediction models has focused on maternal characteristics, medical history, imaging indicators, PLGF, PAPP-A, etc.25–27 This is an indicator not provided by routine antenatal care, making the applicability and external validation of these models very difficult. Our research proposes a prediction method to address this issue. We developed a preeclampsia prediction model for the HIP population at 24–29+6 weeks of gestation, using clinical and laboratory data that are readily available during routine antenatal visits. The AUC of the model was 0.8031 (95% CI: 0.7383–0.8679), which is higher than the PE prediction model proposed by Bijl et al.28
Uric acid is an end product of purine metabolism and studies have shown that impaired uric acid metabolism can affect the development of preeclampsia.29,30 Also, the results of Bellos et al31 demonstrate that elevated serum uric acid levels in patients with preeclampsia can be used to predict disease severity and pregnancy complications. This is in line with our study. The results of this study showed that serum uric acid levels were higher in the PE group than in the normal group and were an independent risk factor for PE; also, the risk of PE in pregnant women with HIP increased with increasing uric acid levels. In our study, BUN was a protective factor for patients with PE, and an increase in their levels can to some extent reduce the risk of PE. It is worth mentioning that there are also studies indicating that BUN is a risk factor for preeclampsia, which may be a direction for future research.32 In addition, changes in cystatin C were found to be significant in this study. Each 1 mg/dL increase in cystatin C was associated with a 2.04-fold increase in the risk of preeclampsia in pregnant women with HIP (OR = 2.04; 95% CI:1.51–2.79, P<0.001), suggesting that early changes in renal function are of value in predicting the development of PE in pregnant women with HIP. The reason for this may be that cystatin C correlates with the degree of glomerular endotheliosis, the typical glomerular lesion of PE.33 And, PE patients may develop systemic small vessel spasms, including those affecting the glomerulus, which worsen as the condition progresses, ultimately leading to further renal function impairment due to glomerular endothelial lesions and renal vascular injuries.34 Serum GGT has certain clinical value for various liver and gallbladder diseases. Previous studies have shown a positive correlation between GGT and the risk of hypertension in adults.35 This study found that GGT levels also affect blood pressure in pregnant women. In our study, as serum GGT levels increase, pregnant women with HIP also have an increased risk of developing PE. This is consistent with the research of Chen et al.36 And they proposed a hypothesis about the pathogenesis, where serum GGT affects the production of free radicals by interacting with iron and other transport proteins.37 Basal blood pressure has been used as a maternal risk factor to construct a preliminary screening model. Moreover, the literature suggests that systolic blood pressure is more important in the development of preeclampsia.38
The significance of our model is to use appropriate statistical methods to analyze readily available data from maternity examinations of pregnant women with HIP, explore high-risk factors for PE in HIP women, and then establish a predictive model that can identify high-risk patients with a low-cost routine. The high-risk patients would then be followed up to develop more targeted screening and treatment plans. For example, when we set the threshold of the model to 0.0270, we can screen 90.57% of PE patients. Although the specificity of the model at this time is 46.44%, we can use a more accurate but cost-effective screening method based on this model, such as the “triple test” method using MAP, PLGF and sFlt-1 measurements, which has a PE detection rate of 79% (specificity of 90%) and an AUC of 0.923.39
In this study, we first compared the differences between the indicators in the two groups through univariate analysis, then excluded variables with high covariance, and finally combined stepwise regression to screen variables to construct the model. The model was further visualised through R language and a website calculator. The prediction models we developed were able to achieve predictive performance comparable to, and in some cases better than, previous prospective cohorts. This study used Bootstrap resampling to internally validate the built model by sampling 1000 times and the results showed that the model had an AUC of 0.7886 at internal validation, suggesting that the model still had good discrimination and calibration correction and also showed that the model was still well calibrated. DCA is a useful method for model evaluation based on a continuous potential risk threshold (x-axis) and the net benefit of using the model to risk-stratify patients (y-axis) demonstrates the clinical utility of the model, with this study showing a high net benefit in the clinical use of the model.
The nomogram is a common predictive model used in many studies in clinical areas. In our study, a nomogram for assessing the risk of developing preeclampsia was created based on the predictor variables screened by a multifactorial logistic regression analysis: the score for each variable corresponds to the score on the topmost scoring axis and then the scores for each variable were summed to give a total score, with the total score corresponding to the value on the bottom axis being the probability of the risk of a severe occurrence of preeclampsia.
There are some limitations in this study. First, a major limitation of our study is a single-center study, which may impact the generalizability and validity of the medical records used. Secondly, external validation of the model is needed to evaluate its value in clinical practice. Thirdly, more machine learning methods are being applied to the construction of predictive models, and random forests and gradient enhancement also have good performance in building models. In the future, we will attempt more modelling methods to optimize the model.
Conclusion
In this study, it was found that UA, GGT, CYSCL and basic SBP were risk factors and BUN was a protective factor for PE in HIP at 24–29+6 weeks of gestation. According to the findings, we constructed a prediction model based on the information of routine pregnancy care that could accurately predict the risk of PE in HIP patients, which may provide a reference for clinicians to identify high-risk groups early.
Abbreviations
PE, preeclampsia; HIP, hyperglycemia in pregnancy; AUC, Area under curve; ISSHP, International Society for the Study of Hypertension in Pregnancy; IADPSG, International Association of Diabetes and Pregnancy Study Group; FPG, fasting plasma glucose; WHO, World Health Organization; UA, uric acid; CREA, creatinine; A/G, white globule ratio; TBA, total bile acid; TBIL, total bilirubin; GLU, glucose; BUN, blood urea nitrogen; DBIL, direct bilirubin; DCA, Decision curve analysis; ANOVA, Analysis of Variance; DIP, diabetes in pregnancy; GDM, Gestational diabetes mellitus; SBP, systolic blood pressure; DBP, diastolic blood pressure; ALB, albumin; CK, creatine kinase; ALP, alkaline phosphatase; CYSCL, cystatin C; HBDH, alpha hydroxybutyrate dehydrogenase; AST, aspartate transaminase; ALT, alanine aminotransferase; GGT, glutamyl aminotransferase; TP, total protein; IBIL, indirect bilirubin; GLO, globulin; RCS, restricted cubic spline; CI, Confidence Interval.
Data Sharing Statement
Data will be made available upon request to the corresponding author.
Ethics Approval and Consent to Participate
This was a retrospective study of routinely collected clinical data, and exemption from informed consent was approved by the Medical Ethics Committee of Maternal and Child Health Hospital Affiliated to Anhui Medical University (approval number YYLL2022-2108085MH260-03-01). All experimental protocols were approved by the Medical Ethics Committee of Anhui Maternal and Child Health Hospital and all methods were carried out in accordance with the Declarations of Helsinki.
Acknowledgments
The authors wish to thank all of the staff members at the Department of Obstetrics and Gynaecology, Anhui Maternal and Child Health Care Hospital. The authors wish to thank all the staff members at the Department of Obstetrics and Gynaecology, Anhui Maternal and Child Health Care Hospital for their strong support of this study.
Author Contributions
All authors made a significant contribution to the work reported, whether that is in the conception, study design, execution, acquisition of data, analysis and interpretation, or in all these areas; took part in drafting, revising or critically reviewing the article; gave final approval of the version to be published; have agreed on the journal to which the article has been submitted; and agree to be accountable for all aspects of the work.
Funding
This work was supported by the Natural Science Foundation of Anhui Province (2108085MH260), the Key Research and Development Plan of Anhui Provincial (2022e07020001), the Anhui Province Key Research and Development Project (202204295107020050). The funders had no role in study design, data collection, analysis, decision to publish, or preparation of the manuscript.
Disclosure
Dr Bing Shen is now affiliated to Dr. Neher’s Biophysics Laboratory for Innovative Drug Discovery, State Key Laboratory of Quality Research in Chinese Medicine, Macau University of Science and Technology, Taipa, Macao SAR, People’s Respublic of China. The authors declare that they have no known competing financial interests or non-financial interests that could have appeared to influence the work reported in this paper.
References
1. Hod M, Kapur A, Sacks DA, et al. The International Federation of Gynecology and Obstetrics (FIGO) Initiative on gestational diabetes mellitus: a pragmatic guide for diagnosis, management, and care. Int J Gynaecol Obstet. 2015;131(Suppl 3):S173–S211. doi:10.1016/S0020-7292(15)30007-2
2. International Diabetes Federation. IDF Diabetes Atlas, 10th edn. Brussels, Belgium; 2021. Available from: https://www.diabetesatlas.org.
3. McIntyre HD, Fuglsang J, Kampmann U, Knorr S, Ovesen P. Hyperglycemia in pregnancy and women’s health in the 21st Century. Int J Environ Res Public Health. 2022;19(24):16827. doi:10.3390/ijerph192416827
4. Retnakaran R. Hyperglycemia in pregnancy and its implications for a woman’s future risk of cardiovascular disease. Diabet Res Clin Pract. 2018;145:193–199. doi:10.1016/j.diabres.2018.04.008
5. Bianco ME, Josefson JL. Hyperglycemia during pregnancy and long-term offspring outcomes. Curr Diab Rep. 2019;19(12):143. doi:10.1007/s11892-019-1267-6
6. Ives CW, Sinkey R, Rajapreyar I, Tita ATN, Oparil S. JACC state-of-The-art review. J Am Coll Cardiol. 2020;76(14):1690–1702. doi:10.1016/j.jacc.2020.08.014
7. Rana S, Lemoine E, Granger JP, Karumanchi SA. Preeclampsia: pathophysiology, challenges and perspectives. Circ Res. 2019;124(7):1094–1112. doi:10.1161/CIRCRESAHA.118.313276
8. Phipps EA, Thadhani R, Benzing T, Karumanchi SA. Pre-eclampsia: pathogenesis, novel diagnostics and therapies. Nat Rev Nephrol. 2019;15(5):275–289. doi:10.1038/s41581-019-0119-6
9. Metzger BE, Lowe LP; HAPO Study Cooperative Research Group. Hyperglycemia and adverse pregnancy outcomes. N Engl J Med. 2008;358(19):1991–2002.
10. Ning J, Zhang M, Cui D, Yang H. The pathologic changes of human placental macrophages in women with hyperglycemia in pregnancy. Placenta. 2022;130:60–66. doi:10.1016/j.placenta.2022.11.004
11. Chiarello DI, Abad C, Rojas D, et al. Oxidative stress: normal pregnancy versus preeclampsia. Biochim Biophys Acta Mol Basis Dis. 2020;1866(2):165354. doi:10.1016/j.bbadis.2018.12.005
12. Rajaa A, Louise B, Daniel V, et al. Oxidative stress in preeclampsia and placental diseases. Int J Molences. 2018;19(5):1496.
13. Cooke WR, Jones GD, Redman CWG, et al. Syncytiotrophoblast-derived extracellular vesicles in relation to preeclampsia. Maternal Fetal Med. 2021;3(2):10. doi:10.1097/FM9.0000000000000093
14. Wang ZY, Cai B, Cao CR, et al. Downregulation of CD151 induces oxidative stress and apoptosis in trophoblast cells via inhibiting ERK/Nrf2 signaling pathway in preeclampsia. Free Radic Bio Med. 2021;164:249–257. doi:10.1016/j.freeradbiomed.2020.12.441
15. Rademacher TW, Gumaa K, Scioscia M. Preeclampsia, insulin signaling and immunological dysfunction: a fetal, maternal or placental disorder? J Reprod Immunol. 2007;76(1–2):78–84. doi:10.1016/j.jri.2007.03.019
16. World Health Organization. Diagnostic criteria and classification of hyperglycaemia first detected in pregnancy; 2013. Available from: http://apps.who.int/iris/bitstream/10665/85975/1/WHO_NMH_MND_13.2_eng.pdf.
17. Metzger BE, Gabbe SG, Persson B, et al.; International Association of Diabetes and Pregnancy Study Groups Consensus Panel. International association of diabetes and pregnancy study groups recommendations on the diagnosis and classification of hyperglycaemia in pregnancy. Diabetes Care. 2010;33(3):676–682. doi:10.2337/dc10-0719
18. Yogev Y, Chen R, Hod M, et al. Hyperglycemia and Adverse Pregnancy Outcome (HAPO) Study: preeclampsia. Am J Obstet Gynecol. 2010;202(3):255.e1–255.e2557. doi:10.1016/j.ajog.2010.01.024
19. Emanuel M, Butt S. Frequency and factors leading to recurrent pre-eclampsia. J Pak Med Assoc. 2015;65(11):1173–1177.
20. Bigelow CA, Pereira GA, Warmsley A, et al. Risk factors for new-onset late postpartum preeclampsia in women without a history of preeclampsia. Am J Obstet Gynecol. 2014;210(4):338.e1–338.e8. doi:10.1016/j.ajog.2013.11.004
21. Wainstock T, Sergienko R, Sheiner E. Who is at risk for preeclampsia? Risk factors for developing initial preeclampsia in a subsequent pregnancy. J Clin Med. 2020;9(4):1103. doi:10.3390/jcm9041103
22. Scholtens DM, Kuang A, Lowe LP, et al.; HAPO Follow-Up Study Cooperative Research Group. Hyperglycaemia and Adverse Pregnancy Outcome Follow-up Study (HAPO FUS): maternal glycemia and childhood glucose metabolism. Diabetes Care. 2019;42(3):381–392. doi:10.2337/dc18-2021
23. Sweeting A, Wong J, Murphy HR, Ross GP. A clinical update on gestational diabetes mellitus. Endocr Rev. 2022;43(5):763–793. doi:10.1210/endrev/bnac003
24. Rao R, Sen S, Han B, Ramadoss S, Chaudhuri G. Gestational diabetes, preeclampsia and cytokine release: similarities and differences in endothelial cell function. Adv Exp Med Biol. 2014;814:69–75.
25. Pedroso MA, Palmer KR, Hodges RJ, Costa FDS, Rolnik DL. Uterine artery Doppler in screening for preeclampsia and foetal growth restriction. Rev Bras Gynecol Obstet. 2018;40(5):287–293. doi:10.1055/s-0038-1660777
26. Serra B, Mendoza M, Scazzocchio E, et al. A new model for screening for early-onset preeclampsia. Am J Obstet Gynecol. 2020;222(6):608.e1–608.e18. doi:10.1016/j.ajog.2020.01.020
27. Nicolaides KH, Sarno M, Wright A. Ophthalmic artery Doppler in the prediction of preeclampsia. Am J Obstet Gynecol. 2022;226(2S):S1098–S1101. doi:10.1016/j.ajog.2020.11.039
28. Bijl RC, Cornette JMJ, Brewer AN, et al. Patient-reported preconceptional characteristics in the prediction of recurrent preeclampsia. Pregnancy Hypertens. 2022;28:44–50. doi:10.1016/j.preghy.2022.02.003
29. Cheung KL, Lafayette RA. Renal physiology of pregnancy. Adv Chronic Kidney Dis. 2013;20(3):209–214. doi:10.1053/j.ackd.2013.01.012
30. Martin AC, Brown MA. Could uric acid have a pathogenic role in pre-eclampsia? Nat Rev Nephrol. 2010;6(12):744–748. doi:10.1038/nrneph.2010.125
31. Bellos I, Pergialiotis V, Loutradis D, Daskalakis G. The prognostic role of serum uric acid levels in preeclampsia: a meta-analysis. J Clin Hypertens. 2020;22(5):826–834. doi:10.1111/jch.13865
32. Mishra J, Srivastava SK, Pandey KB. Compromised renal and hepatic functions and unsteady cellular redox state during preeclampsia and gestational diabetes mellitus. Arch Med Res. 2021;52(6):635–640. doi:10.1016/j.arcmed.2021.03.003
33. Niraula A, Lamsal M, Baral N, et al. Cystatin-C as a marker for renal impairment in preeclampsia. J Biomark. 2017;2017:7406959. doi:10.1155/2017/7406959
34. Kattah A. Preeclampsia and kidney disease: deciphering cause and effect. Curr Hypertens Rep. 2020;22(11):91. doi:10.1007/s11906-020-01099-1
35. Onat A, Can G, Örnek E, Çiçek G, Ayhan E, Doğan Y. Serum γ-glutamyl transferase: independent predictor of risk of diabetes, hypertension, metabolic syndrome, and coronary disease. Obesity. 2012;20(4):842–848. doi:10.1038/oby.2011.136
36. Chen Y, Ou W, Lin D, et al. Increased uric acid, gamma-glutamyl transpeptidase and alkaline phosphatase in early-pregnancy associated with the development of gestational hypertension and preeclampsia. Front Cardiovasc Med. 2021;8:756140. doi:10.3389/fcvm.2021.756140
37. Palei AC, Spradley FT, Warrington JP, George EM, Granger JP. Pathophysiology of hypertension in pre-eclampsia: a lesson in integrative physiology. Acta Physiol. 2013;208(3):224–233. doi:10.1111/apha.12106
38. Martin JN, Thigpen BD, Moore RC, Rose CH, Cushman J, May W. Stroke and severe preeclampsia and eclampsia: a paradigm shift focusing on systolic blood pressure. Obstet Gynecol. 2005;105(2):246–254. doi:10.1097/01.AOG.0000151116.84113.56
39. Döbert M, Wright A, Varouxaki AN, et al. STATIN trial: predictive performance of competing-risks model in screening for pre-eclampsia at 35–37 weeks’ gestation. Ultrasound Obstet Gynecol. 2022;59(1):69–75. doi:10.1002/uog.24789
 © 2024 The Author(s). This work is published and licensed by Dove Medical Press Limited. The
full terms of this license are available at https://www.dovepress.com/terms
and incorporate the Creative Commons Attribution
- Non Commercial (unported, 3.0) License.
By accessing the work you hereby accept the Terms. Non-commercial uses of the work are permitted
without any further permission from Dove Medical Press Limited, provided the work is properly
attributed. For permission for commercial use of this work, please see paragraphs 4.2 and 5 of our Terms.
© 2024 The Author(s). This work is published and licensed by Dove Medical Press Limited. The
full terms of this license are available at https://www.dovepress.com/terms
and incorporate the Creative Commons Attribution
- Non Commercial (unported, 3.0) License.
By accessing the work you hereby accept the Terms. Non-commercial uses of the work are permitted
without any further permission from Dove Medical Press Limited, provided the work is properly
attributed. For permission for commercial use of this work, please see paragraphs 4.2 and 5 of our Terms.
Recommended articles
Predicting the Risk of Unplanned Readmission at 30 Days After PCI: Development and Validation of a New Predictive Nomogram
Xu W, Tu H, Xiong X, Peng Y, Cheng T
Clinical Interventions in Aging 2022, 17:1013-1023
Published Date: 5 July 2022
Development and Validation of a Nomogram for Predicting 28-Day Mortality on Admission in Elderly Patients with Severe Community-Acquired Pneumonia
Song Y, Wang X, Lang K, Wei T, Luo J, Song Y, Yang D
Journal of Inflammation Research 2022, 15:4149-4158
Published Date: 21 July 2022
Development and Validation of a Prediction Model for Chronic Post-Surgical Pain After Thoracic Surgery in Elderly Patients: A Retrospective Cohort Study
Wu XD, Zeng FF, Yu XX, Yang PP, Wu JP, Xv P, Wang HT, Pei YM
Journal of Pain Research 2022, 15:3079-3091
Published Date: 29 September 2022
An Easy-to-Use Nomogram Based on SII and SIRI to Predict in-Hospital Mortality Risk in Elderly Patients with Acute Myocardial Infarction
Chen Y, Xie K, Han Y, Xu Q, Zhao X
Journal of Inflammation Research 2023, 16:4061-4071
Published Date: 13 September 2023
Risk Factors for Granulomatous Mastitis and Establishment and Validation of a Clinical Prediction Model (Nomogram)
Zeng Y, Zhang D, Fu N, Zhao W, Huang Q, Cui J, Chen Y, Liu Z, Zhang X, Zhang S, Mansoor KM
Risk Management and Healthcare Policy 2023, 16:2209-2222
Published Date: 20 October 2023