Back to Journals » International Journal of General Medicine » Volume 14
A Potential Three-Gene-Based Diagnostic Signature for Hypertension in Pregnancy
Received 3 August 2021
Accepted for publication 28 September 2021
Published 15 October 2021 Volume 2021:14 Pages 6847—6856
DOI https://doi.org/10.2147/IJGM.S331573
Checked for plagiarism Yes
Review by Single anonymous peer review
Peer reviewer comments 3
Editor who approved publication: Dr Scott Fraser
Yan Liu,1 Zhenglu Wang,2 Lin Zhao1
1Department of Obstetrics, Tianjin First Central Hospital, Nankai University, Tianjin, 300192, People’s Republic of China; 2Biobank, Tianjin First Central Hospital, Nankai University, Tianjin, 300192, People’s Republic of China
Correspondence: Lin Zhao
Department of Obstetrics, Tianjin First Central Hospital, Nankai University, No. 24 Fukang Road, Nankai District, Tianjin, 300192, People’s Republic of China
Tel +86 22-85358245
Email [email protected]
Background: Hypertensive disorders of pregnancy affect approximately 5– 10% of all pregnancies, and this study aims to identify potential diagnostic signatures.
Methods: We downloaded the mRNA profiles of GSE75010 (placenta samples) and GSE48424 (blood samples) datasets with or without hypertension in pregnancy from the Gene Expression Omnibus database. Differential expression analysis was performed on the placenta samples using limma package of R language. GO terms and KEGG pathways enrichment analyses were performed on the placenta samples by the clusterProfiler package of R language. Infiltrating immune cell proportion of the placenta samples was evaluated using CIBERSORT software. The key genes involved in hypertension in pregnancy were screened from protein–protein interaction (PPI) network constructed based on the differentially expressed genes (DEGs). The logistic regression model was constructed by the glm package of R language, and receiver operating characteristic (ROC) curve was plotted to determine the accuracy of the model.
Results: For the placenta samples, a total of 104 DEGs were identified, and 39 GO terms and 7 KEGG pathways were significantly enriched based on these 104 genes. Furthermore, the analysis of infiltrating immune cells indicated that the difference in the amount of immune cells might be the potential cause of hypertension in pregnancy. The logistic regression model was constructed based on three optimal genes (LEP, PRL and IGFBP1) screened from PPI network and could efficiently separate patients with hypertension in pregnancy from healthy subjects.
Conclusion: A predictive model based on three potential genes LEP, PRL and IGFBP1 was obtained, suggesting that these genes might be potential diagnostic signatures for hypertension in pregnancy.
Keywords: hypertension in pregnancy, diagnostic signature, GO terms and KEGG pathways analyses, PPI network, logistic regression model
Introduction
Hypertensive disorders of pregnancy have become the second most common cause of direct maternal death, and affect approximately 5–10% of all pregnancies.1,2 Chronic hypertension is defined by SBP ≥ 140mm Hg or DBP ≥ 90 mm Hg before pregnancy or before the 20th week of amenorrhea, and gestational hypertension is defined by SBP ≥ 140mm Hg or DBP ≥ 90mm Hg during or after the 20th week of amenorrhea.3 According to the National High Blood Pressure Education Program (NHBPEP) Working Group on High Blood Pressure in Pregnancy, methyldopa, slow release nifedipine, beta blockers (other than atenolol), labetalol, and a diuretic in pre-existing hypertension have been identified to be appropriate therapeutic drugs for hypertension in pregnancy.4 However, since the blood pressures of many patients are not controlled by these agents, or other intolerable side effects exist, hypertension in pregnancy is still a challenge for the health of pregnant women.5 Therefore, the identification of specific and sensitive diagnostic signatures is urgent, which can contribute to the early diagnosis of hypertension in pregnancy and even expand the window of treatment.
Previous studies have demonstrated that the blood pressure can act as a useful predictive marker for hypertension in pregnancy.6 Recently, a series of biological markers involved in hypertension in pregnancy are identified and may also be considered as potential diagnostic signatures. Sun et al identified four differentially expressed genes including KIR3DL2, AKR1C3, CHURC1, and SLC25A13 between the early onset preeclampsia patients and uncomplicated pregnancies controls, which might be beneficial for the diagnosis of early onset preeclampsia.7 Yuen et al found that TIMP3 was hypomethylated in early onset preeclampsia samples compared with control samples through DNA methylation profiling analysis and could be used as a promising signature for the diagnosis of early onset preeclampsia.8 Compared with normal controls, lncRNA MIR193BHG and lncRNA GATA3-AS1 showed obviously elevated expression levels in early onset preeclampsia samples and exhibited significant value in the diagnosis of this disease.9 Velicky et al demonstrated that pregnancy-associated diamine oxidase was significantly downregulated in early-onset preeclampsia and might be used for the early diagnosis.10 Chaiworapongsa et al analyzed the transcriptomic data of whole blood from patients with late-onset preeclampsia and normal controls, and identified significantly higher expression of CNTNAP3 and lower expression of CCR3 in late-onset preeclampsia samples than those in normal controls.11 Pan et al investigated the relationship between polymorphisms of gene FOXO3 and late-onset preeclampsia, demonstrating that FOXP3 rs2232365 was related to the risk of late-onset preeclampsia, with a possible regulatory role for TG/HDL levels.12 It was found that PTPRN2 had changes in 5-methylcytosine and 5-hydroxymethylcytosine and was associated with the pathogenesis of late-onset preeclampsia,13 providing some references for the diagnostics of this disease. Logistic regression model, often in the presence of other covariates, has been widely used to improve the probability of prediction compared with the predictive markers of single gene.14,15 Although many potential diagnostic signatures have been identified, the research of classification model to diagnose hypertension in pregnancy is still lacking.
In this study, we identified 20 potential genes involved in hypertension in pregnancy though bioinformatics analysis. Then, a predictive model was constructed based on three optimal genes (LEP, PRL and IGFBP1), which could efficiently separate patients with hypertension in pregnancy from healthy subjects, and might be potentially applied for the early diagnosis of hypertension in pregnancy.
Materials and Methods
Data Collection
We downloaded two mRNA profiles including GSE75010 and GSE48424 from the Gene Expression Omnibus database (GEO, https://www.ncbi.nlm.nih.gov/geo/). GSE75010 included 80 placenta samples from patients with hypertension in pregnancy and 77 placenta samples from healthy subjects; GSE48424 included 18 blood samples from patients with hypertension in pregnancy and 18 blood samples from healthy subjects. The quantification of mRNA expression in GSE75010 was performed by using Affymetrix Human Gene 1.0 ST Array, and that in GSE48424 was performed by using Agilent-014850 Whole Human Genome Microarray 4x44K G4112F. The GSE75010 dataset was used to perform the differential expression analysis and the other analyses. The GSE48424 dataset was used as an independent validation set to test the reliability of our model.
Differential Expression Analysis
The mRNA profiles from the datasets were normalized by using Robust Multi-Array Average (RMA) method, and then the standardized data was obtained after log2 transformation. In this study, the mRNA profile of GSE75010 was used to perform the differential expression analysis with the limma function package of R language version 3.5.2.16 The |log 2 (fold change [FC])| > 1.5 and false discovery rate (FDR) ≤ 0.05 were considered as significant thresholds to screen differentially expressed genes (DEGs).
Functional Enrichment Analysis
Gene Ontology (GO) analysis (including biological process, molecular function and cellular component) and Kyoto Encyclopedia of Genes and Genomes (KEGG) pathway enrichment analysis were performed based on the clusterProfiler function package of R language.17 And the DEGs were also subjected to fast gene set enrichment analysis (FGSEA), using fgsea package of R.18 P < 0.05 was considered as the threshold.
Proportion of Infiltrating Immune Cell
The relative proportions of 22 infiltrating immune cells in each sample of the GSE75010 dataset were evaluated using CIBERSORT software,19 which is a method to characterize the composition of immune cells with 547 preset barcode genes based on the deconvolution algorithm according to their gene expression profiles, and the sum of relative percentages of all estimated immune cell types in each sample is 1.
Protein–Protein Interaction (PPI) Networks
STRING database (https://string-db.org/,version 11.0) was used to analyze the functional connections and interactions among proteins,20 and the PPI network was visualized by using Cytoscape (https://cytoscape.org/, version 3.7.2).21 Finally, the key genes of PPI network were screened by using the cytoHubba plug-in of Cytoscape software based on the Maximum neighborhood component (MCC) algorithm.
The Construction of Logistic Regression Model
In GSE75010, the multivariate logistic regression model was constructed by using the glm function package of R language,22 with the expression values of key genes as the continuous predictive variables and the sample type as the categorical responsive value (diseased or non-diseased samples). Then, the GSE48424 dataset was used as the validation set to determine the reliability of the logistic regression model via receiver operating characteristic (ROC) analysis.
Statistical Analysis
The difference in infiltrating immune cells among different groups was calculated by using Wilcoxon rank-sum tests, and P < 0.05 was considered as the significant threshold. Statistical analysis was performed with R software v3.5.2.
Results
The Identification of Differentially Expressed Genes in GSE75010
After standardization of the mRNA profiles in GSE75010, we found that there was no obvious deviation in overall mRNA level among all samples (Figure 1A), suggesting that the data could be used for subsequent analysis. In order to confirm the repeatability of the data within the group, principle component analysis (PCA) was performed and the result showed that the case group (samples with hypertension in pregnancy) and control group (healthy subjects) could be efficiently separated (Figure 1B), indicating a better reproducibility of the data. Then, the differential expression analysis in GSE75010 was performed and a total of 104 differentially expressed genes, including 76 upregulated genes and 28 downregulated genes, were identified between the samples with hypertension in pregnancy and healthy subjects (Figure 1C). Furthermore, the expressions of these 104 genes exhibited significant differences between case group and control group (Figure 1D). These results indicated that the 104 differentially expressed genes might be potentially associated with the development of hypertension in pregnancy.
 |
Figure 1 The identification of differentially expressed genes in GSE75010 dataset. (A) The distribution of gene expression value in each sample after data standardization. The horizontal axis is the sample and the vertical axis is the gene expression value. (B) The PCA analysis. The points with different colors represent samples from different groups, and the closer the distance between two points, the more similar the expression of mRNA in the two samples. (C) The volcano plot of differentially expressed genes between case group and control group. The horizontal axis is Log2 FC, and the vertical axis is -log10 (FDR). The blue points represent upregulated genes, the red points represent downregulated genes. (D) The heatmap of differentially expressed genes between case group and control group. The horizontal axis represents samples, the vertical axis represents genes, the red color indicates high expression, and the blue color indicates low expression. |
Functional Enrichment Analysis
To investigate the processes and metabolic pathways related to the progression of hypertension in pregnancy, the functional enrichment analysis was performed based on the 104 DEGs. The results indicated that there were 26 significantly enriched biological process (BP) terms including cell activation, regulation of p38 MAPK cascade and hormone secretion (P < 0.01), 13 significantly enriched molecular function (MF) terms including hormone activity, growth factor binding and monosaccharide binding (P < 0.05), as well as 7 significantly enriched KEGG pathways including cytokine–cytokine receptor interaction, HIF-1 signaling pathway and neuroactive ligand–receptor interaction (P < 0.05). The full list of significantly enriched GO terms and KEGG pathways is shown in Table S1. In addition, the top 20 most significantly enriched GO terms and related genes involved in the top 12 significantly enriched GO terms are shown in Figure 2A. The significantly enriched KEGG pathways are shown in Figure 2B. Additionally, based on the results of FGSEA, the DEGs in hypertension in pregnancy samples were significantly upregulated in Adipocytokine signaling pathway and other 21 pathways, significantly downregulated in Leukocyte transendothelial migration pathway and other 16 pathways (Figure 2C).
 |
Figure 2 The functional enrichment and immune infiltration analyses in GSE75010 dataset. (A) The histogram of the top 20 most significantly enriched GO terms (the horizontal axis is the number of genes and the vertical axis is the name of GO terms), and the chord chart of genes enriched in the top 10 GO terms (the right semicircle represents the top 10 GO terms, and the left semicircle represents the genes enriched in the 10 GO terms). (B) The histogram of the top 7 most significantly enriched KEGG pathways. The horizontal axis is the number of genes and the vertical axis is the name of KEGG pathways. (C) The FGSEA results of DEGs in samples with hypertension in pregnancy. (D) The relative proportion of infiltrating immune cells in all samples with hypertension in pregnancy. (E) The violin plot of immune cells with significantly different infiltration proportions in samples with hypertension in pregnancy compared with healthy subjects. The horizontal axis is different groups, and the vertical axis is the relative infiltration proportion of immune cells. P value is determined by Wilcoxon test. (F) The PCA analysis of samples based on eight types of immune cells. The dots with different colors represent different types of samples. |
It has been reported that p38 MAPK cascade is closely involved in inflammatory signaling and activated in response to various intracellular and extracellular stimuli, including oxidative stress, cytokines and growth factors.23 Previous studies demonstrated that multiple pathways in the inflammatory microenvironment were used to adjust HIF-1alpha levels to affect macrophage biology, and HIF activation played a crucial role in mammalian immune cells through moderating inflammation.24 In addition, the neuroactive ligand–receptor interaction was identified to participate in synaptic transmission and central nervous system (CNS) disorders, and the related genes could be induced by avian and human H5N1 infections.25 Based on these reports, our results suggested that inflammatory response might be occurred during the progression of hypertension in pregnancy.
Immune Status of Patients with Hypertension in Pregnancy
Immune response occurs during the process of pregnancy. Compared with the non-pregnant women, the immune response of pregnant women is different, which also fluctuates during the process of pregnancy.26 Increasing evidences indicate that immune disorders play important roles in the pathogenesis of hypertensive diseases during pregnancy.27 Then we analyzed the differences of 22 infiltrating immune cell types between different samples from the GSE75010 dataset by combining LM22 eigenmatrix and CIBERSORT method.28 The infiltration of immune cells in the 157 samples from GSE75010 is summarized in Figure 2D, suggesting that the changes in the proportion of infiltrating immune cells among different samples might represent the intrinsic characteristics of individual differences. In addition, eight types of immune cells including Dendritic cells activated, Macrophages M2, Mast cells resting, Neutrophils, NK cells resting, Plasma cells, T cells CD8 and T cells regulatory Tregs were significantly differentially infiltrated in samples with hypertension in pregnancy compared with healthy subjects (Figure 2E), which might account for the development of hypertension in pregnancy. Meanwhile, PCA analysis was performed and the result indicated that the samples could be efficiently divided into two categories (samples with hypertension in pregnancy and normal samples) according to the eight types of immune cells (Figure 2F), which further confirmed that the difference in the amount of immune cells might be the potential cause of hypertension in pregnancy.
The Construction of PPI Network
Next, STRING database was used to construct the PPI network based on the 104 differentially expressed genes, and the interaction pairs of proteins whose minimum required interaction score ≥0.4 were selected and used to reconstruct the PPI network. Then, the new PPI network was visualized by the Cytoscape software (Figure 3A). Then, the analysis of topology structure of the PPI network was performed by Cytoscape software, and each node in PPI network was scored based on the MCC algorithm. The top 20 genes selected according to the score are shown in Figure 3B, in which the darker the color, the more important the node in the network. The full list of these 20 genes is shown in Table S2. The results revealed that these 20 genes were significantly associated with the development of hypertension in pregnancy and might be potential biomarkers.
 |
Figure 3 The construction of PPI network. (A) The PPI network was constructed based on the differentially expressed genes. Each dot represents a node. The more lines connected with the dot, the greater the degree of the node, the more important the gene in the network. (B) The top 20 genes with higher degree in PPI network were screened based on MCC algorithm. The darker the red, the higher the degree. |
The Construction and Evaluation of Logistic Regression Model
Subsequently, the logistic regression model was constructed by using the samples from GSE75010 dataset based on the 20 key genes screened from PPI network, and we found that the P values of LEP, PRL and IGFBP1 were all less than 0.05 (Figure 4A), suggesting that the three genes contributed more to the model. Then, we re-constructed the logistic regression model with LEP, PRL and IGFBP1 and found that this final model conformed to the normality test (Figure S1A); meanwhile, there was a better linear relation between the independent variables (LEP, PRL and IGFBP1) and the dependent variables (sample type: diseased or non-diseased samples) (Figure 4B). In addition, there were no extreme points in the model that affected the accuracy of the model (Figure S1B). To confirm the accuracy of the model, the ROC curves of the model in two datasets were plotted and shown in Figure 4C. The area under curve (AUC) values in the training set (GSE75010) and validation set (GSE48424) were 0.8494 and 0.7346, respectively. These results suggested that the logistic regression model based on LEP, PRL and IGFBP1 could efficiently separate the patients with hypertension in pregnancy from the healthy subjects. Moreover, the model showed reliable value not only in the unattainable placenta samples but also in the accessible blood samples.
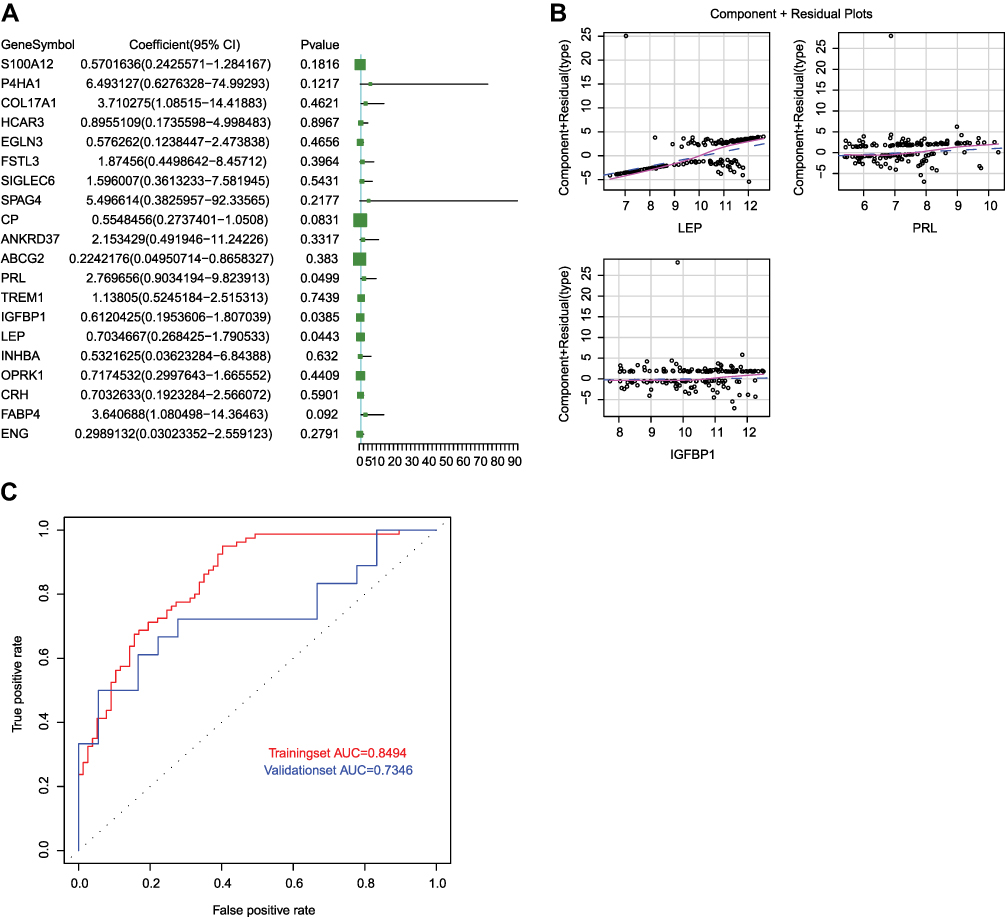 |
Figure 4 The construction of logistic regression model. (A) The volcano plot of 20 genes screened from PPI network in the model. P < 0.05 indicated that the gene contributed more to the model. (B) The component plus residual plot of LEP, PRL and IGFBP1 in the model. The obvious linear relationship between the horizontal axis and the vertical axis indicated that the independent variables were suitable to be included in the model. (C) The ROC curves of logistic regression model in GSE75010 and GSE48424 datasets. The horizontal axis indicates false positive rate (FPR), and the vertical axis indicates true positive rate (TPR). The AUC value is the area under the curve and can intuitively evaluate the quality of the model, the larger the AUC value, the better the model. |
Discussion
According to the severity of disease, hypertension in pregnancy is divided into mild, moderate and severe hypertension in pregnancy, of which, severe pregnancy hypertension syndrome is a crucial feature of preeclampsia.29 Placenta is the key organ involved in preeclampsia,30 and the identification of differentially expressed genes between normotensive and preeclamptic placentas is crucial to understand the molecular mechanism of the disease, contributing to the development of efficient biomarkers or therapeutic targets. In this study, we analyzed the gene expression profiles of placenta samples between patients with hypertension in pregnancy and normal controls, and identified 104 differentially expressed genes, suggesting that these differentially expressed genes might be potentially associated with the occurrence and development of hypertension in pregnancy.
Increasing evidences have indicated that preeclampsia is a severe gestation disorder which is characterized by significant inflammation in the maternal body that affects the work of the monocyte-macrophage system.31 In the last decades, many risk genes regulated the process of inflammatory response have been found to affect the progression of hypertension in pregnancy. These findings may provide potential biomarkers for hypertension in pregnancy. For instance, the expression of nectin-4 was significantly elevated in preeclamptic placentas relative to uncomplicated pregnancies, and natural killer (NK) cells exhibited a potent cytotoxic effect against nectin-4 overexpressing trophoblast cells.32 Vinnars et al found that an inflammatory cytokine NKG2D was upregulated and combined with a dysregulated regulatory response in the placenta of preeclampsia.33 Chen et al indicated that the serum level of cytokine IL-10 in preeclamptic patients was significantly lower than that in normal pregnant women, suggesting the contribution of regulatory T cells to immune tolerance in preeclampsia.34 In addition, Chatterjee et al found that co-treatment with interleukin 4 and interleukin 10 could regulate immune cells and then prevent hypertension in pregnant mice.35 These reports confirm that inflammatory response plays an important role in the progression of hypertension in pregnancy. Here, the GO term and KEGG pathway enrichment analyses were performed based on 104 differentially expressed genes, and the results showed several inflammation-related functions or pathways such as cytokine–cytokine receptor interaction, neuroactive ligand–receptor interaction and regulation of p38 MAPK cascade were enriched. Meanwhile, the relative proportions of eight types of infiltrating immune cells, including Dendritic cells activated, Macrophages M2, Mast cells resting, Neutrophils, NK cells resting, Plasma cells, T cells CD8 and T cells regulatory Tregs, exhibited significant differences in samples with hypertension in pregnancy compared with healthy subjects. All these data suggest that a strong inflammatory reaction may occur during the development of hypertension in pregnancy.
PPI network is a viable tool to understand cell functions, disease machinery, and drug design/repositioning.36 In the present study, 20 key genes with higher scores in the PPI network were screened to construct the logistic regression model. To construct the model with stronger explanation, we optimized three genes LEP, PRL and IGFBP1 with P value less than 0.05. Leptin (LEP) has been demonstrated to induce hypertension through acting on transient receptor potential Melastatin 7 channel in the carotid body.37 Hypomethylation of LEP gene was identified in early-onset preeclampsia, and the expression level of LEP was elevated.38 The protein product leptin of LEP was obviously increased in the serum of patients with preeclampsia in comparison to those with normotensive pregnancy.39 It was found that the hypomethylation of PRL could contribute to increased expression of prolactin in prolactinomas cases,40 however, to our knowledge, PRL hypomethylation has not been reported in patients with hypertension in pregnancy. Prolactin, encoded by PRL, is a 23 kDa polypeptide hormone mainly secreted by the pituitary gland, and has multiple functions, such as regulating lactogenesis, balancing salt and water, modulation of cell proliferation, etc.41 Compared with normal controls, the prolactin level in preeclampsia patients was obviously elevated,42–44 implying that prolactin was associated with the hypertension in pregnancy. As far as we know, the hypomethylated IGFBP1 has not been investigated in patients with hypertension in pregnancy. Fang et al demonstrated that the genetic variant of IGFBP1 was closely associated with an increased risk of hypertension, and lower IGF-binding protein 1 (encoded by IGFBP1) level in serum might predict an increased risk of hypertension.45 IGF-binding protein 3 (encoded by IGFBP3) belongs to the family of IGF binding proteins and is elevated during the process of pregnancy, with suppressive effects on the growth of cells.46 Compared with healthy controls, the serum level of IGF-binding protein 3 was obviously reduced in the patients with preeclampsia.47 These studies indicate that the three genes are potentially related to the development of hypertension in pregnancy. Subsequently, the logistic regression model was constructed by bringing into the three genes and could efficiently separate patients with hypertension in pregnancy from healthy subjects for both placenta samples and blood samples.
Although our study suggests that the three genes LEP, PRL and IGFBP1 may be potential diagnostic signatures for hypertension in pregnancy, their specific functions need to be explored in the future.
Conclusion
In summary, based on the publicly accessible data in GEO database, we have identified 3 crucial genes, including LEP, PRL and IGFBP1, which probably play vital roles in hypertension in pregnancy. Moreover, a prognostic signature based on these genes is constructed.
Data Sharing Statement
The datasets analyzed for this study can be found in the [GSE75010].
Funding
This work was supported by the Science & Technology Fund of Tianjin Health Committee [grant number 2015KZ021, Yan Liu]; the Chunfeng Science & Technology Fund of Tianjin First Central Hospital [grant number FCHCF201804]; and the Tianjin Health Industry High Level Talent and Training Project (2018) [grant number Young Talent Program].
Disclosure
The authors report no conflicts of interest in this work.
References
1. Vest AR, Cho LS. Hypertension in pregnancy. Curr Atheroscler Rep. 2014;16(3):395. doi:10.1007/s11883-013-0395-8
2. Kintiraki E, Papakatsika S, Kotronis G, Goulis DG, Kotsis V. Pregnancy-induced hypertension. Hormones (Athens). 2015;14(2):211–223. doi:10.14310/horm.2002.1582
3. Fauvel JP. [Hypertension during pregnancy: epidemiology, definition]. Presse Med. 2016;45(7–8 Pt 1):618–621. French. doi:10.1016/j.lpm.2016.05.015
4. Hopkins M. Report of the national high blood pressure education program working group on high blood pressure in pregnancy. Am J Obstet Gynecol. 2000;183(1):S1–S22. doi:10.1016/S0002-9378(00)99785-0
5. Brown CM, Garovic VD. Drug treatment of hypertension in pregnancy. Drugs. 2014;74(3):283–296. doi:10.1007/s40265-014-0187-7
6. Iino K, Higuchi T, Ogawa M, et al. Blood pressure during pregnancy is a useful predictive marker for hypertension and dyslipidemia later in life, a population-based, cross-sectional study. Maturitas. 2016;87:84–88. doi:10.1016/j.maturitas.2016.02.012
7. Sun CJ, Zhang L, Zhang WY. Gene expression profiling of maternal blood in early onset severe preeclampsia: identification of novel biomarkers. J Perinat Med. 2009;37(6):609–616. doi:10.1515/JPM.2009.103
8. Yuen RK, Penaherrera MS, von Dadelszen P, McFadden DE, Robinson WP. DNA methylation profiling of human placentas reveals promoter hypomethylation of multiple genes in early-onset preeclampsia. Eur J Hum Genet. 2010;18(9):1006–1012. doi:10.1038/ejhg.2010.63
9. Zhang Z, Wang P, Zhang L, et al. Identification of key genes and long noncoding RNA-associated competing endogenous RNA (ceRNA) networks in early-onset preeclampsia. Biomed Res Int. 2020;2020:1673486.
10. Velicky P, Windsperger K, Petroczi K, et al. Pregnancy-associated diamine oxidase originates from extravillous trophoblasts and is decreased in early-onset preeclampsia. Sci Rep. 2018;8(1):6342. doi:10.1038/s41598-018-24652-0
11. Chaiworapongsa T, Romero R, Whitten A, et al. Differences and similarities in the transcriptional profile of peripheral whole blood in early and late-onset preeclampsia: insights into the molecular basis of the phenotype of preeclampsiaa. J Perinat Med. 2013;41(5):485–504. doi:10.1515/jpm-2013-0082
12. Pan X, Wei B, Wang H, Ma L, Du Z, Chen Y. Novel association between FOXO3 rs2232365 polymorphism and late-onset preeclampsia: a case-control candidate genetic study. BMC Pregnancy Childbirth. 2020;20(1):779. doi:10.1186/s12884-020-03479-6
13. Zhu L, Lv R, Kong L, Cheng H, Lan F, Li X. Genome-wide mapping of 5mC and 5hmC identified differentially modified genomic regions in late-onset severe preeclampsia: a pilot study. PLoS One. 2015;10(7):e0134119. doi:10.1371/journal.pone.0134119
14. Kim S, Heath E, Heilbrun L. Sample size determination for logistic regression on a logit-normal distribution. Stat Methods Med Res. 2017;26(3):1237–1247. doi:10.1177/0962280215572407
15. Garcia TP, Marder K, Wang Y. Statistical modeling of Huntington disease onset. Handb Clin Neurol. 2017;144:47–61.
16. Bonte C, Vercauteren F. Privacy-preserving logistic regression training. BMC Med Genomics. 2018;11(Suppl 4):86. doi:10.1186/s12920-018-0398-y
17. Ritchie ME, Phipson B, Wu D, et al. limma powers differential expression analyses for RNA-sequencing and microarray studies. Nucleic Acids Res. 2015;43(7):e47. doi:10.1093/nar/gkv007
18. Korotkevich G, Sukhov V, Sergushichev A. Fast gene set enrichment analysis. bioRxiv. 2019;1:060012.
19. Yu G, Wang LG, Han Y, He QY. clusterProfiler: an R package for comparing biological themes among gene clusters. OMICS. 2012;16(5):284–287. doi:10.1089/omi.2011.0118
20. Newman AM, Liu CL, Green MR, et al. Robust enumeration of cell subsets from tissue expression profiles. Nat Methods. 2015;12(5):453–457. doi:10.1038/nmeth.3337
21. Szklarczyk D, Gable AL, Lyon D, et al. STRING v11: protein-protein association networks with increased coverage, supporting functional discovery in genome-wide experimental datasets. Nucleic Acids Res. 2019;47(D1):D607–D613. doi:10.1093/nar/gky1131
22. Shannon P, Markiel A, Ozier O, et al. Cytoscape: a software environment for integrated models of biomolecular interaction networks. Genome Res. 2003;13(11):2498–2504. doi:10.1101/gr.1239303
23. Friedman J, Hastie T, Tibshirani R. Regularization paths for generalized linear models via coordinate descent. J Stat Softw. 2010;33(1):1–22. doi:10.18637/jss.v033.i01
24. Reustle A, Torzewski M. Role of p38 MAPK in atherosclerosis and aortic valve sclerosis. Int J Mol Sci. 2018;19:12. doi:10.3390/ijms19123761
25. Dehne N, Brune B. HIF-1 in the inflammatory microenvironment. Exp Cell Res. 2009;315(11):1791–1797. doi:10.1016/j.yexcr.2009.03.019
26. Shah NM, Imami N, Johnson MR. Progesterone modulation of pregnancy-related immune responses. Front Immunol. 2018;9:1293. doi:10.3389/fimmu.2018.01293
27. Lin X, Wang R, Zhang J, et al. Insights into human astrocyte response to H5N1 infection by microarray analysis. Viruses. 2015;7(5):2618–2640. doi:10.3390/v7052618
28. Pinheiro TV, Brunetto S, Ramos JG, Bernardi JR, Goldani MZ. Hypertensive disorders during pregnancy and health outcomes in the offspring: a systematic review. J Dev Orig Health Dis. 2016;7(4):391–407. doi:10.1017/S2040174416000209
29. Steegers EA, von Dadelszen P, Duvekot JJ, Pijnenborg R. Pre-eclampsia. Lancet. 2010;376(9741):631–644.
30. Steegers EA, von Dadelszen P, Duvekot JJ, Pijnenborg R. Pre-eclampsia. Lancet. 2010;376(9741):631–644.
31. Vishnyakova P, Elchaninov A, Fatkhudinov T, Sukhikh G. Role of the monocyte-macrophage system in normal pregnancy and preeclampsia. Int J Mol Sci. 2019;20:15. doi:10.3390/ijms20153695
32. Ito M, Nishizawa H, Tsutsumi M, et al. Potential role for nectin-4 in the pathogenesis of pre-eclampsia: a molecular genetic study. BMC Med Genet. 2018;19(1):166. doi:10.1186/s12881-018-0681-y
33. Vinnars MT, Bjork E, Nagaev I, et al. Enhanced Th1 and inflammatory mRNA responses upregulate NK cell cytotoxicity and NKG2D ligand expression in human pre-eclamptic placenta and target it for NK cell attack. Am J Reprod Immunol. 2018;80(1):e12969. doi:10.1111/aji.12969
34. Chen J, Zhao L, Wang D, et al. Contribution of regulatory T cells to immune tolerance and association of microRNA210 and Foxp3 in preeclampsia. Mol Med Rep. 2019;19(2):1150–1158.
35. Chatterjee P, Chiasson VL, Seerangan G, et al. Cotreatment with interleukin 4 and interleukin 10 modulates immune cells and prevents hypertension in pregnant mice. Am J Hypertens. 2015;28(1):135–142. doi:10.1093/ajh/hpu100
36. Vella D, Marini S, Vitali F, Di Silvestre D, Mauri G, Bellazzi R. MTGO: PPI network analysis via topological and functional module identification. Sci Rep. 2018;8(1):5499. doi:10.1038/s41598-018-23672-0
37. Shin MK, Eraso CC, Mu YP, et al. Leptin induces hypertension acting on transient receptor potential melastatin 7 channel in the carotid body. Circ Res. 2019;125(11):989–1002. doi:10.1161/CIRCRESAHA.119.315338
38. Hogg K, Blair JD, von Dadelszen P, Robinson WP. Hypomethylation of the LEP gene in placenta and elevated maternal leptin concentration in early onset pre-eclampsia. Mol Cell Endocrinol. 2013;367(1–2):64–73. doi:10.1016/j.mce.2012.12.018
39. Kalinderis M, Papanikolaou A, Kalinderi K, Vyzantiadis TA, Ioakimidou A, Tarlatzis BC. Serum levels of leptin and IP-10 in preeclampsia compared to controls. Arch Gynecol Obstet. 2015;292(2):343–347. doi:10.1007/s00404-015-3659-4
40. Neidhart M. DNA Methylation in Pituitary Diseases - ScienceDirect. In: DNA Methylation and Complex Human Disease; 2016:215–228.
41. Chang AS, Grant R, Tomita H, Kim HS, Smithies O, Kakoki M. Prolactin alters blood pressure by modulating the activity of endothelial nitric oxide synthase. Proc Natl Acad Sci USA. 2016;113(44):12538–12543. doi:10.1073/pnas.1615051113
42. Leanos-Miranda A, Marquez-Acosta J, Cardenas-Mondragon GM, et al. Urinary prolactin as a reliable marker for preeclampsia its severity, and the occurrence of adverse pregnancy outcomes. J Clin Endocrinol Metab. 2008;93(7):2492–2499.
43. Gonzalez C, Parra A, Ramirez-Peredo J, et al. Elevated vasoinhibins may contribute to endothelial cell dysfunction and low birth weight in preeclampsia. Lab Invest. 2007;87(10):1009–1017. doi:10.1038/labinvest.3700662
44. Nakajima R, Ishida M, Kamiya CA, et al. Elevated vasoinhibin derived from prolactin and cathepsin D activities in sera of patients with preeclampsia. Hypertens Res. 2015;38(12):899–901. doi:10.1038/hr.2015.99
45. Fang Z, Yang S, Zhu L, et al. Association study of IGFBP1 and IGFBP3 polymorphisms with hypertension and cardio-cerebral vascular diseases in a Chinese Han population. Oncotarget. 2017;8(44):77836–77845. doi:10.18632/oncotarget.20839
46. Inan S, Vatansever S, Kuscu NK, Lacin S, Ozbilgin K, Koyuncu F. Immunohistochemical staining of IGF-I, IGF-binding proteins-1 and −3, and transforming growth factor beta-3 in the umbilical cords of preeclamptic patients. Acta Obstet Gynecol Scand. 2002;81(8):772–780. doi:10.1034/j.1600-0412.2002.810815.x
47. Wang HS, Lee JD, Cheng BJ, Soong YK. Insulin-like growth factor-binding protein 1 and insulin-like growth factor-binding protein 3 in pre-eclampsia. Br J Obstet Gynaecol. 1996;103(7):654–659. doi:10.1111/j.1471-0528.1996.tb09833.x
 © 2021 The Author(s). This work is published and licensed by Dove Medical Press Limited. The
full terms of this license are available at https://www.dovepress.com/terms
and incorporate the Creative Commons Attribution
- Non Commercial (unported, 3.0) License.
By accessing the work you hereby accept the Terms. Non-commercial uses of the work are permitted
without any further permission from Dove Medical Press Limited, provided the work is properly
attributed. For permission for commercial use of this work, please see paragraphs 4.2 and 5 of our Terms.
© 2021 The Author(s). This work is published and licensed by Dove Medical Press Limited. The
full terms of this license are available at https://www.dovepress.com/terms
and incorporate the Creative Commons Attribution
- Non Commercial (unported, 3.0) License.
By accessing the work you hereby accept the Terms. Non-commercial uses of the work are permitted
without any further permission from Dove Medical Press Limited, provided the work is properly
attributed. For permission for commercial use of this work, please see paragraphs 4.2 and 5 of our Terms.