")
Back to Journals » Journal of Inflammation Research » Volume 16
A Pilot Study About the Role of PANoptosis-Based Genes in Atherosclerosis Development
Authors Chen H , Xie X, Xiao H, Liang W, Lin ZJ, Lin B, Lin KY, Chen C , Guo Y
Received 20 October 2023
Accepted for publication 19 December 2023
Published 22 December 2023 Volume 2023:16 Pages 6283—6299
DOI https://doi.org/10.2147/JIR.S442260
Checked for plagiarism Yes
Review by Single anonymous peer review
Peer reviewer comments 2
Editor who approved publication: Dr Adam D Bachstetter
HongKui Chen,1,2,* Xianwei Xie,2,3,* Huazhen Xiao,1,2,* Wenjia Liang,1,2 Zhi-Jie Lin,1,2 Biting Lin,2,3 Kai-Yang Lin,2,3 Chun Chen,4 Yansong Guo1,2
1Department of Cardiology, Shengli Clinical Medical College of Fujian Medical University, Fujian Provincial Hospital, Fuzhou, Fujian Province, 350000, People’s Republic of China; 2Fujian Provincial Key Laboratory of Cardiovascular Disease, Fujian Provincial Center for Geriatrics, Fujian Provincial Clinical Research Center for Severe Acute Cardiovascular Diseases, Fuzhou, Fujian Province, 350000, People’s Republic of China; 3Fujian Heart Failure Center Al liance, Fuzhou, Fujian Province, 350000, People’s Republic of China; 4School of Pharmacy, Fujian Medical University, Fuzhou, Fujian Province, 350000, People’s Republic of China
*These authors contributed equally to this work
Correspondence: Yansong Guo; Chun Chen, Email [email protected]; [email protected]
Background: As a chronic inflammatory disease, atherosclerosis (AS) and ischemia events are primarily affected by inflammation in AS. PANoptosis has been implicated in many human systemic disorders, including infection, cancer, neurodegeneration, and inflammation. On the other hand, little is understood about PANoptosis’s function in AS.
Methods: We used consensus clustering to divide the GSE100927 dataset into two panoptosis-related subgroups. PANoptosis-associated genes were screened by differential analysis and weighted gene co-expression network analysis (WGCNA) and enriched by ClueGO software. Investigating LASSO regression and MCODE to identify AS Diagnostic Markers. Immunoinfiltration analysis and single-cell analysis were used to search for cell types associated with the diagnostic genes. Final validation was performed by polymerase chain reaction (PCR).
Results: We classified the GSE100927 dataset into two PANoptosis-related subtypes based on the expression of PANoptosis-related genes (PRGs) using consensus clustering. A total of 36 PANoptosis-associated genes were screened in the differentially expressed genes and WGCNA-related module. 4 hub genes were identified by MCODE and LASSO regression, and 3 AS diagnostic markers (ACP5, CCL3, HMOX1) were screened by external validation set. Immunoinfiltration analysis and single-cell analysis showed that the three diagnostic markers were associated with macrophages, and PCR results demonstrated that ACP5 and HMOX1 could be used as AS diagnostic markers.
Conclusion: Our study identified ACP5 and HMOX1 as diagnostic genes for AS that may be associated with PANoptosis. ACP5 and HMOX1 may be involved in the pathogenesis of AS by regulating macrophage PANoptosis.
Keywords: atherosclerosis, PANoptosis, macrophage, subtypes
Introduction
About two-thirds of fatalities from cardiovascular disease (CVD) are attributable to atherosclerotic cardiovascular disease (ASCVD), with ischemic atherosclerosis (AS) stroke and coronary heart disease being the main causes of disability.1,2 AS is an inflammatory disease of the major arteries and is an important underlying mechanism of CVD and stroke, primarily characterized by lipid accumulation and arterial inflammation.3 Thrombosis, luminal stenosis, and plaque rupture all restrict blood flow and cause a variety of severe adverse cardiovascular events (MACE). The potential of ASCVD to reduce life expectancy is highlighted by increasing mortality rates in middle-aged and elderly patients. Most patients with early ASCVD have modifiable risk factors before the onset of the disease. Therefore, early intervention is crucial.4 A thorough understanding of the pathogenesis of AS and the identification of novel targets have significant implications for future therapeutic strategies.
Cell death can occur in an uncontrolled manner (necrosis) or in a programmed manner (PCD). In addition to being a newly recognized type of proinflammatory PCD, pyroptosis, apoptosis, and necroptosis are the three types of cell death that are highlighted by PANoptosis.5,6 PANoptosis encompasses the fundamental characteristics of these three PCD modes but cannot be explained by any one of them alone.7 The multiprotein complex known as the PANoptosome, which controls PANoptosis, promotes communication and modulation between these processes.7,8 Current investigations have revealed that essential molecules for pyroptosis, apoptosis, and necroptosis, such as gasdermin D (GSDMD), caspase 1, caspase 3, caspase 8, RIP kinase 1 (RIPK1), and RIP kinase 3 (RIPK3), are present in the PANoptosome and can activate their respective pathways to cause cell death.9 Consequently, when one or more PCD pathways are blocked by pathogens or other obstacles, PANoptosis can take over to activate cell death defense mechanisms.7 Damage-associated molecular patterns (DAMPs) generated by PANoptosis-activated cells, together with downstream cell factors like IL-1 and IL-18, operate as alarms to start and enhance the inflammation response.7 Although PANoptosis is closely associated with initiating and progressing inflammatory diseases, its role in AS is still not entirely understood. For the first time, the molecular subtypes and genes of PANoptosis linked to AS were thoroughly assessed in this work, highlighting PANoptosis’ significant contribution to the pathophysiological process of AS. This will provide potential therapeutic targets for the diagnosis and therapy of AS.
Materials and Methods
Data Gathering
The Gene Expression Omnibus (GEO) database, which can be accessed at http://www.ncbi.nlm.nih.gov/geo, was used in this investigation. GSE100927 (AS = 69, control = 35), GSE43292 (AS = 32, control = 32), and GSE159677 provided the microarray data. The training and external validation sets were GSE100927 and GSE43292, respectively. The single cell set used for validation was GSE159677. 66 PANoptosis process genes in total were gathered from earlier research.10
DEG Identification
On the basis of normalized count data, the differentially expressed genes (DEGs) in GSE100927 were discovered using the Limma R tool. Samples in GSE100927 were obtained from human carotid, femoral, and infrapopliteal arteries with and without atherosclerotic lesions. Carotid (29 cases), femoral (26 cases), infrapopliteal (14 cases), and normal control (35 cases). The inferior iliac artery (IPA) samples came from more highly atherosclerotic diseased arteries, whereas the carotid artery (CA) and femoral artery (FA) samples were from vessels with less severe atherosclerosis disease. DEGs were screened using the parameters |Log2fold change| >0.6 and adj. P 0.05. Additionally, heat maps and volcano plots of DEGs were produced from the databases using the R programs pheatmap and ggplot2.
Network of Protein-Protein Interactions (PPI)
The PPI network was built using the STRING database (https://cn.string-db.org). “Homo” was the “organism” employed, and “medium confidence” was the “minimum necessary interaction score”. The PPI network was visualized using Cytoscape. The outcomes of the GO-BP study of the PANoptosis process genes were analyzed and mapped using the SangerBox portal (http://SangerBox.com/Tool). The distinct gene signatures in the PANoptosis-related genes were discovered utilizing the protein-protein interaction (PPI) network and cluster analysis in the Cytoscape software (version: 3.9.1, http://cytoscape.org) using the “MCODE” algorithm with default parameters. The grouped genes with the best scores were the main emphasis.
Analysis of Consensus Clustering
Consensus clustering analysis of atherosclerosis specimens were carried out using the ConsensusClusterPlus program using PANoptosis process genes with adjusted p 0.05 under the following conditions: Item resampling, 80% of items to sample; gene resampling, 80% of features to sample; maximum evaluated k, maximum clustering number to evaluate: 9; resampling, 1000 subsamples; agglomerative hierarchical clustering algorithm): “hc” (hclust); and distance: “Pearson” (1 - Pearson correlation). Through principal component analysis (PCA), the subtype classification based on PANoptosis was confirmed.
Weighted Gene Co-Expression Network Analyses
Using the WGCNA package, the expression profiling from the GSE100927 datasets was retrieved to perform WGCNA. For the purpose of determining whether there were any outlier specimens, sample clustering was used. The soft threshold power value for building a scale-free topology network was established. The topological overlap matrix (TOM) was then created from the adjacency matrix. Different co-expression modules were clustered in accordance with the TOM-based dissimilarity. Then, associations between modules and subtypes based on PANoptosis were assessed. The genes in this module were considered to be PANoptosis-based-related genes after the module with the best association to PANoptosis-based subtypes was evaluated.
Functional Enrichment Analyses
ClueGO is a Cytoscape plugin that enables categorization and network visualization of non-redundant GO terms. Using ClueGO, a biological investigation of these shared genes was carried out to investigate their possible contribution to AS and PANoptosis-based subtypes. The GO analysis was concentrated on the biological process. The p-value <0.05 was considered significant.
ROC Curve Analysis
Each hub gene examined in the GSE100927 and GSE43292 datasets underwent Receiver Operating Characteristic (ROC) curve analysis to ensure accuracy. The ROC curves were analyzed using the pROC program. The hub genes with AUC> 0.7 were taken into consideration as the disease diagnosis criterion.
LASSO Model Selection Procedure Construction
LASSO regression can be used to look for AS diagnostic indicators. The LASSO implementation made use of the glmnet package. Alpha was set to 1 and the response type was binomial. In order to assess the prediction power, receiver operating characteristic (ROC) curves were employed.
Analysis of Immune Cell Invasion
Using the CIBERSORT algorithm (http://cibersort.stanford.edu/), the abundance of 22 immune cell subtypes was determined from sequencing data from atherosclerotic samples. These subtypes are based on atherosclerosis (AS) and PANoptosis, and Spearman correlation analysis was done on genes and immune cells. These samples were obtained from human carotid, femoral, and infrapopliteal arteries with and without atherosclerotic lesions. They represent the cellular composition of the immune milieu. Using Monte Carlo sampling, CIBERSORT calculates a p-value for the deconvolution of each sample, indicating the degree of confidence in the findings. 104 samples of the estimated fractions of immune cell types generated by CIBERSORT were deemed accurate at a cutoff of p<0.05.11
Single-Cell Analysis
We used patient-matched proximal adjacent (PA) section transcriptome data from GSE159677 and atherosclerotic core (AC) plaques. Then, we used the “Seurat”, “stringr”, “dplyr”, “gtable”, “cowplot”, “gridExtra”, and “Matrix” R packages to carry out the single-cell analysis.
Study of Single-Gene Gene Sets for Enrichment
In order to investigate the biological roles of biomarkers, KEGG pathway analysis using the R program “clusterProfler” was used. P-values < 0.05 were considered significant pathways.
Cell Culture
The mouse cell line RAW264.7 (CL-0190) were purchased from Procell. RAW264.7 macrophages were grown in Dulbecco’s Modified Eagle’s Medium (DMEM) at 37°C with a humidified environment of 5% CO2 and 10% heat-inactivated fetal bovine serum (FBS), 100 units/mL penicillin, 100 g/mL streptomycin, and 2 mM L glutamine.
Assay for Foam Cell Generation
OxLDL (YESEN, 20605ES05), 100 g/mL, was treated with macrophages for 48 hours. Oil red O stock solution (Solarbio, G1260) and distilled water were combined at a 3:2 ratio to create oil red O working solution, which was then allowed to stand for 10 min. After being cleaned with PBS, the cells were fixed with 4% paraformaldehyde for 10 minutes, incubated with 60% isopropanol for 1 minute, then stained with oil red O working solution for 30 minutes.
Quantitative RT-PCR
Cells treated with Oxidized Low Density Lipoprotein (ox-LDL) (100 ng/mL) for 48 hours (AS group) and cells treated with full media for 48 hours (control group) both had their total RNA harvested. (SteadyPure Mag Tissue & Cells RNA Extraction Kit (Accurate Biology, AG21023, China)). With the use of the Evo M-MLV Mix Kit with gDNA Clean for qPCR (Accurate Biology, AG11728, China), the extracted total RNA was reverse-transcribed into cDNA. SYBR Green Premix Pro Taq HS qPCR Kit (Accurate Biology, AG11701, China) was used for the amplification. β-Actin was used as the internal reference for mRNA qPCR. The significance of differences was verified using the independent-sample t-test. It was deemed statistically significant when P < 0.05. The primer sequences of the studied genes are as follows: (forward primer) 5′-TGTCCACCTTCCAGCAGATGT-3′ and (reverse primer) 5′-AGCTCAGTAACAGTCCGCCTAG-3′ for β-actin; (forward primer) 5′GAAGATTCCACGCCAATTCATC-3′ and (reverse primer) 5′-GCATTCAGTTCCAGGTCAGT-3′ for CCL3; (forward primer) 5′-CACTCCCACCCTGAGATTTGT-3′ and (reverse primer) 5′-CATCGTCTGCACGGTTCTG-3′ for ACP5; (forward primer) 5′-CAGAAGAGGCTAAGACCGCC-3′ and (reverse primer) 5′CTCTGACGAAGTGACGCCAT-3′ for HMOX1.
Statistical Analysis
Statistical analyses for data of our experiments were performed with the Prism software (GraphPad Software, La Jolla, CA). We generated the gene expression Log2FC using the delta delta Ct technique. Additionally, the independent-sample t-test was used to validate the significant differences; *** represents P < 0.001, ** represents P < 0.01, and * represents P < 0.05.
Result
Analyses of Atherosclerosis Specific PANoptosis Genes
We have gathered the genes related to PANoptosis based on prior research, as depicted in Figure 1A. Necroptosis, pyroptosis, and apoptosis are all processes involving these genes. Our study collected the atherosclerosis expression profile dataset (GSE100927), and to identify atherosclerosis specific PANoptosis genes, differential expression analysis was performed, based on |log2FC| ≥ 0.6, adjP < 0. 05 (Figure 1B), was performed in atherosclerotic samples compared to non-atherosclerotic controls (Figure 1C) and the expression of these 10 genes was shown in a heatmap (Figure 1D). Figure 1E shows the PPI network of several PANoptosis genes. These genes are mostly involved in the apoptotic signaling pathway, programmed necrotic cell death, necrotic cell death necroptotic process, i kappab kinase nf kappab signaling, and apoptotic process, according to a GO analysis of biological processes (Figure 1F).
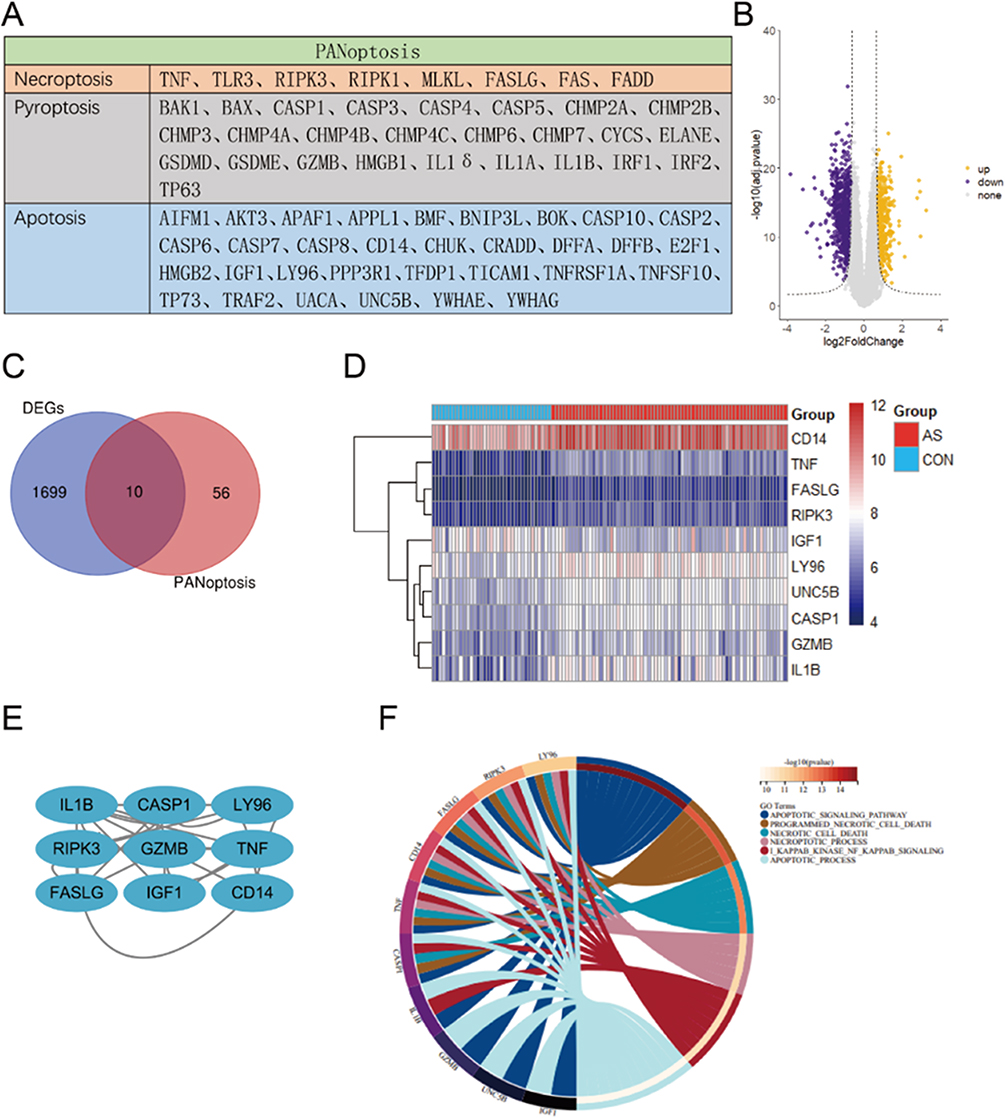 |
Figure 1 Analyses of atherosclerosis specific PANoptosis Genes. (A) The PANoptosis gene list contains 66 genes, of which 26 are from pyroptosis, 32 are from apoptosis, and 8 are from necroptosis. (B) Volcano plot of DEGs in GSE100927. (C) Venn diagrams of the DEGs and PANoptosis genes. (D) Heatmaps of 10 PANoptosis genes that may be associated with atherosclerosis. (E) An interaction network of 10 PANoptosis genes. (F) The first six biological processes of 10 PANoptosis genes. |
Establishment of PANoptosis-Based Subtypes for Atherosclerosis
A low value of PAC denotes a middle segment that is flat and a low frequency of assignments that differ between permuted clustering runs. The K value with the lowest PAC allows us to calculate the ideal number of clusters. K value is 2 as a result. A constant matrix heatmap for k=2 is shown in Figure 2A. We found that the atherosclerotic samples could be clearly classified into two subtypes based on the PANoptosis genes, namely C1 and C2. Consistent cumulative distribution (CDF) plots show that the CDF reaches an approximate maximum value at k=2 (Figure 2B). The area under the CDF curve only slightly increased when k=3, as indicated in the delta area plot, making 2 a reasonable k number (Figure 2D). In order to see the classification of the samples, a tracking plot was also created. Classification was relatively stable when k=2 (Figure 2C). For these reasons, two subtypes based on the PANoptosis gene were finally identified in the atherosclerotic samples. The accuracy of this classification was verified by principal component analysis plots. In Figure 2E, the atherosclerotic samples were clearly divided into two subtypes. The differentially expressed genes in the two PANoptosis gene-based subtypes were analyzed, and 51 differentially expressed genes were identified in the two subgroups according to |log2FC|≥1.7, adjP<0.05, and these genes were regarded as distinct marker genes for each subtype (Figure 2F).
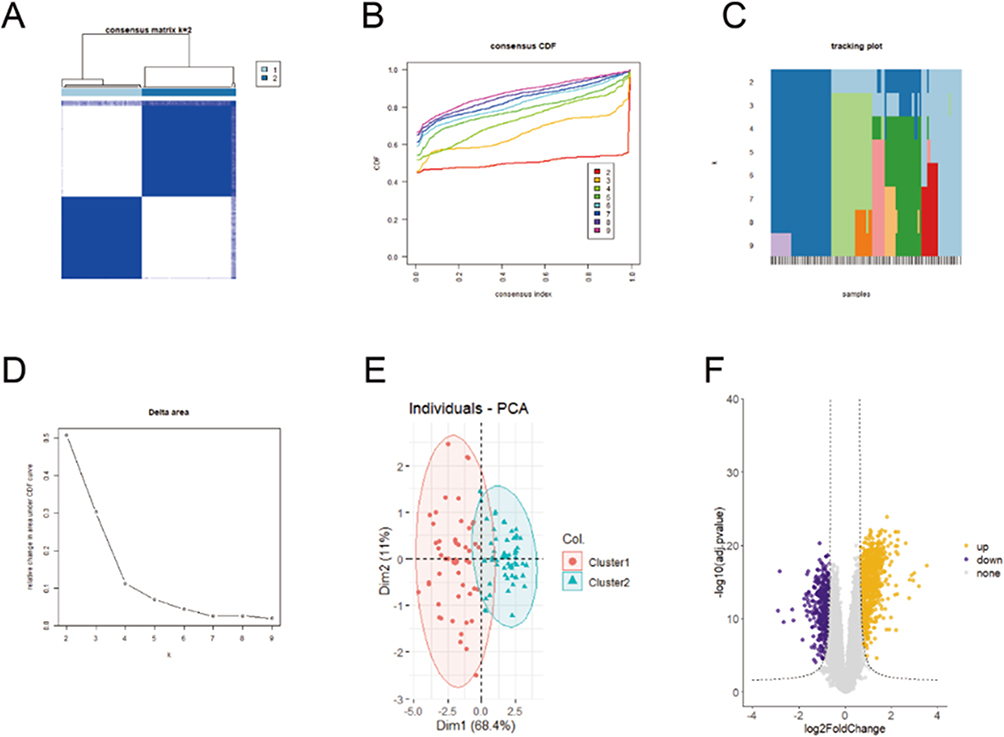 |
Figure 2 Establishment of PANoptosis-based subtypes for atherosclerosis. (A) Consensus matrix heatmap at k = 2. The rows and columns are samples, with consensus values on a white to blue color scale. (B) Consensus CDF curves at k = 2–9. (C) Delta area plot. (D) Tracking plot. The rows are samples, and the columns are k values. (E) PCA plot of two PANoptosis-based subtypes. (F) Volcano plot of specific marker genes of each subtype. |
WGCNA Co-Expression Network of PANoptosis-Based Subtype Related Genes
The WGCNA method was used to identify genes associated with PANoptosis-based subtypes. Hierarchical clustering analysis revealed no abnormal samples (Figure 3A). In the WGCNA, the soft threshold power mechanism is crucial. After achieving scale independence and average connectedness, the soft threshold power was set to 3 to form a scale-free co-expression network (Figure 3B). Using a dynamic tree cutting approach, the genes were clustered into 10 modules (Figure 3C). Then, associations between modules and subtypes based on PANoptosis were evaluated. The PANoptosis-based subtypes and the Turquoise Green module thus had the highest connection (Figure 3D). Additionally, we discovered a substantial association between PANoptosis-based subgroups’ gene salience and Turquoise Green module membership (Figure 3E). Based on, p.GS. Interested Module < 0.01, p.MM. turquoise < 0.01, | MM. turquoise | ≥ 0.7 and | GS. Interested Module| ≥ 0.7, 720 genes were found in the turquoise green module that were considered to be PANoptosis-based subtype-associated genes.
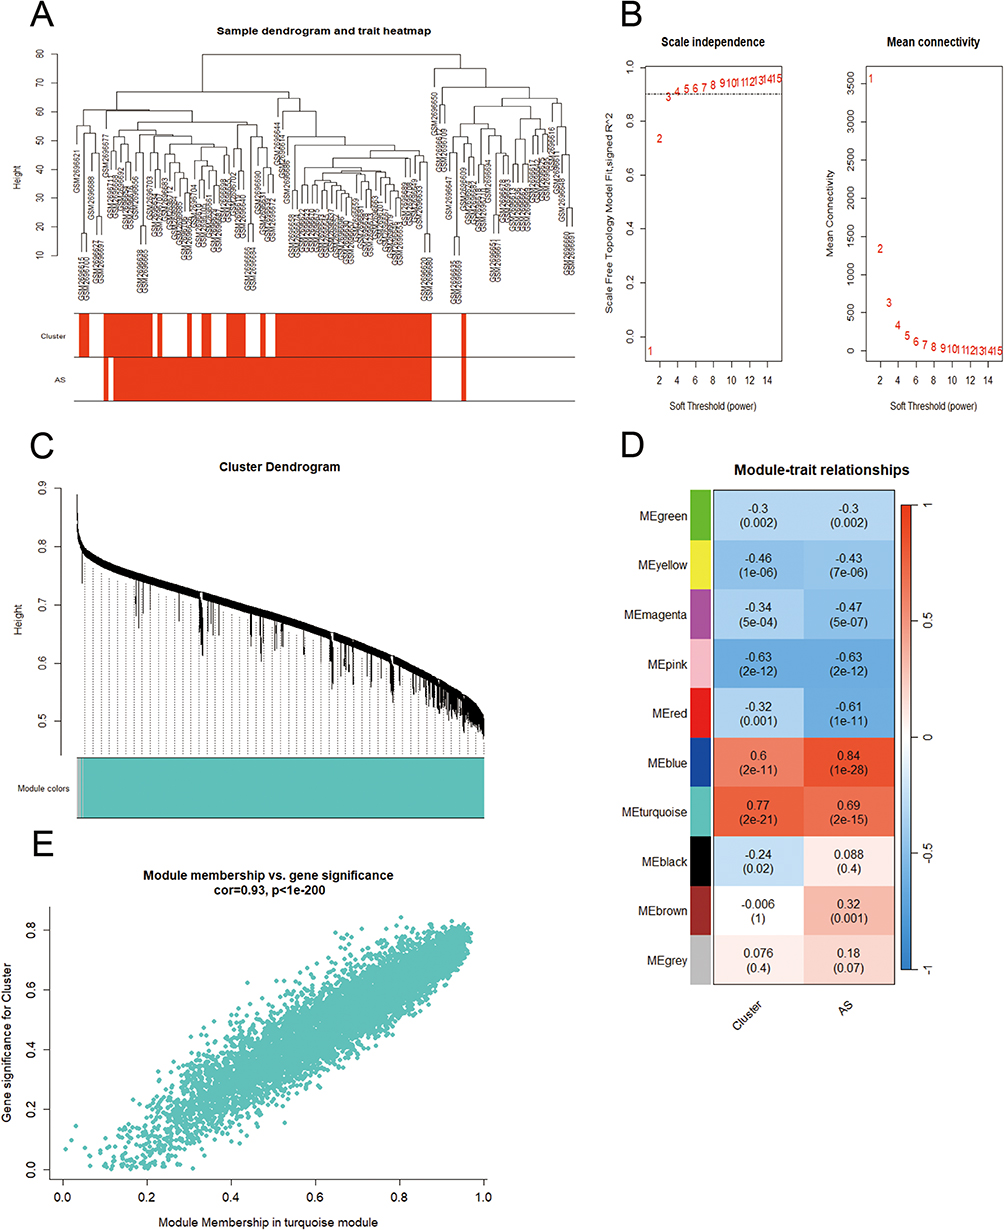 |
Figure 3 WGCNA co-expression network of PANoptosis-based subtype related genes. (A) Clustering dendrogram of PANoptosis-based subtypes on the basis of Euclidean distance. (B) Scale Independence and mean connectivity at different power values. (C) Cluster dendrogram of distinct modules through dynamic tree cut approach and merged dynamic approach. The gray module represents unclassified genes. (D) Correlations between modules and PANoptosis-based subtypes. The color indicates the strength of the correlation, and the number in parentheses indicates p-value. (E) Scatter plot of the relationship between module membership of turquoise module and gene significance for PANoptosis -based subtypes. |
Selection of PANoptosis-Based Subtypes Related Feature Genes
To explore diagnostic genes, we used 51 PANoptosis-based subtype DEGs crossed with 720 genes from the “ME turquoise” module. Finally, we identified 36 differential genes associated with PANoptosis-based subtypes. Gene set 1 (GS1) was used to describe these (Figure 4A). To investigate the possible uses of GS1, we used the GlueGo method to perform GO enrichment analysis. The top three substantially enriched GO terms for BP were “neutrophil migration”, “neuroinflammatory response” and “membrane protein ectodomain proteolysis”. Confirming that neutrophil migration may be important in PANoptosis-based subtypes, neutrophil migration accounted for 41.18% of the total GO terms and was associated with 7 genes (Figure 4B and C). Fourteen key genes associated with PANoptosis-based subtypes were selected by the MCODE method, including MMP7, FGR, MMP1, ITGB2, MMP12, IL1B, BCL2A1, ACP5, CCL3, ITGAX, CCL4, HMOX1, CD83 and APOE (Figure 4D). The heat map shows the expression of these genes in atherosclerosis and in the control group (Figure 4E). We performed a feature screen by LASSO regression (Figure 4F) to explore AS biomarkers in these 14 genes. Four hub genes (ACP5, CCL3, CCL4, HMOX1) were screened by LASSO regression.
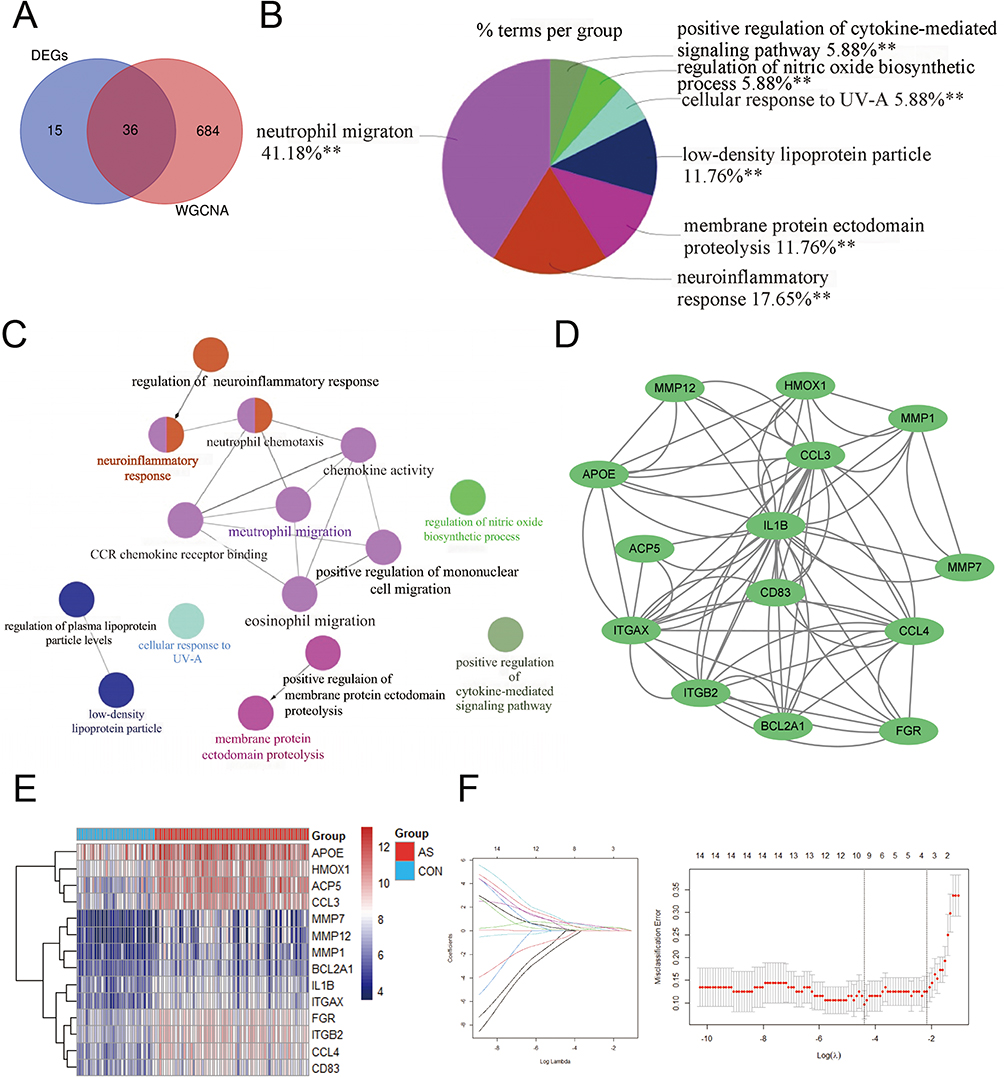 |
Figure 4 Selection of PANoptosis-based subtypes related feature genes. (A) Venn diagram showing the intersection of DEGs and MEturquoise modules. (B) Proportion of each GO terms group in the total. GO, gene ontology. **p < 0.01. (C) The interaction network of GO terms. The significant term of each group is highlighted. (D) The cluster extracted from GS1. (E) Heatmaps of PANoptosis-related subtypes genes. (F) Adjustment of feature selection in the minimum absolute shrinkage and selection operator model (lasso). |
Analysis of the Expression of Hub Genes in Atherosclerotic Samples and Their Diagnostic Efficacy
In the GSE100927 dataset, we compared the expression of these genes in samples with AS and controls and discovered that the AS group had increased expression (Figure 5A). ROC curves were used to examine the efficacy of the four main genes as diagnostic biomarkers for AS in the GSE100927 dataset (Figure 5B). AUC>0.7 was employed as a diagnostic sign for important genes. Notably, CCL3 had the highest AUC of the four hubs at 0.937. ACP5, CCL4, and HMOX1 each had an AUC of 0.931, 0.932, and 0.911, respectively. These findings imply that the four hub genes are useful for accurate diagnosis. Additionally, it was looked into how these four hub genes related to one another (Figure 5C). CCL4 and CCL3 had highest correlation coefficients of 0.97. According to the functional similarity data, the four hub genes ACP5, HMOX1, CCL4, and CCL3 have stronger functional similarity (similarity score > 0.5). The external validation collection GSE43292 was used to analyze the ROC curves of the four hub genes. ROC analysis was used to confirm the four hub genes’ specificity and sensitivity for diagnosing AS. All genes in the GSE43292 dataset had AUC areas greater than 0.7, as shown in (Figure 5D), with the exception of CCL4. These findings suggest that these three hub genes could serve as diagnostic AS biomarkers.
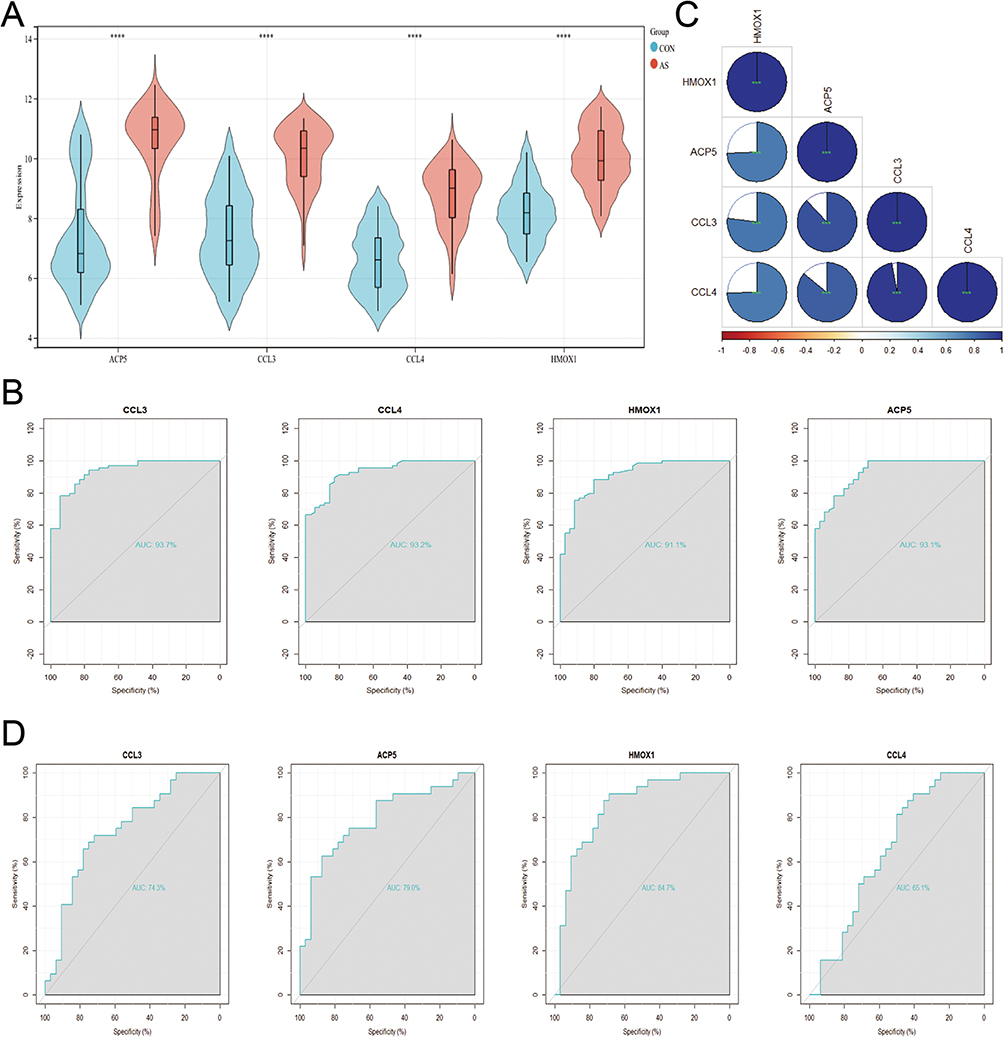 |
Figure 5 Hub gene expression analysis and hub gene diagnostic performance in atherosclerotic samples. (A) Hub genes expression in the training dataset (GSE100927). ****p < 0.0001. (B) The ROC curve analysis of hub genes in GSE100927. (C) Associations between Hub Genes. ***p < 0.001. (D) The ROC curve analysis of hub genes in GSE43292. |
Landscape of Immune Cells in Atherosclerosis
22 different immune cell types had their relative abundance estimated using CIBERSORT. First, atherosclerotic and non-atherosclerotic control samples were examined for immune cell type abundance. Figure 6A depicts the number of plasma cells, follicular helper T cells, M0 macrophages, M2 macrophages, and activated mast cells in atherosclerotic samples. Simultaneously, atherosclerotic samples decreased the abundance of naive B cells, CD8 T cells, CD4 naive T cells, CD4 memory resting/activated T cells, monocytes, M1 macrophages, resting dendritic cells, resting mast cells and neutrophils. Figure 6B illustrates the variations in immune cell infiltration abundance that were discovered. The differences in immune cell types between the two PANoptosis-based subtypes were also assessed. In general, C1 had a higher abundance of most immune cells than C2 (Figure 6C). In addition, positive interactions between immune cell types were found, as shown in Figure 6D. Figure 6E shows the association between the signature genes and the infiltration of the immune cells. Most of the signature genes were negatively correlated with the abundance of immune cells, but all three diagnostic genes showed a high positive interaction with macrophages M0.
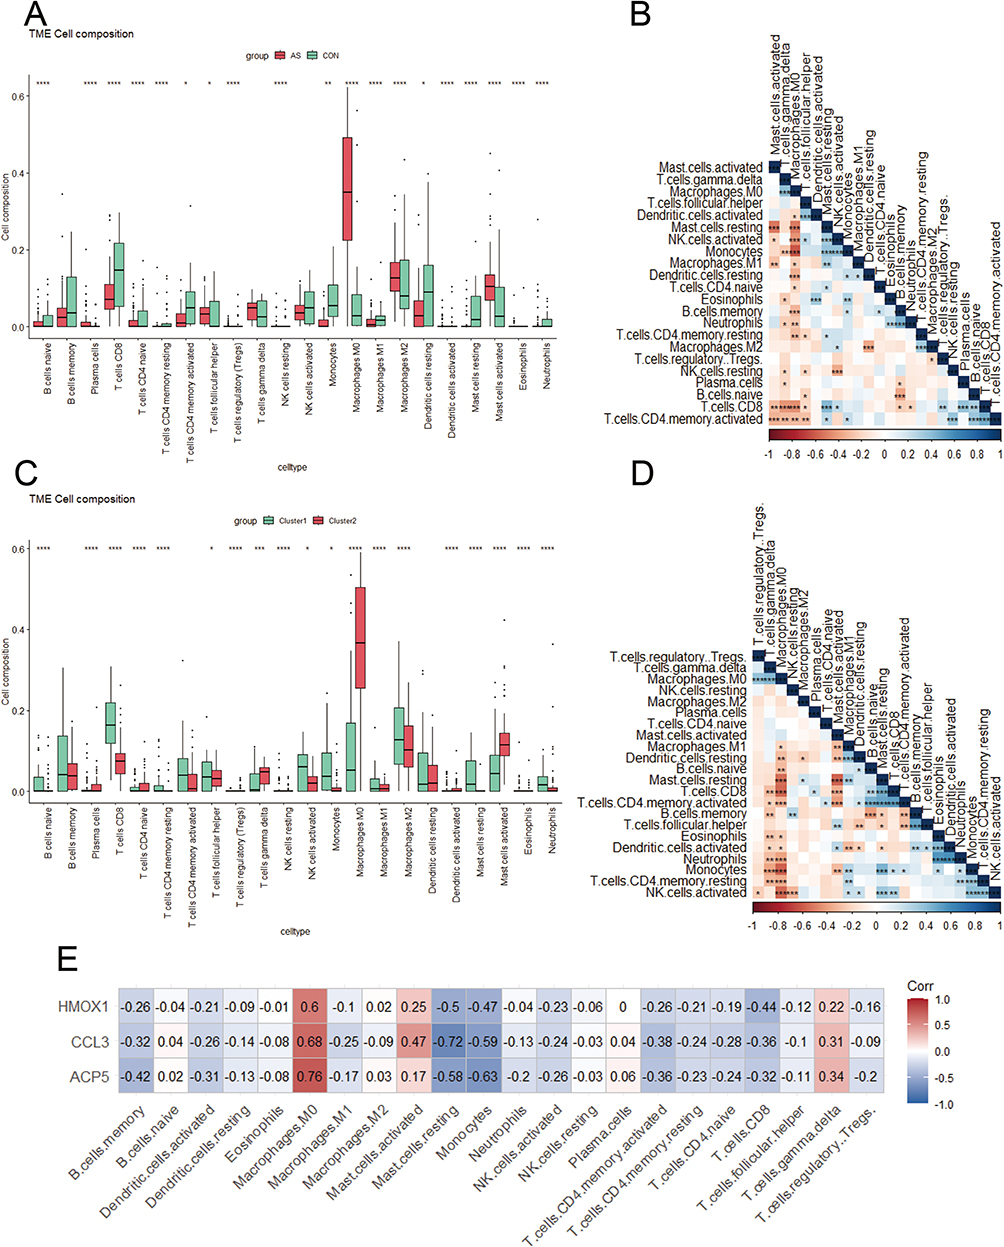 |
Figure 6 Landscape of immune cells in atherosclerosis. (A) The abundance of 24 immune cell types in atherosclerosis (red) and control (green) specimens. *p < 0.05, **p < 0.01, ****p < 0.0001. (B) Associations between distinct immune cell types. *p < 0.05, **p < 0.01, ***p < 0.001. (C) The abundance of 22 immune cell types across two PANoptosis-based subtypes. *p < 0.05, ***p < 0.001, ****p < 0.0001. (D) Associations between distinct immune cell types. *p < 0.05, **p < 0.01, ***p < 0.001. (E) Associations between 22 immune cell types and diagnostic genes. |
Single Cell Analysis to Identify the Expression of ACP5, CCL3 and HMOX1 in Atherosclerotic Samples
Finally, we identified three genes as diagnostic for atherosclerosis: ACP5, HMOX1 and CCL3. Using single cell analyses in conjunction with eight integrated cell populations (Figure 7A), we identified the distribution of the ACP5, HMOX1, and CCL3 genes. (Figure 7B and C) displays the location and expression of the ACP5, HMOX1, and CCL3 genes in several cell types. The findings further demonstrate that macrophages considerably overexpress ACP5, HMOX1, and CCL3, while macrophages and NK cells significantly overexpress ACP5 and HMOX1. We discovered that the expression of diagnostic genes was higher in macrophages compared to other immune cell types.
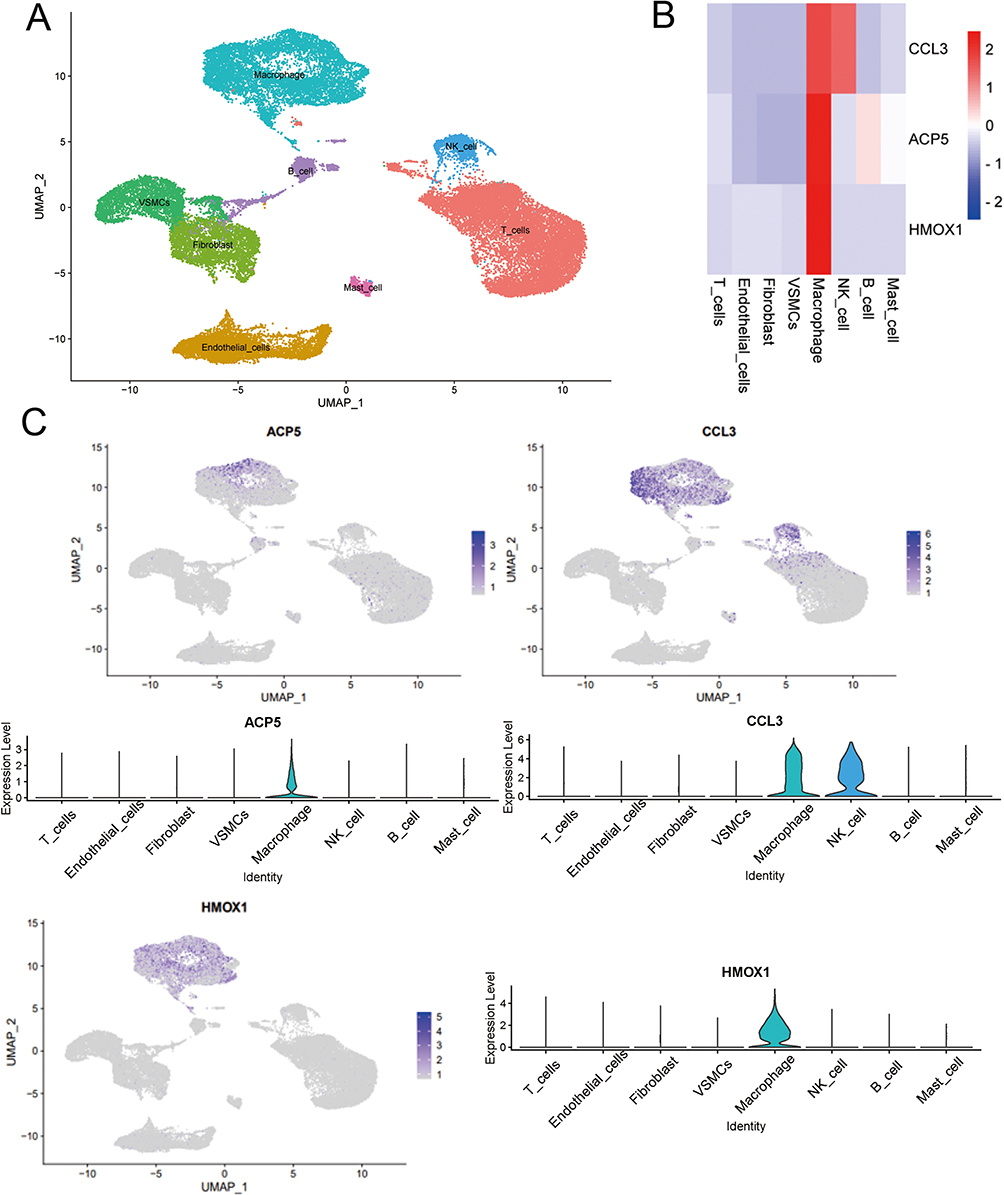 |
Figure 7 Single cell analysis to identify the expression of ACP5, CCL3 and HMOX1 in atherosclerotic samples. (A) Umap of eight cell types in GSE159677. (B) Three AS diagnostic genes had high expression levels in macrophages. (C) Feature and violin plots showing the distribution of three AS diagnostic genes in various cell types. |
In vitro Analyses
A crucial stage in the progression of atherosclerosis is the creation of foam cells produced from macrophages. Oil red O staining was carried out on macrophages that had received Ox-LDL treatment to see if foam cell development had taken place. In macrophages treated with Ox-LDL, oil red O staining was noticeably elevated (Figure 8A). In the AS (Ox-LDL) group compared to the control (complete medium) group, relative mRNA expression of ACP5 (P=0.0183), HMOX1 (P=0.0015), and CCL3 (P<0.0001) reduced and increased, respectively (Figure 8B).
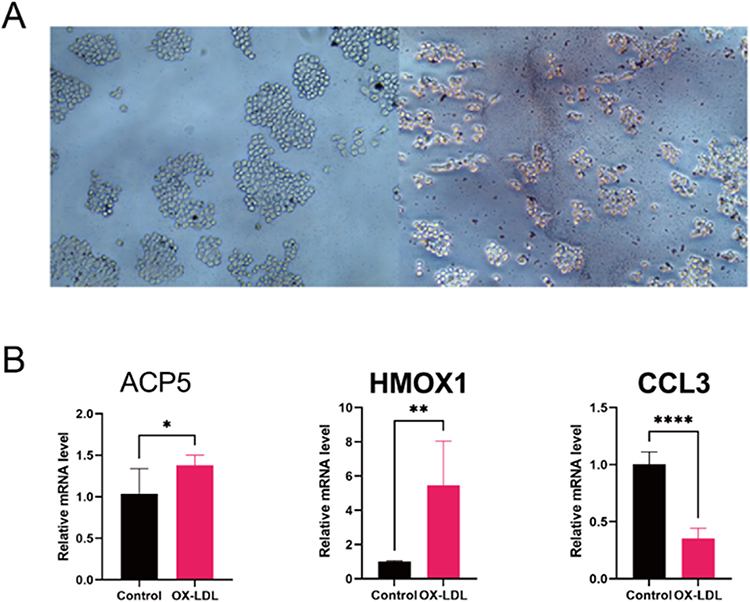 |
Figure 8 In Vitro Analyses. (A) Representative images of Oil red O staining of Raw264.7 cells with/without Ox-LDL (100 µg/mL) for 48 hours. (B) Verified the expression of hub genes. Relative mRNA level of ACP5, HMOX1 and CCL3 in RAW264.7. *p < 0.05, **p < 0.01, ****p < 0.0001. |
Discussion
PANoptosis have been linked to the emergence of a number of systemic disorders in humans, including cancer, inflammatory diseases, infectious diseases, and neurodegenerative diseases.7 Atherosclerosis is a lipid-driven inflammatory disorder of the arteries that causes the production of inflammatory factors, which causes chronic inflammation inside the arterial wall.12 PANoptosis is closely associated with the development and progression of inflammatory diseases. However, the role of PANoptosis in atherosclerosis remains incompletely understood. Therefore, our study performed a comprehensive analysis of the role of PANoptosis in atherosclerosis and identified its subtypes. It is evident that cluster 2 largely corresponds to the AS group, whereas cluster 1 largely corresponds to the Con group from the heatmap grouping of samples corresponding to different subtypes (Figure 9). This is an indication that the PANoptosis subtypes can effectively discriminate between atherosclerosis (AS) and non-atherosclerosis (Con). Differential analysis and weighted gene co-expression network analysis (WGCNA) identified 36 atherosclerosis-related characteristic genes associated with PANoptosis subtypes. Enrichment analysis using ClueGO indicated that these 36 feature genes were mainly involved in “neutrophil migration”, “neuroinflammatory response” and “membrane protein ectodomain proteolysis”. CODE and LASSO regression analysis identified 4 hub genes (ACP5, CCL3, CCL4, HMOX1). Internal training and external validation sets identified ACP5, CCL3 and HMOX1 as diagnostic biomarkers for atherosclerosis (AS). Additionally, between AS and normal samples, we found a substantial variation in immune cell concentration. ACP5, CCL3, HMOX1, and macrophage M0 were found to positively correlate in AS, according to correlation analysis. In human tissues, there are three main subgroups of macrophages: M0, or naive macrophages; M1, or pro-inflammatory macrophages; and M2, or anti-inflammatory macrophages. To perform their tasks, naive macrophages must have the ability to phagocytose, recognize pathogenic substances, and quickly polarize into either pro-inflammatory or anti-inflammatory macrophages.13 Further analysis at the single cell level confirmed that ACP5, CCL3 and HMOX1 are expressed primarily in macrophages. In the GSE100927 dataset, we used the CIBERSORT algorithm to investigate immune infiltration in the context of atherosclerotic and non-atherosclerotic groups and PANoptosis subtype groups. Results showed that macrophage immune infiltration patterns were broadly consistent between atherosclerosis and cluster 2 (based on PANoptosis subtypes). This confirms the relationship between PANoptosis and atherosclerosis, suggesting that grouping based on PANoptosis subtypes is well aligned with the presence of atherosclerosis.
 |
Figure 9 Sample grouping and type information in dataset GSE100927. |
There are two types of tartrate-resistant acid phosphatase 5 (ACP5) in human blood: ACP-5a, which comes from macrophages and dendritic cells, and ACP-5b, which comes from osteoclasts. In individuals with chronic inflammatory disorders, ACP-5a functions as a biomarker of systemic inflammatory burden.14,15 According to studies, the severity and extent of coronary atherosclerosis, osteoprotegerin (OPG) levels, and ACP-5b levels are significantly correlated in people with coronary artery disease (CAD).16 The expression of the ACP5 protein is encouraged by the long non-coding RNA-H19 (lncRNA-H19), which also increases the risk of ischemic stroke and atherosclerosis.17 The study also demonstrated that foam cells produced from macrophages express more ACP5. Our research adds to the body of evidence supporting arteriosclerosis-related changes in macrophage ACP5 expression.
Heme is degraded by heme oxygenase, which has two isoforms, heme oxygenase 1 (HMOX1) and heme oxygenase 2 (HMOX2), into carbon monoxide (CO), ferrous iron, and biliverdin, which is then changed into bilirubin. Previous studies have shown that CO and biliverdin/bilirubin may regulate key cellular processes such as inflammation, cell proliferation, apoptosis and antioxidant defenses.18 The multiple activities of heme oxygenase, including anti-inflammatory, antioxidant and cell growth-regulating properties, are responsible for its protective effects in the arterial vasculature.16 Evidence suggests that haem oxygenase 1 (HMOX1) has anti-inflammatory activity in the vasculature and in circulating inflammatory cells. Pro-inflammatory stimuli, including LPS, induce HMOX1 expression in vascular endothelial cells (ECs), which is critical for maintaining vascular integrity during inflammation and protecting ECs from damage and apoptosis.19 Despite the fact that Hmox1 expression can be increased in all organs and cell types, the anti-inflammatory effects it has on ECs and bone marrow cells (monocytes, macrophages, and dendritic cells) seem to depend primarily on these two cell types.18 Our study also supports this notion and provides further evidence that HMOX1 can serve as a diagnostic biomarker for atherosclerosis.
Research suggests that chemokines play a potential role in causing cardiovascular disease, particularly atherosclerosis.20,21 Among these, CCL3/macrophage inflammatory protein (MIP)-1 can be a regulator of monocyte and lymphocyte recruitment.22 Leukocyte-derived CCL3 can cause neutrophil migration to atherosclerotic plaques under conditions of acute inflammation, increasing lesion formation.23 After 6 and 12 weeks on a Western diet, CCL3 (-/-) animals showed lower plasma concentrations of triglycerides and cholesterol than C57BL/6 mice. Additionally, CCL3 (-/-) animals had considerably less atherosclerotic lesion area.24 However, our experimental results show a decreasing trend in CCL3 expression. Hypothetically, this could be due to the presence of a negative feedback mechanism for CCL3, significant differences between in vivo and in vitro conditions, or possible discrepancies in intracellular localization of the CCL3 gene leading to unexpected results. We consulted the Gene Ontology-Cellular Components for CCL3 and found that CCL3 is localized in the extracellular space. This may provide an explanation for our experimental results. Reasons for the discrepancy between experimental results and data analysis could include: ① the inherent heterogeneity of atherosclerosis itself, ② the data set consisting of tissue samples, whereas our experiment used a cellular model. Further work is still needed to validate this.
To explore their potential roles and pathways in atherosclerosis, we performed single-gene gene set enrichment analysis (GSEA) based on KEGG gene sets for these three biomarkers individually. In terms of KEGG pathways, we found that all three diagnostic genes were enriched in “cholesterol metabolism”, “NF-κB signaling pathway”, “apoptosis” and “necroptosis” in the high-expression groups (Figure 10). In tissues with persistent inflammation, both immunological and non-immune cells frequently exhibit increased NF-B activation. By promoting the expression of pro-inflammatory mediators, which in turn orchestrates and maintains the inflammatory response and causes tissue damage, NF-B exerts harmful activities. As a result, enhanced NF-B activation is thought to be a key pathogenic component in a number of acute and chronic inflammatory disorders.25 Single-gene GSEA results reaffirm the critical role of PANoptosis in atherosclerosis and suggest that it may influence atherosclerosis development through the NF-κB pathway. Nevertheless, this study has some limits. The presence of post-transcriptional modifications may affect the reliability of our study, and our conclusions were drawn from the mRNA level rather than the protein level. To clarify the probable pathways of PANoptosis in atherosclerosis, more research is needed.
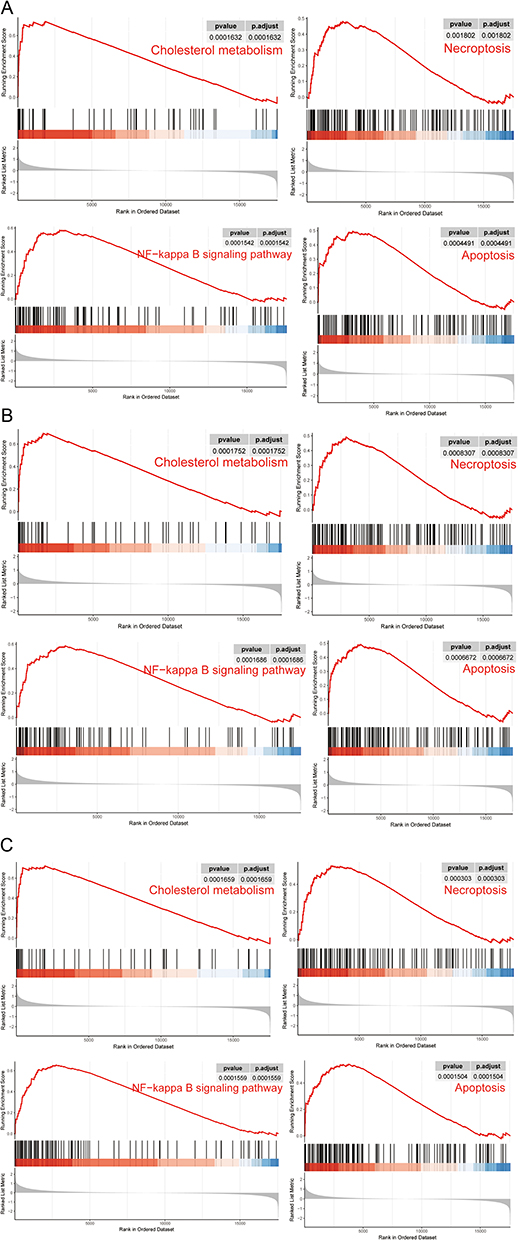 |
Figure 10 The enriched KEGG pathways by three diagnostic genes via single gene GSEA. (A) The enriched KEGG pathways by ACP5 via single gene GSEA. (B) The enriched KEGG pathways by HMOX1 via single gene GSEA. (C) The enriched KEGG pathways by CCL3 via single gene GSEA. |
Conclusion
This study provides an overview of the genes that are associated with PANoptosis in atherosclerosis. Two PANoptosis-based subtypes of atherosclerosis and two related signature genes were identified. These findings elucidate the key role of PANoptosis in the pathophysiological process of atherosclerosis and provide new targets for the diagnosis of atherosclerosis. However, further experiments and a larger number of clinical samples are still needed to verify the validity of the signature genes based on the subtypes of PANoptosis in the diagnosis of atherosclerosis. It will provide a new reference point for the diagnosis, research into the mechanisms and treatment of this disease.
Funding
This research was funded by National Natural Science Foundation of China General Program, Grant/Award Number: 81873495, 82171569.
Disclosure
The authors report no conflicts of interest in this work.
References
1. Roth GA, Mensah GA, Johnson CO, et al. Global burden of cardiovascular diseases and risk factors, 1990–2019: update from the GBD 2019 Study. J Am Coll Cardiol. 2020;76(25):2982–3021. doi:10.1016/j.jacc.2020.11.010
2. Vasan RS, Zachariah JP, Xanthakis V. Life course developmental approach to cardiovascular health and cardiovascular disease prevention: opportunities and unanswered questions. J Am Coll Cardiol. 2020;76(23):2708–2711. doi:10.1016/j.jacc.2020.10.011
3. Björkegren JLM, Lusis AJ. Atherosclerosis: recent developments. Cell. 2022;185(10):1630–1645. doi:10.1016/j.cell.2022.04.004
4. Shah NS, Lloyd-Jones DM, Kandula NR, et al. Adverse trends in premature cardiometabolic mortality in the United States, 1999 to 2018. J Am Heart Assoc. 2020;9:e018213. doi:10.1161/JAHA.120.018213
5. Zheng M, Kanneganti T-D. The regulation of the ZBP1-NLRP3 inflammasome and its implications in pyroptosis, apoptosis, and necroptosis (PANoptosis). Immunol Rev. 2020;297(1):26–38. doi:10.1111/imr.12909
6. Malireddi RKS, Kesavardhana S, Kanneganti T-D. ZBP1 and TAK1: master regulators of NLRP3 inflammasome/pyroptosis, apoptosis, and necroptosis (PAN-optosis). Front Cell Infect Microbiol. 2019;9:406. doi:10.3389/fcimb.2019.00406
7. Samir P, Malireddi RKS, Kanneganti T-D. The PANoptosome: a deadly protein complex driving pyroptosis, apoptosis, and necroptosis (PANoptosis). Front Cell Infect Microbiol. 2020;10:238. doi:10.3389/fcimb.2020.00238
8. Zheng M, Karki R, Vogel P, Kanneganti T-D. Caspase-6 is a key regulator of innate immunity, inflammasome activation, and host defense. Cell. 2020;181(3):674–687.e13. doi:10.1016/j.cell.2020.03.040
9. Christgen S, Zheng M, Kesavardhana S, et al. Identification of the PANoptosome: a molecular platform triggering pyroptosis, apoptosis, and necroptosis (PANoptosis). Front Cell Infect Microbiol. 2020;10:237. doi:10.3389/fcimb.2020.00237
10. Pan H, Pan J, Li P, Gao J. Characterization of PANoptosis patterns predicts survival and immunotherapy response in gastric cancer. Clin Immunol. 2022;238:109019. doi:10.1016/j.clim.2022.109019
11. Sui S, An X, Xu C, et al. An immune cell infiltration-based immune score model predicts prognosis and chemotherapy effects in breast cancer. Theranostics. 2020;10(26):11938–11949. doi:10.7150/thno.49451
12. Bäck M, Yurdagul A, Tabas I, Öörni K, Kovanen PT. Inflammation and its resolution in atherosclerosis: mediators and therapeutic opportunities. Nat Rev Cardiol. 2019;16(7):389–406. doi:10.1038/s41569-019-0169-2
13. Chaintreuil P, Kerreneur E, Bourgoin M, et al. The generation, activation, and polarization of monocyte-derived macrophages in human malignancies. Front Immunol. 2023;14:1178337. doi:10.3389/fimmu.2023.1178337
14. Janckila AJ, Slone SP, Lear SC, Martin A, Yam LT. Tartrate-resistant acid phosphatase as an immunohistochemical marker for inflammatory macrophages. Am J Clin Pathol. 2007;127(4):556–566. doi:10.1309/DGEA9BE2VE5VCFYH
15. Wu Y-Y, Janckila AJ, Slone SP, Perng W-C, Chao T-Y. Tartrate-resistant acid phosphatase 5a in sarcoidosis: further evidence for a novel macrophage biomarker in chronic inflammation. J Formos Med Assoc. 2014;113(6):364–370. doi:10.1016/j.jfma.2012.07.033
16. Morisawa T, Nakagomi A, Kohashi K, Kusama Y, Shimizu W. Serum tartrate-resistant acid phosphatase-5b levels are associated with the severity and extent of coronary atherosclerosis in patients with coronary artery disease. J Atheroscler Thromb. 2017;24(10):1058–1068. doi:10.5551/jat.39339
17. Huang Y, Wang L, Mao Y, Nan G. Long noncoding RNA-H19 contributes to atherosclerosis and induces ischemic stroke via the upregulation of acid phosphatase 5. Front Neurol. 2019;10:32. doi:10.3389/fneur.2019.00032
18. Ayer A, Zarjou A, Agarwal A, Stocker R. Heme oxygenases in cardiovascular health and disease. Physiol Rev. 2016;96(4):1449–1508. doi:10.1152/physrev.00003.2016
19. Ryter SW, Choi AMK. Targeting heme oxygenase-1 and carbon monoxide for therapeutic modulation of inflammation. Transl Res. 2016;167:7–34. doi:10.1016/j.trsl.2015.06.011
20. Mach F. The role of chemokines in atherosclerosis. Curr Atheroscler Rep. 2001;3(3):243–251. doi:10.1007/s11883-001-0067-y
21. Shin WS, Szuba A, Rockson SG. The role of chemokines in human cardiovascular pathology: enhanced biological insights. Atherosclerosis. 2002;160(1):91–102. doi:10.1016/s0021-9150(01)00571-8
22. Frangogiannis NG. Chemokines in the ischemic myocardium: from inflammation to fibrosis. Inflamm Res. 2004;53(11):585–595. doi:10.1007/s00011-004-1298-5
23. de Jager SCA, Bot I, Kraaijeveld AO, et al. Leukocyte-specific CCL3 deficiency inhibits atherosclerotic lesion development by affecting neutrophil accumulation. Arterioscler Thromb Vasc Biol. 2013;33(3):e75–e83. doi:10.1161/ATVBAHA.112.300857
24. Kennedy A, Gruen ML, Gutierrez DA, et al. Impact of macrophage inflammatory protein-1α deficiency on atherosclerotic lesion formation, hepatic steatosis, and adipose tissue expansion. PLoS One. 2012;7:e31508. doi:10.1371/journal.pone.0031508
25. Wullaert A, Bonnet MC, Pasparakis M. NF-κB in the regulation of epithelial homeostasis and inflammation. Cell Res. 2011;21(1):146–158. doi:10.1038/cr.2010.175
 © 2023 The Author(s). This work is published and licensed by Dove Medical Press Limited. The full terms of this license are available at https://www.dovepress.com/terms.php and incorporate the Creative Commons Attribution - Non Commercial (unported, v3.0) License.
By accessing the work you hereby accept the Terms. Non-commercial uses of the work are permitted without any further permission from Dove Medical Press Limited, provided the work is properly attributed. For permission for commercial use of this work, please see paragraphs 4.2 and 5 of our Terms.
© 2023 The Author(s). This work is published and licensed by Dove Medical Press Limited. The full terms of this license are available at https://www.dovepress.com/terms.php and incorporate the Creative Commons Attribution - Non Commercial (unported, v3.0) License.
By accessing the work you hereby accept the Terms. Non-commercial uses of the work are permitted without any further permission from Dove Medical Press Limited, provided the work is properly attributed. For permission for commercial use of this work, please see paragraphs 4.2 and 5 of our Terms.