")
Back to Journals » Journal of Inflammation Research » Volume 14
A Novel Radiomics Nomogram for the Prediction of Secondary Loss of Response to Infliximab in Crohn’s Disease
Authors Chen Y, Li H, Feng J, Suo S, Feng Q, Shen J
Received 8 April 2021
Accepted for publication 8 June 2021
Published 24 June 2021 Volume 2021:14 Pages 2731—2740
DOI https://doi.org/10.2147/JIR.S314912
Checked for plagiarism Yes
Review by Single anonymous peer review
Peer reviewer comments 4
Editor who approved publication: Dr Monika Sharma
Yueying Chen,1 Hanyang Li,1 Jing Feng,1 Shiteng Suo,2 Qi Feng,2 Jun Shen1
1Division of Gastroenterology and Hepatology, Key Laboratory of Gastroenterology and Hepatology, Ministry of Health, Inflammatory Bowel Disease Research Center, Renji Hospital, School of Medicine, Shanghai Jiao Tong University, Shanghai Institute of Digestive Disease, Shanghai, 200127, People’s Republic of China; 2Department of Radiology, Renji Hospital, School of Medicine, Shanghai Jiao Tong University, Shanghai, 200127, People’s Republic of China
Correspondence: Qi Feng; Jun Shen Email [email protected]; [email protected]
Purpose: The prediction of the loss of response (LOR) to infliximab (IFX) is crucial for optimizing treatment strategies and shifting biologics. However, a secondary LOR is difficult to predict by endoscopy due to the intestinal stricture, perforation, and fistulas. This study aimed to develop and validate a radiomic nomogram for the prediction of secondary LOR to IFX in patients with Crohn’s disease (CD).
Patients and Methods: A total of 186 biologic-naive patients diagnosed with CD between September 2016 and June 2019 were enrolled. Secondary LOR was determined during week 54. Computed tomography enterography (CTE) texture analysis (TA) features were extracted from lesions and analyzed using LIFEx software. Feature selection was performed by least absolute shrinkage and selection operator (LASSO) and ten-fold cross validation. A nomogram was constructed using multivariable logistic regression, and the internal validation was approached by ten-fold cross validation.
Results: Predictors contained in the radiomics nomogram included three first-order and five second-order signatures. The prediction model presented significant discrimination (AUC, 0.880; 95% CI, 0.816– 0.944) and high calibration (mean absolute error of = 0.028). Decision curve analysis (DCA) indicated that the nomogram provided clinical net benefit. Ten-fold cross validation assessed the stability of the nomogram with an AUC of 0.817 and an accuracy of 0.819.
Conclusion: This novel radiomics nomogram provides a predictive tool to assess secondary LOR to IFX in patients with Crohn’s disease. This tool will help physicians decide when to switch therapy.
Keywords: secondary loss of response, texture analysis, infliximab, Crohn’s disease, radiomics, prediction model
Introduction
Crohn’s disease (CD) is a recurrent inflammatory disease that affects the entire digestive tract, accompanied by extraintestinal manifestations. The prevalence has increased worldwide, and CD reduces the quality of life of patients.1 Anti-tumor necrosis factor (anti-TNF) agents have been considered the first-line therapy with improved mucosal healing and clinical remission rate.2,3 However, studies calculated that about 50–54% of patients with a loss of response (LOR) to infliximab (IFX) therapy, which was often driven by immunogenicity problems.4,5 The early assessment of LOR is crucial for physicians to select a new treatment for patients with CD. Recent studies have identified that the patient and disease characteristics, drug factors, and laboratory indices, such as smoking status,6 body mass index (BMI),7,8 disease phenotype,9 trough levels,10 cytokines,11,12 and genotype,13 play an important role in assessing the probability of LOR, and prediction models have been developed based on these factors.8 Endoscopic procedures are common and effective methods for evaluating LOR to IFX therapy in patients with CD. However, endoscopy should not be performed when a patient has stricturing or penetrating disease, and it is unable to detect the lesions that penetrate the full layer of the intestine. Therefore, more research is needed to identify predictors of LOR to IFX therapy for most CD patients.
Radiologic images are composed of numerous voxels with individual gray-level values in accordance with the signal strength of the structure.14 Texture analysis (TA) is an emerging technology of radiomics, which includes the extraction, analysis, and quantification of lesion characteristics by analyzing the gray-scale values of regions of interest (ROIs) and is comprised of four steps: image acquisition, image segmentation, feature extraction, and informatics analysis.15 TA results include first-order and second-order features.16 Several studies have proposed that TA is a potentially useful technique to predict pathology characteristics, therapeutic effects, and prognoses of various tumors. Computerized tomography texture analysis (CTTA) is a TA based on CT and was first applied to evaluate the prognosis of patients with head and neck cancer.17 TA has also emerged as a predictor of patient outcomes in colorectal cancer (CRC)18 and a tool to distinguish malignant and benign breast tumors.19 Although TA has been widely used in tumor differentiation and prognosis prediction, few studies have focused on its use in inflammatory bowel disease. Furthermore, computed tomography enterography (CTE) is a convenient method to achieve a transluminal diagnosis and to monitor CD with high spatial resolution;20 however, there is little evidence to support CTE-based TA to predict the LOR to IFX in patients with CD.21,22 Our research aimed to identify the predictive value of CTE-based TA and construct a nomogram predicting LOR to IFX therapy in patients with CD, which may provide a useful tool to guide shifting the medical strategies for patients with CD.
Patients and Methods
Patient Characteristics
We reviewed the medical records of patients with CD treated by the Division of Gastroenterology and Hepatology at Renji Hospital between September 2016 and June 2019. CD was diagnosed based on the European Crohn’s and Colitis Organisation guidelines.23 We excluded 162 patients who were treated with IFX before admission, those who underwent maintenance therapy without a dose of 5–10 mg/kg, and those who did not undergo CTE prior to IFX therapy. A total of 186 biologic-naive patients were enrolled in our study. We initiated IFX therapy, which was maintained with 5–10 mg/kg of IFX every 8 weeks. Baseline characteristics and CTE features were collected retrospectively from a database of CT scans prior to treatment in our hospital. This study was approved by the Institutional Review Board of Shanghai Jiaotong University School of Medicine, Renji Hospital Ethics Committee (KY2017-129). Patients were not required to sign informed consent owing to the retrospective study, and their private information would be strictly protected in medical record system. This study was conducted in accordance with the Declaration of Helsinki to protect patient data confidentiality.
Outcomes and Definitions
A Crohn’s disease activity index (CDAI) reduction of more than 70 points or a decrease of Simplified Crohn’s Disease Activity Index (SCDAI) of more than 2 points from baseline was considered a clinical response to IFX therapy.24 Secondary LOR was defined by a multi-disciplinary team of experienced experts at our institution during week 54, including a relapse of CD after an initial response, such as CDAI or SCDAI was rising again to the baseline level or even higher, and the requirement of an alternative biological agent, corticosteroid, or surgery.5,9
CTE Imaging Technique
CTE examinations were performed using the conventional protocol. Patients fasted for 12 h prior to the scan and received 1,500 mL of polyethylene glycol solution (Wanghe Pharma, Shenzhen, China) orally as follows: a 500 mL bolus was administered at 45 min, 30 min, and 15 min prior to the CTE. CT scans were performed using a 64-detector computed tomography (CT) scanner (GE Medical System, Milwaukee, WI, USA), and patients underwent unenhanced and contrast-enhanced CT examinations in the supine position from the diaphragm to the perineum during a single breath-hold. Contrast-enhanced scanning was performed using a tube current of 228 mAs and voltage of 120 kV, and intravenous contrast (Lopamiro 370, Bracco Sine, Shanghai, China; 1.5mL/kg) at a speed of 3 mL/s. Scanning was performed with 40 mm collimation, 1.375:1 pitch, and a reconstruction thickness of 1.0 mm. CT images of the enteric phase were obtained 70 s after administration of the contrast agent and were retrieved for image feature extraction.
Imaging Analysis
ROIs were manually delineated by two clinical radiologists with over 13 years of experience in CT (SST and FQ) and two well-experienced gastroenterologists (CCY and SJ) within two weeks before IFX therapy, and we extracted one 2D ROIs for each scan. The consistency and repeatability of measurement between researchers were evaluated by intraclass correlation coefficient (ICC) with 0.905 (P<0.001). Before IFX therapy, the ROI was selected in the intestinal segment with the most active inflammation in each patient. Imaging features of active inflammation were defined as follows: inflamed bowel wall with ulceration on the intraluminal surface, bowel wall hyperenhancement with moderate or severe thickening, bowel wall hyperenhancement with a halo sign (not due to intramural fat deposition), and inflammation penetrating the wall with or without an active fistula, a sinus tract, or an inflammatory mass in the adjacent mesentery.25
Imaging analysis was performed using Local Image Features Extraction (LIFEx) version 5.10 software (http://www.lifexsoft.org).26 Images were resampled to an isotropic 1 mm3 voxel size. CT features were calculated manually using a 2D segmentation technique based on 400 discrete values with absolute scale bounds from −1,000 to 3,000 Hounsfield units.27 Forty-four features were extracted, including conventional and histogram-based parameters and second and higher-order textural features. In particular, the following families of second and higher-order features were extracted: the grey-level co-occurrence matrix (GLCM), the grey-level run-length matrix (GLRLM), the neighborhood grey-level different matrix (NGLDM), and the grey-level zone length matrix (GLZLM) (Supplementary Table 1).
Development and Validation of the Prediction Model
Z-Score transformation was used to normalize the variables of different orders of magnitude to a common reference, and to improve the comparability of data.28 The equation was x* = (x-μ)/σ (x: sample value; μ: population mean; σ: population standard deviation). Spearman correlation analysis was applied to reduce the dimension, for the highly correlated features (correlation coefficient>0.9), the one showed a higher coefficient with other features was excluded. Least absolute shrinkage and selection operator (LASSO) and ten-fold cross-validation were applied in feature selection by determining the best λ, and the variables with nonzero coefficients were chosen.29 The prediction model and the nomogram were developed by a multivariate logistic regression analysis via the backward stepwise technique, and the best-fit model was determined with minimal Akaike information criterion (AIC), the workflow for developing the nomogram is presented in Figure 1. Ten-fold cross validation was performed to internally validate the nomogram. The discrimination of the nomogram was evaluated by receiver operating characteristic (ROC) analysis and presented as the area under the curve (AUC).30 The accuracy of the nomogram was assessed with a calibration curve, and decision curve analysis (DCA) was used to illustrate the clinical utility of the predictive nomogram.
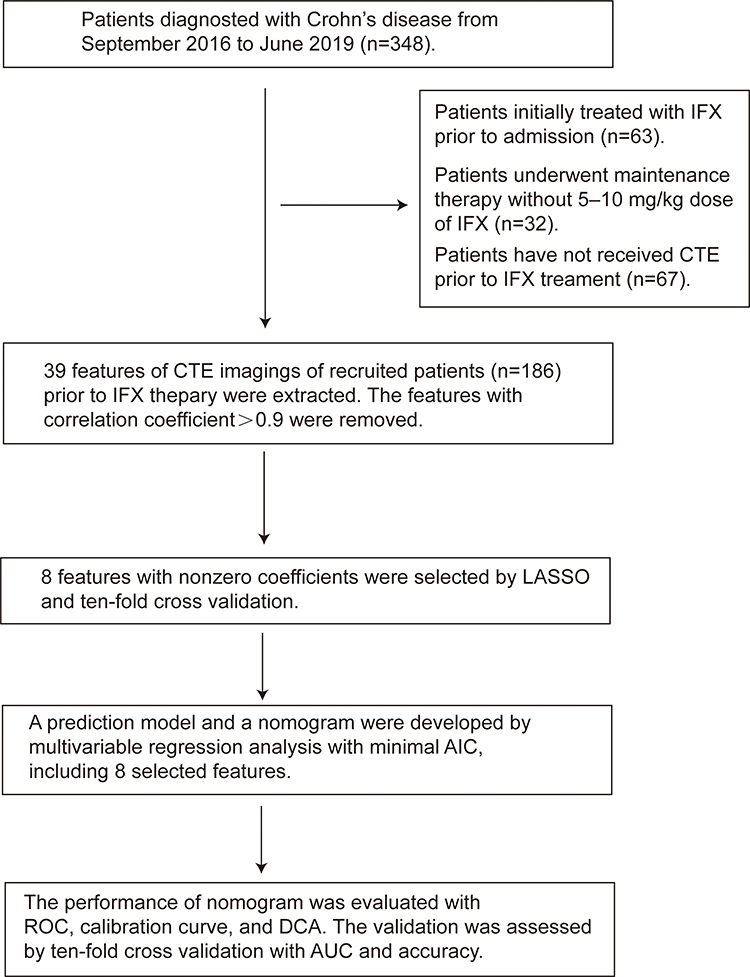 |
Figure 1 The flow diagram of study. |
Statistical Analysis
Continuous variables are presented as mean (standard deviation) or median (interquartile range), and categorical variables are presented as number or percentage. A chi-square test was used to compare categorical variables. The t-test or Mann–Whitney U-test was used to compare continuous variables. The reliability analysis was assessed by ICC with two-way random model. Spearman correlation coefficients more than 0.9 were considered very highly correlated. Statistical analyses were performed using SPSS version 25.0 and R version 3.6.3 statistical software, with a statistical significance of P < 0.05.
Results
Baseline Characteristics and Feature Selection
This study included 186 patients with CD who underwent IFX induction and maintenance therapy. Patient baseline characteristics, including sex, age, BMI, smoking history, surgical history, and simplified Crohn’s disease activity index are shown in Table 1. The incidence of secondary LOR was 23.12% (n = 43). The mean BMI of patients who experienced secondary LOR was significantly lower than that of patients who responded to IFX therapy (p=0.07). The 39 features identified by CTE imaging were normalized using the Z-Score due to obvious differences in values. The threshold of Spearman correlation coefficient was set to 0.9, after filtering, there were 24 features remained (Supplementary Table 2). LASSO and ten-fold cross validation identified the optimum λ = 0.042. The 24 candidate features were reduced to the following 8 features with nonzero coefficients in 186 patients (93:4 ratio): CONVENTIONAL_HUstd (reflects the standard deviation value in the ROIs), HISTO_Energy (reflects the uniformity of the distribution), HISTO_Skewness (reflects the asymmetry of the grey-level distribution in the histogram), GLCM_Energy (reflects the uniformity of grey-level voxel pairs), GLZLM_ZP (measures the homogeneity of the homogeneous zones), NGLDM_Contrast (reflects the intensity difference between neighbouring regions.), GLZLM_LZLGE (reflects the distribution of the long homogeneous zones with low grey-levels), and GLCM_Contrast (reflects the local variations in the GLCM) (Figure 2).
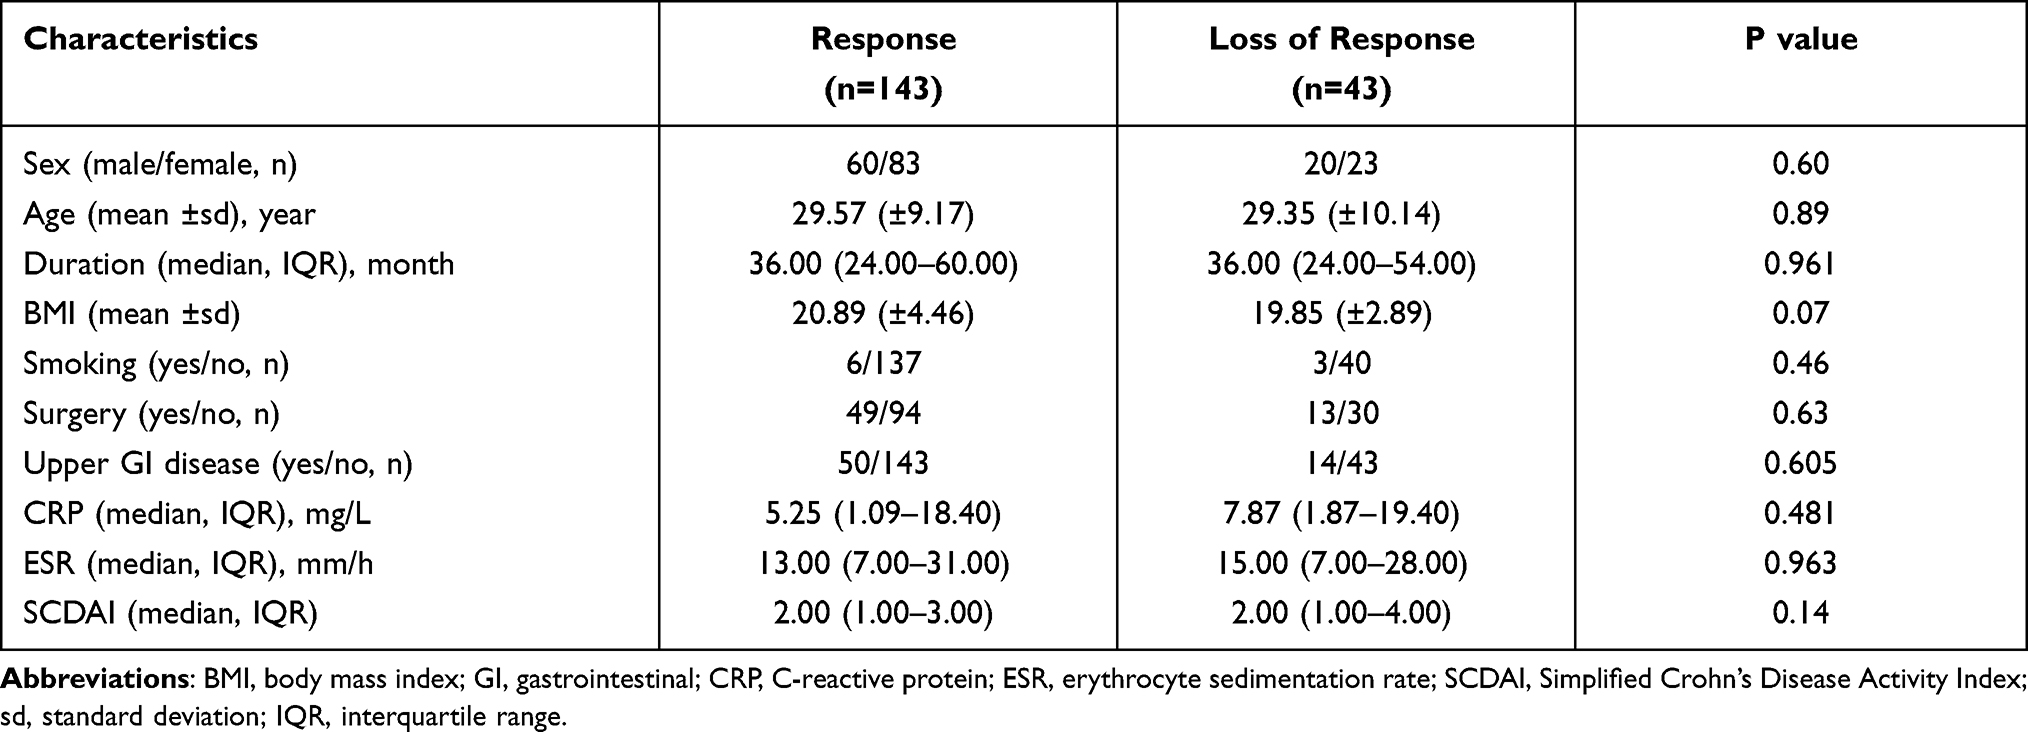 |
Table 1 Baseline Characteristics of Patients with CD |
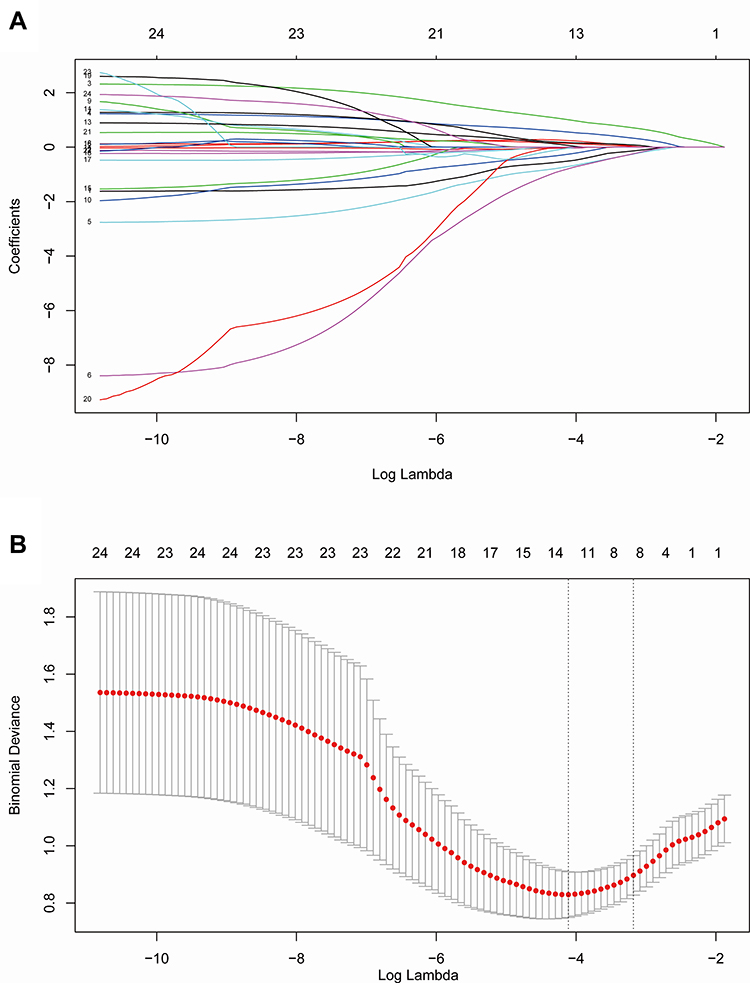 |
Figure 2 Texture features selection using the LASSO and ten-fold cross-validation. (A) Optimal parameter (λ) selection in LASSO model used ten-fold cross-validation via minimum criteria. Dotted vertical lines were drawn at the optimal values by using the minimum criteria and the 1 SE of the minimum criteria (the 1-SE criteria). A λ of 0.042 with log (λ) = −3.170 was chosen. (B) LASSO coefficient profiles of the 24 radiomics features. A coefficient profile plot was generated versus the selected log(λ) value using ten-fold cross-validation, where optimal λ resulted in 8 features with nonzero coefficients. |
Nomogram Development and Validation
The model based on the 8 features with nonzero coefficients was constructed using backward stepwise multivariate logistic regression. The model, including these 8 features, had a good fit, as determined by minimum AIC (Table 2) and was presented as a nomogram (Figure 3). The predictive value of the model was calculated using the following formula: logitP = −1.832–(0.631×CONVENTIONAL_HUstd) + (1.454×HISTO_Energy) + (1.041×HISTO_Skewness)–(1.490×GLCM_Energy)–(1.477×GLZLM_ZP) + (0.306×NGLDM_Contrast) + (0.311×GLZLM_LZLGE) + (0.692×GLCM_Contrast). The performance of the nomogram is shown in Figure 4. The nomogram exhibited sense discrimination (AUC = 0.880), and the calibration curve revealed excellent accuracy (mean absolute error = 0.028), the Hosmer–Lemeshow test (P = 0.742) revealed that the predicted probability was close to the actual probability. The DCA showed that the predictive nomogram could be used to predict the second LOR rate and provide clinical net benefit if the risk threshold between 5% and 95%. Furthermore, ten-fold cross validation was performed to prove the robustness of this model, with a mean AUC of 0.817, and accuracy of 0.819 (Supplementary Table 3). A pair of comparisons for the loss and gain of response of the nomogram for risk assessment of LOR is illustrated in Figure 5. The following mean values were found in patients with LOR: CONVENTIONAL_HUstd = 24, HISTO_Energy = 18, HISTO_Skewness = 21, GLCM_Energy = 42, GLZLM_ZP = 57, NGLDM_Contrast = 0.7, GLZLM_LZLGE = 7.5, GLCM_Contrast = 16 (Figure 5A), which sums to 186.2, suggesting that the probability of LOR to IFX therapy was above 90%. In patients who responded well to IFX treatment, the score of the nomogram showed that the possibility was less than 50% (Figure 5B).
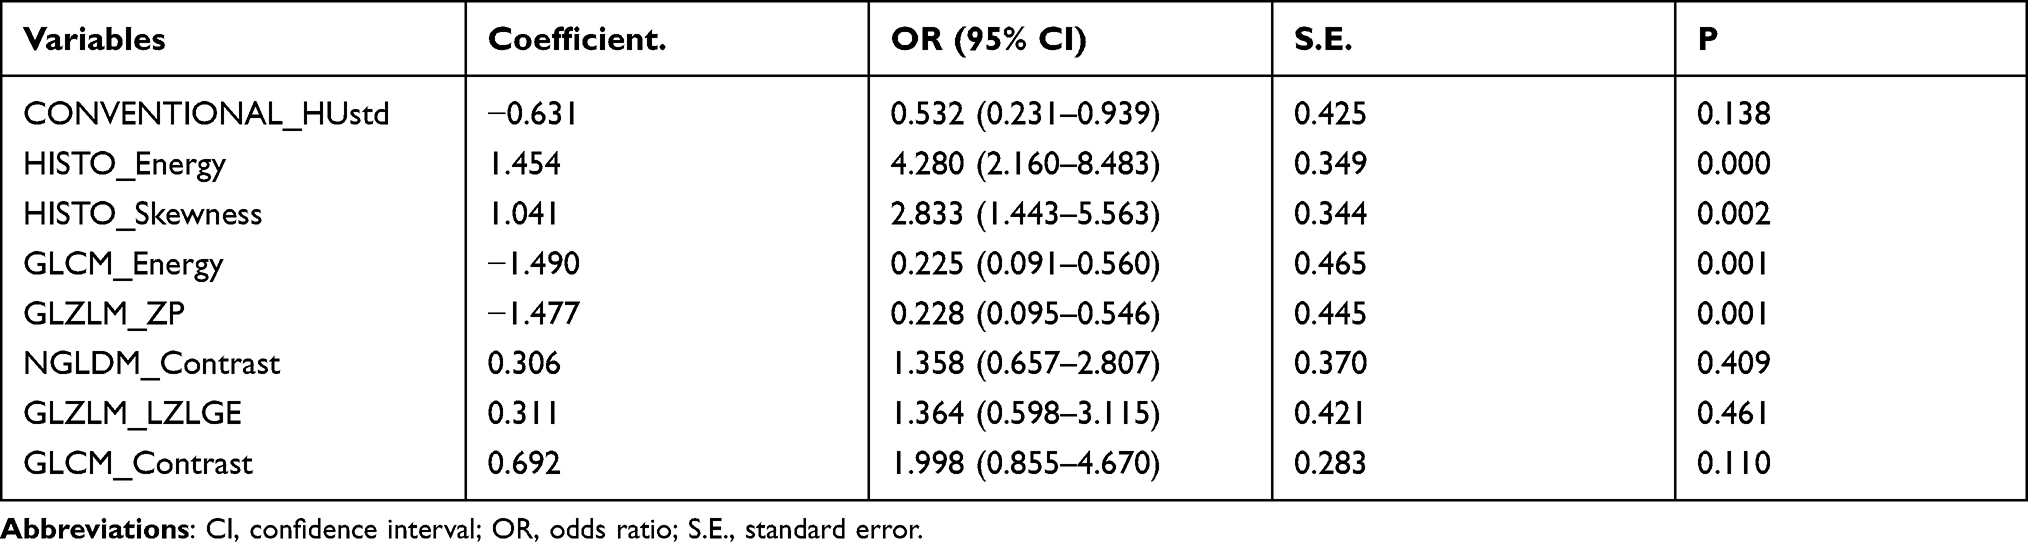 |
Table 2 Multivariate Regression Analyses of the Prediction Model |
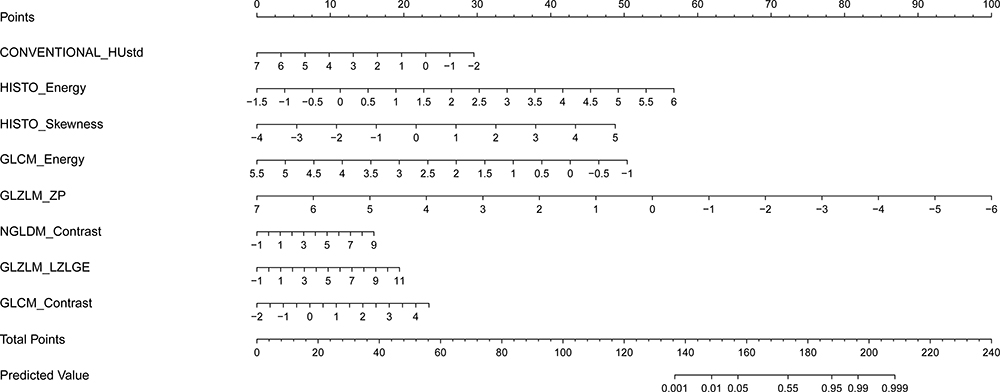 |
Figure 3 Developed a nomogram based on CT enterography features texture analysis. |
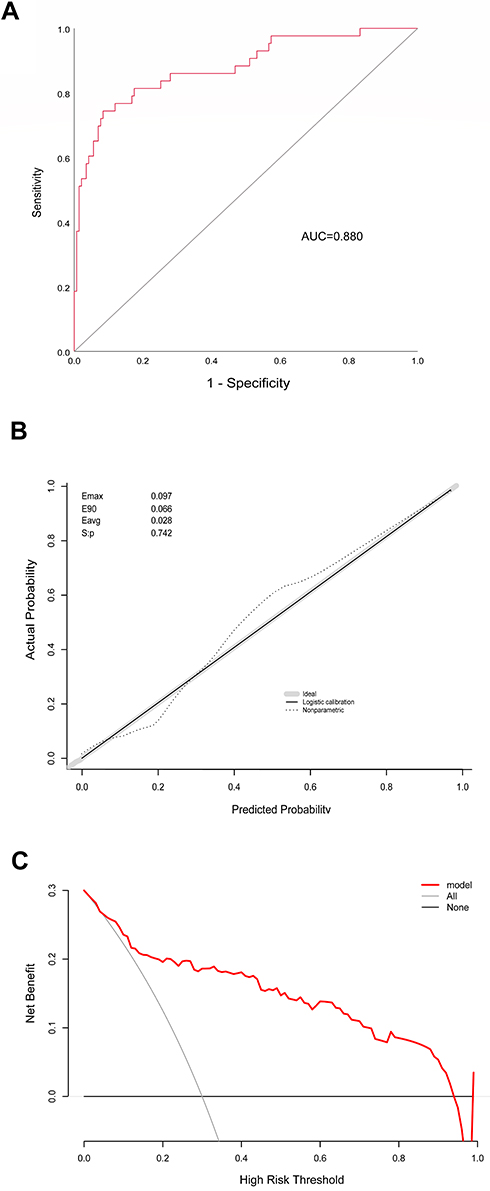 |
Figure 4 (A) Receiver operating curve of the nomogram. (B) Calibration plots of the nomogram. (C) Decision curve analyses of the nomogram. |
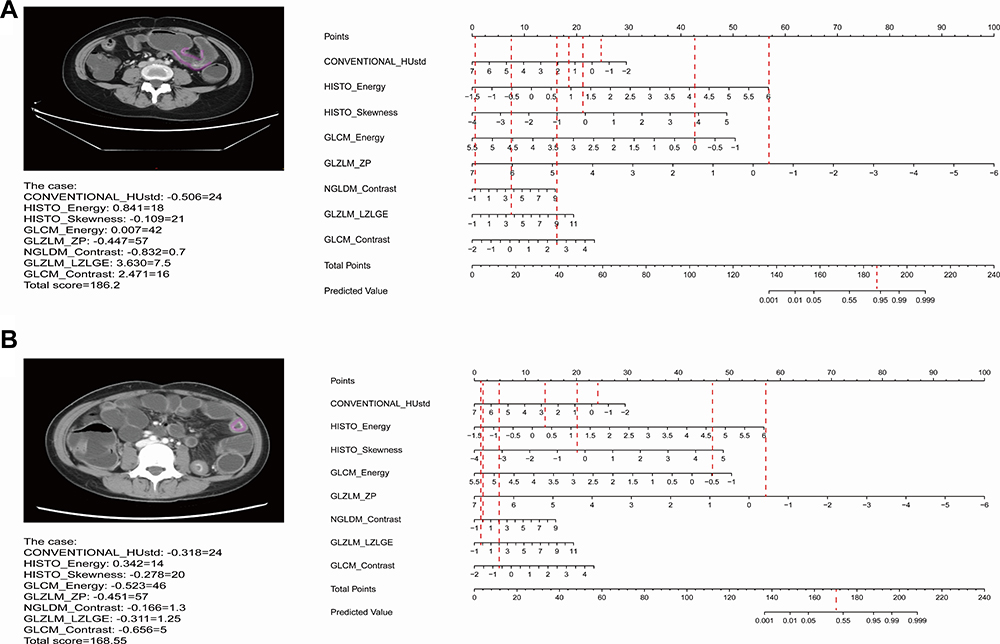 |
Figure 5 (A) Example of adopting nomogram in the patient who was LOR to IFX therapy in CD. (B) Example of adopting nomogram in the patient who was response to IFX therapy in CD. |
Discussion
This study developed and validated a radiomics signature-based nomogram to predict secondary LOR to IFX in patients with CD. The nomogram includes eight items of the radiomics signature extracted by texture analysis. The performance of this prediction nomogram showed adequate discrimination and significant calibration power, as well as a net clinical benefit.
LASSO and ten-fold cross validation were used to reduce 24 features extracted by LIFEx software to eight potential predictors based on their strength of association with outcome. This method combined the individual features into a radiomics signature. We used backward-stepwise multivariate logistic regression analysis to determine the predictive ability of each variable to prevent omitting a potential predictor. Due to the limited sample size, our nomogram was validated by ten-fold cross validation, and the results showed good AUC, as well as high accuracy. The results of the calibration curve and DCA indicate that our nomogram is effective and clinically relevant. Previous models built to predict the efficacy of IFX in patients with CD were mainly based on clinical characteristics and laboratory indicators. Billiet et al developed a matrix-based prediction model with an AUC of 0.80 using BMI, surgical history, and age IFX initiation.8 The predictive powers of interleukin-9 (AUC = 0.746) and fecal calprotectin (AUC = 0.87) in evaluating the efficacy of IFX therapy in patients with CD have also been confirmed by clinical studies.31,32 Additionally, magnetic resonance imaging (MRI) has been reported to be conducive for optimizing therapy for patients with CD during IFX treatment, and the MRI prediction represented an AUC of 0.7359 in assessing endoscopic inflammation at 1 year.33 In contrast, our noninvasive nomogram had an AUC of 0.893.
Texture analysis has been frequently applied to diagnose and evaluate the prognoses of tumors based on different pixel gray values and spatial relationships.34 One previous study reported that radiomics signatures from second-order differentiations could be used to differentiate neoplastic and non-neoplastic lesions in the colon with an AUC of 0.85.35 A nomogram integrating CT features selected by TA and clinical factors was reported to have a C-index of 0.778, and good calibration, which favored the prediction of metastasis in individual lymph nodes in patients with CRC.36 Models and nomograms using TA have also been established to predict the efficacy of various therapies. Kim et al reported a radiomics model consisting of GLCM and histogram-based features, combined with clinical factors that effectively evaluated the prognosis of transarterial chemoembolization in patients with hepatocellular carcinoma (HR = 19.88, P < 0.0001).37 Similarly, a model generated with gray-level correlation and variance signatures analyzed by TA was reported to effectively predict the recurrence of non-small cell lung cancer before stereotactic radiation therapy.38
Although TA has been widely used in solid cancers, few studies have focused on the inflammatory diseases and cavernous organs due to diffuse lesions. Wang et al reported that CTTA-based classifications contributed to a model used to differentiate normal thickened colon wall, inflammatory bowel disease (IBD), and CRC with an ideal AUC.39 As CTE is an effective technique for assessing disease activity in IBD,40 we speculated that TA incorporated with CTE may be a more precise, promising tool to determine the prognosis of patients with CD. Furthermore, various anti-TNF agents have been developed in recent years,41 and prediction models and nomograms are necessary to assist in selecting the best treatment strategy. Therefore, we used noninvasive radiomics features as a convenient biomarker for the prediction of LOR to IFX therapy. Although endoscopy is an accurate method for evaluating the prognosis of CD, it cannot be used in patients with intestinal obstructions or internal fistulas. In addition, while endoscopic scanning can identify mucosal lesions, CD mainly affects multiple layers of the intestine. CTE is a useful tool to identify transluminal lesions. To the best of our knowledge, our study is the first to apply TA in the prognostic prediction of IFX in IBD, providing clinical evidence supporting a change in therapy, and reducing the inefficient use of medical resources.
However, our study has several limitations. First, an external validation by a multicenter study is needed to improve the reliability of our radiomics nomogram in clinical applications. Second, our radiomics nomogram does not include clinical or laboratory features. Third, we used the 2D rather than 3D segmentation technique to select the ROI as it is less challenging and takes less time. Further research focusing on the differences between the performances of 2D and 3D TA in patients with CD is required. In addition, serum biomarkers and nutritional status also reflect the response to IFX, and may be confounding factors that predict the effectiveness of IFX. Our nomogram was constructed using features with predictive power prior to therapy to avoid the omission of important predictors. Future studies with larger patient populations are required to verify the relationship between the efficacy of IFX therapy and radiomics signatures.
Conclusion
We developed an effective novel radiomics nomogram consisting of eight radiographic features to predict the LOR to IFX treatment in patients with CD. TA based on CTE is a significant noninvasive biomarker that can accurately identify patients with CD who have LOR to IFX therapy and can be used to determine the optimal medical therapy on a patient-by-patient basis.
Data Sharing Statement
The data underlying this article will be shared on reasonable request to the corresponding author, Jun Shen.
Acknowledgments
Supported by grants from National Natural Science Foundation of China (No. 81770545, and 81701746) and MDT Project of Clinical Research Innovation Foundation, Renji Hospital, School of Medicine, Shanghai Jiaotong University (PYI-17-003).
Disclosure
The authors declare that they have no known competing financial interests or personal relationships that could have appeared to influence the work reported in this paper.
References
1. Ng SC, Tang W, Ching JY, et al. Incidence and phenotype of inflammatory bowel disease based on results from the Asia-pacific Crohn’s and colitis epidemiology study. Gastroenterology. 2013;145(1):158–165.e2. doi:10.1053/j.gastro.2013.04.007
2. Singh S, Fumery M, Sandborn WJ, et al. Systematic review and network meta-analysis: first- and second-line biologic therapies for moderate-severe Crohn’s disease. Aliment Pharmacol Ther. 2018;48(4):394–409. doi:10.1111/apt.14852
3. Torres J, Bonovas S, Doherty G, et al. ECCO guidelines on therapeutics in Crohn’s disease: medical treatment. J Crohns Colitis. 2020;14(1):4–22. doi:10.1093/ecco-jcc/jjz180
4. Gisbert JP, Panés J. Loss of response and requirement of infliximab dose intensification in Crohn’s disease: a review. Am J Gastroenterol. 2009;104(3):760–767. doi:10.1038/ajg.2008.88
5. Allez M, Karmiris K, Louis E, et al. Report of the ECCO pathogenesis workshop on anti-TNF therapy failures in inflammatory bowel diseases: definitions, frequency and pharmacological aspects. J Crohns Colitis. 2010;4(4):355–366. doi:10.1016/j.crohns.2010.04.004
6. Chaparro M, Panes J, García V, et al. Long-term durability of infliximab treatment in Crohn’s disease and efficacy of dose “escalation” in patients losing response. J Clin Gastroenterol. 2011;45(2):113–118. doi:10.1097/MCG.0b013e3181ebaef9
7. Harper JW, Sinanan MN, Zisman TL. Increased body mass index is associated with earlier time to loss of response to infliximab in patients with inflammatory bowel disease. Inflamm Bowel Dis. 2013;19(10):2118–2124. doi:10.1097/MIB.0b013e31829cf401
8. Billiet T, Papamichael K, de Bruyn M, et al. A matrix-based model predicts primary response to infliximab in Crohn’s disease. J Crohns Colitis. 2015;9(12):1120–1126. doi:10.1093/ecco-jcc/jjv156
9. Sprakes MB, Ford AC, Warren L, et al. Efficacy, tolerability, and predictors of response to infliximab therapy for Crohn’s disease: a large single centre experience. J Crohns Colitis. 2012;6(2):143–153. doi:10.1016/j.crohns.2011.07.011
10. Maser EA, Villela R, Silverberg MS, et al. Association of trough serum infliximab to clinical outcome after scheduled maintenance treatment for Crohn’s disease. Clin Gastroenterol Hepatol. 2006;4(10):1248–1254. doi:10.1016/j.cgh.2006.06.025
11. Zapater P, Almenara S, Gutiérrez A, et al. Actual anti-TNF Trough levels relate to serum IL-10 in drug-responding patients with Crohn’s disease. Inflamm Bowel Dis. 2019;25(8):1357–1366. doi:10.1093/ibd/izz012
12. Leal RF, Planell N, Kajekar R, et al. Identification of inflammatory mediators in patients with Crohn’s disease unresponsive to anti-TNFα therapy. Gut. 2015;64(2):233–242. doi:10.1136/gutjnl-2013-306518
13. Matsuoka K, Hamada S, Shimizu M, et al. Factors predicting the therapeutic response to infliximab during maintenance therapy in Japanese patients with Crohn’s disease. PLoS One. 2018;13(10):e0204632. doi:10.1371/journal.pone.0204632
14. Bashir U, Siddique MM, McLean E, et al. Imaging heterogeneity in lung cancer: techniques, applications, and challenges. AJR Am J Roentgenol. 2016;207(3):534–543. doi:10.2214/AJR.15.15864
15. Comelli A, Stefano A, Coronnello C, et al. Radiomics: A New Biomedical Workflow to Create a Predictive Model. Cham: Springer International Publishing; 2020.
16. Varghese BA, Cen SY, Hwang DH, et al. Texture analysis of imaging: what radiologists need to know. AJR Am J Roentgenol. 2019;212(3):520–528. doi:10.2214/AJR.18.20624
17. Zhang H, Graham CM, Elci O, et al. Locally advanced squamous cell carcinoma of the head and neck: CT texture and histogram analysis allow independent prediction of overall survival in patients treated with induction chemotherapy. Radiology. 2013;269(3):801–809. doi:10.1148/radiol.13130110
18. Miles KA, Ganeshan B, Griffiths MR, et al. Colorectal cancer: texture analysis of portal phase hepatic CT images as a potential marker of survival. Radiology. 2009;250(2):444–452. doi:10.1148/radiol.2502071879
19. Li Z, Yu L, Wang X, et al. Diagnostic performance of mammographic texture analysis in the differential diagnosis of benign and malignant breast tumors. Clin Breast Cancer. 2018;18(4):e621–e27. doi:10.1016/j.clbc.2017.11.004
20. Maaser C, Sturm A, Vavricka SR, et al. ECCO-ESGAR guideline for diagnostic assessment in IBD part 1: initial diagnosis, monitoring of known IBD, detection of complications. J Crohns Colitis. 2019;13(2):144–164.
21. Towbin AJ, Sullivan J, Denson LA, et al. CT and MR enterography in children and adolescents with inflammatory bowel disease. Radiographics. 2013;33(7):1843–1860. doi:10.1148/rg.337105140
22. Jensen MD, Ormstrup T, Vagn-Hansen C, et al. Interobserver and intermodality agreement for detection of small bowel Crohn’s disease with MR enterography and CT enterography. Inflamm Bowel Dis. 2011;17(5):1081–1088. doi:10.1002/ibd.21534
23. Gomollón F, Dignass A, Annese V, et al. 3rd European evidence-based consensus on the diagnosis and management of Crohn’s disease 2016: part 1: diagnosis and medical management. J Crohns Colitis. 2017;11(1):3–25. doi:10.1093/ecco-jcc/jjw168
24. Yu L, Yang X, Xia L, et al. Infliximab preferentially induces clinical remission and mucosal healing in short course Crohn’s disease with luminal lesions through balancing abnormal immune response in gut mucosa. Mediators Inflamm. 2015;2015.
25. Bruining DH, Zimmermann EM, Loftus EV, et al. Consensus recommendations for evaluation, interpretation, and utilization of computed tomography and magnetic resonance enterography in patients with small bowel Crohn’s disease. Gastroenterology. 2018;154(4):1172–1194. doi:10.1053/j.gastro.2017.11.274
26. Nioche C, Orlhac F, Boughdad S, et al. LIFEx: a freeware for radiomic feature calculation in multimodality imaging to accelerate advances in the characterization of tumor heterogeneity. Cancer Res. 2018;78(16):4786–4789. doi:10.1158/0008-5472.CAN-18-0125
27. Hu Y, Zhao X, Zhang J, et al. Value of (18)F-FDG PET/CT radiomic features to distinguish solitary lung adenocarcinoma from tuberculosis. Eur J Nucl Med Mol Imaging. 2021;48(1):231–240. doi:10.1007/s00259-020-04924-6
28. Wang B. A two-stage peak alignment algorithm for two-dimensional gas chromatography time-of-flight mass spectrometry-based metabolomics. Comput Struct Biotechnol J. 2013;7:e201304002. doi:10.5936/csbj.201304002
29. She Y, Zhang L, Zhu H, et al. The predictive value of CT-based radiomics in differentiating indolent from invasive lung adenocarcinoma in patients with pulmonary nodules. Eur Radiol. 2018;28(12):5121–5128. doi:10.1007/s00330-018-5509-9
30. Collins GS, Reitsma JB, Altman DG, et al. Transparent reporting of a multivariable prediction model for individual prognosis or diagnosis (TRIPOD): the TRIPOD statement. Circulation. 2015;131:211–219.
31. Feng T, Chen B, Li L, et al. Serum interleukin 9 levels predict disease severity and the clinical efficacy of infliximab in patients with Crohn’s disease. Inflamm Bowel Dis. 2017;23(10):1817–1824. doi:10.1097/MIB.0000000000001172
32. Boschetti G, Garnero P, Moussata D, et al. Accuracies of serum and fecal S100 proteins (calprotectin and calgranulin C) to predict the response to TNF antagonists in patients with Crohn’s disease. Inflamm Bowel Dis. 2015;21(2):331–336. doi:10.1097/MIB.0000000000000273
33. Sakuraba H, Ishiguro Y, Hasui K, et al. Prediction of maintained mucosal healing in patients with Crohn’s disease under treatment with infliximab using diffusion-weighted magnetic resonance imaging. Digestion. 2014;89(1):49–54. doi:10.1159/000356220
34. Ganeshan B, Miles KA. Quantifying tumour heterogeneity with CT. Cancer Imaging. 2013;13(1):140–149. doi:10.1102/1470-7330.2013.0015
35. Song B, Zhang G, Lu H, et al. Volumetric texture features from higher-order images for diagnosis of colon lesions via CT colonography. Int J Comput Assist Radiol Surg. 2014;9(6):1021–1031. doi:10.1007/s11548-014-0991-2
36. Huang YQ, Liang CH, He L, et al. Development and validation of a radiomics nomogram for preoperative prediction of lymph node metastasis in colorectal cancer. J Clin Oncol. 2016;34(18):2157–2164. doi:10.1200/JCO.2015.65.9128
37. Kim J, Choi SJ, Lee SH, et al. Predicting survival using pretreatment CT for patients with hepatocellular carcinoma treated with transarterial chemoembolization: comparison of models using radiomics. AJR Am J Roentgenol. 2018;211(5):1026–1034. doi:10.2214/AJR.18.19507
38. Dennie C, Thornhill R, Souza CA, et al. Quantitative texture analysis on pre-treatment computed tomography predicts local recurrence in stage I non-small cell lung cancer following stereotactic radiation therapy. Quant Imaging Med Surg. 2017;7(6):614–622. doi:10.21037/qims.2017.11.01
39. Wang X, Yuan M, Mi H, et al. The feasibility of differentiating colorectal cancer from normal and inflammatory thickening colon wall using CT texture analysis. Sci Rep. 2020;10(1):6346. doi:10.1038/s41598-020-62973-1
40. Horvat N, Tavares CC, Andrade AR, et al. Inter- and intraobserver agreement in computed tomography enterography in inflammatory bowel disease. World J Gastroenterol. 2016;22(45):10002–10008. doi:10.3748/wjg.v22.i45.10002
41. Hazlewood GS, Rezaie A, Borman M, et al. Comparative effectiveness of immunosuppressants and biologics for inducing and maintaining remission in Crohn’s disease: a network meta-analysis. Gastroenterology. 2015;148(2):344–354. doi:10.1053/j.gastro.2014.10.011
 © 2021 The Author(s). This work is published and licensed by Dove Medical Press Limited. The
full terms of this license are available at https://www.dovepress.com/terms.php
and incorporate the Creative Commons Attribution
- Non Commercial (unported, v3.0) License.
By accessing the work you hereby accept the Terms. Non-commercial uses of the work are permitted
without any further permission from Dove Medical Press Limited, provided the work is properly
attributed. For permission for commercial use of this work, please see paragraphs 4.2 and 5 of our Terms.
© 2021 The Author(s). This work is published and licensed by Dove Medical Press Limited. The
full terms of this license are available at https://www.dovepress.com/terms.php
and incorporate the Creative Commons Attribution
- Non Commercial (unported, v3.0) License.
By accessing the work you hereby accept the Terms. Non-commercial uses of the work are permitted
without any further permission from Dove Medical Press Limited, provided the work is properly
attributed. For permission for commercial use of this work, please see paragraphs 4.2 and 5 of our Terms.