Back to Journals » Journal of Inflammation Research » Volume 16
A Novel Prognostic Marker and Therapeutic Target Associated with Glioma Progression in a Tumor Immune Microenvironment
Authors Zhang JJ ![]() , Zhang Y, Chen Q, Chen QN, Yang X, Zhu XL, Hao CY, Duan HB
, Zhang Y, Chen Q, Chen QN, Yang X, Zhu XL, Hao CY, Duan HB
Received 28 November 2022
Accepted for publication 21 February 2023
Published 1 March 2023 Volume 2023:16 Pages 895—916
DOI https://doi.org/10.2147/JIR.S398775
Checked for plagiarism Yes
Review by Single anonymous peer review
Peer reviewer comments 2
Editor who approved publication: Dr Adam Bachstetter
Jun-Jie Zhang,1,* Yu Zhang,2,* Qian Chen,1 Qi-Ning Chen,1 Xin Yang,1 Xiao-Lin Zhu,1 Chun-Yan Hao,3 Hu-Bin Duan1
1Department of Neurosurgery, First Hospital of Shanxi Medical University, Taiyuan, Shanxi, 030001, People’s Republic of China; 2Department of Neurosurgery, Beijing Tiantan Hospital, Capital Medical University, Beijing, People’s Republic of China; 3Department of Geriatrics, First Hospital of Shanxi Medical University, Taiyuan, Shanxi, 030001, People’s Republic of China
*These authors contributed equally to this work
Correspondence: Hu-Bin Duan; Chun-Yan Hao, Tel +8613994201664 ; +8613803494928, Email [email protected]; [email protected]
Background: Immune microenvironment serves a vital role in glioma progression, and a large number of studies have found that tumor progression can be reduced to some extent by modulating the immune process in tumors.
Materials and Methods: ImmuneScore of each sample in CGGA datasets were calculated with Estimate R package, and samples were grouped by median ImmuneScore values for differential analysis to obtain immune microenvironment differential genes. We further conducted survival analysis, ROC curve analysis, independent prognostic analysis, and clinical correlation analysis on glioma sample genes in CGGA to obtain glioma prognostic genes, and then identified their intersection with immune microenvironment DEGs by Venn tool. The GEPIA and UALCAN databases were used to verify the differential expression of intersecting genes in the glioma and normal brain and to identify our target gene. After validation of their prognostic value, we constructed a nomogram to calculate the risk score and to estimate the accuracy of prognostic model. We mined co-expression genes, enriched functions and pathways, and correlations to immune cell infiltration of unigene with an online database. Finally, we verified the differential expression of FCGBP in glioma by immunohistochemical staining.
Results: We finally selected Fc fragment of IgG-binding protein (FCGBP) as our study gene. The prognostic values of FCGBP were validated by a series of analyses. Immunohistochemical staining showed that FCGBP expression increased in gliomas and was up-regulated with the progression of glioma grade.
Conclusion: As a key unigene in glioma progression, FCGBP contributes to the regulation of immune microenvironment and has the potential to be a prognostic biomarker and immune targets.
Keywords: glioma, immune microenvironment, FCGBP, tumor progression, therapeutic target
Introduction
Glioma is the most common primary malignant tumor with poor prognosis in central nervous system.1,2 Current recommended treatments for glioma include surgery, radiotherapy, and chemotherapy.3,4 However, glioma is highly invasive and aggressive with an indistinct border.5,6 Complete removal of tumor is difficult to fulfil through surgery resection.7,8 In addition, the side effects of radiotherapy and chemotherapy are great concerns. Immunotherapy has been a recent breakthrough in glioma treatment.9–11 A successful immunotherapy example is treating malignant melanoma with cytotoxic T lymphocyte-associated antigen 4 (CTLA4), programmed death 1 (PD-1), and programmed death ligand 1 (PD-L1) inhibitors.12,13 However, the trial application of immunosuppressive targets in gliomas such as PD-1 and PDL1 inhibitors failed.14–17 Overall, effective and highly specific targeted drugs are lacking in clinical practice. Using bioinformatics to explore new targets for tumor treatment has been recognized as an efficient and feasible method. At present, many potential targets for glioma treatment have been developed, and various prognosis models have been successfully constructed using these target genes, some of which have been verified to be reliable.18–20
Fc fragment of IgG-binding protein (FCGBP) is a newly identified potential tumor marker. Up to now, reports of FCGBP and glioma are extremely rare.21–23 We identified FCGBP through multiple analyses and validated its prognostic value in multiple genomes. Our immunoassay results showed that FCGBP is highly associated with immune cell infiltration in glioma.
Materials and Methods
Workflow of the present study is shown in Figure 1.
 |
Figure 1 Research flow chart. |
Data Sources and Collation
The mRNAseq 69324,25 and mRNAseq 32526,27 datasets were downloaded from China Glioma Genome Atlas database (CGGA). The CGGA database (http://www.cgga.org.cn/download.jsp) contains functional genomics data from 2000 Chinese glioma samples with detailed clinical profile such as gender, age, radiotherapy and chemotherapy status, complete follow-up profile, histopathological classification, WHO malignancy grades, and primary-recurrence status.28 We collated the mRNA expression profile and clinical profile of 749 overall glioma samples. The expression data were log2 processed (rt=log2(rt+1)), batch effect corrected and eventually merged with corresponding clinical data. The R software code used in this study can be found in Supplementary Materials.
Immune Microenvironment Score
We use the algorithm of the ESTIMATE package in R 4.0.2 to estimate the ratio of immune cell components in tumor microenvironment based on the Illumina platform. The results are presented as ImmuneScore. ImmuneScore is positively correlated with the content of immune cell components in the microenvironment. CGGA samples were grouped by median ImmuneScore. Kaplan–Meier survival analysis (95% CI) was conducted in different groups to determine the correlation between the ImmuneScore of CGGA samples and patient survival. A Log rank test was used to check the significance of the relationships. Correlation analysis between ImmuneScore and clinical data of samples was performed using limma and ggpubr packages of R software to assess the correlation between ImmuneScore and clinical characteristics of glioma patients. The Wilcoxon signed-rank test was used to evaluate the relationship between the two groups. Kruskal–Wallis test was used to evaluate the relationships among three or more groups. P<0.05 was considered statistically significant.
Differential Gene Expression Analysis
As set forth, glioma samples were divided into two groups. The Wilcoxon signed-rank test was used for differential gene expression analysis, and limma R software package was used to identify differentially expressed genes (DEGs) in the immune microenvironment and logFC (High ImmuneScore group vs Low ImmuneScore group). The filtering criteria was set as FDR<0.05, |logFC|>1. DEGs obtained were then entered into the STRING database (https://string-db.org/), which is an online platform with known protein–protein interactions (PPI). 2031 species, 9,643,763 proteins, and 1,380,838,440 interactions are currently stored in STRING platform. We investigated the potential PPI among DEGs and plotted PPI network with minimum required interaction score>0.4. The PPI network was finally adjusted by Cytoscape. We conducted GO function and KEGG pathway enrichment analysis for the identified DEGs. GO annotation has three major categories: Molecular Function (MF), Biological Process (BP), and Cellular Components (CC). The three categories defined and described the function of genes in multiple ways. KEGG is a comprehensive database integrating genomic, chemical, and systemic functional information. KEGG is designed to store information about molecular signaling pathways in different species. Through GO/KEGG enrichment analysis, we fostered an understanding of the corresponding functions and pathways of DEGs.
Screening for Core Prognostic Gene in Immune Microenvironment
To obtain the key prognostic genes in the immune microenvironment of glioma, we first performed survival analysis (P<0.001), receiver operating characteristic (ROC) curve analysis (AUC>0.695), independent prognostic analysis (P<0.01), and clinical correlation analysis (P<0.05) on glioma sample genes in CGGA. Survival analysis was used to verify the correlation between genes and survival of glioma patients. ROC curve was used to verify the accuracy of genes in predicting survival. Independent prognostic analysis was used to screen prognostic risk factors of glioma, and clinical correlation analysis was used to find the correlation between gene expression and clinical characteristics of patients. The intersection of prognosis-related genes and DEGs in the immune microenvironment was acquired using the Venn online webpage (http://bioinformatics.psb.ugent.be/webtools/Venn/). The GEPIA (http://gepia.cancer-PKu.cn/) database was used to analyze the differential expression of intersection genes in glioma and normal tissues and to screen and determine our target genes. GEPIA integrated gene expression profile from the TCGA and GTEx project and provided multiple data analysis and visualization capabilities.29 Finally, the UALCAN (http://ualcan.path.uab.edu/) database was used to validate the relationship between target genes and glioma grade and progression. UALCAN is a TCGA database online analysis and mining website that provides gene expression levels, survival analysis, and correlation analysis. The screening process is shown in Figure 1.
Survival Analysis and ROC Curves
We grouped glioma samples from CGGA by median gene expression value and conducted different groups for survival analysis using survival and survminer R packages. In addition, we downloaded GSE43378 dataset GEO database (https://www.ncbi.nlm.nih.gov/geo/) for further validation. The Gene Expression Omnibus (GEO) database stores microarray profile, second-generation sequencing data, and other high-throughput sequencing data.30 We extracted gene expression profile and clinical profile from GSE43378 and grouped samples by median expression level for further survival analysis. By using Kaplan–Meier method, we investigated the correlation between single gene expression and survival of patients. P<0.05 was considered statistically significant. Eventually, we constructed ROC curve for samples from CGGA and GSE43378 using survivalROC R package to evaluate the accuracy of single gene prognosis. The AUC (Area Under Curve) refers to the area under the ROC Curve, which ranges from 0.1 to 1. AUC values of 0.5–0.7 were considered moderate, 0.7–0.9 were better, and >0.9 were superior.
Independent Prognostic Analysis
To determine the correlation between single gene expression and clinical characteristics and prognosis of glioma patients, we conducted univariate and multivariate independent prognostic analysis on gene expression profile, clinical profile, and survival profile in CGGA and GSE43378 by Cox regression method using survival R package. The clinical profile of glioma patients in CGGA and GSE43378 are shown in Table 1. We further screened out clinical characteristics relating to glioma prognosis and determined the prognostic value of the single gene, p<0.05 was considered statistically significant.
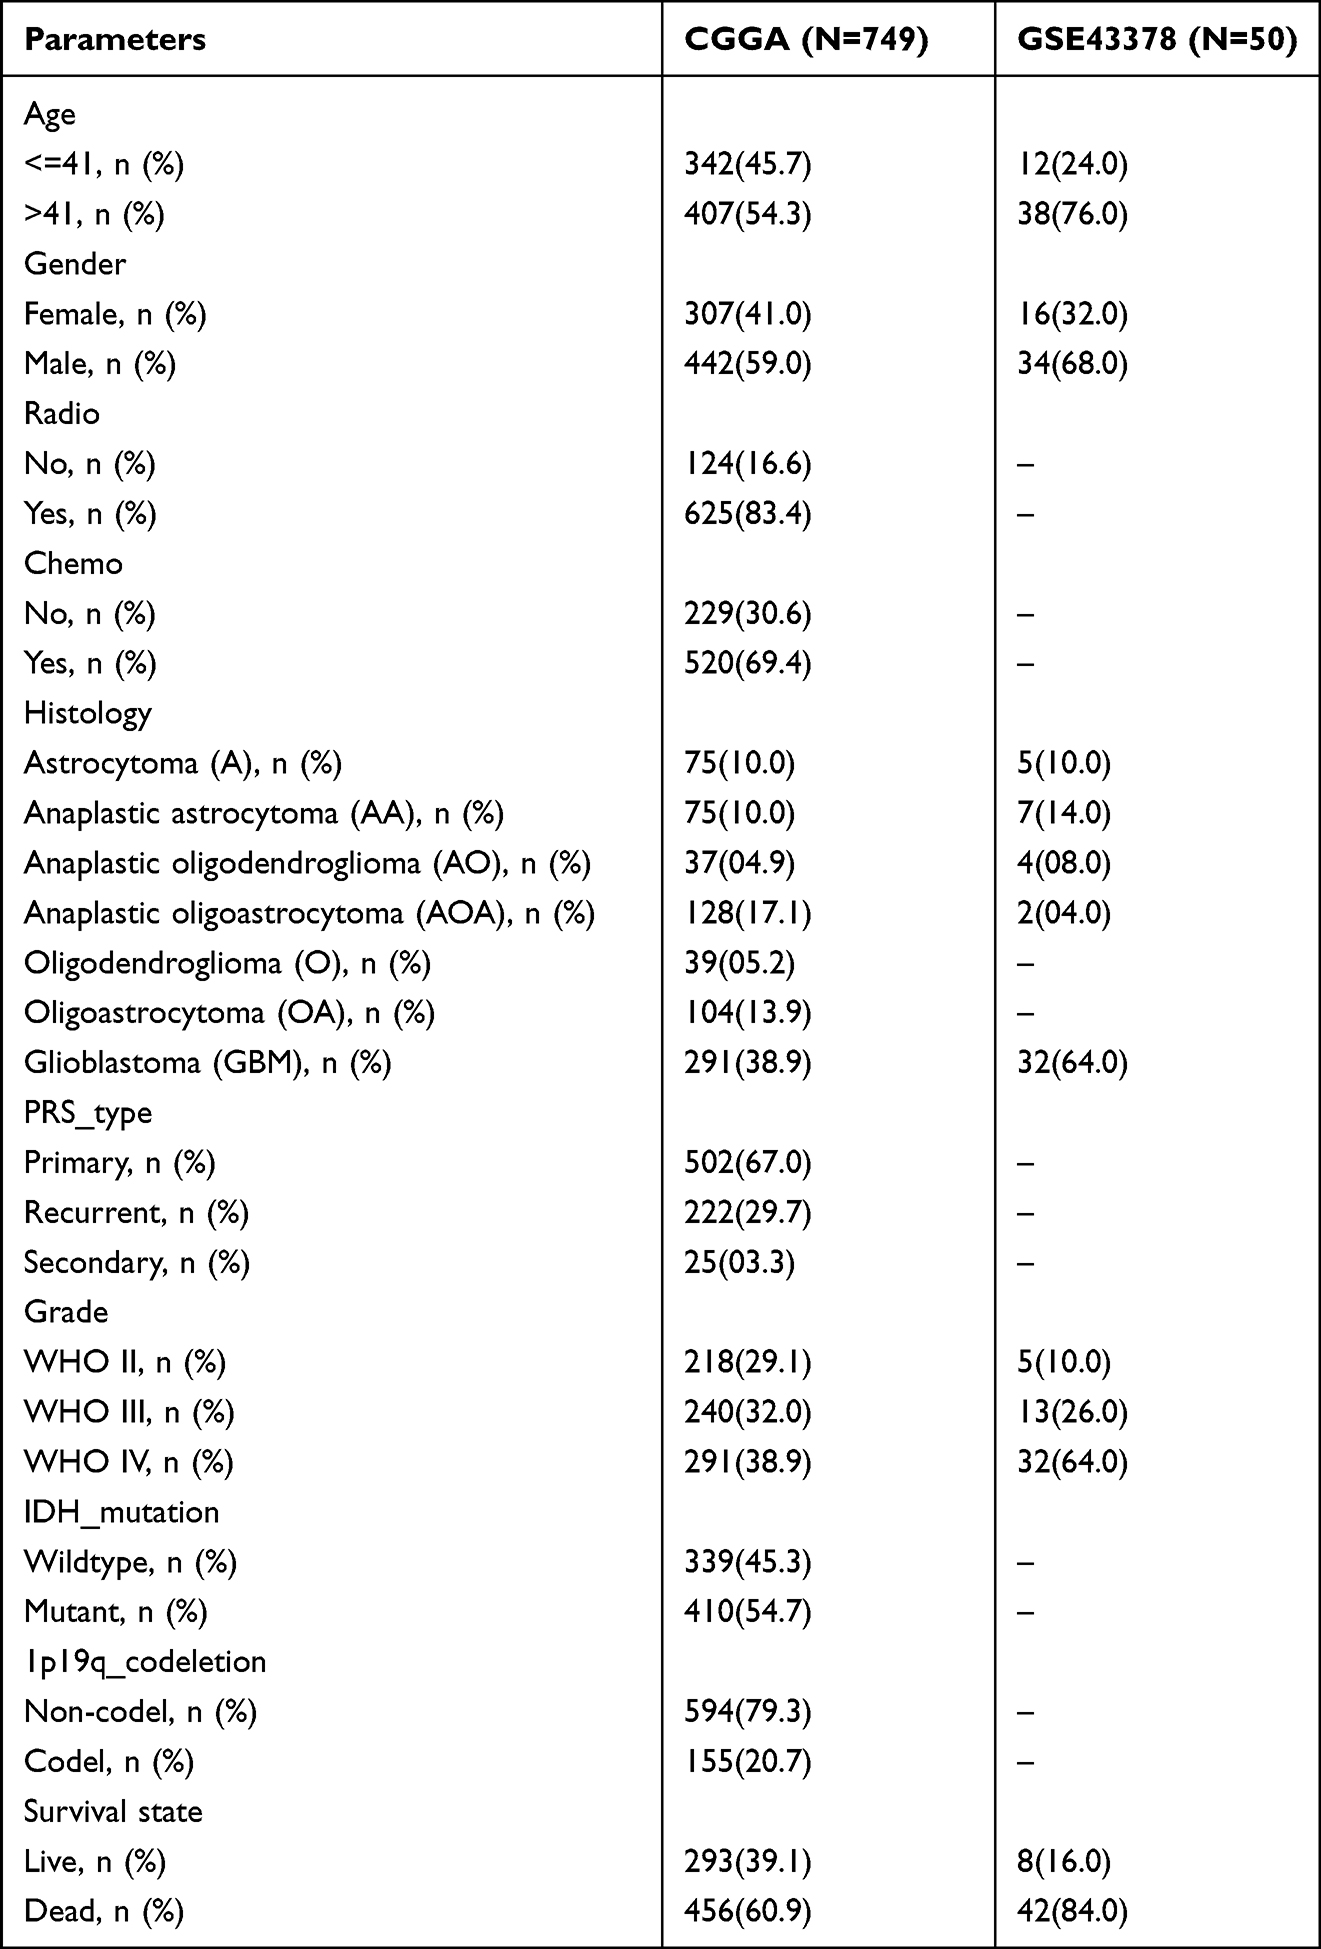 |
Table 1 Clinical Characteristics of Patients with Glioma in CGGA and GSE43378 |
Prognostic Model Construction
The prognostic model was constructed with rms R package based on single gene expression and prognosis-related clinical characteristics of glioma samples in CGGA. To validate the clinical value of this model, we constructed a Nomogram to predict the 1-year, 3-year, and 5-year survival rates of glioma patients. Nomogram scores were used to evaluate the possible clinical prognosis of patients. Risk scores were calculated in Cox regression models, based on the median value of which the glioma samples in CGGA were divided into high-risk and low-risk groups.
Validation on Prognostic Model
We first validated the prognostic model by survival analysis in the high-risk and low-risk groups, analyzed whether there was a difference in the survival of glioma patients in the high-risk and low-risk groups, and determined the correlation between the prognostic model risk score and the survival of glioma patients (p < 0.05). Finally, ROC curve was used to evaluate the sensitivity and specificity of the prognostic model. The AUC values were calculated. AUC between 0.5 and 0.7 is moderate, 0.7–0.9 is better, and >0.9 is superior.
Clinical Correlation Analysis
We analyzed the correlation between single gene expression and clinical features in CGGA and GSE43378 with beeswarm R package and ggpubr R package. P<0.05 was considered statistically significant. The Wilcoxon signed-rank test was used to evaluate the relationship between the two groups. Kruskal–Wallis test was used to evaluate the relationships among three or more groups. P<0.05 was considered statistically significant.
GSEA Enrichment Analysis and Co-Expression Correlation Analysis
After samples in CGGA was grouped by median gene expression level, we conducted enrichment analysis on upregulated gene group using GSEA software. The default weighted enrichment method was applied for enrichment analysis. The random combinations were set for 1000 times. Setting P value<0.001, FDR <0.001 and |NES| >1 were considered to be significantly enriched. The top 10 enriched GO functions and KEGG pathways were acquired. We also conducted co-expression correlation analysis on single gene and CGGA gene sets through limma software package. Genes with significant association with the single gene in CGGA samples (cor>0.5, P<0.001) were screened out and identified as co-expression related genes.
Target Enrichment and Immune Cell Infiltration
LinkedOmics (http://www.linkedomics.org/) integrates multi-omics data of 32 cancer types from TCGA, as well as mass spectrometry-based proteomics data and modifier-omics data of breast, colorectal, and ovarian tumors from CPTAC.31 Based on Over-Representation Enrichment Analysis (ORA), the LinkInterpreter module in the LinkedOmic database is able to filter the top five KEGG Pathways, miRNA Targets, and Transcription Factor Targets of single gene enrichment in low-grade gliomas (LGG) and glioblastoma (GBM). The Rank Criteria was set as P-value. The Sign (or Direction) was set as a positive correlation. The TIMER database (https://cistrome.shinyapps.io/timer/) is a comprehensive platform developed by Harvard University for systematic analysis on immune infiltration in various cancers. The TIMER algorithm can estimate the infiltration of six types of immune cells: B cells, CD4+ T cells, CD8+ T cells, Neutrophils, Macrophages, and Dendritic cells.32 We analyzed the correlation between gene expression and various immune cell infiltration in LGG and GBM using the gene module in TIMER database. Furthermore, the expression correlation of single gene with six classical immune checkpoints (PDCD1, CD274, PDCD1LG2, CTLA4, LAG3, and HAVCR2) in LGG and GBM was analyzed. The correlation between specific gene expression and infiltration of different immune cells in LGG and GBM tissues was assessed by purity-corrected partial Spearman correlation analysis. Also, the relationship between the two particular genes was calculated by Spearman correlation analysis. P<0.05 was considered statistically significant. The survival module in the Timer database can facilitate the analysis of correlation among immune cell infiltration, single gene, and patient survival. Kaplan–Meier curves were plotted to visualize the survival differences for immune infiltration and gene expression. P-value <0.05 was considered to be statistically significant.
Immunohistochemistry and Image Analysis
The differential expression of the target single gene in normal brain, low-grade glioma, and high-grade glioma tissues was verified by immunohistochemical experiments. This experiment was approved by the Ethics Committee of the First Hospital of Shanxi Medical University and complied with the Declaration of Helsinki. Five normal brain tissues were collected from patients with traumatic brain injury or epilepsy, 10 postoperative tissues from patients with low-grade glioma, and 10 postoperative tissues from patients with high-grade glioma. After routine paraffin embedding, tissue sections were taken, placed on slides, deparaffinized, and rehydrated. After antigen retrieval and endogenous peroxidase blockade, they were then exposed to monogenic polyclonal antibodies (bs-13168R, Bioss) and enzyme-labeled IgG polymers. Diaminobenzidine (DAB) chromogenic solution and hematoxylin were used as a counterstain to visualize the presence of antibodies. Immunohistochemical image analysis was performed using the Scanscope digital pathology scanning system from Aperio, USA, and the expression of FCGBP in tissues was quantified by Cytoplasmic V2 software with Cytoplasm H-Score. Cytoplasm H-Score was obtained by multiplying the percentage of positive cells by the staining intensity score.
Results
Immune Microenvironment Score
Results of survival analysis showed significant differences between the high ImmuneScore group and the low ImmuneScore group (P < 0.001). The overall survival was significantly longer in the low ImmuneScore group (Figure 2A). Therefore, the survival of glioma patients is highly correlated to the ImmuneScore of samples. Correlation analysis showed that the ImmuneScore of sample was significantly correlated with age, tumor grade, IDH mutation status, and 1p19q codeletion status of the patients, and the ImmuneScore was significantly higher in the >41 years old, Wildtype, and 1p19q Non-codel samples than in the <41 years old, IDH mutation, and 1p19q codeletion samples, and the sample ImmuneScore increased with the grade of glioma (Figure 2B–E).
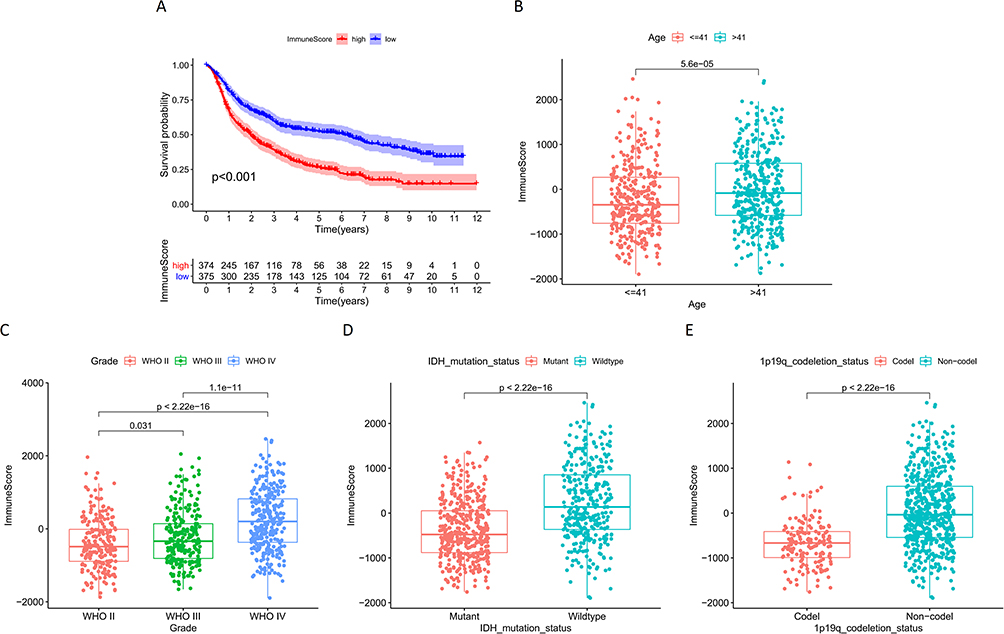 |
Figure 2 (A) Survival analysis of glioma samples grouped by ImmuneScore median values in CGGA; Correlation analysis of ImmuneScore and clinical characteristics of samples in CGGA: (B) Age; (C) Grade; (D) IDH mutation status; (E) 1p19q codeletion status. |
Differential Gene Expression Analysis
Using median ImmuneScore value, CGGA samples were divided into two groups. Differential analysis revealed 997 DEGs, of which 612 were upregulated and 385 were downregulated (Figure 3A). Correlation heat map showing the 50 most significantly up- and down-regulated genes (Figure 3B). The STRING database demonstrated the potential protein interactions of all DEGs. Cytoscape further displayed 544 gene nodes and 4072 edges among them (Figure 3C). The GO functions were mainly enriched in positive regulation of cell activation, positive regulation of leukocyte activation, positive regulation of lymphocyte activation, regulation of T cell activation, and T cell activation (Figure 4A). Functions enriched in BP included T cell activation, positive regulation of cell activation, positive regulation of leukocyte activation, positive regulation of lymphocyte activation, regulation of T cell activation, lymphocyte differentiation, lymphocyte mediated immunity, lymphocyte proliferation, T cell differentiation, and positive regulation of leukocyte cell−cell adhesion. Functions enriched in CC included external side of plasma membrane, synaptic membrane, ion channel complex, transmembrane transporter complex, transporter complex, postsynaptic membrane, cation channel complex, intrinsic component of postsynaptic specialization membrane, immunoglobulin complex, circulating, and integral component of postsynaptic specialization membrane. Functions enriched in MF included channel activity, passive transmembrane transporter activity, ion channel activity, gated channel activity, cation channel activity, cytokine activity, cytokine receptor binding, neurotransmitter receptor activity, voltage−gated cation channel activity, and postsynaptic neurotransmitter receptor activity (Figure 4B). The KEGG pathway was enriched in Cytokine−cytokine receptor interaction, Hematopoietic cell lineage, Neuroactive ligand−receptor interaction, Nicotine addiction, and Viral protein interaction with cytokine and cytokine receptor (Figure 4C). The enriched pathways are shown in Figure 4D.
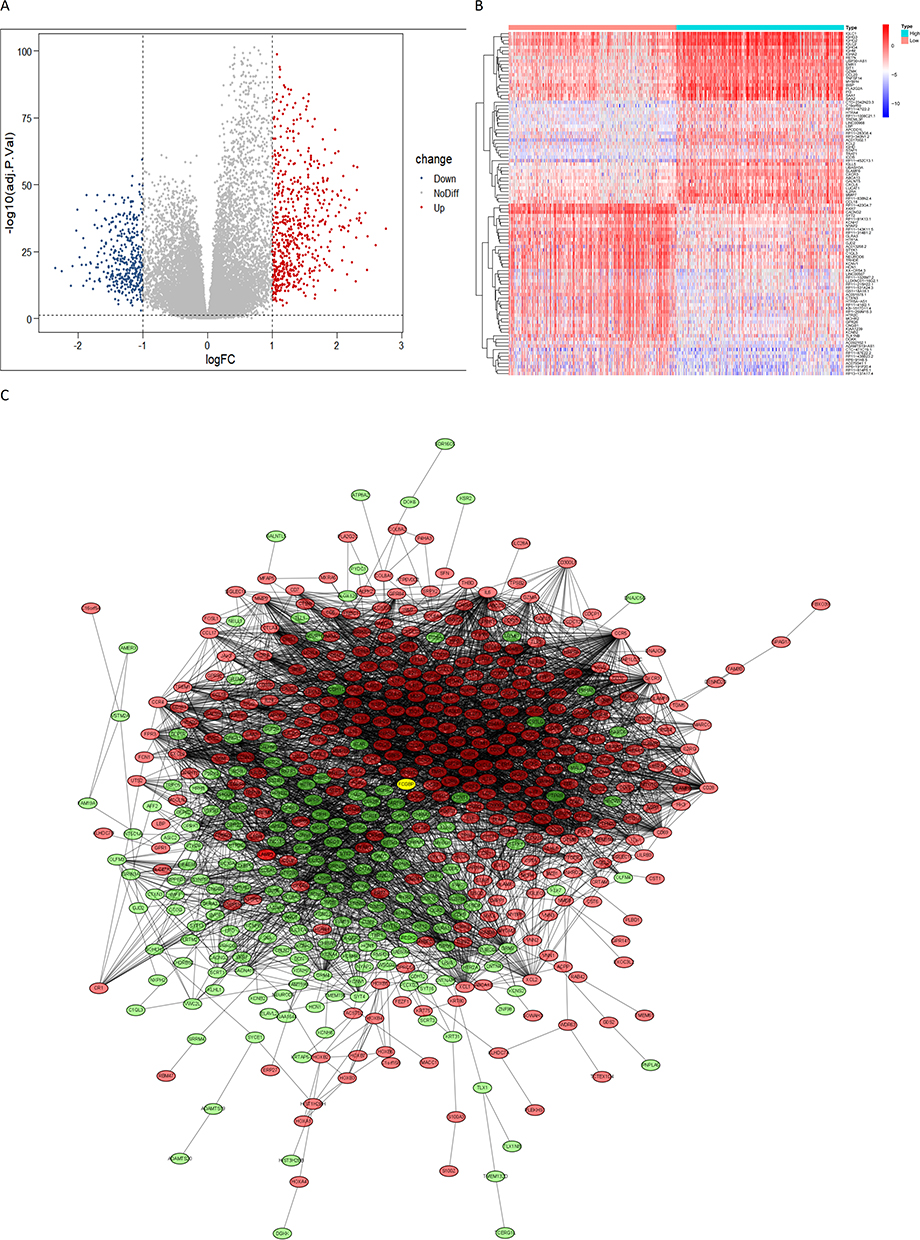 |
Figure 3 (A) A volcano map of differential genes in the glioma immune microenvironment: logFC (High ImmuneScore group vs Low ImmuneScore group); (B) Correlation heat maps of the 50 most significantly up-regulated and down-regulated differential genes; (C) PPI network of differential genes in the glioma immune microenvironment, red dots represent upregulated genes, green dots represent downregulated genes, yellow dots represent study single gene. |
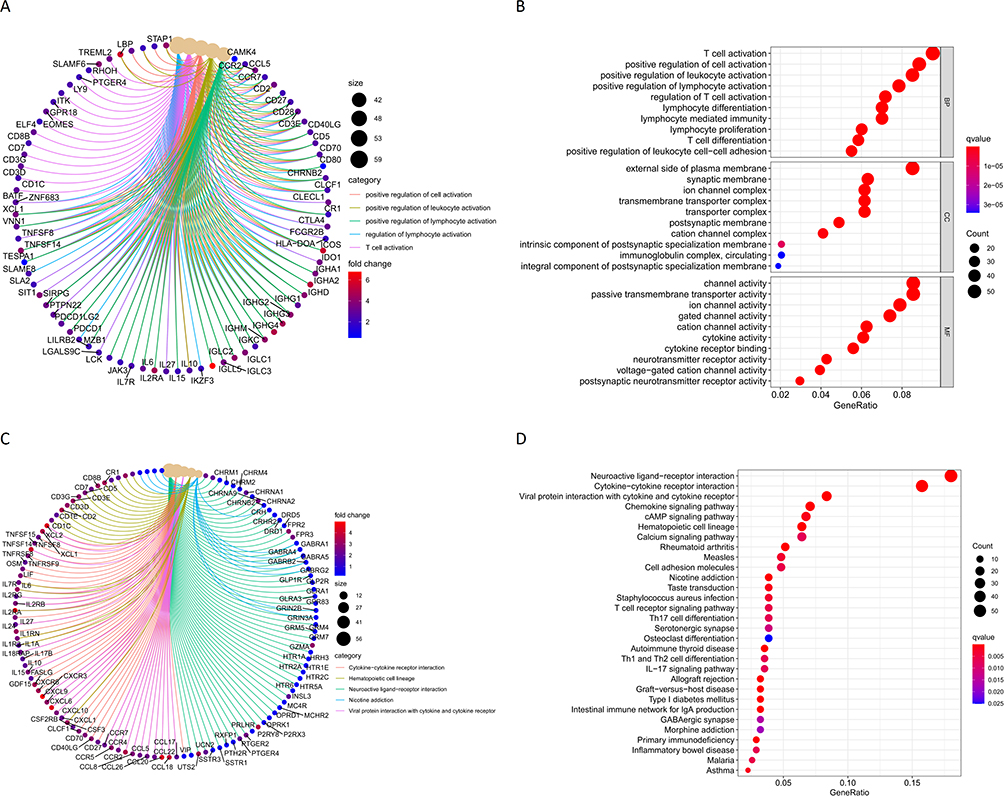 |
Figure 4 (A and B) GO enrichment function of differential genes; (C and D) KEGG enrichment pathway for differential genes. |
Screening for Core Prognostic Gene in Immune Microenvironment
Two hundred and twenty-three prognosis-related genes were identified by survival analysis, ROC curve analysis, independent prognosis analysis, and clinical correlation analysis. Further, Venn diagram yields 17 genes overlapping in immune microenvironment DEGs and prognosis-related genes (Figure 5A), including RAB42, HOXD11, HOXA1, EVC2, FCGBP, ABCC3, LCTL, RP11-189B4.6, HOXA4, HOXA-AS2, CHRNA9, RP11-181E10.3, CISH, CLCF1, CP, SPOCD1, and RP11-219G17.4. As verified by the GEPIA database, only FCGBP and SPOCD1 were significantly differentially expressed in glioma and normal tissue samples. Finally, we chose FCGBP as our study gene, and GEPIA showed that FCGBP expression was significantly higher in LGG than in normal tissues (Figure 5B). UALCAN database analysis results showed that the expression of FCGBP in high-grade glioma was higher than that in low-grade glioma (Figure 5C), and FCGBP expression in GBM was significantly higher than that in normal tissues (Figure 5D).
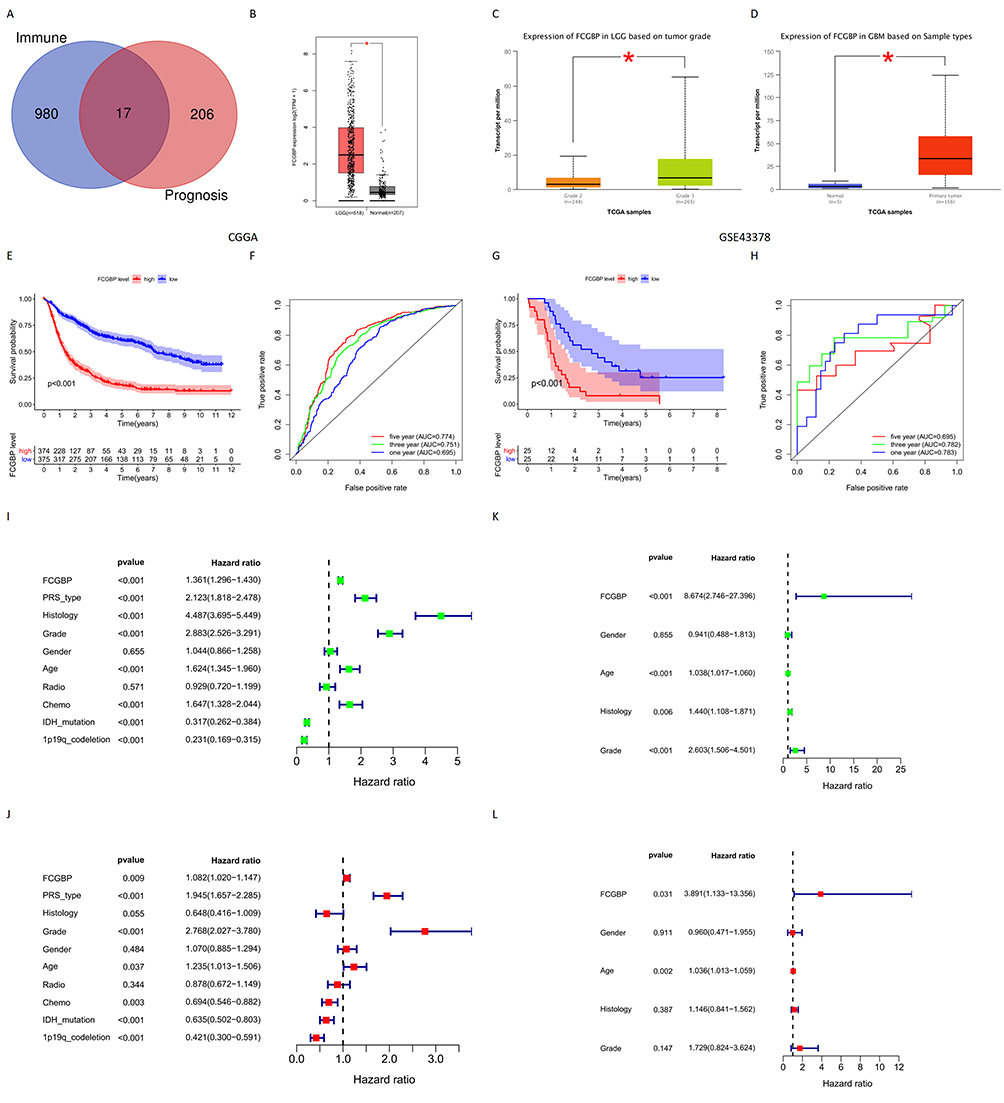 |
Figure 5 (A) Venn tool identifies the intersection of immune microenvironment differential genes and glioma prognostic genes in CGGA; (B) Expression of FCGBP in normal tissues and LGG in GEPIA; *p < 0.05; (C) Expression of FCGBP in LGG and HGG in UALCAN; *p < 0.05; (D) Expression of FCGBP in normal tissues and GBM in UALCAN. *p < 0.05; (E) Survival analysis of glioma samples grouped by median FCGBP expression in CGGA; (F) ROC curves of FCGBP in CGGA to predict 1-year, 3-year and 5-year survival in glioma patients; (G) Survival analysis of glioma samples grouped by median FCGBP expression in GSE43378; (H) ROC curves of FCGBP in GSE43378 to predict 1-year, 3-year and 5-year survival in glioma patients; (I) Univariate independent prognostic analysis of FCGBP expression and clinical data in CGGA; (J) Multivariate independent prognostic analysis of FCGBP expression and clinical data in CGGA; (K) Univariate independent prognostic analysis of FCGBP expression and clinical data in GSE43378; (L) Multivariate independent prognostic analysis of FCGBP expression and clinical data in GSE43378. |
Survival Analysis and ROC Curves
The survival analysis of CGGA and GSE43378 data sets showed that the survival period of the low expression group of FCGBP was longer than that of the high expression group. This suggests that the high expression of FCGBP is a risk factor for poor prognosis in glioma (Figure 5E and G). The ROC curves of FCGBP were drawn to predict 1-year, 3-year, and 5-year survival rates of CGGA and GSE43378 samples. AUC values of ROC curves for CGGA were 0.695, 0.751, and 0.774, respectively (Figure 5F). AUC values of ROC curves for GSE43378 were 0.783, 0.782, and 0.695, respectively (Figure 5H). The overall AUC is either close to or greater than 0.7, indicating high reliability of FCGBP in prognosis prediction for glioma.
Independent Prognostic Analysis
Univariate and multifactorial independent prognostic analyses were conducted on the CGGA datasets and GSE43378. Results showed that FCGBP expression, PRS (Primary-Recurrent-Secondary) type, glioma grade, patient age, chemotherapy status, IDH mutation status, 1p19q codeletion status were significant factors relating to prognosis of glioma patients in CGGA datasets (Figure 5I and J). FCGBP expression and age were the prognostic factors in GSE43378 (Figure 5K and L). This validated our previous conclusions that FCGBP expression correlates to prognosis in glioma patients (Table 2).
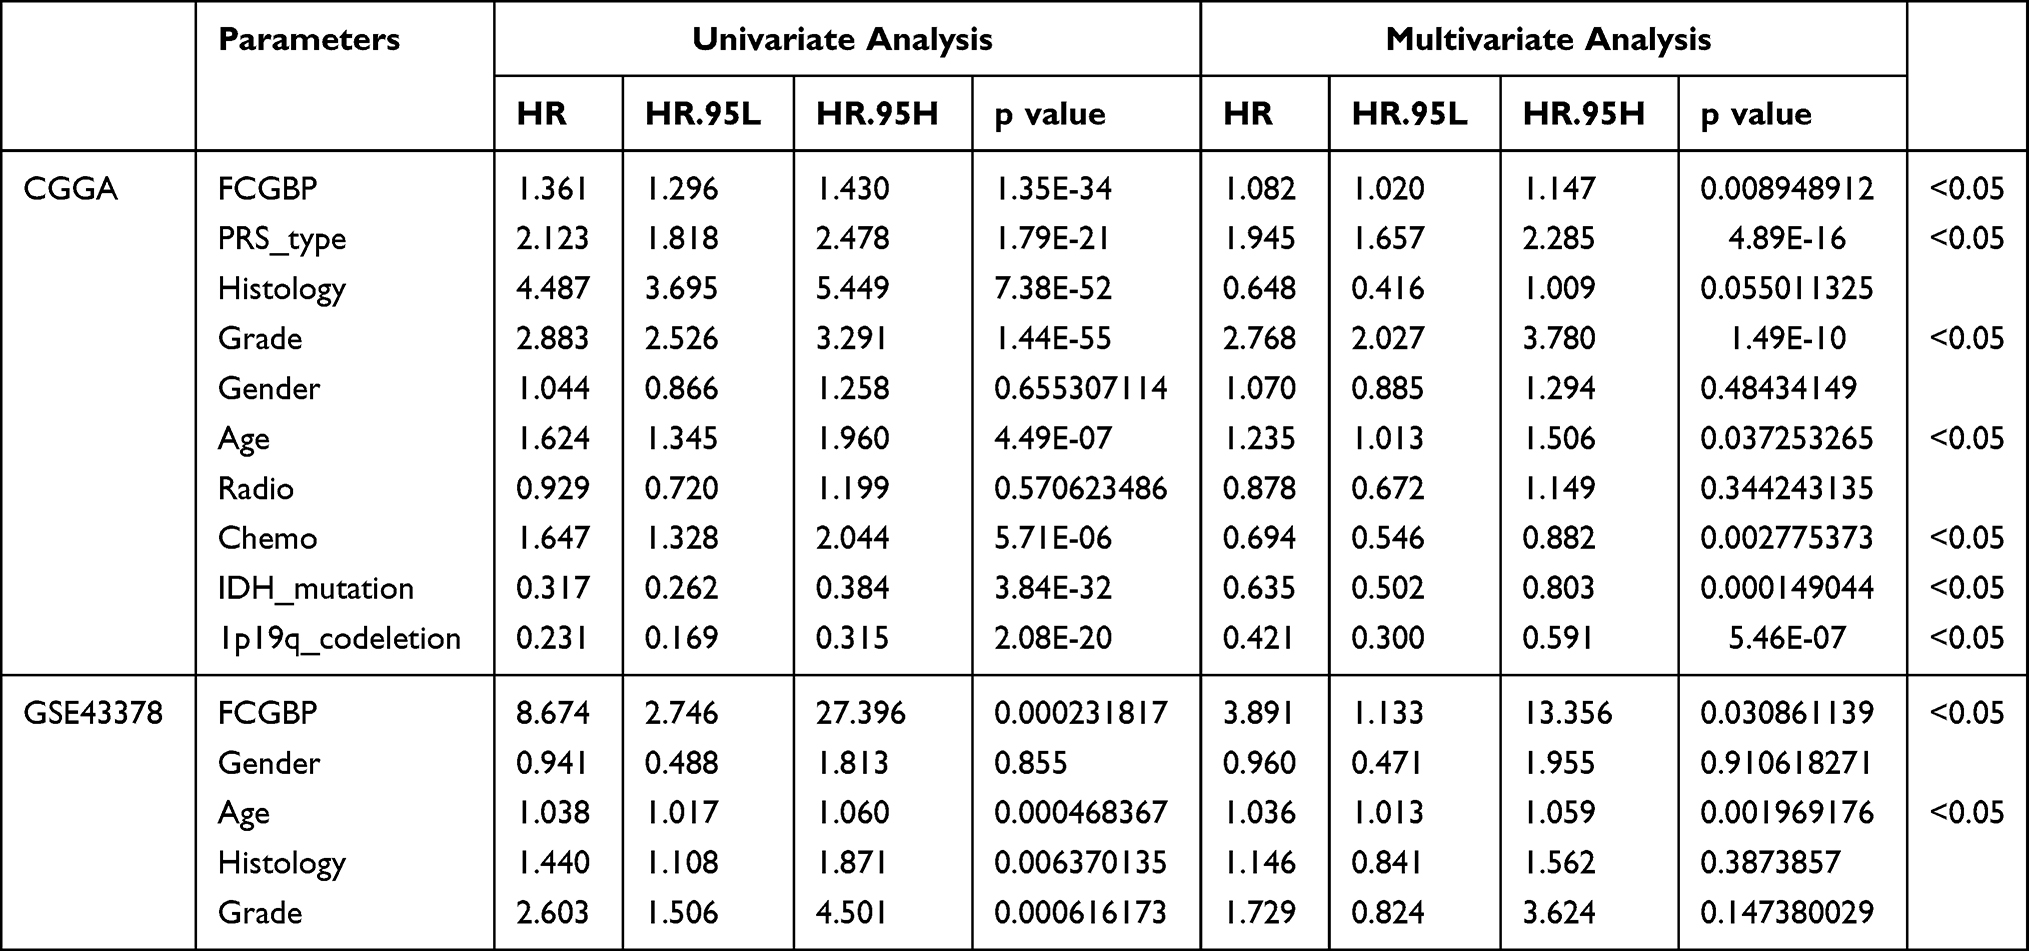 |
Table 2 Univariate and Multivariate Independent Prognostic Analysis of FCGBP Expression and Clinical Data from Glioma Samples in CGGA and GSE43378 |
Prognostic Model Construction
We constructed a nomogram with prognostic factors in the CGGA datasets including FCGBP expression, type of PRS, Grade, Age, Chemo, IDH mutation, and 1p19q codeletion. 1-year, 3-year, and 5-year survival rates were predicted by Nomogram scores (Figure 6). Risk score is calculated in the prognosis model, and the glioma samples were divided into high-risk group (374 items) and low-risk group (375 items) based on the median risk score (Figure 7A). The relationship between risk score and survival time of patients showed that the higher the risk score, the shorter the survival time of patients (Figure 7B).
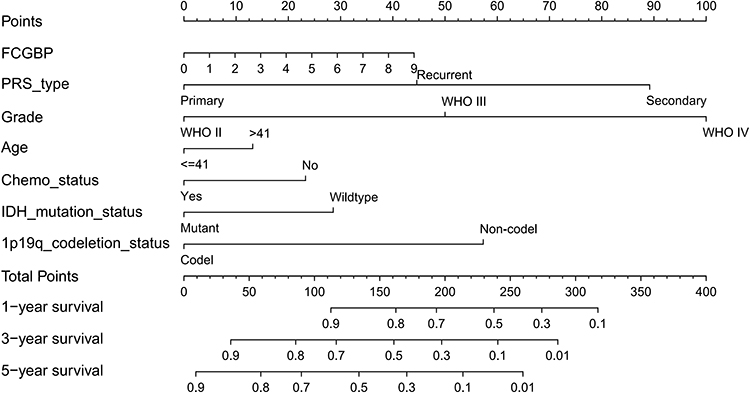 |
Figure 6 Nomogram constructed by prognostic correlates of glioma in CGGA to predict patient survival at 1, 3, and 5 years. |
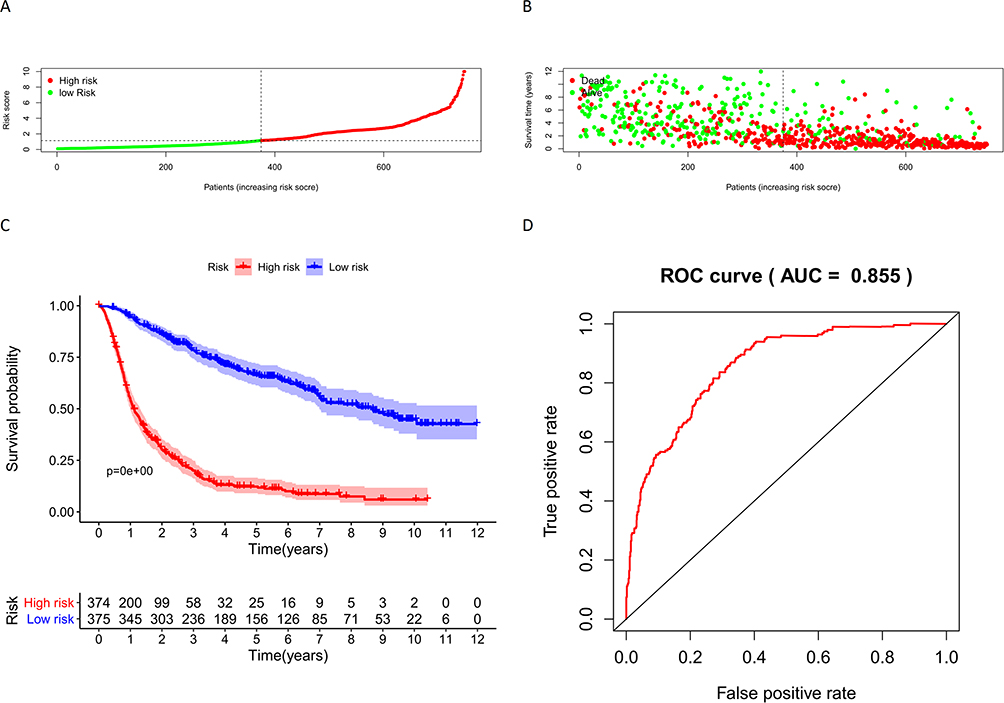 |
Figure 7 (A) Risk scores for glioma samples in CGGA; (B) Relationship between risk score and survival time of glioma samples in CGGA; (C) Survival analysis of samples in the high-risk and low-risk groups in CGGA; (D) ROC curves for Nomogram to predict survival in glioma patients. |
Validation on Prognostic Model
The results of the survival analysis between the high-risk and low-risk groups showed a significant difference between the survival of glioma patients in the high-risk and low-risk groups, and the survival of glioma patients in the low-risk group was significantly longer than that in the high-risk group, indicating that the risk score was significantly associated with the survival of glioma patients (Figure 7C). In addition, the AUC value of ROC curve in Nomogram model was 0.855 (Figure 7D), indicating great sensitivity and specificity of the prognostic model.
Clinical Correlation Analysis
Correlation analysis on CGGA datasets and GSE43378 showed that FCGBP expression CGGA significantly correlated with age, chemotherapy status, IDH mutation status, 1p19q codeletion status, PRS type, histology, and grade of glioma. And FCGBP expression was significantly higher in >41 years, Chemo (Yes), Wild-type, and 1p19q Non-codel samples than in <41 years, Chemo (No), IDH mutation, and 1p19q codeletion (Figure 8A–D). The expression of FCGBP in glioma samples of different PRS types, histology, and grade was significantly different, and the expression of FCGBP increased as glioma recurrence and upgrade and reached highest in GBM among all histological types (Figure 8E–G). FCGBP expression in GSE43378 uncorrelated to age and gender of patients (Figure 8H and I), while correlated to grade and histology. FCGBP expression increased with the grade of gliomas and was highest in GBM among all Histologies (Figure 8J and K).
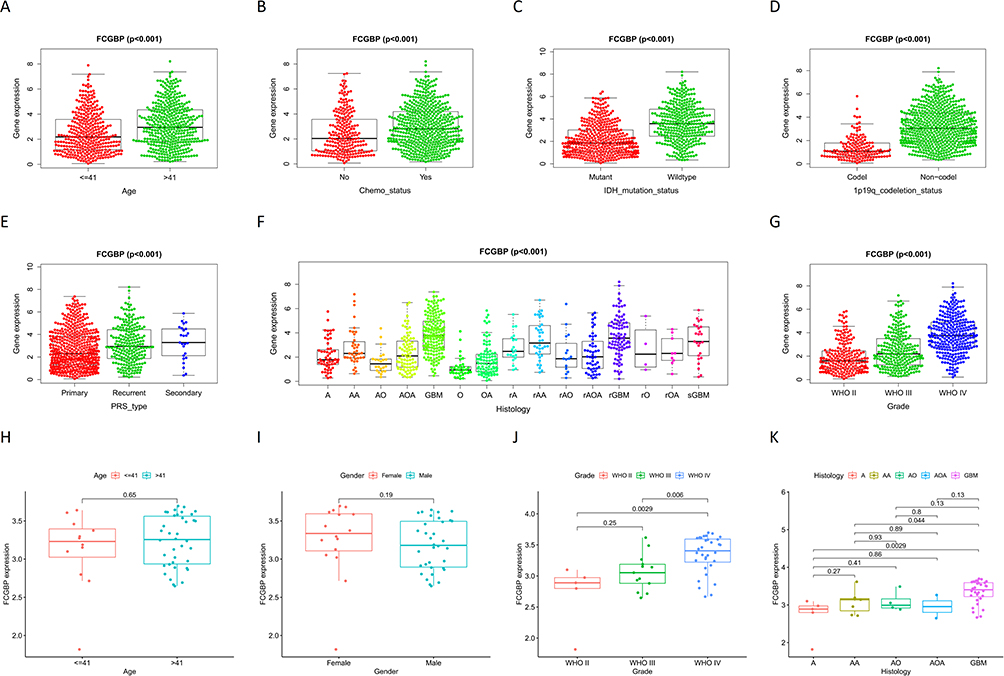 |
Figure 8 Correlation analysis of FCGBP expression and clinical characteristics in CGGA: (A) Age; (B) Chemo status; (C) IDH mutation status; (D) 1p19q codeletion status; (E) PRS type: (F) Histology; (G) Grade. Correlation analysis of FCGBP expression and clinical characteristics in GSE43378: (H) Age; (I) Gender; (J) Grade; (K) Histology. |
GSEA Enrichment Analysis and Co-Expression Correlation Analysis
GSEA enrichment analysis on CGGA datasets showed that the top 10 GO annotation functions enriched in FCGBP upregulated group were as follows: defense response to virus, modulation by symbiont of entry into host, negative regulation of immune effector process, positive regulation of hemopoiesis, positive regulation of interleukin 6 production, positive regulation of lymphocyte differentiation, regulation of leukocyte differentiation, regulation of toll-like receptor signaling pathway, T cell proliferation, and toll-like receptor signaling pathway (Figure 9A). And the top 10 KEGG pathways were as follows: complement and coagulation cascades, Cytokine–cytokine receptor interaction, ECM receptor interaction, focal adhesion, intestinal immune network for IgA production, JAK-STAT signaling pathway, leishmania infection, natural killer cell mediated cytotoxicity, systemic lupus erythematosus, viral myocarditis (Figure 9B). Co-expression correlation analysis on FCGBP and sample genes in CGGA yielded a total of 792 correlated genes. The correlation heat map showed top 20 positive/negative-correlated genes (Figure 9C), and the correlation circle map showed top 5 genes (Figure 9D).
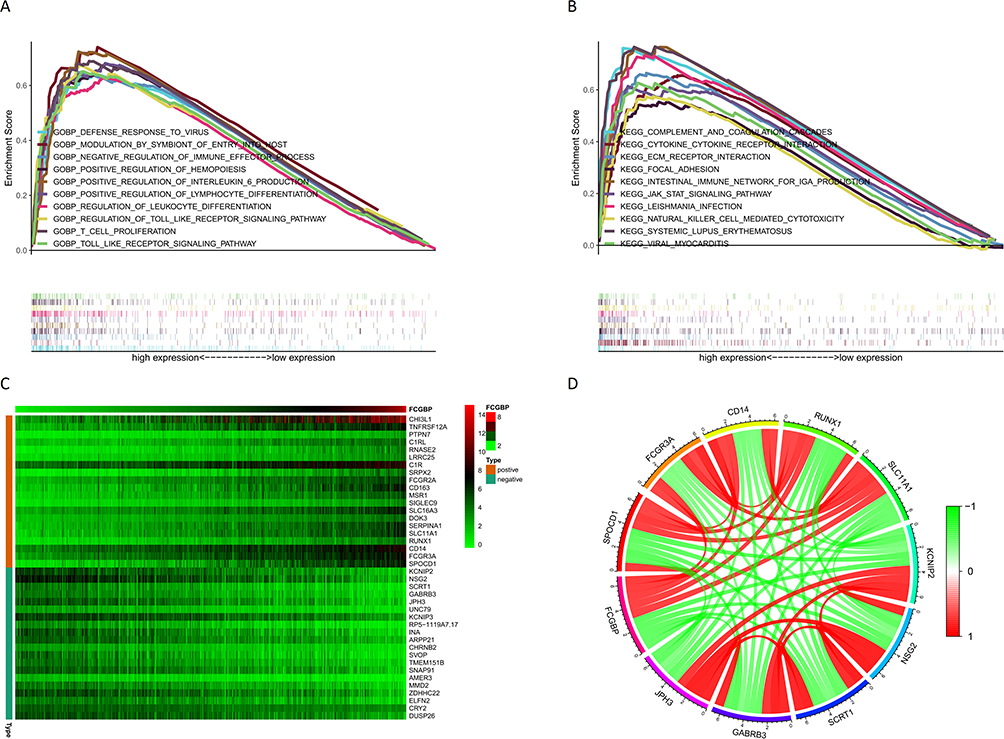 |
Figure 9 (A) Top 10 GO annotation function enriched by CGGA sample genes in FCGBP upregulation group; (B) Top 10 KEGG pathway enriched by CGGA sample genes in FCGBP upregulation group; (C) Heat map of the top 20 most significantly positively and negatively correlated genes with FCGBP; (D) Correlation circles of the top 5 genes with the most significant positive and negative correlations with FCGBP. |
Target Enrichment and Immune Cell Infiltration
The top 5 KEGG pathways enriched by FCGBP in LGG using LinkedOmics database for FCGBP were Staphylococcus aureus infection, Systemic lupus erythematosus, Graft-versus-host disease, Cytokine–cytokine receptor interaction, and Human T-cell leukemia virus 1 infection. Corresponding miRNA targets were MIR-506, MIR-9, MIR-124A, MIR-431, and MIR-451. Corresponding transcription factor targets were IRF, ETS2, PEA3, ICSBP, and ELF1. The top 5 KEGG Pathways enriched by FCGBP in GBM were Cytokine–cytokine receptor interaction, Osteoclast differentiation, Staphylococcus aureus infection, Phagosome, and Leishmaniasis. Corresponding miRNA Targets were MIR-506, MIR-9, MIR-125B, MIR-125A, MIR-182, MIR-19A, and MIR-19B. Corresponding transcription factor targets were AP1 C, ETS2, PEA3, ELF1, and AP1 Q6 (Table 3). TIMER analysis showed that there was a significant positive correlation between the expression of FCGBP and the infiltration of B Cell (cor = 0.532, p = 3.14e-36), CD4 + T cells (cor = 0.675, p = 1.20e-64), Macrophages (cor = 0.602, p = 4.64e-48), Neutrophils (cor = 0.661, p = 7.46e-61), and Dendritic cells (cor = 0.729, p = 6.29e-80) in LGG (Figure 10A). In GBM, the expression of FCGBP positively was correlated to the infiltration of CD4 + T cells (cor = 0.376, p = 1.76e-15) and Dendritic cells (cor = 0.324, p = 1.09e-11) (Figure 10B). In LGG, there was also a significant positive correlation between FCGBP expression and classical immune checkpoints such as PDCD1, CD274, PDCD1LG2, CTLA4, LAG3, and HAVCR2 (P < 0.05, Figure 10C). In GBM, FCGBP expression positively correlated to CD274 (cor = 0.425, p = 5.85e-08), PDCD1LG2 (cor = 0.373, p = 2.37e-06) and HAVCR2 (cor = 0.36, p = 5.67e-06) and negatively correlated to LAG3 (cor = −0.159, p = 4.94e-02) (Figure 10D). Kaplan–Meier plots showed that the survival of LGG patients is related to the infiltration of all six immune cells and FCGBP expression (p<0.05, Figure 10E), whereas the survival of GBM patients is only related to the infiltration of dendritic cells (p<0.05, Figure 10F).
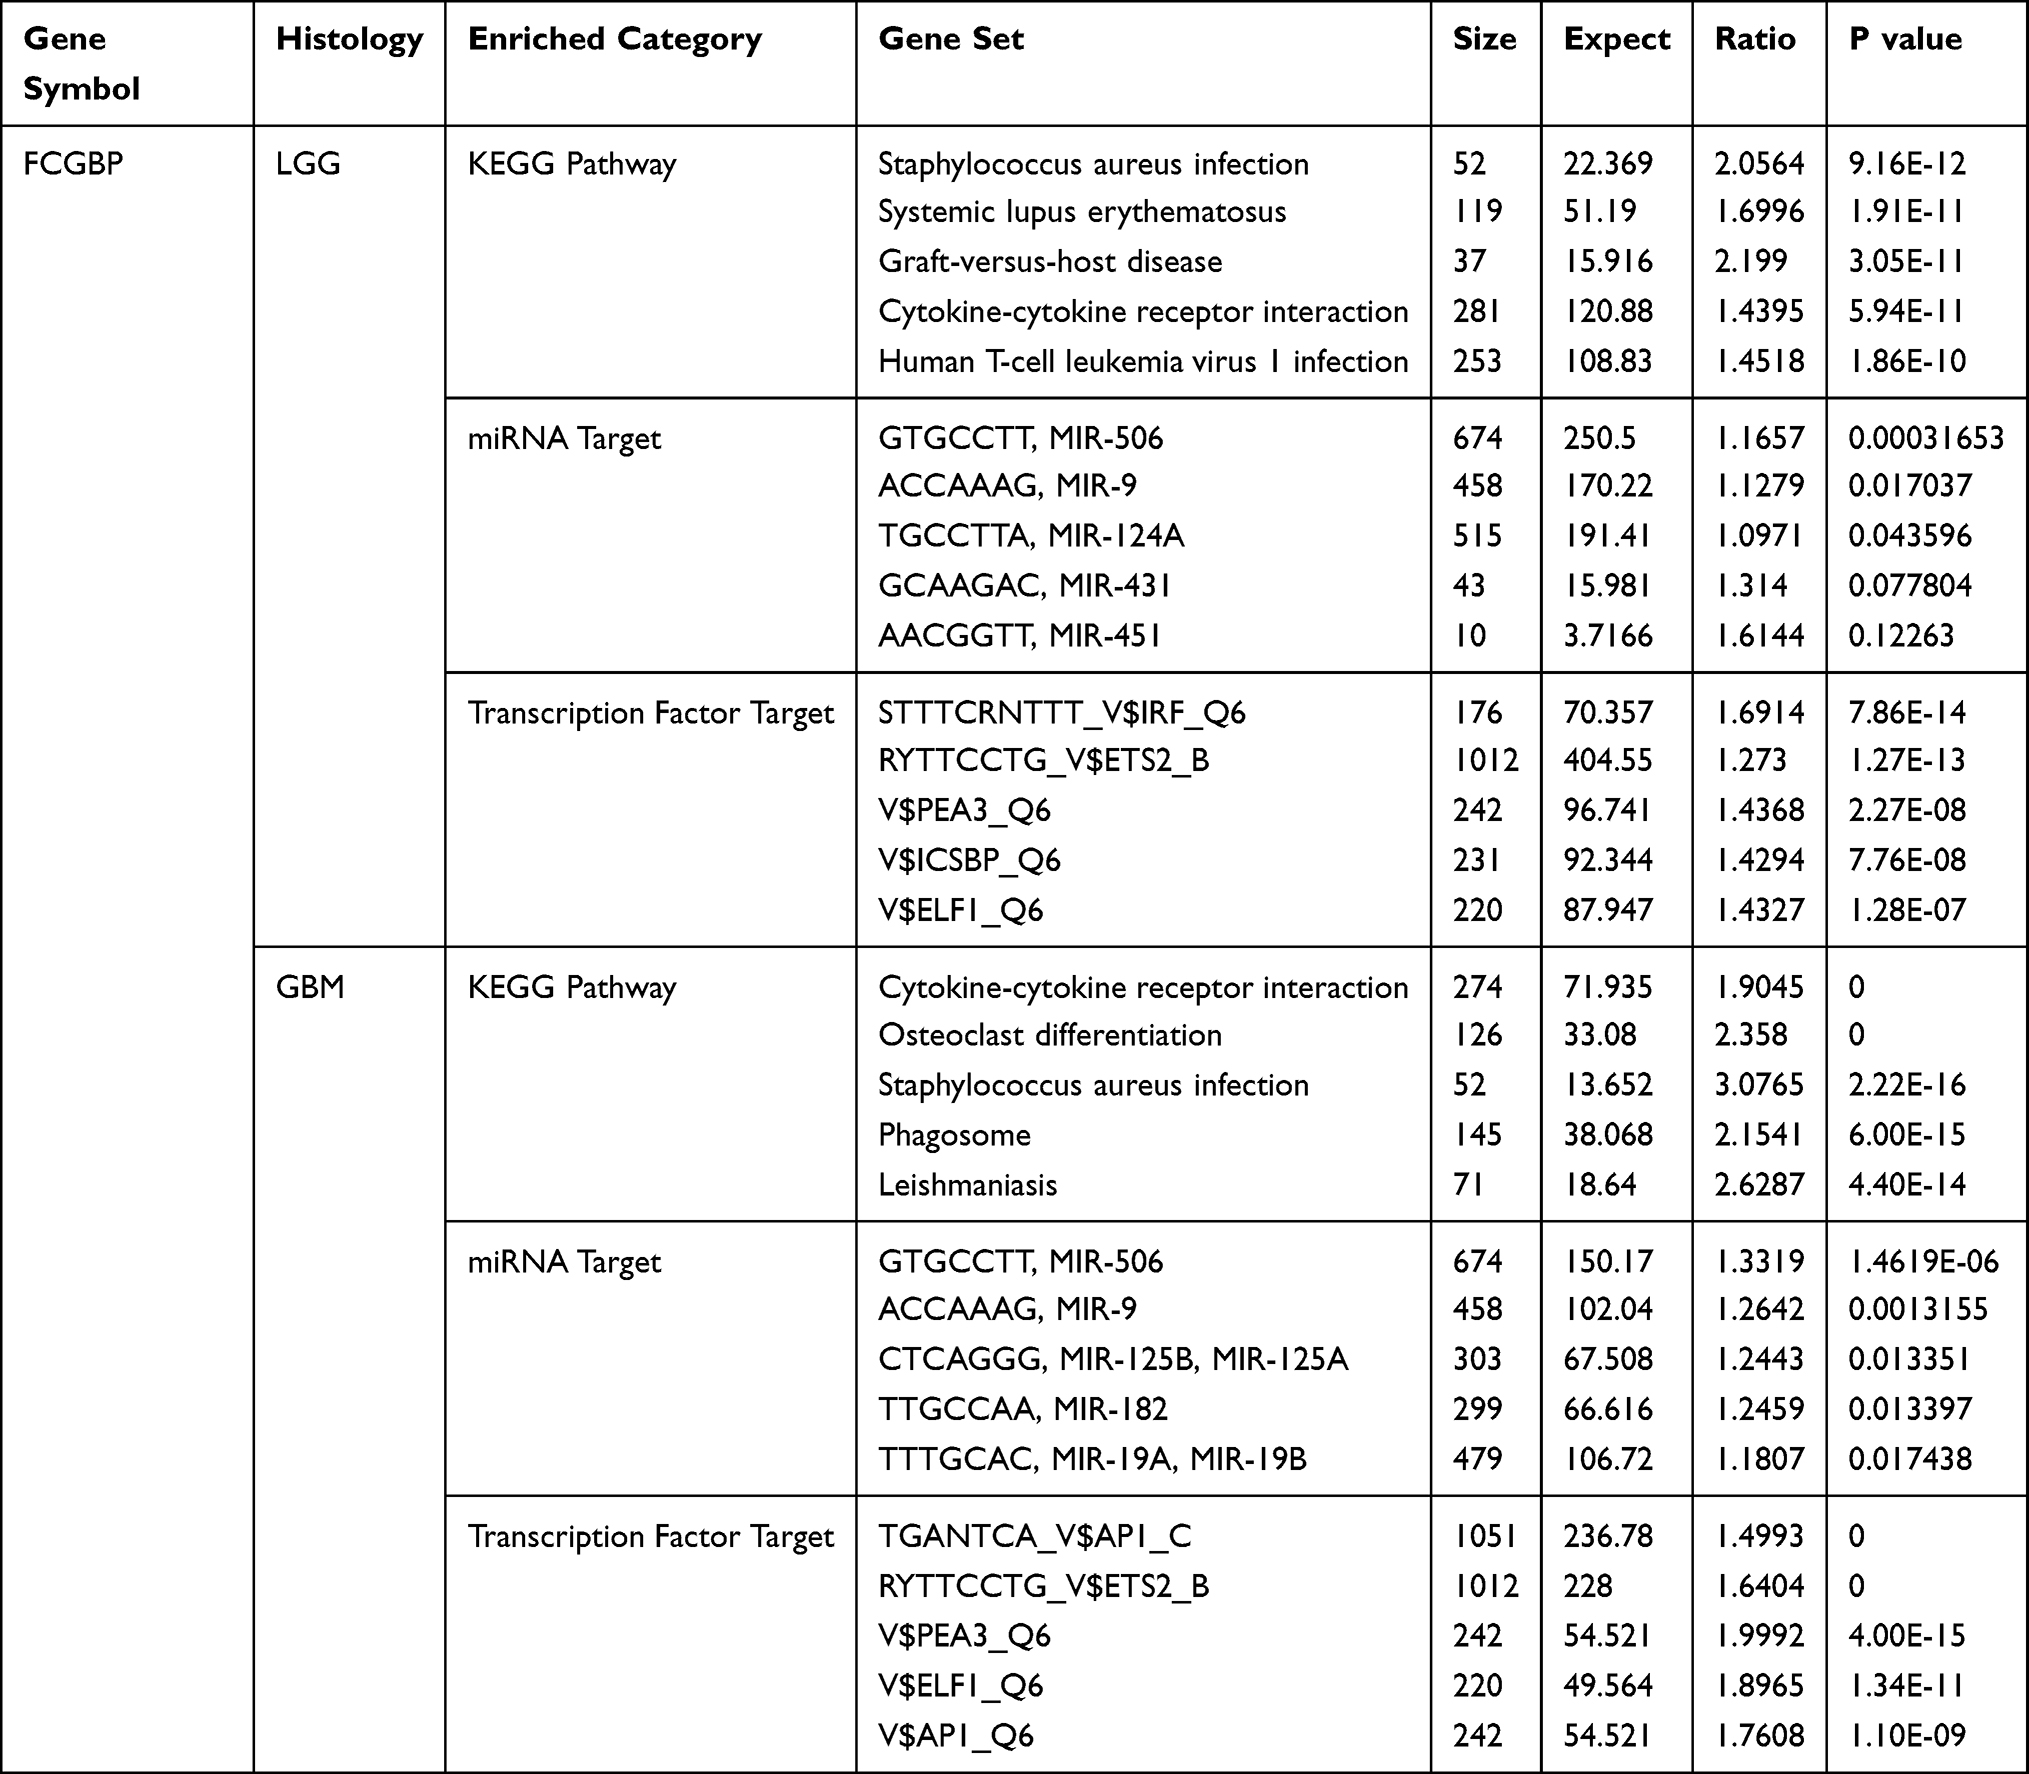 |
Table 3 The Top Five KEGG Pathways, Corresponding miRNA Targets, and Transcription Factor Targets of FCGBP Enrichment in LGG and GBM |
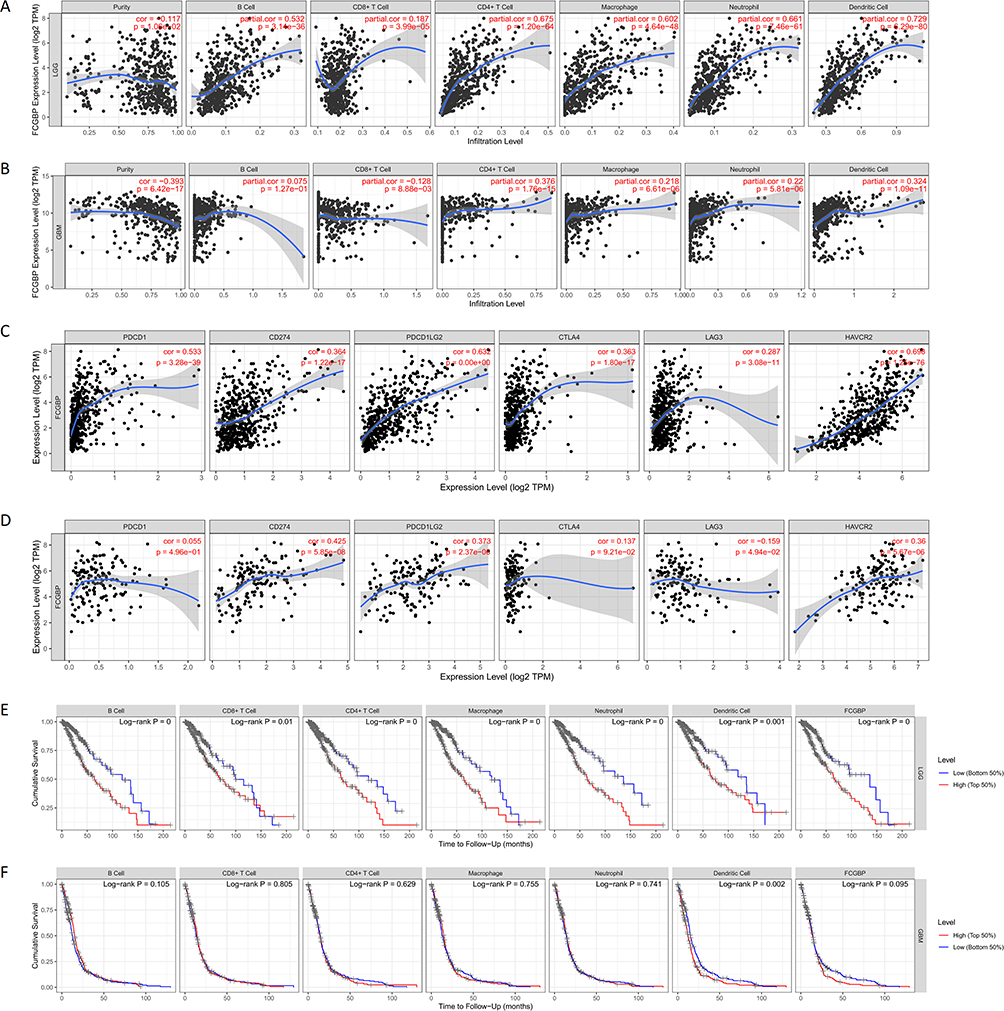 |
Figure 10 (A) Relationship between FCGBP expression and six types of immune cell infiltration in LGG; (B) Relationship between FCGBP expression and six types of immune cell infiltration in; (C) Correlation of FCGBP with six classical immune checkpoint expressions in LGG; (D) Correlation of FCGBP with six classical immune checkpoint expressions in GBM; (E) KM survival curve of six immune cell infiltration and FCGBP expression in LGG; (F) KM survival curve of six immune cell infiltration and FCGBP expression in GBM. |
Immunohistochemistry and Image Analysis
Immunohistochemistry method was used to detect the expression of FCGBP in normal brain, low-grade glioma, and high-grade glioma. The results showed that FCGBP was mainly expressed in the cytoplasm of the cells. FCGBP was negatively expressed in five normal brain tissues and positively expressed in seven low-grade gliomas and nine high-grade gliomas (Figure 11). The expression of FCGBP in tissues was quantified by the Cytoplasm H-Score of Cytoplasmic V2 software, and higher Cytoplasm H-Score indicated higher expression of FCGBP in tissues. The results showed that the Cytoplasm H-Score was significantly higher in most high-grade gliomas than in low-grade, and the Cytoplasm H-Score was higher in IDH wild-type gliomas than in IDH mutant (Table 4). The results confirmed our previous analysis, where FCGBP was up-regulated in low- and high-grade gliomas and the expression level increased with grade, and FCGBP expression was higher in IDH wild-type gliomas than in IDH mutant.
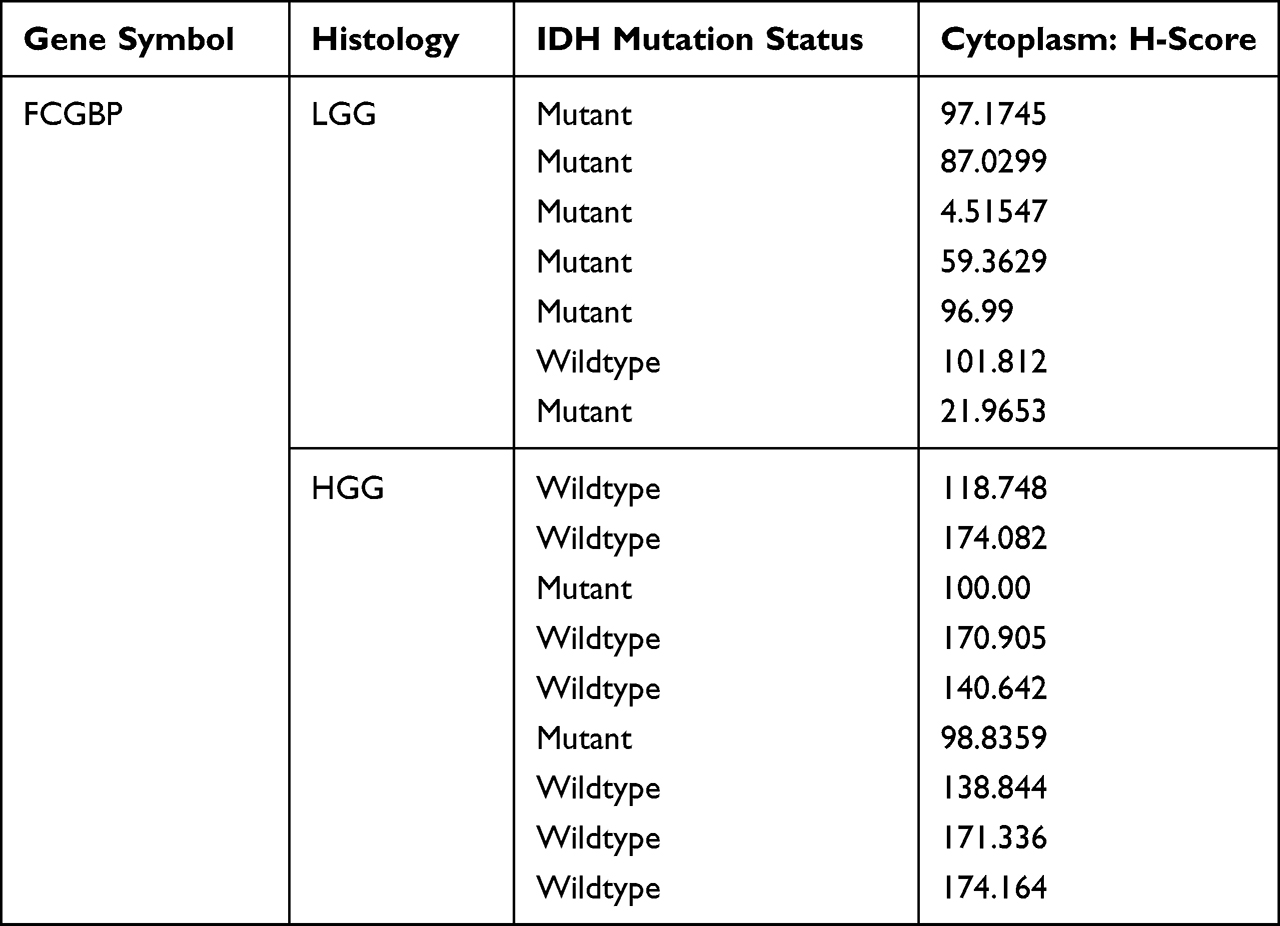 |
Table 4 Quantitative Analysis of FCGBP Expression in Tissues by Cytoplasmic V2 Software |
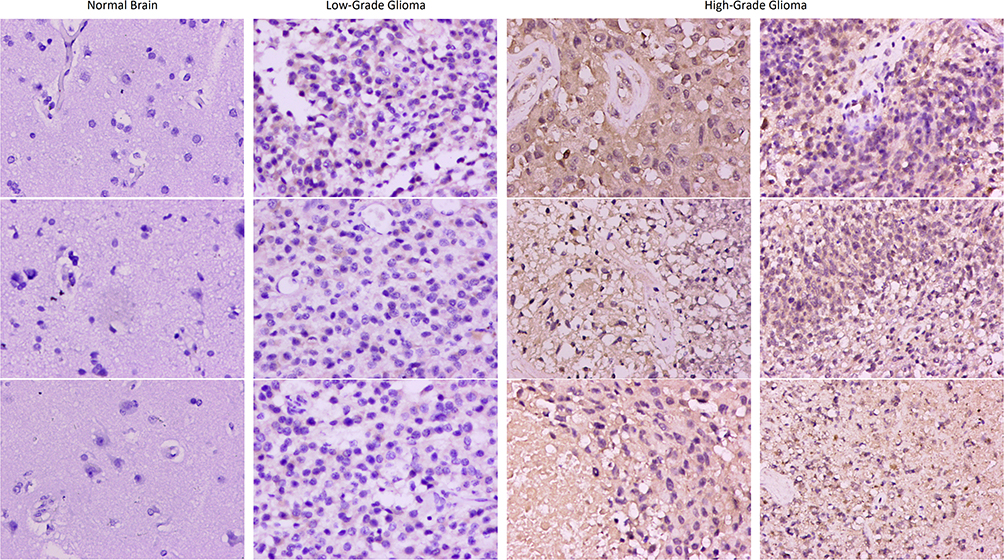 |
Figure 11 Immumohistochemical staining for FCGBP expression in normal brain, low-grade glioma and high-grade glioma tissues. Magnification, ×200. |
Discussion
FCGBP, short for IgGFc-binding protein, is located on chromosome 19q13, encoding a protein with a mucin-like structure, binding to the Fc region of IgG.33,34 FCGBP protein is widely distributed in the colon, gastric juice, bile, nasal fluid, saliva, etc. Being expressed on the mucosal surface, it might be an important component of mucosal immune defense.35 FCGBP is involved in the pathological regulation of ulcerative colitis. It is significantly up-regulated in colitis tissues and can form a disulfide-linked heterodimer with TFF3.36,37 Besides, it has also been reported that FCGBP is involved in the pathogenesis of rheumatoid arthritis and systemic lupus erythematosus.38
We comprehensively analyzed the role of FCGBP in glioma. Survival analysis showed that its high expression marked a poor prognosis of patients. We also observed a significant correlation between FCGBP overexpression and WHO grade, histology, IDH Wild-type, 1p19q Non-codel. This suggested that FCGBP overexpression is detrimental to the long-term survival of patients and may promote malignant process of gliomas. After clinical data were included in the analysis, FCGBP was also identified as an independent prognostic factor. KEGG functional enrichment analysis showed that the function of FCGBP was mainly enriched in complement and coagulation cascades, Cytokine–cytokine receptor interaction, ECM receptor interaction, focal adhesion, intestinal immune network for IgA production, JAK-STAT signaling pathway, etc. GO analysis showed that the function of FCGBP was mainly enriched in defense response to virus, modulation by symbiont of entry into host, and negative regulation of immune effector process. In addition, overexpression of FCGBP was correlated to immune infiltration of various immune cells including B cells, CD4+ T cells, CD8+ T cells, macrophages, and neutrophils. Thus, FCGBP can be a potential biomarker and target for inflammatory regulation and immune infiltration in gliomas.
FCGBP is differentially expressed in different tumor types. In colon cancer, FCGBP was significantly down-expressed and metastasis-associated.39 Thus, researchers have chosen FCGBP as a candidate therapeutic target for metastatic colorectal cancer.40 A comprehensive bioinformatics analysis showed that FCGBP expression was closely associated with infiltration of B cells and dendritic cells in colorectal cancer.41 In patients with metastatic colorectal cancer, the expression of FCGBP expression decreased as disease progresses. In hepatic metastatic colorectal cancer, it is also significantly correlated to overall survival and progression-free survival.42 TFF1 is a peptide expressed on gastric mucosa, as an important regulator of gastric cancer. The incidence of gastric cancer is reported to increase in mice after knockout of TFF1.43,44 In the gastric cancer mouse model, FCGBP was observed upregulated and forming a disulfide-linked heterodimer with TFF1.45 In a study on the genetic identification of human gastric cancer tissues, FCGBP was also found to be expressed differently in gastric cancer than in normal tissues.46 Compared to chronic cholecystitis, researchers confirmed the down-expression of FCGBP by immunohistochemistry and RT-PCR in gallbladder adenocarcinoma in vivo. In cancer cells with TGF-β1-induced epithelial–mesenchymal transition (EMT), FCGBP was also observed to be significantly overexpressed.47
FCGBP may also act in germline tumors. Downregulation of FCGBP was reported in mice model of prostate cancer.48 Bioinformatic analysis showed that FCGBP can predict the overall survival of patients with ovarian cancer. In tissues with high FCGBP expression, researchers observed increased M2 macrophage infiltration and decreased M1 macrophage infiltration. Thus, FCGBP may act as an oncogene and promote M2 macrophage polarization in ovarian cancer.49
Our immune infiltration analysis showed that FCGBP is closely associated with dendritic cell (DC) infiltration in gliomas. DC-based vaccination has been an important option against glioma, especially glioblastomas.50–52 Early DC-based vaccines include recombinant human interleukin 12, NY-ESO-1 glioma-associated antigens, Tetanus toxoid, and CCL3. However, their application in clinical practice is highly limited.53–55 In the glioma microenvironment, DCs can affect CD8+ T cell function, thus achieving control of CD8+ T cell immune status.56,57 Recently, investigators designed a polio-based rhinovirus chimera that is devoid of viral neuropathogenicity after intracerebral inoculation in human subjects. It can recruit and activate DCs with Th1-dominant cytokine profiles at the injection site in vivo, thereby suppressing tumor progression.58 Interestingly, in the rat model, the naturally occurring metabolite sarcosine also increases DC migration in human and murine cells, thereby significantly enhancing antitumor efficacy.59
In our study, we found a strong association between FCGBP and CD4(+) cells in gliomas. CD4+ Regulatory T-cells (Treg) account for approximately 2–3% of human CD4+ T-cells.60 Treg cells are considered as one of the main causes of the immunosuppressive microenvironment in gliomas. Their antitumor immune effects contribute to the escape and survival of cancer cells. Within the spectrum of gliomas, Treg is most common in astrocytic subtypes.61–63 We also found an association between the expression of FCGBP with CTLA4. Cytotoxic-T-lymphocyte-antigen-4 (CTLA-4) is a negative immunomodulator expressed in regulatory T (Treg) cells. It is significantly upregulated in activated T cells.64 Anti-CTLA-4 drugs has been used as checkpoint inhibitors and shown to have significant therapeutic effects in rat models.57,65,66 Finally, in the treatment of Treg, there are currently several clinical trial studies for indoleamine 2, 3-dioxygenase 1 (IDO1), and the final results of these studies will determine the clinical application of immunotherapy under the IDO1 intervention strategy.67
Our immune infiltration analysis revealed a strong association between FCGBP and macrophages. Macrophages may contribute to glioma generation and progression due to their capability to shape the tumor microenvironment.68 Tumor-associated macrophages (TAM) are an important component of the immune environment that provides a supportive role for tumors.69–71 In glioma, TAM can be recruited into microenvironment and release growth factors and cytokines promoting angiogenesis.72,73 In tumor microenvironment, increased infiltration of M2 macrophages leads to tumor progression and malignant propensity.74,75 In conclusion, our study revealed the association of FCGBP with several key immune-related factors and confirmed its potential for immune targeted therapy.
Conclusion
Roles of FCGBP in tumor have been recently confirmed in several studies. However, the immunological effects of FCGBP in gliomas have not been discussed yet. Through bioinformatic analysis, we screened immune-related genes with clinical significance and prognostic value. Our data analysis indicates that age and FCGBP expression are important factors affecting the survival of glioma patients, and FCGBP may be a strong prognostic biomarker for glioma. Furthermore, results showed FCGBP expression was upregulated in glioma tissues and increased with tumor grade. The expression of FCGBP was significantly increased in samples with poor prognostic factors (IDH Wild-type, 1p19q Non-codel). These results suggest a detrimental effect of FCGBP overexpression in gliomas. In conclusion, we successfully identified FCGBP gene through immune scoring as well as prognostic analysis. Further study showed its contribution in glioma immunity and potential to be a novel immunotherapeutic target for glioma.
Abbreviations
LGG, Low-grade glioma; GBM, glioblastoma; TME, tumor microenvironment; DEGs, differential genes; PPI, Protein–Protein Interaction; GO, Gene Ontology; KEGG, Kyoto Encyclopedia of Genes and Genomes.
Data Sharing Statement
All data are available from CGGA, GEO, GEPIA, UALCAN, GSEA, LinkedOmics, and TIMER databases.
Ethics Approval and Consent to Participate
This human tissue study was reviewed and approved by the Ethics Committee of the First Hospital of Shanxi Medical University (K042-2020-04-03), and patients provided written informed consent to participate in this study.
Acknowledgments
Thanks to CGGA, GEO, GEPIA, UALCAN, GSEA, LinkedOmics, and TIMER databases for open data.
Author Contributions
All authors made a significant contribution to the work reported, whether that is in the conception, study design, execution, acquisition of data, analysis and interpretation, or in all these areas; took part in drafting, revising, or critically reviewing the article; gave final approval of the version to be published; have agreed on the journal to which the article has been submitted; and agree to be accountable for all aspects of the work.
Funding
This work was supported by the National Natural Science Foundation of China Youth Fund (30600637); Natural Science Research General project of Shanxi Province (20210302124399); Scientific and technological Activities for Overseas Students of Shanxi Province (20210020); Graduate Education Innovation Project of Shanxi Province.
Disclosure
There is no conflict of interest to declare in this manuscript.
References
1. Wesseling P, Capper D. WHO 2016 classification of gliomas. Neuropathol Appl Neurobiol. 2018;44(2):139–150. doi:10.1111/nan.12432
2. Weller M, Wick W, Aldape K, et al. Glioma. Nat Rev Dis Primers. 2015;1(1):15017. doi:10.1038/nrdp.2015.17
3. Liu S, Zhao Q, Shi W, et al. Advances in radiotherapy and comprehensive treatment of high-grade glioma: immunotherapy and tumor-treating fields. J Cancer. 2021;12(4):1094–1104. doi:10.7150/jca.51107
4. Delgado-López PD, Corrales-García EM, Martino J, Lastra-Aras E, Dueñas-Polo MT. Diffuse low-grade glioma: a review on the new molecular classification, natural history and current management strategies. Clin Transl Oncol. 2017;19(8):931–944. doi:10.1007/s12094-017-1631-4
5. Mair MJ, Geurts M, van den Bent MJ, Berghoff AS. A basic review on systemic treatment options in WHO grade II-III gliomas. Cancer Treat Rev. 2021;92:102124. doi:10.1016/j.ctrv.2020.102124
6. Jiang T, Nam DH, Ram Z, et al. Clinical practice guidelines for the management of adult diffuse gliomas. Cancer Lett. 2021;499:60–72. doi:10.1016/j.canlet.2020.10.050
7. Jakola AS, Skjulsvik AJ, Myrmel KS, et al. Surgical resection versus watchful waiting in low-grade gliomas. Ann Oncol. 2017;28:1942–1948. doi:10.1093/annonc/mdx230
8. Gerritsen JKW, Vincent A, De Vleeschouwer S. Maximizing extent of resection while minimizing the risk of neurological morbidity in glioma patients: a novel grading scale to translate these surgical goals into a merged onco-functional clinical outcome. Neuro Oncol. 2021;23:504–505. doi:10.1093/neuonc/noaa288
9. Hegde PS, Chen DS. Top 10 challenges in cancer immunotherapy. Immunity. 2020;52:17–35. doi:10.1016/j.immuni.2019.12.011
10. Xu S, Tang L, Li X, Fan F, Liu Z. Immunotherapy for glioma: current management and future application. Cancer Lett. 2020;476:1–12. doi:10.1016/j.canlet.2020.02.002
11. Lim M, Xia Y, Bettegowda C, Weller M. Current state of immunotherapy for glioblastoma. Nat Rev Clin Oncol. 2018;15:422–442. doi:10.1038/s41571-018-0003-5
12. Barbee MS, Ogunniyi A, Horvat TZ, Dang TO. Current status and future directions of the immune checkpoint inhibitors ipilimumab, pembrolizumab, and nivolumab in oncology. Ann Pharmacother. 2015;49:907–937. doi:10.1177/1060028015586218
13. Almutairi AR, McBride A, Slack M, Erstad BL, Abraham I. Potential immune-related adverse events associated with monotherapy and combination therapy of ipilimumab, nivolumab, and pembrolizumab for advanced melanoma: a systematic review and meta-analysis. Front Oncol. 2020;10:91. doi:10.3389/fonc.2020.00091
14. Wang X, Guo G, Guan H, Yu Y, Lu J, Yu J. Challenges and potential of PD-1/PD-L1 checkpoint blockade immunotherapy for glioblastoma. J Exp Clin Cancer Res. 2019;38:87. doi:10.1186/s13046-019-1085-3
15. Khasraw M, Reardon DA, Weller M, Sampson JH. PD-1 inhibitors: do they have a future in the treatment of glioblastoma? Clin Cancer Res. 2020;26:5287–5296. doi:10.1158/1078-0432.ccr-20-1135
16. Cloughesy TF, Mochizuki AY, Orpilla JR, et al. Neoadjuvant anti-PD-1 immunotherapy promotes a survival benefit with intratumoral and systemic immune responses in recurrent glioblastoma. Nat Med. 2019;25:477–486. doi:10.1038/s41591-018-0337-7
17. Schalper KA, Rodriguez-Ruiz ME, Diez-Valle R, et al. Neoadjuvant nivolumab modifies the tumor immune microenvironment in resectable glioblastoma. Nat Med. 2019;25:470–476. doi:10.1038/s41591-018-0339-5
18. Deng S, Li Y, Yi G, et al. Overexpression of COX7A2 is associated with a good prognosis in patients with glioma. J Neurooncol. 2018;136:41–50. doi:10.1007/s11060-017-2637-z
19. Jiang Y, Zhou J, Zhao J, et al. The U2AF2 /circRNA ARF1/miR-342-3p/ISL2 feedback loop regulates angiogenesis in glioma stem cells. J Exp Clin Cancer Res. 2020;39:182. doi:10.1186/s13046-020-01691-y
20. Wang W, Lu Z, Wang M, et al. The cuproptosis-related signature associated with the tumor environment and prognosis of patients with glioma. Front Immunol. 2022;13:998236. doi:10.3389/fimmu.2022.998236
21. Oba-Shinjo SM, Bengtson MH, Winnischofer SM, et al. Identification of novel differentially expressed genes in human astrocytomas by cDNA representational difference analysis. Brain Res Mol Brain Res. 2005;140:25–33. doi:10.1016/j.molbrainres.2005.06.015
22. Yan T, Tian D, Chen J, et al. FCGBP is a prognostic biomarker and associated with immune infiltration in glioma. Front Oncol. 2022;11:769033. doi:10.3389/fonc.2021.769033
23. Ye L, Wang L, Yang J, et al. Identification of tumor antigens and immune subtypes in lower grade gliomas for mRNA vaccine development. J Transl Med. 2021;19:352. doi:10.1186/s12967-021-03014-x
24. Wang Y, Qian T, You G, et al. Localizing seizure-susceptible brain regions associated with low-grade gliomas using voxel-based lesion-symptom mapping. Neuro Oncol. 2015;17:282–288. doi:10.1093/neuonc/nou130
25. Liu X, Li Y, Qian Z, et al. A radiomic signature as a non-invasive predictor of progression-free survival in patients with lower-grade gliomas. Neuroimage Clin. 2018;20:1070–1077. doi:10.1016/j.nicl.2018.10.014
26. Bao ZS, Chen HM, Yang MY, et al. RNA-seq of 272 gliomas revealed a novel, recurrent PTPRZ1-MET fusion transcript in secondary glioblastomas. Genome Res. 2014;24:1765–1773. doi:10.1101/gr.165126.113
27. Zhao Z, Meng F, Wang W, Wang Z, Zhang CJiang T. Comprehensive RNA-seq transcriptomic profiling in the malignant progression of gliomas. Sci Data. 2017;4:170024. doi:10.1038/sdata.2017.24
28. Zhao Z, Zhang KN, Wang Q, et al. Chinese Glioma Genome Atlas (CGGA): a comprehensive resource with functional genomic data from Chinese glioma patients. Genomics Proteomics Bioinformatics. 2021. doi:10.1016/j.gpb.2020.10.005
29. Tang Z, Li C, Kang B, Gao G, Li C, Zhang Z. GEPIA: a web server for cancer and normal gene expression profiling and interactive analyses. Nucleic Acids Res. 2017;45:W98–w102. doi:10.1093/nar/gkx247
30. Clough E, Barrett T. The gene expression omnibus database. Methods Mol Biol. 2016;1418:93–110. doi:10.1007/978-1-4939-3578-9
31. Vasaikar SV, Straub P, Wang J, Zhang B. LinkedOmics: analyzing multi-omics data within and across 32 cancer types. Nucleic Acids Res. 2018;46:D956–d963. doi:10.1093/nar/gkx1090
32. Li T, Fan J, Wang B, et al. TIMER: a web server for comprehensive analysis of tumor-infiltrating immune cells. Cancer Res. 2017;77:e108–e110. doi:10.1158/0008-5472.can-17-0307
33. Kobayashi K, Blaser MJ, Brown WR. Identification of a unique IgG Fc binding site in human intestinal epithelium. J Immunol. 1989;143:2567–2574.
34. Harada N, Iijima S, Kobayashi K, et al. Human IgGFc binding protein (FcgammaBP) in colonic epithelial cells exhibits mucin-like structure. J Biol Chem. 1997;272:15232–15241. doi:10.1074/jbc.272.24.15232
35. Kobayashi K, Ogata H, Morikawa M, et al. Distribution and partial characterisation of IgG Fc binding protein in various mucin producing cells and body fluids. Gut. 2002;51:169–176. doi:10.1136/gut.51.2.169
36. Albert TK, Laubinger W, Müller S, et al. Human intestinal TFF3 forms disulfide-linked heteromers with the mucus-associated FCGBP protein and is released by hydrogen sulfide. J Proteome Res. 2010;9:3108–3117. doi:10.1021/pr100020c
37. Kim M, Lee S, Yang SK, Song K, Lee I. Differential expression in histologically normal crypts of ulcerative colitis suggests primary crypt disorder. Oncol Rep. 2006;16:663–670.
38. Kobayashi K, Yagasaki M, Harada N, et al. Detection of Fcgamma binding protein antigen in human sera and its relation with autoimmune diseases. Immunol Lett. 2001;79:229–235. doi:10.1016/s0165-2478
39. Lee S, Bang S, Song K, Lee I. Differential expression in normal-adenoma-carcinoma sequence suggests complex molecular carcinogenesis in colon. Oncol Rep. 2006;16:747–754.
40. Qi C, Hong L, Cheng Z, Yin Q. Identification of metastasis-associated genes in colorectal cancer using metaDE and survival analysis. Oncol Lett. 2016;11:568–574. doi:10.3892/ol.2015.3956
41. Zhuang Q, Shen A, Liu L, et al. Prognostic and immunological roles of Fc fragment of IgG binding protein in colorectal cancer. Oncol Lett. 2021;22:526. doi:10.3892/ol.2021.12787
42. Yuan Z, Zhao Z, Hu H, et al. IgG Fc Binding Protein (FCGBP) is down-regulated in metastatic lesions and predicts survival in metastatic colorectal cancer patients. Onco Targets Ther. 2021;14:967–977. doi:10.2147/ott.s285171
43. Omar OM, Soutto M, Bhat NS, et al. TFF1 antagonizes TIMP-1 mediated proliferative functions in gastric cancer. Mol Carcinog. 2018;57:1577–1587. doi:10.1002/mc.22880
44. Soutto M, Peng D, Katsha A, et al. Activation of β-catenin signalling by TFF1 loss promotes cell proliferation and gastric tumorigenesis. Gut. 2015;64:1028–1039. doi:10.1136/gutjnl-2014-307191
45. Znalesniak EB, Salm F, Hoffmann W. Molecular alterations in the stomach of Tff1-deficient mice: early steps in antral carcinogenesis. Int J Mol Sci. 2020;21. doi:10.3390/ijms21020644
46. Rajkumar T, Vijayalakshmi N, Gopal G, et al. Identification and validation of genes involved in gastric tumorigenesis. Cancer Cell Int. 2010;10:45. doi:10.1186/1475-2867-10-45
47. Xiong L, Wen Y, Miao X, Yang Z. NT5E and FcGBP as key regulators of TGF-1-induced epithelial-mesenchymal transition (EMT) are associated with tumor progression and survival of patients with gallbladder cancer. Cell Tissue Res. 2014;355:365–374. doi:10.1007/s00441-013-1752-1
48. Gazi MH, He M, Cheville JC, Young CY. Downregulation of IgG Fc binding protein (Fc gammaBP) in prostate cancer. Cancer Biol Ther. 2008;7:70–75. doi:10.4161/cbt.7.1.5131
49. Wang K, Guan C, Shang X, et al. A bioinformatic analysis: the overexpression and clinical significance of FCGBP in ovarian cancer. Aging. 2021;13:7416–7429. doi:10.18632/aging.202601
50. Anguille S, Smits EL, Lion E, van Tendeloo VF, Berneman ZN. Clinical use of dendritic cells for cancer therapy. Lancet Oncol. 2014;15:e257–e267. doi:10.1016/s1470-2045
51. Huang B, Li X, Li Y, Zhang J, Zong Z, Zhang H. Current immunotherapies for glioblastoma multiforme. Front Immunol. 2020;11:603911. doi:10.3389/fimmu.2020.603911
52. Garg AD, Vandenberk L, Koks C, et al. Dendritic cell vaccines based on immunogenic cell death elicit danger signals and T cell-driven rejection of high-grade glioma. Sci Transl Med. 2016;8:328ra27. doi:10.1126/scitranslmed.aae0105
53. Saka M, Amano T, Kajiwara K, et al. Vaccine therapy with dendritic cells transfected with Il13ra2 mRNA for glioma in mice. J Neurosurg. 2010;113:270–279. doi:10.3171/2009.9.jns09708
54. Kikuchi T, Akasaki Y, Abe T, et al. Vaccination of glioma patients with fusions of dendritic and glioma cells and recombinant human interleukin 12. J Immunother. 2004;27:452–459. doi:10.1097/00002371-200411000-00005
55. Mitchell DA, Batich KA, Gunn MD, et al. Tetanus toxoid and CCL3 improve dendritic cell vaccines in mice and glioblastoma patients. Nature. 2015;519:366–369. doi:10.1038/nature14320
56. Kobayashi T, Yamanaka R, Homma J, et al. Tumor mRNA-loaded dendritic cells elicit tumor-specific CD8 (+) cytotoxic T cells in patients with malignant glioma. Cancer Immunol Immunother. 2003;52:632–637. doi:10.1007/s00262-003-0408-5
57. Gu JH, Li G. Dendritic cell-based immunotherapy for malignant glioma. Neurosci Bull. 2008;24:39–44. doi:10.1007/s12264-008-1107-1
58. Mosaheb MM, Dobrikova EY, Brown MC, Yang Y. Genetically stable poliovirus vectors activate dendritic cells and prime antitumor CD8 T cell immunity. Nat Commun. 2020;11:524. doi:10.1038/s41467-019-13939-z
59. Dastmalchi F, Karachi A, Yang C, et al. Sarcosine promotes trafficking of dendritic cells and improves efficacy of anti-tumor dendritic cell vaccines via CXC chemokine family signaling. J Immunother Cancer. 2019;7:321. doi:10.1186/s40425-019-0809-4
60. Banissi C, Ghiringhelli F, Chen L, Carpentier AF. Treg depletion with a low-dose metronomic temozolomide regimen in a rat glioma model. Cancer Immunol Immunother. 2009;58:1627–1634. doi:10.1007/s00262-009-0671-1
61. Humphries W, Wei J, Sampson JH, Heimberger AB. The role of tregs in glioma-mediated immunosuppression: potential target for intervention. Neurosurg Clin N Am. 2010;21:125–137. doi:10.1016/j.nec.2009.08.012
62. Heimberger AB, Abou-Ghazal M, Reina-Ortiz C, et al. Incidence and prognostic impact of FoxP3+ regulatory T cells in human gliomas. Clin Cancer Res. 2008;14:5166–5172. doi:10.1158/1078-0432.ccr-08-0320
63. Vandenberk L. Van Gool S W. Treg infiltration in glioma: a hurdle for antiglioma immunotherapy. Immunotherapy. 2012;4:675–678. doi:10.2217/imt.12.64
64. Mitsuiki N, Schwab C, Grimbacher B. What did we learn from CTLA-4 insufficiency on the human immune system? Immunol Rev. 2019;287:33–49. doi:10.1111/imr.12721
65. Saha D, Martuza RL, Rabkin SD. Macrophage polarization contributes to glioblastoma eradication by combination immunovirotherapy and immune checkpoint blockade. Cancer Cell. 2017;32:253–267.e5. doi:10.1016/j.ccell.2017.07.006
66. Wainwright DA, Chang AL, Dey M, et al. Durable therapeutic efficacy utilizing combinatorial blockade against IDO, CTLA-4, and PD-L1 in mice with brain tumors. Clin Cancer Res. 2014;20:5290–5301. doi:10.1158/1078-0432.ccr-14-0514
67. Zhai L, Ladomersky E, Lenzen A, et al. IDO1 in cancer: a Gemini of immune checkpoints. Cell Mol Immunol. 2018;15:447–457. doi:10.1038/cmi.2017.143
68. Zhang Y, Yu G, Chu H, et al. Macrophage-associated PGK1 phosphorylation promotes aerobic glycolysis and tumorigenesis. Mol Cell. 2018;71:201–215.e7. doi:10.1016/j.molcel.2018.06.023
69. Hambardzumyan D, Gutmann DH, Kettenmann H. The role of microglia and macrophages in glioma maintenance and progression. Nat Neurosci. 2016;19:20–27. doi:10.1038/nn.4185
70. Wei J, Marisetty A, Schrand B, et al. Osteopontin mediates glioblastoma-associated macrophage infiltration and is a potential therapeutic target. J Clin Invest. 2019;129:137–149. doi:10.1172/jci121266
71. Quail DF, Joyce JA. The Microenvironmental Landscape of Brain Tumors. Cancer Cell. 2017;31:326–341. doi:10.1016/j.ccell.2017.02.009
72. Chen P, Zhao D, Li J, et al. Symbiotic macrophage-glioma cell interactions reveal synthetic lethality in PTEN-null glioma. Cancer Cell. 2019;35:868–884.e6. doi:10.1016/j.ccell.2019.05.003
73. De Boeck A, Ahn BY, D’Mello C, et al. Glioma-derived IL-33 orchestrates an inflammatory brain tumor microenvironment that accelerates glioma progression. Nat Commun. 2020;11:4997. doi:10.1038/s41467-020-18569-4
74. Komohara Y, Ohnishi K, Kuratsu J, Takeya M. Possible involvement of the M2 anti-inflammatory macrophage phenotype in growth of human gliomas. J Pathol. 2008;216:15–24. doi:10.1002/path.2370
75. Zeiner PS, Preusse C, Golebiewska A, et al. Distribution and prognostic impact of microglia/macrophage subpopulations in gliomas. Brain Pathol. 2019;29:513–529. doi:10.1111/bpa.12690
 © 2023 The Author(s). This work is published and licensed by Dove Medical Press Limited. The
full terms of this license are available at https://www.dovepress.com/terms
and incorporate the Creative Commons Attribution
- Non Commercial (unported, 3.0) License.
By accessing the work you hereby accept the Terms. Non-commercial uses of the work are permitted
without any further permission from Dove Medical Press Limited, provided the work is properly
attributed. For permission for commercial use of this work, please see paragraphs 4.2 and 5 of our Terms.
© 2023 The Author(s). This work is published and licensed by Dove Medical Press Limited. The
full terms of this license are available at https://www.dovepress.com/terms
and incorporate the Creative Commons Attribution
- Non Commercial (unported, 3.0) License.
By accessing the work you hereby accept the Terms. Non-commercial uses of the work are permitted
without any further permission from Dove Medical Press Limited, provided the work is properly
attributed. For permission for commercial use of this work, please see paragraphs 4.2 and 5 of our Terms.