Back to Journals » Journal of Inflammation Research » Volume 17
A Novel Inflammatory-Nutritional Prognostic Scoring System for Patients with Diffuse Large B Cell Lymphoma
Authors Wang Z ![]() , Bao Y, Xu Z, Sun Y, Yan X, Sheng L, Ouyang G
, Bao Y, Xu Z, Sun Y, Yan X, Sheng L, Ouyang G
Received 22 August 2023
Accepted for publication 19 December 2023
Published 3 January 2024 Volume 2024:17 Pages 1—13
DOI https://doi.org/10.2147/JIR.S436392
Checked for plagiarism Yes
Review by Single anonymous peer review
Peer reviewer comments 2
Editor who approved publication: Professor Ning Quan
Zanzan Wang,* Yurong Bao,* Zhijuan Xu, Yongcheng Sun, Xiao Yan, Lixia Sheng, Guifang Ouyang
Department of Hematology, The First Affiliated Hospital of Ningbo University, Ningbo, Zhejiang, People’s Republic of China
*These authors contributed equally to this work
Correspondence: Guifang Ouyang, Department of Hematology, The First Affiliated Hospital of Ningbo University, No. 59 Liuting Street, Haishu District, Ningbo, Zhejiang, 315000, People’s Republic of China, Tel/Fax +86 57487085166, Email [email protected]
Purpose: This study aimed to examine the predictive ability of inflammatory and nutritional markers and further establish a novel inflammatory nutritional prognostic scoring (INPS) system.
Patients and Methods: We collected clinicopathological and baseline laboratory data of 352 patients with DLBCL between April 2010 and January 2023 at the First affiliated hospital of Ningbo University. Eligible patients were randomly divided into training and validation cohorts (n = 281 and 71, respectively) in an 8:2 ratio. We used the least absolute shrinkage and selection operator (LASSO) Cox regression model to determine the most important factors among the eight inflammatory-nutritional variables. The impact of INPS on OS was evaluated using the Kaplan–Meier curve and the Log rank test. A prognostic nomogram was developed based on the multivariate Cox regression method. Then, we used the concordance index (C-index), calibration plot, and time-dependent receiver operating characteristic (ROC) analysis to evaluate the prognostic performance and predictive accuracy of the nomogram.
Results: Seven inflammatory-nutritional biomarkers, including neutrophil-lymphocyte ratio (NLR), prognostic nutritional index (PNI), body mass index (BMI), monocyte-lymphocyte ratio (MLR), prealbumin, C reactive protein, and D-dimer were selected using the LASSO Cox analysis to construct INPS, In the multivariate analysis, IPI-High-intermediate group, IPI-High group, high INPS were independently associated with OS, respectively. The prognostic nomogram for overall survival consisting of the above two indicators showed excellent discrimination. The C-index for the nomogram was 0.94 and 0.95 in the training and validation cohorts. The time-dependent ROC curves showed that the predictive accuracy of the nomogram for OS was better than that of the NCCN-IPI system.
Conclusion: The INPS based on seven inflammatory-nutritional indexes was a reliable and convenient predictor of outcomes in DLBCL patients.
Keywords: diffuse large B cell lymphoma, LASSO Cox analysis, inflammatory-nutritional biomarker, prognostic nomograms, overall survival
Introduction
Diffuse large B-cell lymphoma (DLBCL) is the most common subtype of non-Hodgkin’s lymphoma.1 Although complete remission is achieved in 60% of DLBCL patients with initial standard treatment, about 30–40% will relapse or develop refractory disease, which remains a serious challenge.2 In addition, according to gene expression profiling, DLBCL could be divided into two primary subtypes: germinal center B-cell-like (GCB) and activated B-cell-like (ABC). Patients with ABC DLBCL generally experience a worse prognosis.3 The potential biologic rationale responsible for this has yet to be elucidated.4 Considering the heterogeneity of DLBCL, the clinical prognostic indexes have been constructed to differentiate the risk of patients, including the National Comprehensive Cancer Network (NCCN)-International Prognostic Index (IPI) and age-adjusted IPI. Yet there are still patients in the low-risk cohort who have worse responses to therapy or relapse. This makes the identification of new, highly specific and practical biomarkers essential.
In recent years, more and more attention has been paid to the associations between inflammation and DLBCL. In the setting of lymphoma with aggressive characteristics, the accumulation of genetic variants may play an essential role in the development of DLBCL. Moreover, complex interactions that exist between immune cells and tumor cells have been involved in the unfavorable prognosis of DLBCL.5 Alterations in the peripheral blood immune cells are particularly linked to systemic inflammation. Accordingly, studies have reported that pretreatment platelet-lymphocyte ratio (PLR), lymphocyte-monocyte ratio (LMR), and neutrophil-lymphocyte ratio (NLR) are prognostic predictors in DLBCL.6–9 In addition, tumor mediated-inflammatory cells could release inflammatory cytokines, leading to the activation of the coagulation cascade and thrombosis formation. As a degradation product of fibrin, elevated D-dimer could reflect high activation of coagulation and fibrinolysis, which was supposed to be related with poor OS of DLBCL.10,11 Furthermore, CRP is one of the standard markers that reflect objective inflammation12 and it has shown that elevated CRP has a negative prognostic impact on DLBCL.13
Inadequate diet and proliferation of tumor cells have contributed to malnutrition in cancer patients, which in turn leads to poor response to treatment. Body mass index (BMI), serum levels of albumin, and prealbumin are often used to identify nutritional conditions. Prognostic Nutritional Index (PNI) derived from albumin and lymphocyte counts, which means hypoalbuminemia or lymphocytopenia, also reflects nutritional status. Some studies have demonstrated that low BMI, prealbumin and PNI are associated with dismal prognosis in DLBCL.14–17 It is worth mentioning that patients with malnourishment are always accompanied by hyper-systemic inflammatory status.18 The state of malnutrition may increase the severity of inflammation. The inflammatory response reduces albumin synthesis, in turn inducing malnutrition.19 In summary, malnutrition and systemic inflammation are both critical indices in the invasion and progression of DLBCL.
To our knowledge, it is not clear how a combination of inflammatory and nutritional variables can be used to predict prognosis in DLBCL. Compared to one marker, a prognostic system that incorporates several markers can provide enhanced predictive precision. Therefore, the purpose of this research is to examine the predictive ability of inflammatory and nutritional markers and further establish a novel inflammatory nutritional prognostic scoring (INPS) system. Then we sought to investigate the prognostic value of INPS in DLBCL and combined INPS with other independent factors to establish a nomogram for the prediction of the survival of DLBCL, and we confirmed the results in a validation cohort.
Methods and Materials
Study Population
Patients with a new diagnosis of DLBCL treated between April 2010 and January 2023 were retrospectively included in the First Affiliated Hospital of Ningbo University. The inclusion conditions were as described below: (1) patients were defined as DLBCL according to the WHO classification of lymphomas.20 (2) received 4–8 cycles of R-CHOP regimen (3) complete follow-up data (4) complete clinical and laboratory data at initial diagnosis. The exclusion conditions were as described below: (1) primary mediastinal DLBCL, primary central nervous systems (CNS) B cell lymphoma, high-grade cell lymphoma, and transformed indolent lymphoma (2) patients with active infection, severe hepatic or renal insufficiency, and HIV infection when first diagnosis (3) thromboembolic event within 3 months (4) patients had received antitumor treatment in other hospitals previously. Patients were randomly assigned to the training and validation groups in an 8:2 ratio. This study was approved by the Ethics Committee of the First Affiliated Hospital of Ningbo University in line with the principles of the Declaration of Helsinki. The ethics approval number was 2023–097RS-01.
Data Collection
We retrieved clinical and laboratory information including age, gender, COO classification, B symptoms, Ann Arbor stage, lactate dehydrogenase (LDH) level, Eastern Cooperative Oncology Group Performance Status (ECOG PS), serum β2-microglobulin (β2-MG), CRP, D-dimer, prealbumin, IPI, NCCN-IPI, chemotherapy regimen, and treatment response. Peripheral venous blood parameters were recorded within 1 week prior to the first cycle of therapy. The inflammatory or nutritional factors were determined as follows: BMI = (weight in kilograms)/ (height in meters)^2; PNI = serum albumin (g/L) + 5 × absolute lymphocyte count (109/L). Monocyte-lymphocyte ratio (MLR), platelet-lymphocyte ratio (PLR), and neutrophil-lymphocyte ratio (NLR) were calculated as monocyte/lymphocyte ratio, platelet/lymphocyte ratio, and neutrophil/lymphocyte ratio. The Hans algorithms were performed for Cell-of-origin (COO) classification.21 Follow-up date was until October 15, 2023. Overall survival (OS) was defined as the time from pathological diagnosis to death from any cause or last follow-up.
Statistical Analysis
Patients were randomly partitioned into the training and validation groups with SPSS random seeds. Pearson Chi-square test or Fisher’s exact test were applied to compare the categorical variables, while Mann–Whitney U-test was utilized to compare the continuous variables. To prevent the possibility of multicollinearity, the least absolute shrinkage and selection operator (LASSO) Cox regression model was performed utilizing the R software “glmnet” package. The seven most significant inflammatory and nutritional factors were then determined among eight variables and comprised the risk model by LASSO regression analysis. The following equation was used to determine the INPS: (Coefficient × expression of biomarker1) + (Coefficient × expression of biomarker2) +…+ (Coefficient × expression of biomarkerN). The cut-off threshold of INPS was calculated utilizing maximally selected rank statistics (R package “maxstat”). Patients were then divided into validation and training cohorts based on the cut-off value. The impact of INPS on OS was evaluated using the Kaplan–Meier curve and the Log rank test. The hazard ratio (HR) and 95% confidence interval (95% CI) was calculated by the Cox proportional hazards regression model to determine the prognostic impact of each variable in the univariate and multivariate analyses. Biomarkers with p < 0.05 in the multivariate analyses were incorporated into the stepwise nomogram using of R software “rms” package. To evaluate the effectiveness of the nomogram, the concordance index (c index) and the area under curve (AUC) were calculated. Next, model calibration was considered to confirm the reliability of the predictive power of the nomogram. The two-sided significance was defined at p-value < 0.05. R software (version 4.3.1) and SPSS software (version 25.0) were utilized for statistical analyses.
Results
Patient Characteristics
A total of 352 newly diagnosed patients with DLBCL between April 2010 and January 2023 were enrolled in this study. The baseline characteristics of 352 patients were summarized in Table 1. The median age was 62 years (interquartile range IQR 53–69 years), and 53.7% of patients were older than 60 years age. The ratio of female/male was 0.98:1. B symptom was presented in 73 (20.7%) patients. 237 (67.3%) patients had advanced III–IV ann arbor stages, and 75 (21.3%) patients had performance status ECOG ≥2. β2-MG ≥3.5mg/L was noted in 45 (12.8%) patients. The patients with low, low-intermediate, high-intermediate, and high IPI scores were 151 (42.9.%), 89 (25.3%), 65 (18.5%) and 47 (13.4%), respectively. Among these, 281 patients (79.8%) achieved complete remission (CR), 39 patients (11.1%) obtained partial response (PR), and 46 patients (14.4%) experienced relapse after response. The median follow-up was 44.0 months (95% CI:38.7–49.4). Throughout the follow-up period, 48 (13.6%) deaths occurred. To further increase the credibility of our study, these patients were randomized into the training cohort (n = 281) and validation cohort (n = 71) at a ratio of 8:2. The baseline characteristics were comparable and well-balanced between the two cohorts.
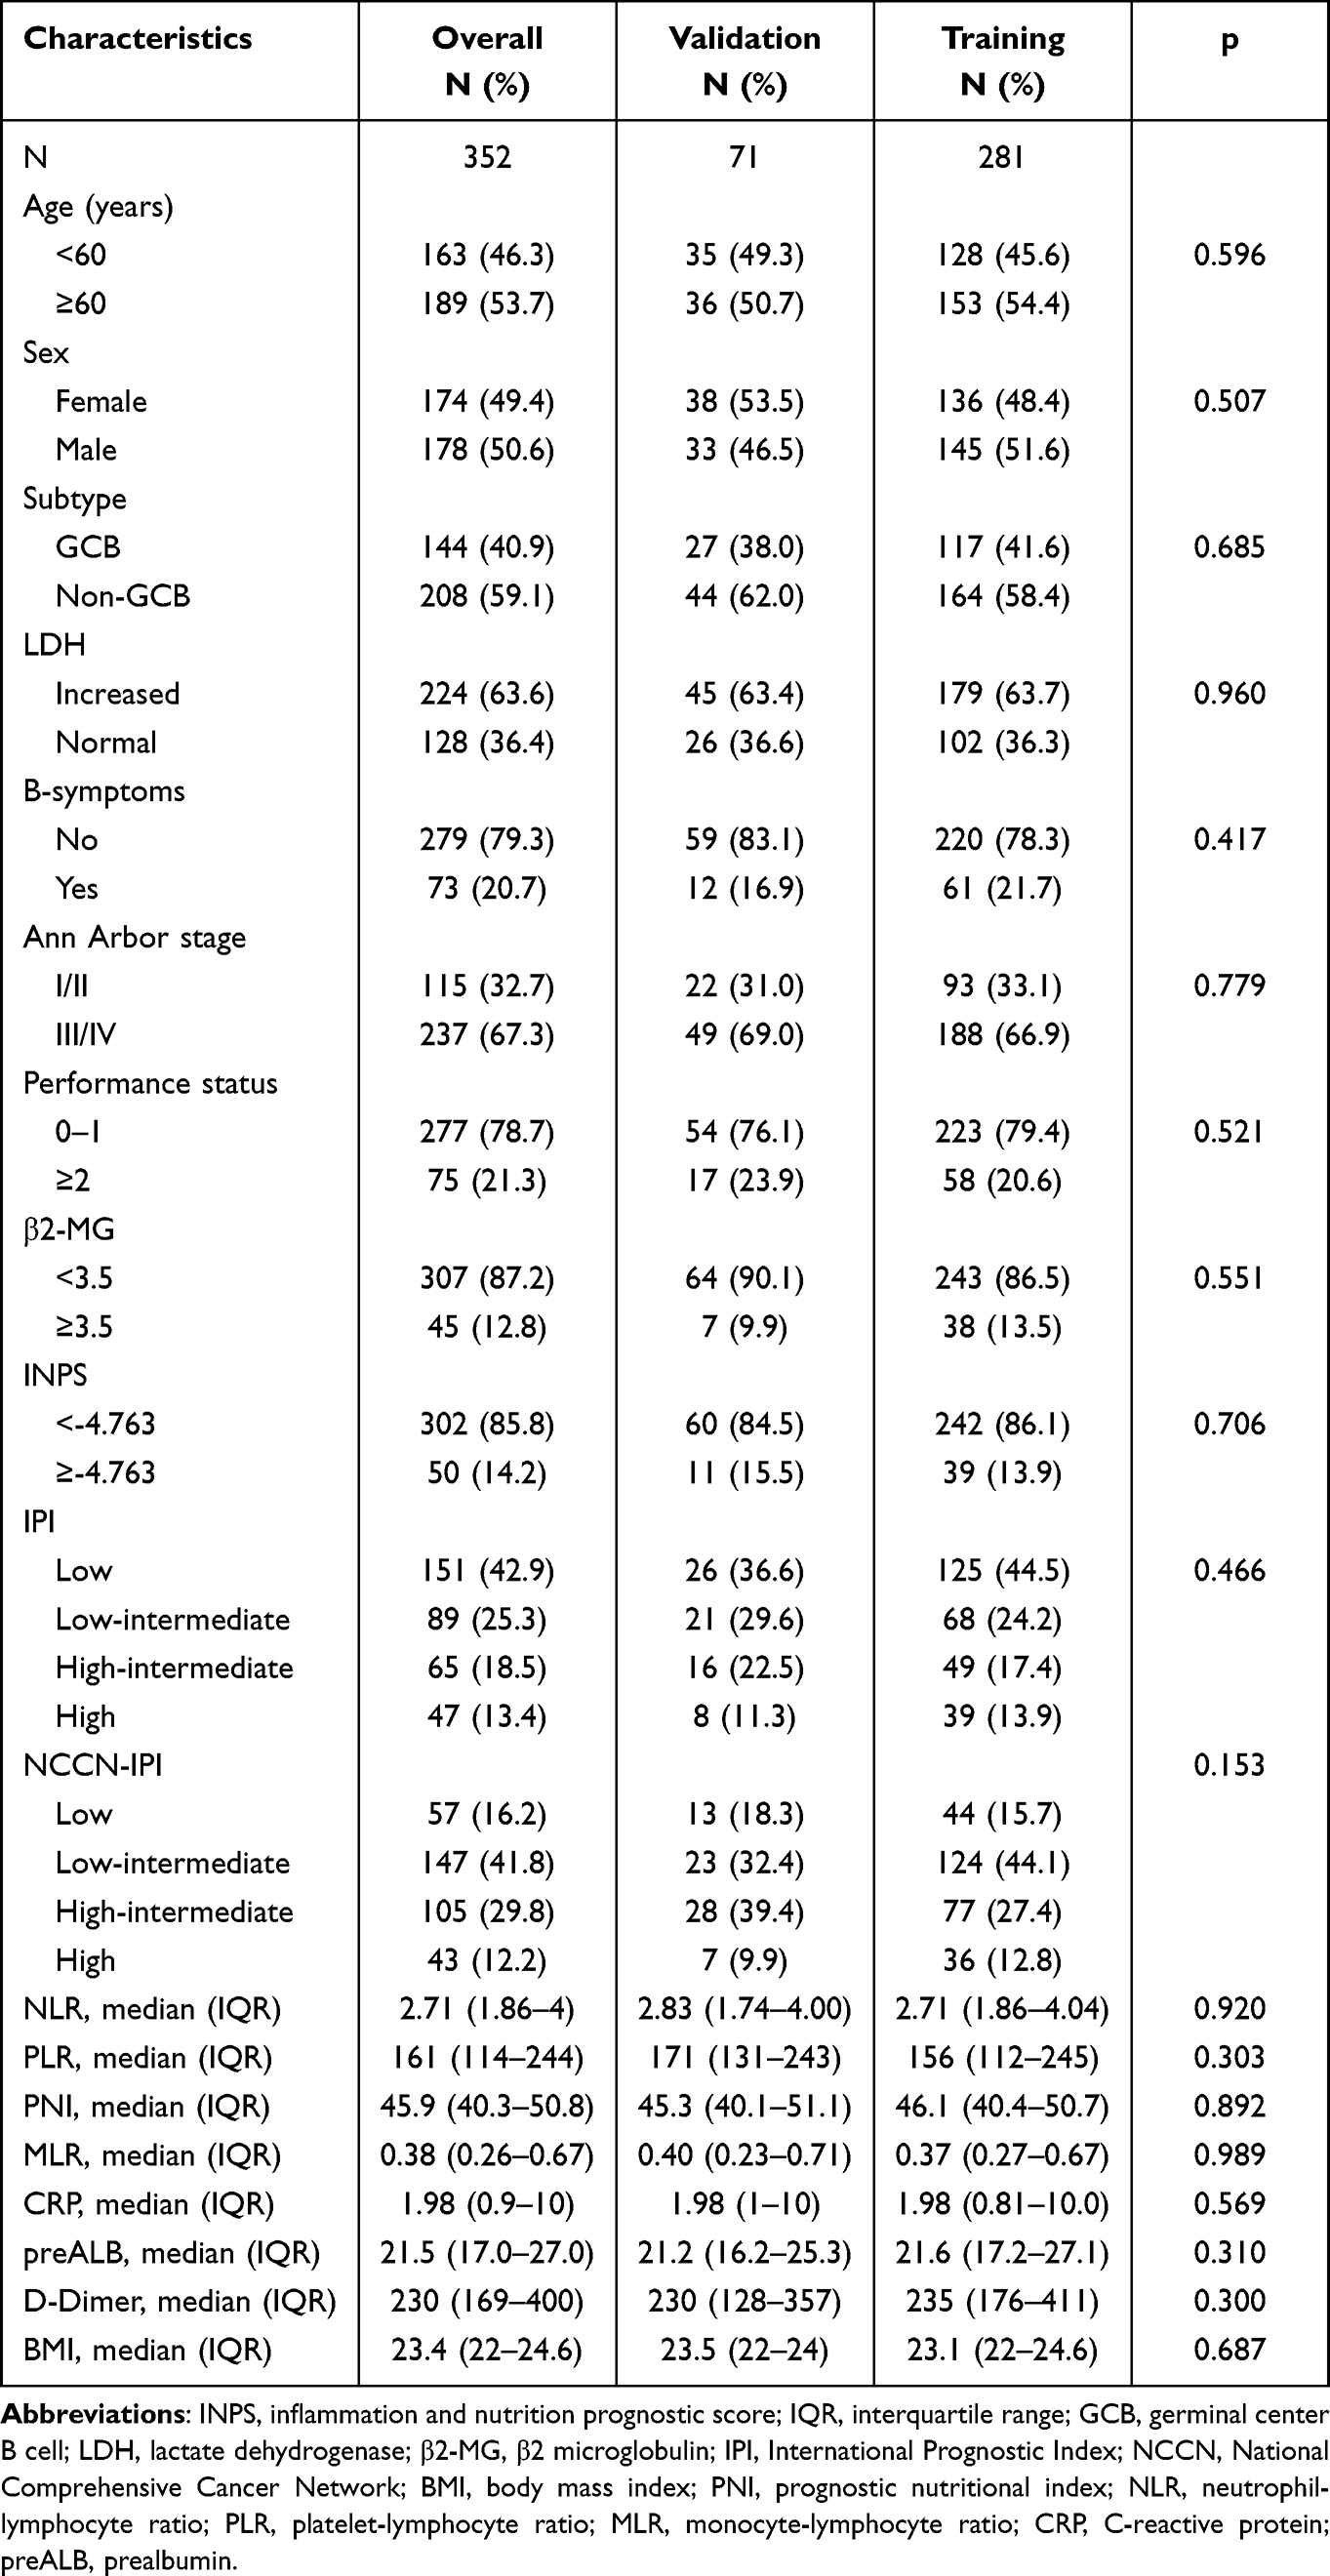 |
Table 1 Baseline Characteristics of 352 DLBCL Patients |
Construction of the INPS
After examining eight inflammatory-nutritional factors, including BMI, NLR, PLR, PNI, MLR, CRP, prealbumin and D-dimer, using LASSO Cox regression analysis, the seven most valuable prognostic variables were selected to construct the INPS, including the NLR, CRP, MLR, prealbumin, D-Dimer, BMI and PNI (Supplementary Figure 1A and B). The INPS was calculated based on the following formula: INPS=0.08725*NLR-0.06448*BMI-0.12765*PNI+0.19605*MLR+0.01368*CRP-0.0016*prealbumin+0.00051*D-Dimer. The best cut-off value of the INPS was −4.763, which was determined by using maximally selected rank statistics. Patients were stratified into the low INPS group (INPS < −4.763) and the high INPS group (INPS ≥ −4.763). In the training cohort, there were 242 (86.1%) cases in the low INPS group and 39 (13.9%) cases in the high INPS group, while the validation cohort included 11 (15.5%) patients with high INPS and 60 (84.5%) with low INPS. The high INPS group was found to be associated with higher level of LDH (P<0.001), high serum β2-MG (P<0.001), more advanced stage (P<0.001), high-risk IPI score (P<0.001), and high-risk NCCN-IPI score (P<0.001) both in training and validation groups (Table 2).
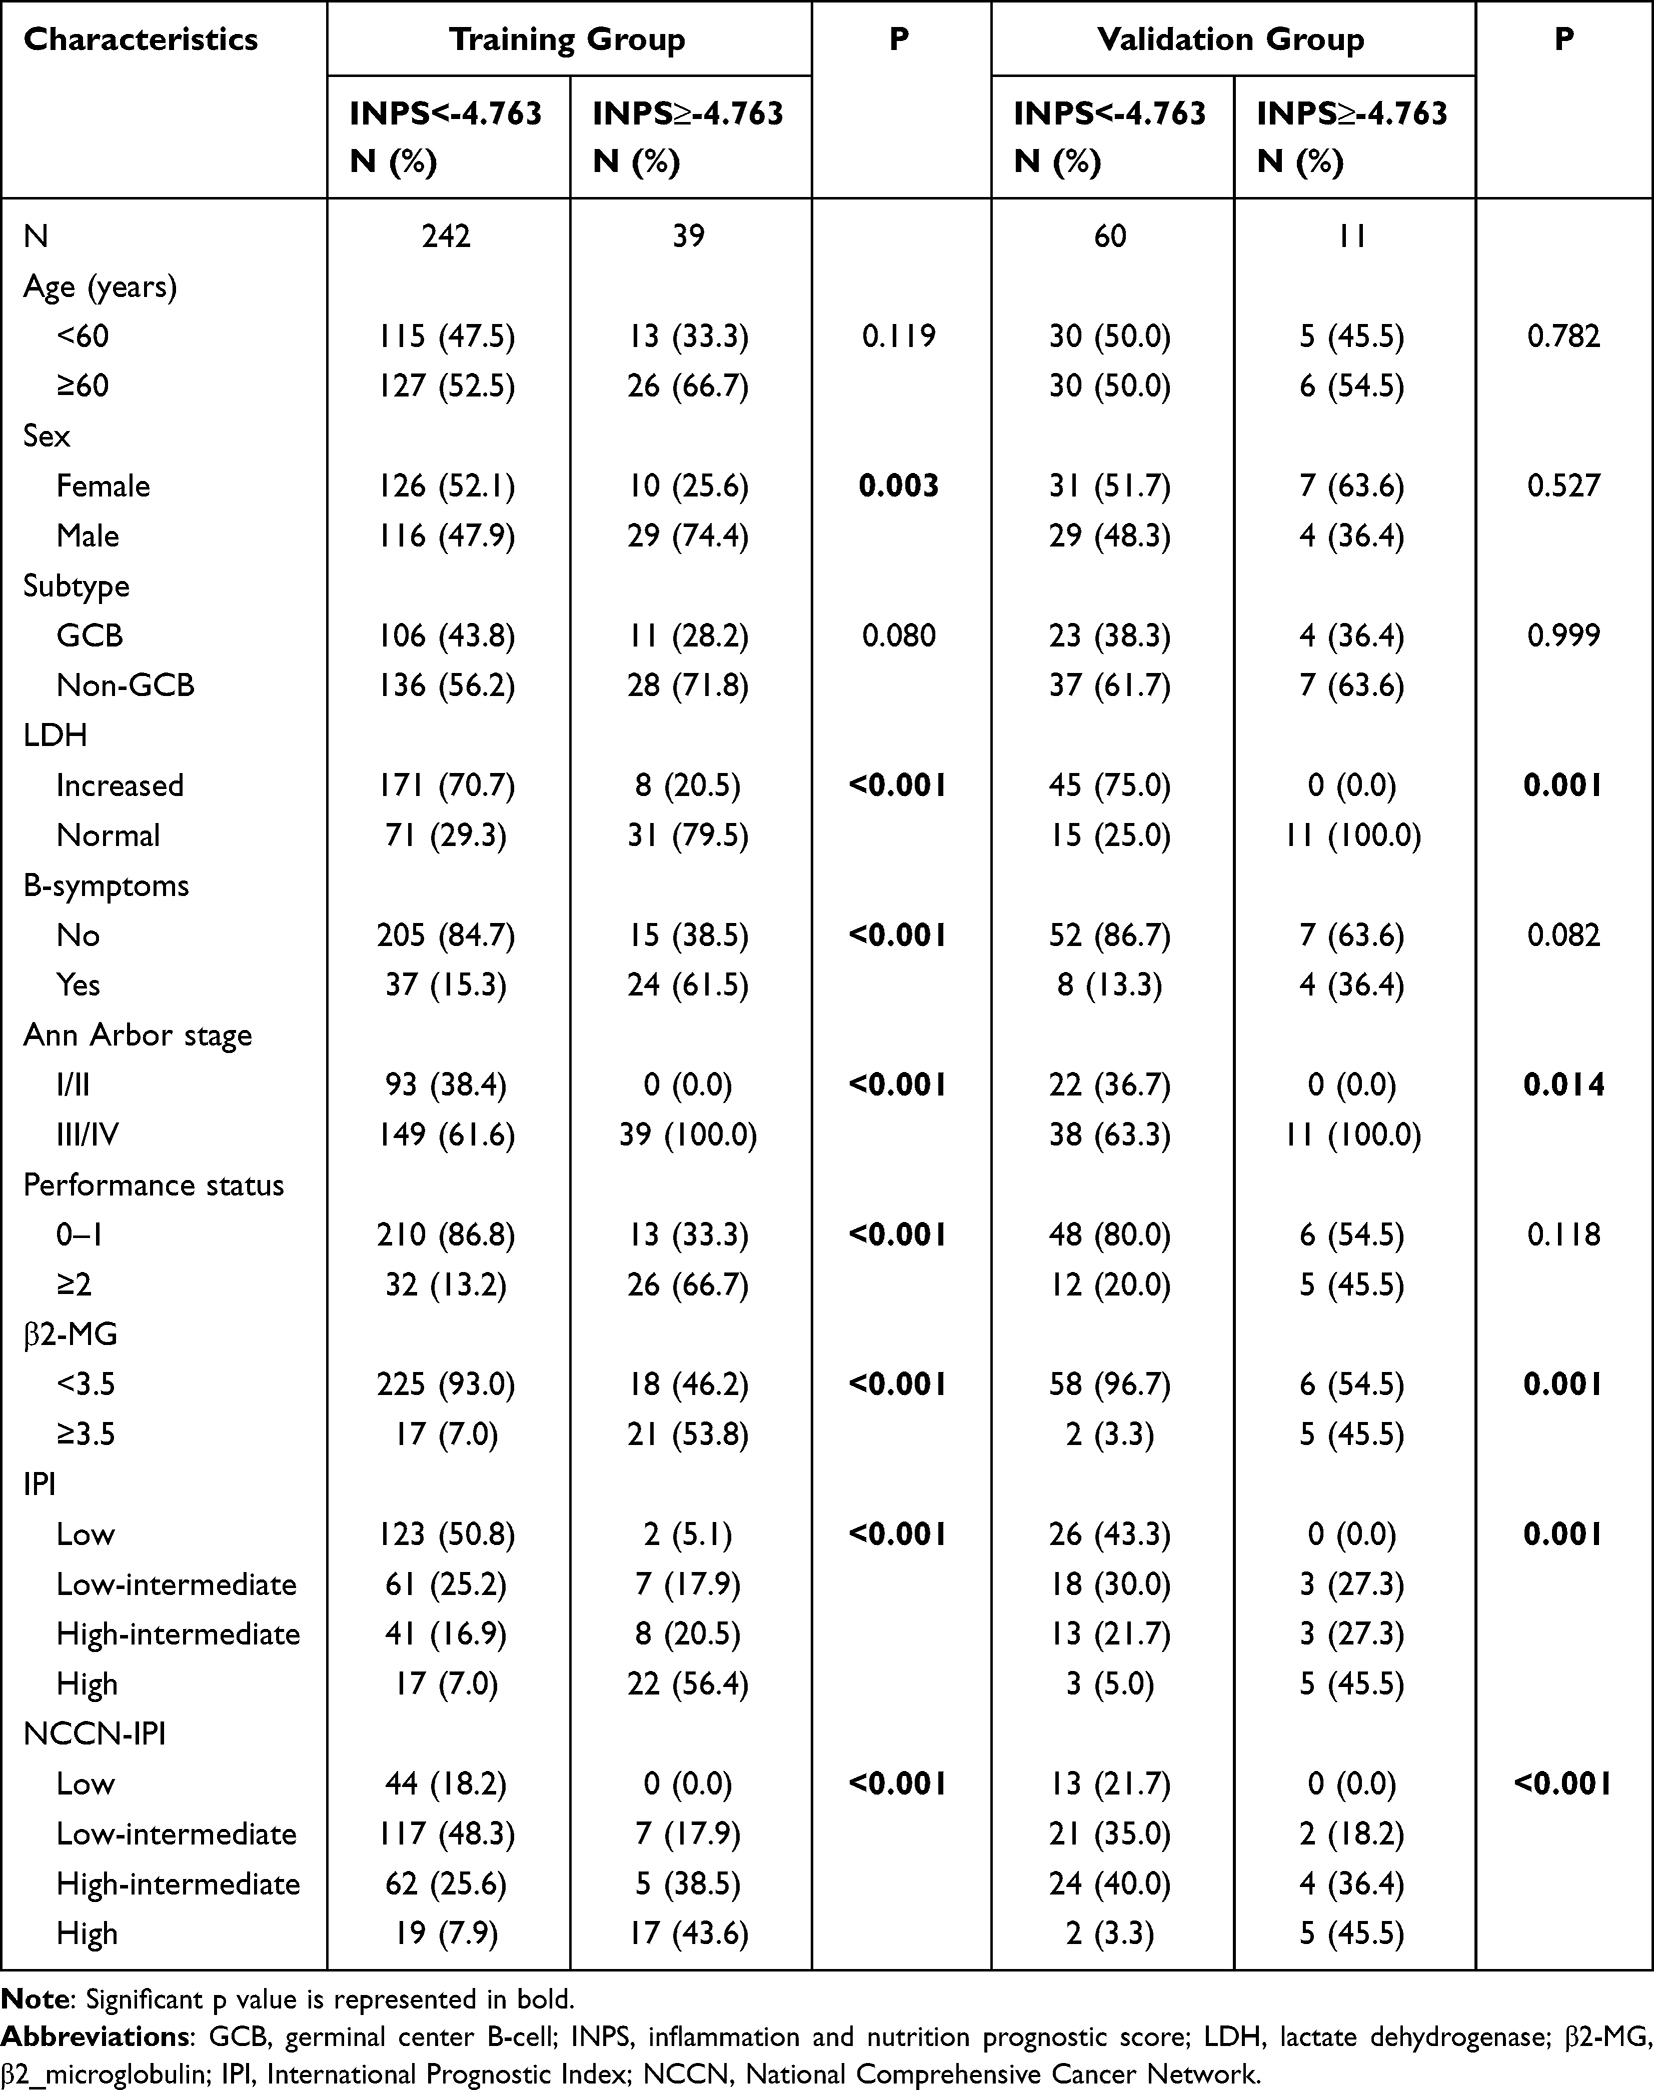 |
Table 2 Associations Between Pretreatment INPS Levels and Baseline Characteristics of DLBCL Patients in the Training Group and Validation Group |
Kaplan-Meier curve showed that patients with high INPS had significantly worse OS than those with low INPS both in training (Figure 1A, P<0.001) and validation groups (Figure 1B P<0.001). Moreover, in subgroup analysis, similar results were found when compared to the overall patient population. We discovered that the high INPS group had worse OS than the low INPS group in both female and male groups (Figure 2A and B, both P<0.001), both GCB and non-GCB group (Figure 2C and D, both P<0.001), both patients younger than 60 years and older than 60 years (Figure 2E and F, both P<0.001).
 |
Figure 1 Overall survival curves obtained with Kaplan-Meier analysis between different INPS groups. (A) Survival curves in the training cohort. (B) Survival curves in the validation cohort. Abbreviation: INPS, inflammatory-nutritional prognostic scoring. |
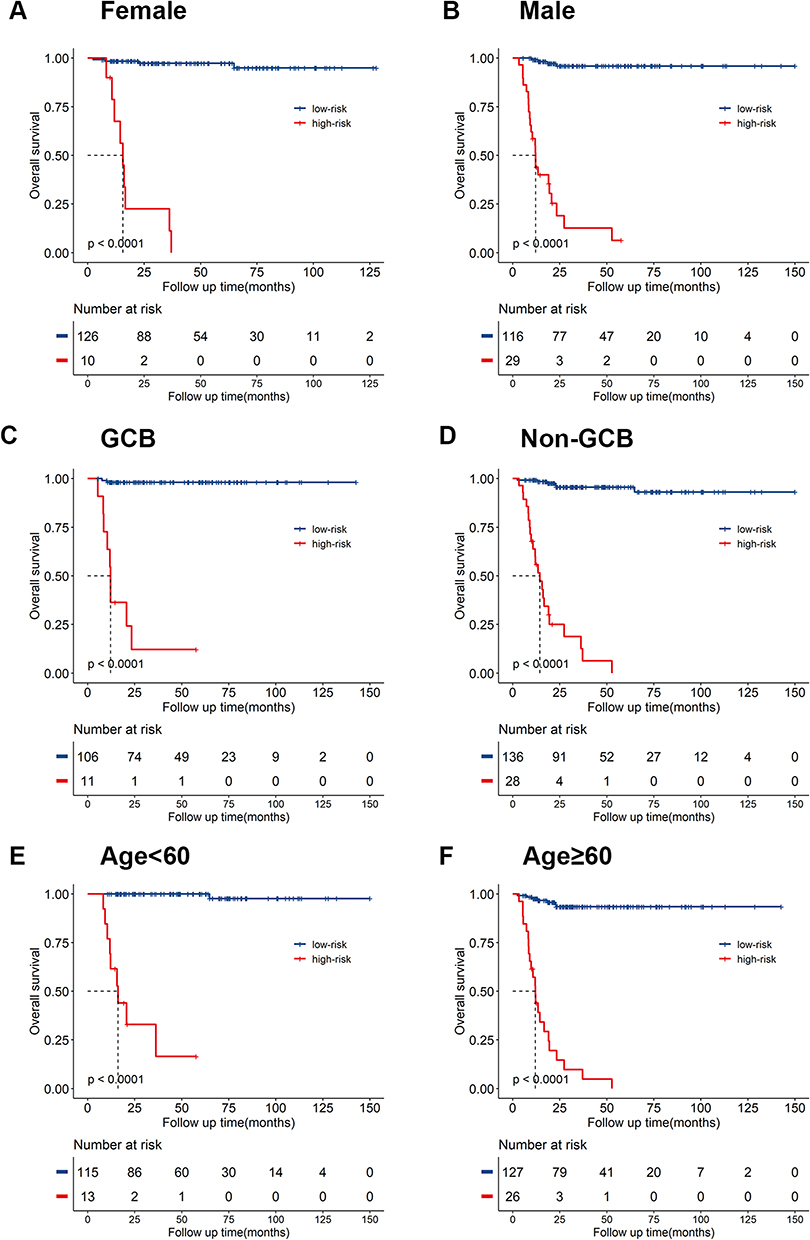 |
Figure 2 Overall survival curves obtained with Kaplan-Meier analysis between different INPS groups in subgroups. Survival curves in female (A) and male group (B), GCB (C) and non-GCB group (D), patients younger than 60 years (E) and older than 60 years (F). Abbreviations: INPS, inflammatory-nutritional prognostic scoring; GCB, germinal center B cell. |
Univariate and Multivariate Cox Analyses for OS
In univariable Cox analysis, male (P=0.026, HR: 2.12, 95% CI: 1.10–4.12), the presence of B symptoms (P<0.001, HR: 6.95, 95% CI: 3.68–13.12, IPI-Low-intermediate group (P=0.004, HR: 11.61, 95% CI: 2.43–55.41) IPI-High-intermediate group (P<0.001, HR: 25.30, 95% CI: 6.18–103.50), IPI-High group (P<0.001, HR: 121.80, 95% CI: 42.31–350.40), high INPS (P<0.001, HR: 45.09, 95% CI: 14.53–140.00), β2-MG≥3.5 (P<0.001, HR: 7.96, 95% CI: 4.26–14.88) were predictors of OS. Multivariate Cox models were used to analyze whether the above variables were significant independent predictors. In the multivariate analysis, IPI-High-intermediate group (P=0.018, HR: 13.29, 95% CI: 1.57–112.77), IPI-High group (P=0.009, HR: 18.05, 95% CI: 2.06–158.16), high INPS were independently associated with OS (P <0.001, HR: 25.06, 95% CI:9.37–67.03), respectively, Table 3.
 |
Table 3 Univariate and Multivariate Analysis of Prognostic Factors for OS |
Development of a Novel Prognostic Model Based on INPS
Based on the two independent variables (IPI and INPS), a novel prognostic nomogram was established for survival prediction at 1-, 3-, and 5-year (Figure 3). The C-index for the nomogram was 0.94 and 0.95 in the training and validation cohorts, respectively. Moreover, this nomogram had significantly superior discriminative ability than NCCN-IPI with a C-index of 0.82 and 0.84 in the training and validation cohorts, respectively. The calibration curves demonstrated superior concordance between the expected 3- and 5-year OS and the observed situation in the training (Figure 4A and B) and validation cohorts (Figure 4C and D). The time-dependent ROC curves could be used to reflect and compare the predictive accuracy of these models more intuitively. According to the time-dependent ROC curves, the AUCs of nomogram for 1, 3, and 5 years of OS in the training cohort were 0.919, 0.957, and 0.974, respectively. The AUCs of NCCN-IPI for 1, 3, and 5 years of OS were 0.864, 0.860, and 0.867, respectively (Figure 4E). In the validation cohort, the AUCs of nomogram for 1, 3, and 5 years of OS were 0.970, 0.923, and 0.957, respectively. The AUCs of NCCN-IPI for 1, 3, and 5 years of OS were 0.956, 0.849, and 0.853, respectively (Figure 4F). The prognostic accuracy and specificity of the nomogram for OS was superior to that of the NCCN-IPI system. The above data illustrated the outstanding differentiating capability of the nomogram.
 |
Figure 3 Prognostic nomogram based on INPS for DLBCL patients. The nomogram for predicting 1-, 3- and 5-year survival probability in DLBCL patients. Abbreviations: INPS, inflammatory-nutritional prognostic scoring; IPI, International Prognostic Index. |
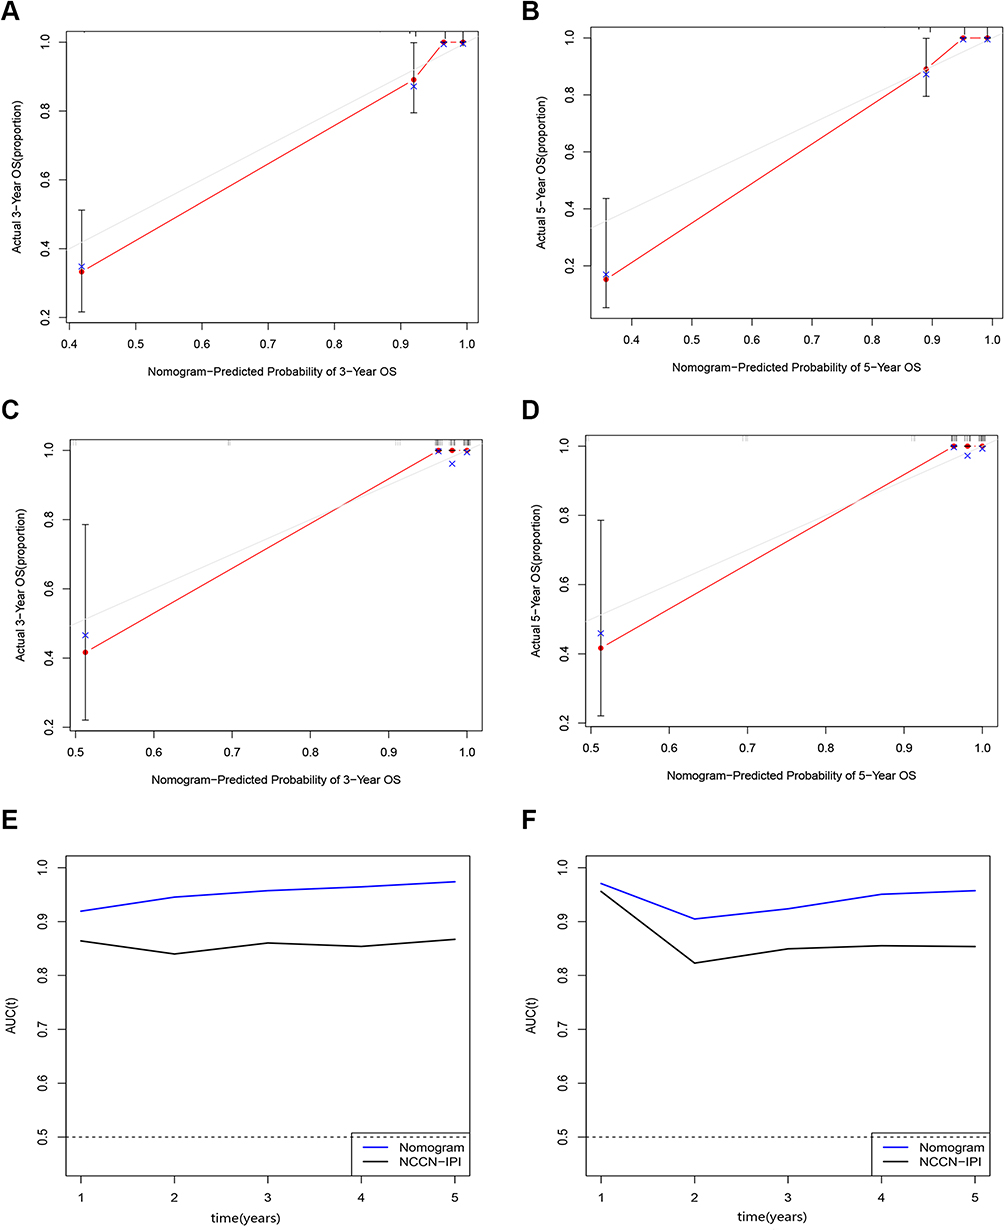 |
Figure 4 Validation of the prognostic nomogram model. (A) Calibration plots of the nomogram model at 3-year in the training cohort. (B) Calibration plots of the nomogram model at 5-year in the training cohort. (C) Calibration plots of the nomogram model at 3-year in the validation cohort. (D) Calibration plots of the nomogram model at 5-year in the validation cohort. (E) Time independent ROC curves compared the predictive accuracy of the current nomogram (the blue line) and NCCN-IPI system (the black line) in the training cohort. (F) Time independent ROC curves compared the predictive accuracy of the current nomogram (the blue line) and NCCN-IPI system (the black line) in the validation cohort. Abbreviations: OS, overall survival; INPS, inflammatory-nutritional prognostic scoring; NCCN-IPI, National Comprehensive Cancer Network-International Prognostic Index; ROC, receiver operating characteristic; AUC, area Under Curve. |
Discussion
In recent years, multiple studies have established predictive models that combine several independent variants and explored the prognostic impact of models in the tumor. Predictive models are more accurate than individual variants in assessing outcomes. The prognostic role of inflammatory nutritional scoring has been recently reported in breast cancer22 and multiple myeloma.23 However, there is still no prognostic model that incorporates inflammatory and nutritional factors in DLBCL.
In this present study, a prognostic index INPS, consisting of seven inflammatory-nutrition indicators, was demonstrated to be related to the dismal prognosis of DLBCL. The high INPS group was discovered to have more aggressive clinical characteristics, which included higher level of LDH, higher serum β2-MG, more advanced stage, high-risk IPI score, and high-risk NCCN-IPI score. It was likely that high INPS was not only associated with a higher inflammatory state but also with a higher tumor burden.
The IPI staging system mainly reflects the tumor burden that was used in the pre-rituximab era.24,25 Currently, The NCCN-IPI, based on accessible and robust clinical parameters with a more precise definition of extranodal site involvement, has been widely used for the stratification of DLBCL.26 However, these models include only one laboratory parameter, failing to consider the role of the inflammatory microenvironment in tumor progression and nutritional status in chemotherapy tolerance. In this study, individuals with high INPS have been proven to have worse mortality outcomes compared with patients with low INPS. A subgroup analysis also confirmed consistent results across different age, gender and GEP groups. Through multivariate analysis, we found that high-grade IPI and high INPS had substantial association with poorer OS, which indicated that INPS could predict inferior outcomes independently of the IPI system. In particular, the INPS could identify higher-risk patients with inferior prognosis among the high-risk IPI group (3-year OS: INPS high-risk group 9.8% vs INPS low-risk group 75.8%, P<0.001, Supplementary Figure 2A) and high-risk NCCN-IPI group (3-year OS: INPS high-risk group 6.6% vs INPS low-risk group 79.9%, P<0.001, Supplementary Figure 2B). Subsequently, we incorporated two significant clinicopathologic factors, IPI and INPS, to create a prognostic nomogram. We compared the nomogram and NCCN-IPI to identify the model with the higher predictive accuracy for outcomes in DLBCL patients. When AUC was calculated, the nomogram showed a higher value compared to NCCN-IPI. As a combined effect of the tumor burden and inflammation, this nomogram could provide information for clinicians to select an appropriate initial regimen for patients. However, it should be emphasized that INPS is intended to be a supplement to IPI score to improve the accuracy of prognostic prediction of IPI, rather than to replace it.
Glasgow prognostic score (GPS), incorporating CRP and albumin, is also a simplified tool based on inflammation and nutrition with predictive ability in patients with DLBCL.27 On the basis of the cut-off values of CRP and albumin, the patients were simply allocated into three groups. However, the change extent of clinical metrics cannot be fully represented by binary categorical variables. Small changes in biomarkers can lead to large changes in predictive biomarkers. When calculating the AUC, INPS showed superior values compared to GPS in our study (0.874 and 0.841, respectively). INPS, which incorporated multiple factors into the prediction, was more comprehensive and meaningful than the GPS. Liu et al comprehensively evaluated the various inflammatory and nutritional variables, including PNI, GPS, NLR, and PLR, and instructed the nomogram to predict the OS of DLBCL.28 This study could reduce the collinearity and correlation among variables to some extent. However, as the proportion of patients classified in the high-risk NCCN-IPI group was relatively small, the role of variables in high-risk patients requires further study. Furthermore, Liu et al used the immune-inflammatory index, PNI and modified GPS to establish the inflammation-based prognosis score (IBPS), then used IBPS, response to treatment and whether to accept surgery to construct nomogram to estimate the survival time of DLBCL.29 But the time point used to assess response to treatment was inconsistent with the time point of IBPS, leading to limited use in newly diagnosed patients and statistical issues.
Although laboratory parameters were easily accessible and inexpensive in routine daily clinical practice, the calculation of INPS may be relatively complicated. We plan to provide an online tool to calculate INPS after validation with a larger cohort study, which will make it easier to obtain. It should be noted that the use of INPS was limited in some circumstances in clinical practice. INPS was not suitable for use in patients with acute infections due to the interference with the calculation of INPS. Corticosteroids theoretically lead to lymphocytopenia due to an apoptotic effect on lymphocytes.30 Moreover, clinical studies have shown the use of corticosteroids causes lower proportions of CD4+ T cells,31 leading to the down-regulation of inflammation. Corticosteroid treatment leads to increased migration of neutrophils from the bone marrow,32 favoring the survival of neutrophils. Therefore, the lymphocytes and other hematological parameters are directly affected by corticosteroid treatment in patients. Patients with a high tumor burden would normally have been started on steroids after pathological diagnosis to prevent tumor lysis syndrome in daily practice. In this study, we eliminated patients who received glucocorticoids after definitive diagnosis prior start of chemotherapy to reduce the influence of corticosteroids on laboratory parameters. A larger cohort study is needed to discuss the prognostic significance of changes in these hematological indices before and after corticosteroid treatment.
This study has some limitations. First of all, considering that it was a single-center and retrospective design, selection biases were inevitable. Only the fit elderly patients were treated with R-CHOP, leading to the reduction of the prognostic significance of age. On the other hand, we choose all-cause mortality but not lymphoma-related mortality as the primary point. A limitation of survival analysis is the presence of mortality unrelated to lymphoma, potentially resulting in an overestimation of absolute risk to some extent.33 Especially in elderly patients, the cause of death is mainly treatment-related toxicity and comorbidities. Secondly, the ki-67 index, sites of involvement, and response assessment at interim and end-of-treatment were not analyzed. Finally, understanding if patients with high INPS are enriched for the recurrent mutations in tumors is significant, but this technology is expensive, making it difficult to explore the relationship between it and INPS. Our findings need to be validated in a cohort with a larger sample size to establish the applicability of our model in clinical practice.
Conclusion
This present study has shown that the INPS consisting of seven inflammatory and nutritional indexes was a robust and convenient indicator of survival in DLBCL patients. Furthermore, the nomogram based on INPS showed outstanding ability, which might be a very powerful tool for predicting outcomes in daily clinical practice.
Data Sharing Statement
The data of this study can be obtained from the corresponding authors upon reasonable request.
Ethics Approval and Informed Consent
The study was conducted in accordance with the Declaration of Helsinki and approved by the Ethics Committee of the First Affiliated Hospital of Ningbo University (approval number: 2023-097RS-01). The requirement for informed consent was waived because it was a retrospective study, and the anonymized processing of patient data was conducted.
Author Contributions
All authors made a significant contribution to the work reported, whether that is in the conception, study design, execution, acquisition of data, analysis and interpretation, or in all these areas; took part in drafting, revising or critically reviewing the article; gave final approval of the version to be published; have agreed on the journal to which the article has been submitted; and agree to be accountable for all aspects of the work.
Funding
This work was supported by grants from the Medical and Health Science and Technology Project of Zhejiang Province (Grant No. 2023KY316, Grant No. 2021KY273) and the Technological Project of Ningbo City (Grant No. 2022S032).
Disclosure
The authors report no conflicts of interest in this work.
References
1. Menon MP, Pittaluga S, Jaffe ES. The histological and biological spectrum of diffuse large B-cell lymphoma in the World Health Organization classification. Cancer J. 2012;18(5):411–420. doi:10.1097/PPO.0b013e31826aee97
2. Roschewski M, Staudt LM, Wilson WH. Diffuse large B-cell lymphoma-treatment approaches in the molecular era. Nat Rev Clin Oncol. 2014;11(1):12–23. doi:10.1038/nrclinonc.2013.197
3. Liu Y, Barta SK. Diffuse large B-cell lymphoma: 2019 update on diagnosis, risk stratification, and treatment. Am J Hematol. 2019;94(5):604–616. doi:10.1002/ajh.25460
4. Zheng W, Lin Q, Issah MA, Liao Z, Shen J. Identification of PLA2G7 as a novel biomarker of diffuse large B cell lymphoma. BMC Cancer. 2021;21(1):927. doi:10.1186/s12885-021-08660-4
5. Diakos CI, Charles KA, McMillan DC, Clarke SJ. Cancer-related inflammation and treatment effectiveness. Lancet Oncol. 2014;15(11):e493–e503. doi:10.1016/s1470-2045(14)70263-3
6. Shih MF, Lue KH, Wang TF, Chu SC, Huang CH. Association between the neutrophil-to-lymphocyte ratio and infection and survival in diffuse large B cell lymphoma. In Vivo. 2023;37(2):948–954. doi:10.21873/invivo.13167
7. Yang Z, Yu W. Clinical significance of circulating neutrophils and lymphocyte subsets in newly diagnosed patients with diffuse large B-cell lymphoma. Clin Exp Med. 2023;23(3):815–822. doi:10.1007/s10238-022-00867-4
8. Chen Y, Zhang Z, Fang Q, Jian H. Prognostic impact of platelet-to-lymphocyte ratio on diffuse large B-cell lymphoma: a meta-analysis. Cancer Cell Int. 2019;19:245. doi:10.1186/s12935-019-0962-3
9. Yang J, Guo X, Hao J, Dong Y, Zhang T, Ma X. The prognostic value of blood-based biomarkers in patients with testicular diffuse large B-cell lymphoma. Front Oncol. 2019;9:1392. doi:10.3389/fonc.2019.01392
10. Liu B, Li B, Zhou P, et al. Prognostic value of pretreatment plasma D-dimer levels in patients with diffuse large B cell lymphoma (DLBCL). Clin Chim Acta. 2018;482:191–198. doi:10.1016/j.cca.2018.04.013
11. Huang H, Fan L, Fu D, Lin Q, Shen J. High pretreatment plasma D-dimer levels predict poor survival in patients with diffuse large B-cell lymphoma in the real world. Transl Cancer Res. 2021;10(4):1723–1731. doi:10.21037/tcr-20-2908
12. Gradel KO, Larsen TS, Frederiksen H, et al. Impact of C-reactive protein and albumin levels on short, medium, and long term mortality in patients with diffuse large B-cell lymphoma. Ann Med. 2022;54(1):713–722. doi:10.1080/07853890.2022.2046287
13. Wang J, Zhou M, Wang X, Xu J, Chen B, Ouyang J. Pretreatment C-reactive protein was an independent prognostic factor for patients with diffuse large B-cell lymphoma treated with RCHOP. Clin Chim Acta. 2016;459:150–154. doi:10.1016/j.cca.2016.05.033
14. Matsukawa T, Suto K, Kanaya M, et al. Validation and comparison of prognostic values of GNRI, PNI, and CONUT in newly diagnosed diffuse large B cell lymphoma. Ann Hematol. 2020;99(12):2859–2868. doi:10.1007/s00277-020-04262-5
15. Yan D, Shen Z, Zhang S, et al. Prognostic values of geriatric nutritional risk index (GNRI) and prognostic nutritional index (PNI) in elderly patients with Diffuse Large B-Cell Lymphoma. J Cancer. 2021;12(23):7010–7017. doi:10.7150/jca.62340
16. Wang Z, Luo S, Zhao X. The prognostic impact of Body Mass Index in Patients with diffuse large B-cell lymphoma: a meta-analysis. Nutr Cancer. 2021;73(11–12):2336–2346. doi:10.1080/01635581.2020.1823437
17. Park S, Han B, Cho JW, et al. Effect of nutritional status on survival outcome of diffuse large B-cell lymphoma patients treated with rituximab-CHOP. Nutr Cancer. 2014;66(2):225–233. doi:10.1080/01635581.2014.867065
18. Juliette P, Hélène L, Caroline T, et al. Prognostic relevance of sarcopenia, geriatric, and nutritional assessments in older patients with diffuse large B-cell lymphoma: results of a multicentric prospective cohort study. Ann Hematol. 2023;102(7):1811–1823. doi:10.1007/s00277-023-05200-x
19. Besutti G, Massaro F, Bonelli E, et al. Prognostic impact of muscle quantity and quality and fat distribution in diffuse large B-cell lymphoma patients. Front Nutr. 2021;8:620696. doi:10.3389/fnut.2021.620696
20. Swerdlow SH, Campo E, Pileri SA, et al. The 2016 revision of the World Health Organization classification of lymphoid neoplasms. Blood. 2016;127(20):2375–2390. doi:10.1182/blood-2016-01-643569
21. Hans CP, Weisenburger DD, Greiner TC, et al. Confirmation of the molecular classification of diffuse large B-cell lymphoma by immunohistochemistry using a tissue microarray. Blood. 2004;103(1):275–282. doi:10.1182/blood-2003-05-1545
22. Hua X, Duan F, Zhai W, et al. A novel inflammatory-nutritional prognostic scoring system for patients with early-stage breast cancer. J Inflamm Res. 2022;15:381–394. doi:10.2147/jir.S338421
23. Zhang L, Chen S, Wang W, Wang Y, Liang Y. Inflammatory and nutritional scoring system for predicting prognosis in patients with newly diagnosed multiple myeloma. J Inflamm Res. 2023;16:7–17. doi:10.2147/jir.S390279
24. International Non-Hodgkin’s Lymphoma Prognostic Factors Project. A predictive model for aggressive non-Hodgkin’s lymphoma. N Engl J Med. 1993;329(14):987–994. doi:10.1056/nejm199309303291402
25. Ruppert AS, Dixon JG, Salles G, et al. International prognostic indices in diffuse large B-cell lymphoma: a comparison of IPI, R-IPI, and NCCN-IPI. Blood. 2020;135(23):2041–2048. doi:10.1182/blood.2019002729
26. Jelicic J, Juul-Jensen K, Bukumiric Z, et al. Prognostic indices in diffuse large B-cell lymphoma: a population-based comparison and validation study of multiple models. Blood Cancer J. 2023;13(1):157. doi:10.1038/s41408-023-00930-7
27. Kanemasa Y, Shimoyama T, Sasaki Y, et al. A convenient prognostic score consisting of the Glasgow prognostic score and serum lactate dehydrogenase predicts clinical outcome in patients with diffuse large B-cell lymphoma. Leuk Lymphoma. 2016;57(10):2460–2463. doi:10.3109/10428194.2016.1143940
28. Liu Y, Sheng L, Hua H, Zhou J, Zhao Y, Wang B. An externally validated nomogram for predicting the overall survival of patients with diffuse large B-cell lymphoma based on clinical characteristics and systemic inflammatory markers. Technol Cancer Res Treat. 2023;22:15330338231180785. doi:10.1177/15330338231180785
29. Liu Y, Sheng L, Hua H, Zhou J, Zhao Y, Wang B. A novel and Validated Inflammation-Based Prognosis Score (IBPS) predicts outcomes in patients with diffuse large B-cell lymphoma. Cancer Manag Res. 2023;15:651–666. doi:10.2147/cmar.S408100
30. Schmidt S, Rainer J, Ploner C, Presul E, Riml S, Kofler R. Glucocorticoid-induced apoptosis and glucocorticoid resistance: molecular mechanisms and clinical relevance. Cell Death Differ. 2004;11(Suppl 1):S45–S55. doi:10.1038/sj.cdd.4401456
31. Chen H, Tan C, Wang Z, et al. Long-term glucocorticoid exposure persistently impairs CD4+ T cell biology by epigenetically modulating the mTORC1 pathway. Biochem Pharmacol. 2023;211:115503. doi:10.1016/j.bcp.2023.115503
32. Ronchetti S, Ricci E, Migliorati G, Gentili M, Riccardi C. How glucocorticoids affect the neutrophil life. Int J Mol Sci. 2018;19(12):4090.
33. Steyerberg EW, Vickers AJ, Cook NR, et al. Assessing the performance of prediction models: a framework for traditional and novel measures. Epidemiology. 2010;21(1):128–138. doi:10.1097/EDE.0b013e3181c30fb2
 © 2024 The Author(s). This work is published and licensed by Dove Medical Press Limited. The
full terms of this license are available at https://www.dovepress.com/terms
and incorporate the Creative Commons Attribution
- Non Commercial (unported, 3.0) License.
By accessing the work you hereby accept the Terms. Non-commercial uses of the work are permitted
without any further permission from Dove Medical Press Limited, provided the work is properly
attributed. For permission for commercial use of this work, please see paragraphs 4.2 and 5 of our Terms.
© 2024 The Author(s). This work is published and licensed by Dove Medical Press Limited. The
full terms of this license are available at https://www.dovepress.com/terms
and incorporate the Creative Commons Attribution
- Non Commercial (unported, 3.0) License.
By accessing the work you hereby accept the Terms. Non-commercial uses of the work are permitted
without any further permission from Dove Medical Press Limited, provided the work is properly
attributed. For permission for commercial use of this work, please see paragraphs 4.2 and 5 of our Terms.