Back to Journals » Nature and Science of Sleep » Volume 15
A Novel Clinical Tool to Detect Severe Obstructive Sleep Apnea
Authors Ye Y ![]() , Yan ZL
, Yan ZL ![]() , Huang Y, Li L
, Huang Y, Li L ![]() , Wang S, Huang X, Zhou J, Chen L, Ou CQ
, Wang S, Huang X, Zhou J, Chen L, Ou CQ ![]() , Chen H
, Chen H ![]()
Received 18 May 2023
Accepted for publication 29 September 2023
Published 17 October 2023 Volume 2023:15 Pages 839—850
DOI https://doi.org/10.2147/NSS.S418093
Checked for plagiarism Yes
Review by Single anonymous peer review
Peer reviewer comments 2
Editor who approved publication: Dr Sarah L Appleton
Yanqing Ye,1,2,* Ze-Lin Yan,3,* Yuanshou Huang,2,* Li Li,3 Shiming Wang,1 Xiaoxing Huang,1 Jingmeng Zhou,1 Liyi Chen,4 Chun-Quan Ou,3 Huaihong Chen1
1Department of Otorhinolaryngology-Head and Neck Surgery, Nan Fang Hospital, Southern Medical University, Guangzhou, People’s Republic of China; 2Otolaryngology Department, Foshan Nan Hai District People’s Hospital, Foshan, People’s Republic of China; 3State Key Laboratory of Organ Failure Research, Department of Biostatistics, Guangdong Provincial Key Laboratory of Tropical Disease Research, School of Public Health, Southern Medical University, Guangzhou, People’s Republic of China; 4Yidu Cloud Technology Ltd, Beijing, People’s Republic of China
*These authors contributed equally to this work
Correspondence: Huaihong Chen, Department of Otorhinolaryngology Head and Neck Surgery, Nan fang Hospital, Southern Medical University, 1838 Guangzhou Avenue, Bai-Yun District, Guangzhou, People’s Republic of China, Email [email protected] Chun-Quan Ou, Department of Biostatistics, Guangdong Provincial Key Laboratory of Tropical Disease Research, School of Public Health, Southern Medical University, 1838 Guangzhou Avenue, Bai-Yun District, Guangzhou, People’s Republic of China, Email [email protected]
Purpose: Obstructive sleep apnea (OSA) is a disease with high morbidity and is associated with adverse health outcomes. Screening potential severe OSA patients will improve the quality of patient management and prognosis, while the accuracy and feasibility of existing screening tools are not so satisfactory. The purpose of this study is to develop and validate a well-feasible clinical predictive model for screening potential severe OSA patients.
Patients and Methods: We performed a retrospective cohort study including 1920 adults with overnight polysomnography among which 979 cases were diagnosed with severe OSA. Based on demography, symptoms, and hematological data, a multivariate logistic regression model was constructed and cross-validated and then a nomogram was developed to identify severe OSA. Moreover, we compared the performance of our model with the most commonly used screening tool, Stop-Bang Questionnaire (SBQ), among patients who completed the questionnaires.
Results: Severe OSA was associated with male, BMI≥ 28 kg/m2, high blood pressure, choke, sleepiness, apnea, white blood cell count ≥ 9.5× 10⁹/L, hemoglobin ≥ 175g/L, triglycerides ≥ 1.7 mmol/L. The AUC of the final model was 0.76 (95% CI: 0.74– 0.78), with sensitivity and specificity under the optimal threshold selected by maximizing Youden Index of 73% and 66%. Among patients having the information of SBQ, the AUC of our model was statistically significantly greater than that of SBQ (0.78 vs 0.66, P = 0.002).
Conclusion: Based on common clinical examination of admission, we develop a novel model and a nomogram for identifying severe OSA from inpatient with suspected OSA, which provides physicians with a visual and easy-to-use tool for screening severe OSA.
Plain Language Summary: Question: How to build a more efficient screening model for severe OSA using some common variables for community physicians or non-sleep physicians?
Findings: It was found that severe OSA was associated with male, BMI≥ 28 kg/m2, high blood pressure, choke, sleepiness, apnea, white blood cell count ≥ 9.5× 10⁹/L, hemoglobin ≥ 175g/L, and triglycerides ≥ 1.7 mmol/L. The nomogram based on these variables was developed and validated. It seemed that our model outperformed the SBQ.
Meaning: A clinically easy-to-use nomogram was provided for the screening of severe OSA in both non-sleep departments and community hospitals.
Keywords: severe obstructive sleep apnea, clinical prediction model, nomogram
Introduction
Patients with obstructive sleep apnea hypopnea syndrome (OSA) usually have recurrent hypoxemia, hypercapnia and microarousal, which leads to sleep fragmentation, poor sleep quality. Severe OSA is defined as the Apnea Hypopnea Index (AHI)>30 events per hour, which is obtained by overnight polysomnography (PSG).1 It is estimated that 425 million patients are moderate to severe OSA.2 OSA leads to huge economic and social burden while most of these burdens are caused by severe OSA.3,4
Severe OSA brings several short- and long-term health consequences from perioperative complications to uncontrolled hypertension, stroke, fatal and nonfatal cardiovascular events, or even death.5–7 The intervention strength is quite different between mild, moderate and severe OSA according to most world-wide guidelines.8,9 Optimal blood pressure is difficult to control in patients with hypertensive severe OSA, and hypertension drug resistance rate is higher in the OSA population.10 Severe OSA patients complicated by atrial fibrillation (AF) have a poor response to antiarrhythmic drugs and a higher incidence of AF recurrence. At the same time, the prevalence of OSA is high in surgical population,11 but up to 80% of severe OSA patients may still not be diagnosed.12,13 They may have unplanned admission to the intensive care unit (ICU) and prolonged hospitalization,13 even a higher rate of postoperative reintubation.14
Therefore, the identification and treatment of high-risk patients with severe OSA in the surgical and non-surgical population may help to reduce medical expense and make individualized treatment.2,12
Although polysomnography (PSG) is the gold standard for the diagnosis of OSA, it is expensive and time consumption and the evaluation is mostly limited to large medical centers.15 Currently, the existing screening tools include Stop-Bang Questionnaire (SBQ), DES-OSA score, P-SAP score, Berlin questionnaire (BQ) and OSA50. Some symptom indicators in these screening tools are subjective and the measure of anthropometric indicators requires relative professionalism skill, leading to unsatisfied feasibility and prediction performance.16,17 The Epworth Sleepiness Scale (ESS) was originally designed to assess the risk of daytime sleepiness. Although the use of ESS is recommended, the predictive efficacy is low due to the lack of other relevant clinical indicators.18,19 The content of SBQ is based on OSA-related symptoms (ie snore, sleepiness, apnea, and hypertension) and clinical characteristics (ie body mass index, age, neck circumference, and gender).20 However, it is highly professional, and the neck circumference needs to be located by anatomical markers and measured by measuring tools, which will lead to measurement errors, and it is difficult to implement in all clinical departments.16
In addition, researchers had attempted to propose several other screening models based on small sample size. However, these models needed to measure with anthropometric indicators, upper airway pressure, nocturnal oximetry even and multivariate prediction rules developed by neural networks. All of them were difficult to be applied to non-sleep clinics.21–23 Several studies showed elevated levels of systemic mediators of inflammation in OSA patients, including inflammatory markers such as intercellular adhesion molecule, c-reactive protein (CRP),24 tumor necrosis factor (TNF),25 IL-1, and IL-6.25,26 But all these were inflammatory markers not routinely used in daily clinical practice. Nevertheless, the vast information contained in hematological indexes is ignored by all of the existing models. Therefore, our severe OSA model included blood routine and biochemical indexes on the basis of routine demography and main complaint.
In this study, we aimed to develop a novel screening tool to identify high-risk patients with severe OSA. Our tool was based on demography, symptoms, and routine hematological items, which were friendly to general practitioners or surgeons. Furthermore, the predictive performances were compared between our tool and the most common screening tool (SBQ).
Patients and Methods
Research Population
We enrolled adult patients who were admitted to Nan fang Hospital during the period from February 18, 2008, to January 21, 2019. All patients have undergone PSG due to suspected OSA. We used an intelligent database platform (Yi du Cloud Technology Ltd, Beijing, China) to identify patients eligible for this study. Data from the medical record system can be easily and safely exported to Microsoft Excel for next analysis. The patients were excluded if the important information of height, weight or AHI were missing due to the obstacles of data extraction in electronic medical system. We included several demographic indicators (age, sex, BMI, smoking and blood pressure), OSA-related symptoms and hematological indexes (blood routine, blood lipids and blood glucose). Blood was drawn from patients on an empty stomach for more than 8 hours and sent for examination in time. Patients with a stop Bang score of 0 to 2 can be classified as low-risk patients with moderate to severe OSA. People with a stop Bang score of 5 to 8 can be classified as high-risk groups of moderate to severe OSA. Patients with a stop Bang score of 3 or 4 belong to the potential risk group of moderate to severe OSA.20
Sleep Monitoring Method
The polysomnography monitoring device included electroencephalogram (EEG), electromyogram (EMG), electrocardiogram (ECG), thermistor and nasal pressure sensor for oral and nasal air flow, chest band and abdominal band for breathing, pulse oxygen saturation measurement, microphone for snoring collection and sensor for sleeping position. The airflow of oral and nasal breathing disappeared or weakened obviously during sleep, and the duration ≥10 seconds was defined as apnea. Hypopnea was defined as a decrease of more than 30% in oral and nasal air flow compared to the baseline level during sleep, accompanied by a decrease in blood oxygen saturation of more than 3% or with micro-arousal for a duration of ≥10 seconds. The apnea hypopnea index (AHI) was calculated by the ratio of apnea and hypopnea events to total sleep time. According to the guidelines by American Academy of Sleep Medicine,1 AHI > 30/h was considered to be severe OSA.
Statistical Analysis
All continuous variables were described by means and standard deviations (SD), and categorical variables were presented as counts and proportions. We compared means and proportions between groups by using Student’s t-test and Chi-Square test (or Fisher’s exact test if appropriate), respectively. A nomogram was developed to predict severe OSA using demographics, symptoms and hematological examination of the patients in 2008–2018 and was cross-validated using data in 2019. In details, the nomogram was developed in three steps: (1) Examining the exposure–response relationship between each continuous variable and severe OSA by using restricted cubic splines function in the univariate logistic regression.27,28 If the relationship curve is generally linear, we only considered linear effect by adding the linear term of the factor in the following analyses. Otherwise, the continuous variable was classified into a dummy variable (normal or abnormal) according to the reference value range. (2) Fitting a full model including all variables under study. The multicollinearity problem was examined using the generalized variance inflation factor (GVIF). The GVIF[1/(2×df)] for all variables in the model were less than 2.24 (ie, 5[1/2]).29 (3) Developing a stepwise regression model with a backward selection procedure to obtain a simplified model that corresponded to the smallest Akaike information criterion.30 (4) Constructing the nomogram based on the stepwise logistic regression model.
To evaluate the performance of the nomogram, we estimated the area under the receiver operator characteristic (ROC) curve (AUC).31 Besides, the performance was also validated with bootstrap resampling repeated 1000 times and temporal validation.28 Sensitivity, specificity and accuracy were calculated for the best cut-off values defined by maximum Youden index. The calibration was assessed by using a Hosmer–Lemeshow test and by comparing the predicted and observed probabilities of patients having severe OSA.32
Furthermore, the performance was compared with another commonly used screening questionnaire (SBQ) among the patients who completed these questionnaires. The AUC and sensitivity and specificity were compared using the DeLong test29 and McNemar χ2 test,33 respectively. After that, decision curve analysis (DCA) was used to assess the clinical utility of these screening tools.34 All statistical analysis was performed using R (version 4.1.1). A value of two-tailed P <0.05 was considered to be statistically significant.
Results
Study Flow
The flow chart of this study is shown in Figure 1. We extracted clinical data of 5215 hospitalized patients who have underwent polysomnography. Study subjects without documentation of height, weight, AHI in their electronic medical records were excluded. A total of 1920 eligible patients, among which 979 patients (50.98%) were severe OSA, were included in this study. The screening model was developed using the training dataset in 2008–2018 (n = 1647, 86%) and validated using the temporal validation dataset in 2019 (n = 273, 14%).
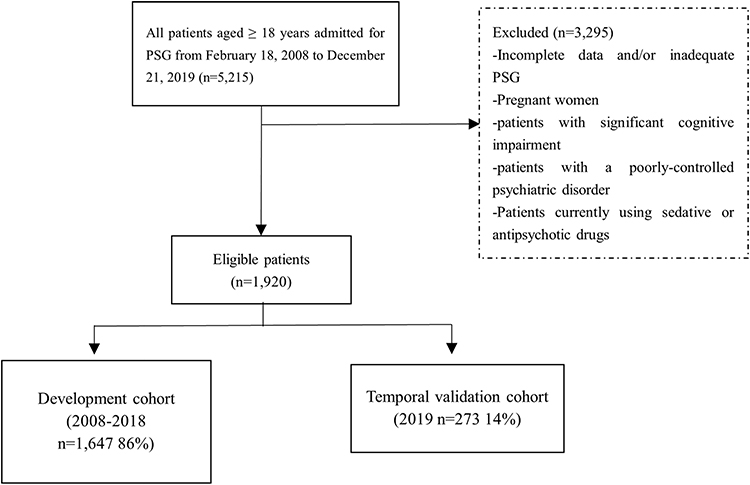 |
Figure 1 Study flow. Abbreviations: PSG, polysomnography; AHI, apnea-hypopnea index. |
Patient Characteristics
Table 1 presents the basic characteristics of the patients. Among 1920 patients, 85.8% were men and the average age was 49.67 years. Patients with BMI ≥28kg/m2 and hypertension accounted for 40.00% and 34.79%, respectively. Patients with severe OSA were younger, fatter, sleepier and had higher prevalence of smoking or hypertension than patients without severe OSA (P < 0.05).
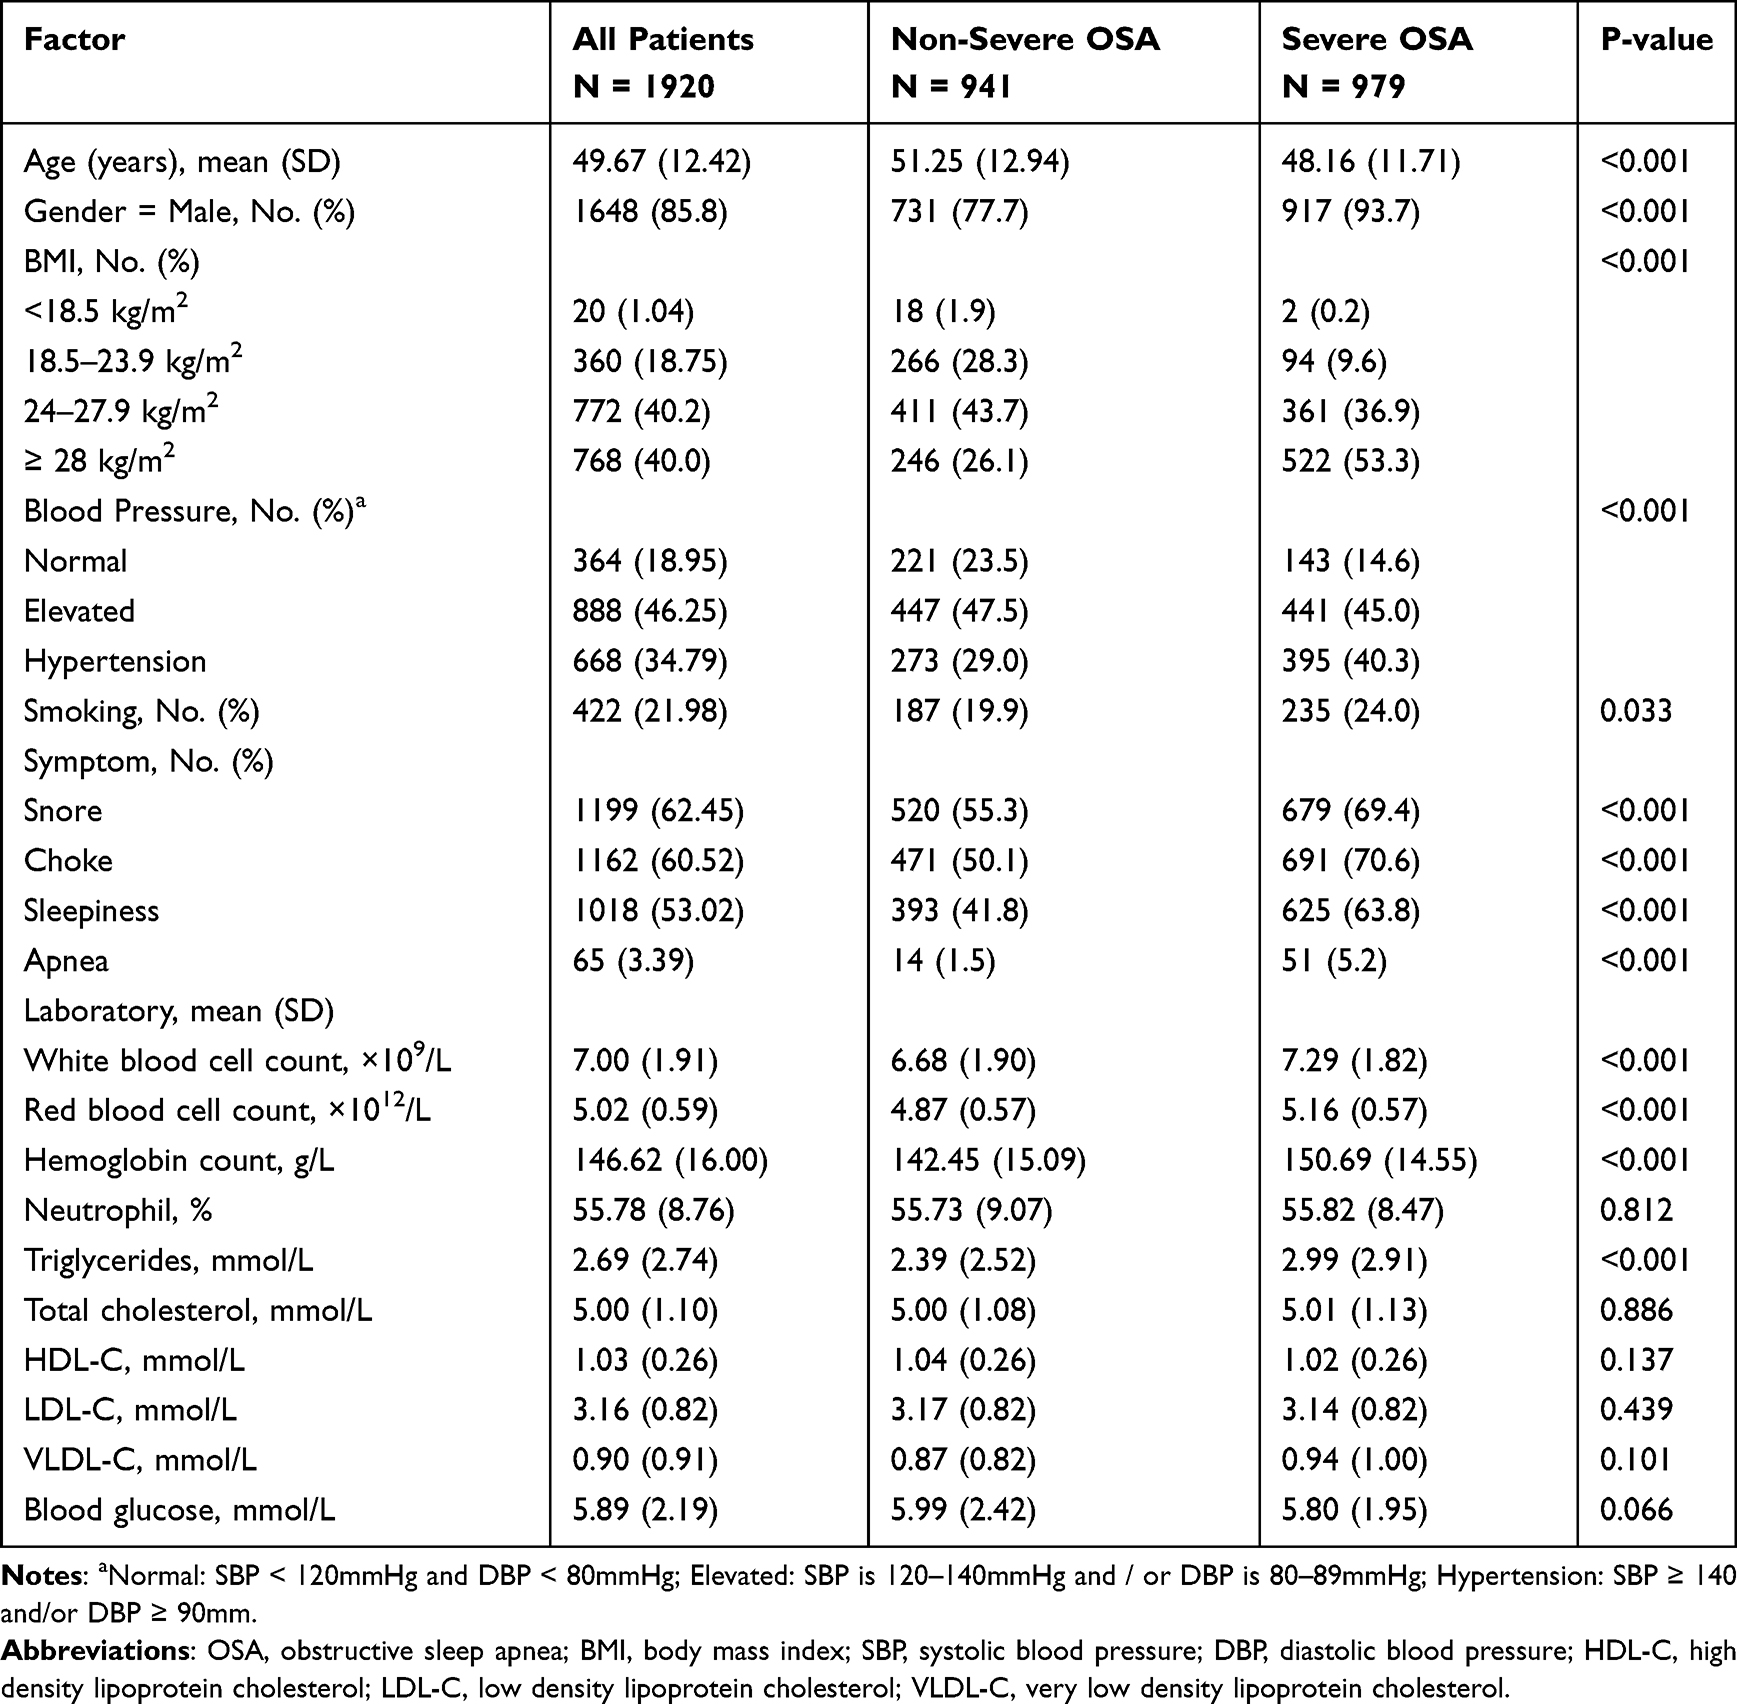 |
Table 1 Characteristics of Demographics, Symptoms and Laboratory Indexes for Patients with or without Severe OSA |
Model Development
In terms of the continuous variables, age, white blood cell count (WBC), red blood cells count (RBC), hemoglobin (Hb) and triglycerides (TG) showed a non-linear relationship with the patient’s risk of severe OSA (e Figure 1–e Figure 3), therefore they were converted into categorical variables in the multivariate analyses. The level of serum glucose and cholesterol shows general linear relationship with the risk of severe OSA.
The full model including all variables except total cholesterol, which was deleted because of its overhigh GVIF (e Table 1), and the stepwise model had very similar diagnostic accuracy (e Table 2). To simplify the model and facilitate its application, the stepwise model was recommended as the final model, including gender, BMI, blood pressure, choke, sleepiness, apnea, white blood cell count, hemoglobin content and triglyceride. We found some other potential predictors (white blood cell count, hemoglobin and triglyceride content) which have been previously neglected. In the final model (Table 2), white blood cell count ≥9.5×10⁹/L, hemoglobin content ≥175g/L and triglycerides count ≥1.7 mmol/L were significantly associated with an increased risk of severe OSA with an OR of 1.69 (95% CI: 1.12–2.54), 13.02 (95% CI: 1.66–102.28) and 1.48 (95% CI: 1.18–1.84), respectively. The risk of severe OSA in male was higher than that in female with an OR of 3.43 (95% CI: 2.31–5.09). The patients with BMI ≥ 28kg/m2, hypertension, choke, sleepiness and apnea were more likely to be severe OSA, with OR of 3.93 (95% CI: 2.85–5.44), 1.65 (95% CI: 1.20–2.27), 1.59 (95% CI: 1.24–2.05), 1.91 (95% CI: 1.50–2.45) and 4.51 (95% CI: 2.02–10.08), respectively.
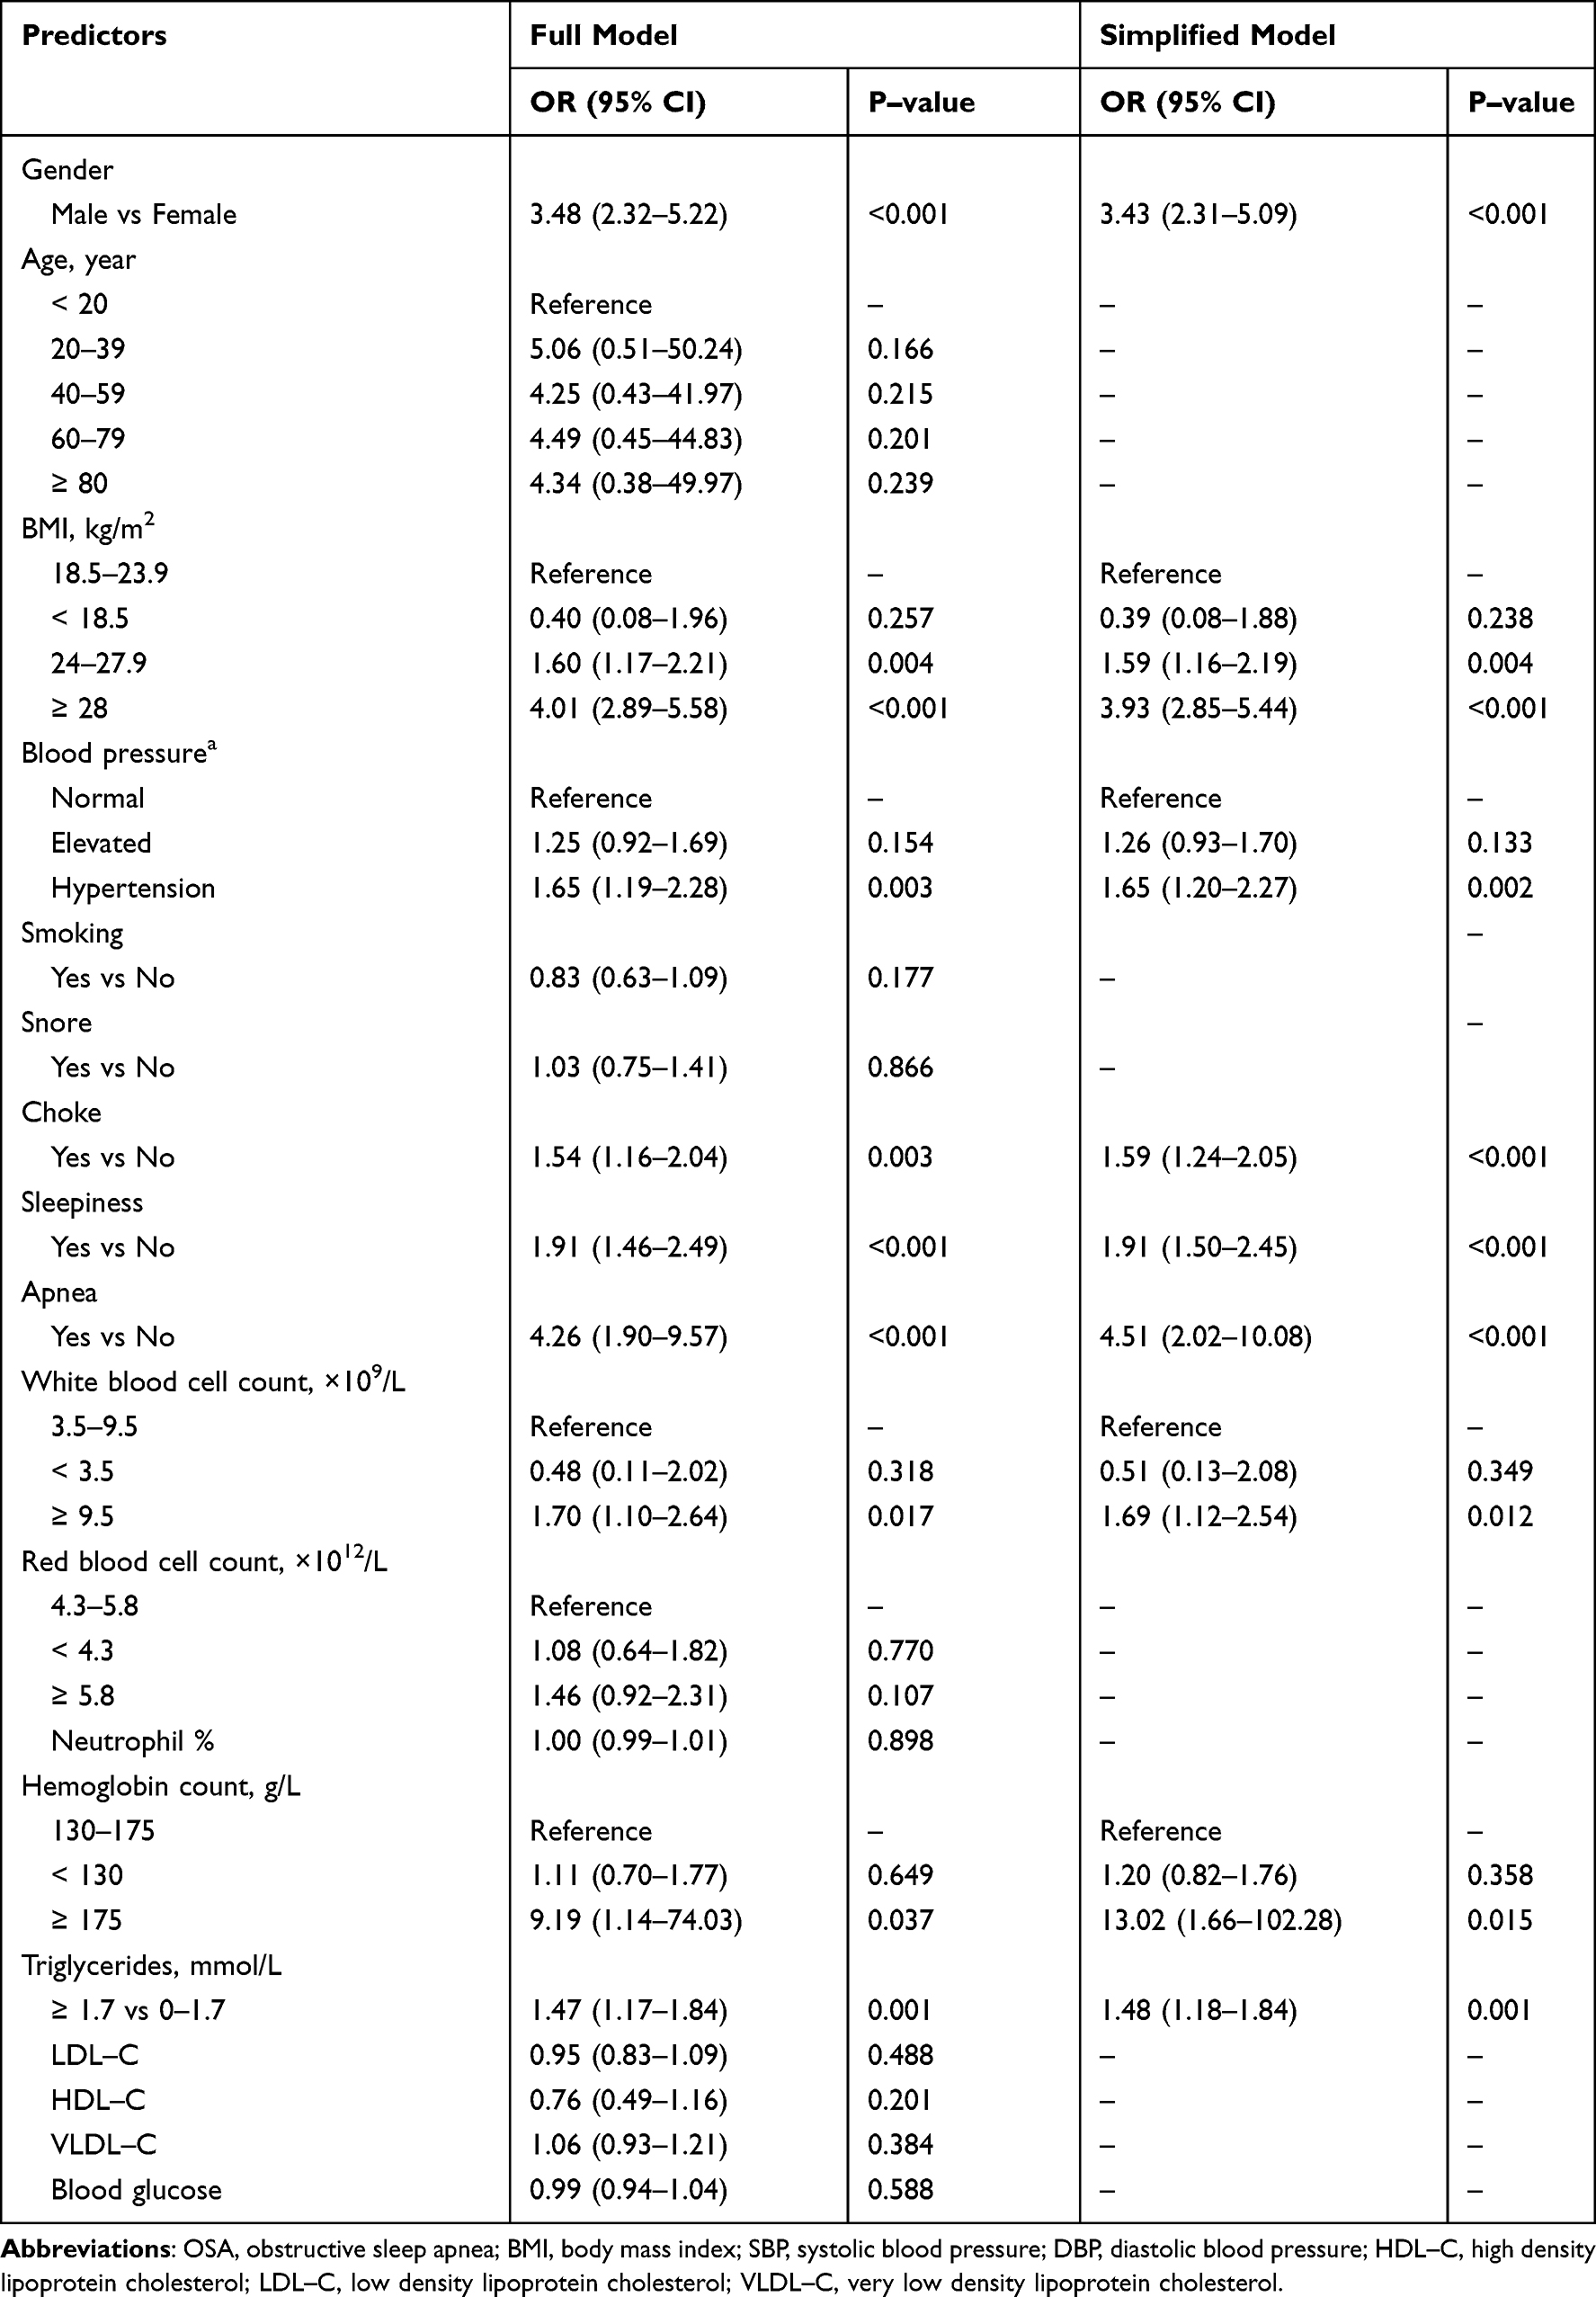 |
Table 2 Results of Multivariate Logistic Regression Models of Clinical Predictors for Severe OSA |
Based on the stepwise model, the nomogram is presented to provide a visualized easy-to-use tool for physicians (Figure 2). In the nomogram, each value of a variable corresponds to a score, and the corresponding scores for the nine variables included in the model can be summed to achieve a total score for an individual. The total score is then projected onto a total point scale to obtain the probability of severe OSA for any individual according to his or her profile.
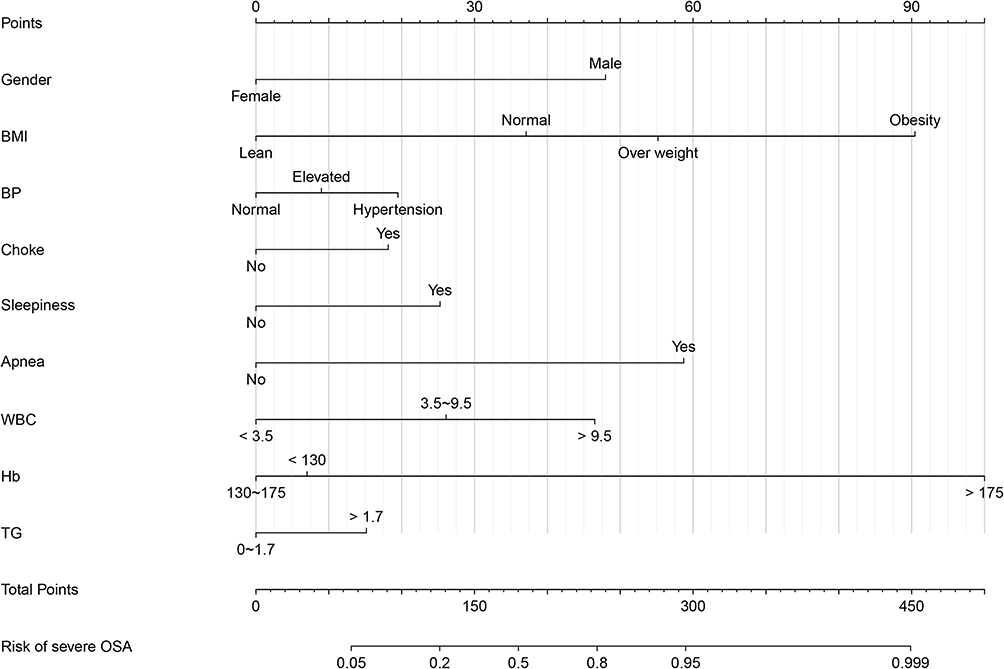 |
Figure 2 Nomogram of clinical predictive model for patients with severe OSA. Blood pressure (BP): Normal, SBP < 120mmHg and DBP < 80mmHg; Elevated, SBP is 120–140mmHg or DBP is 80–89mmHg; Hypertension, SBP ≥ 140 or DBP ≥ 90mmHg. BMI: Lean, < 18.5 kg/m2; Normal, 18.5 ~ 23.9 kg/m2; Over weight, 24 ~ 27.9 kg/m2; Obesity, ≥ 28 kg/m2. WBC = White blood cell count (×109/L); Hb, Hemoglobin (g/L); TG, Triglycerides (mmol/L). |
Model Validation
For the training dataset, the AUC for the final model was 0.76 (95% CI: 0.74–0.78). The sensitivity, specificity, positive predictive value, negative predictive value and accuracy were 73.46%, 66.00%, 69.43%, 70.29% and 69.82%, respectively (Table 3). The optimism-corrected AUC obtained from bootstrap resampling was 0.75 (e Figure 4), suggesting good internal validation. In addition, the Hosmer–Lemeshow test indicated that the model calibrated well (P = 0.880), and the calibration curve showed that the predicted probabilities of severe OSA risk in general agreed well with the observed probabilities (e Figure 5). For the validation dataset, the model also showed good performance with AUC of 0.75 (95% CI: 0.69–0.80). Visual inspection of the calibration plots showed good agreement between the model predicted probabilities of severe OSA and actual risk (e Figure 6) and the Hosmer–Lemeshow test indicated that the model calibrated well (P = 0.069).
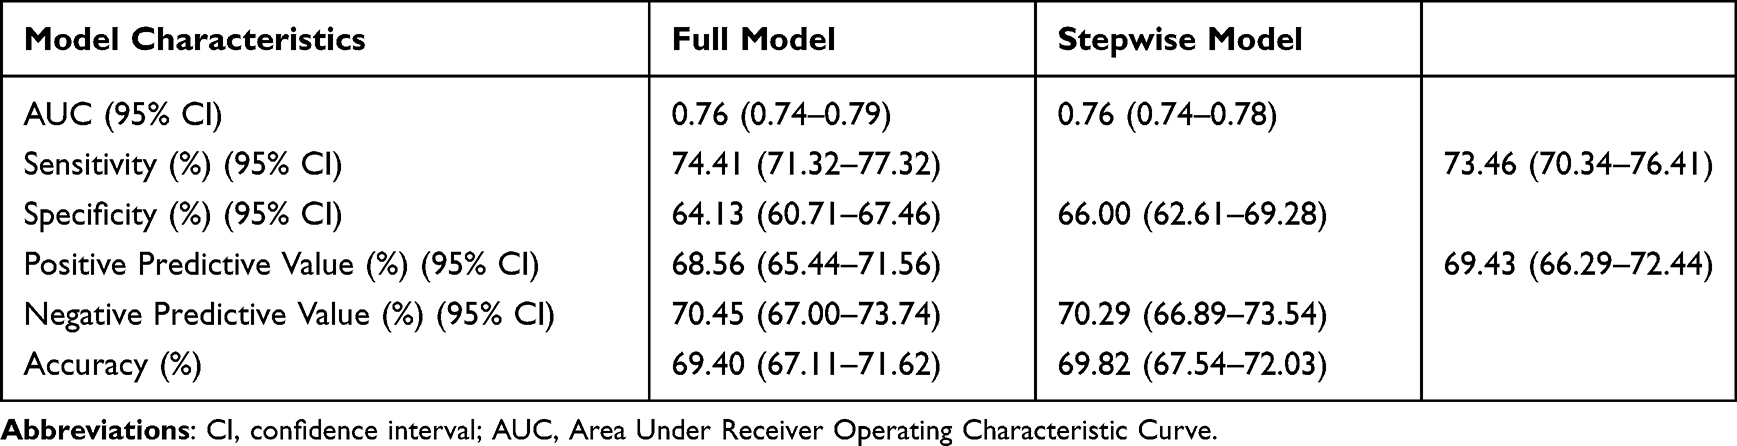 |
Table 3 Comparison of Diagnostic Accuracy in Full Model and Stepwise Model for Severe OSA |
Comparison with SBQ
Based on the data of 100 patients (56% were severe OSA) who had the information of Stop Bang, the AUC was 0.78 (95% CI: 0.69–0.87) for the new model and 0.66 (95% CI: 0.56–0.77) for the Stop Bang method (Figure 3 and Table 4). What’s more, for the optimal threshold, the specificity and accuracy of SBQ were 52.27% and 63.00%, respectively, relatively lower than our model (72.73% and 72.00%) while they have the same sensitivity (71.43%) (Table 4).
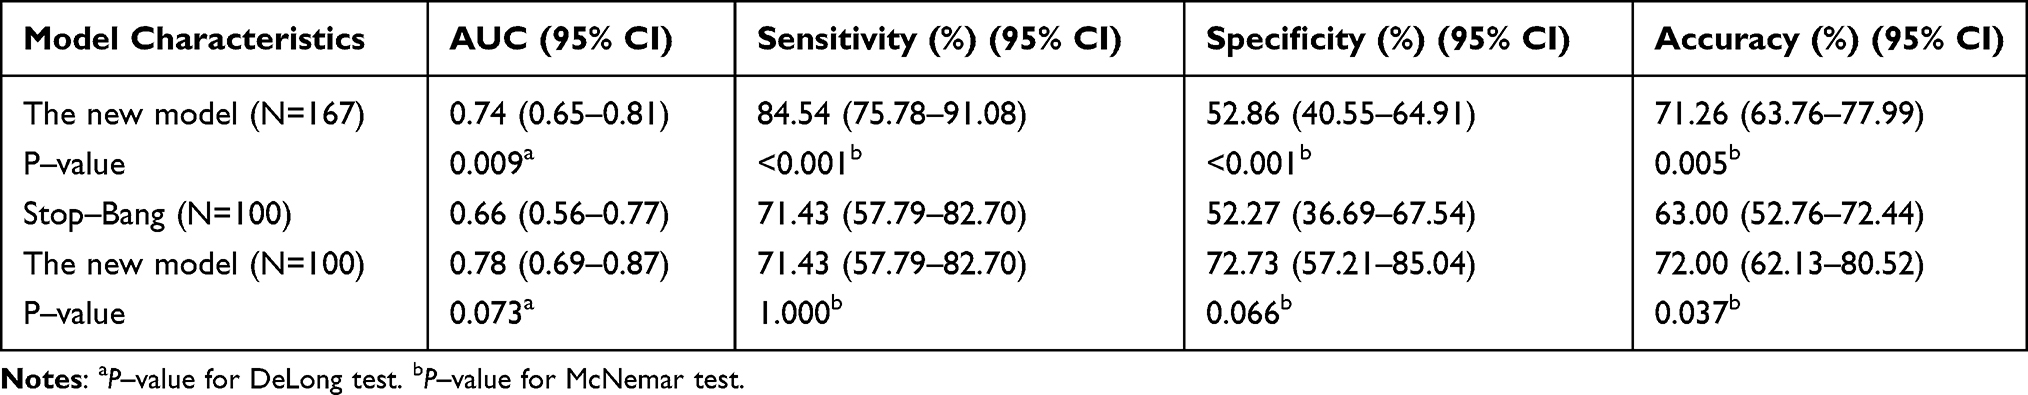 |
Table 4 Comparison of the Performance of Two Methods in Predicting Severe OSA |
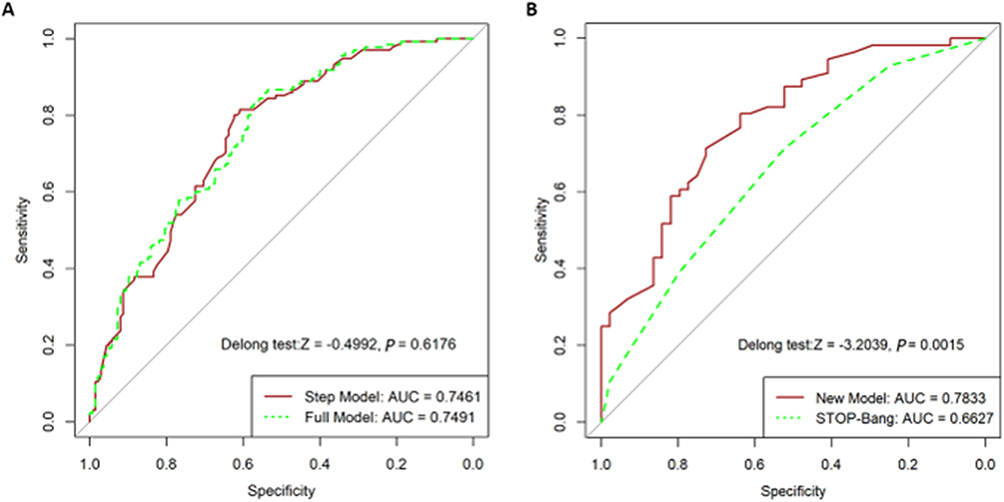 |
Figure 3 (A), Graph showing the receiver operating characteristic (ROC) curve of new model (ie, stepwise model) and full model based on the temporal validation dataset. (B), Graph showing ROC curve of new model and STOP-Bang based on the dataset of patients with STOP-Bang information. The statistics value and P-value of the DeLong test between two models in each graph are provided. Abbreviations: AUC, Area Under Receiver Operating Characteristic Curve; CI, confidence interval. |
In practice, SBQ is a five-level ordinal scale. When using a score of 1, 2, 3, 4, 5 as the thresholds, the specificity was 0.00%, 25.00%, 52.27%, 79.55% and 97.73% and the sensitivity was 100.00%, 92.86%, 71.43%, 39.29% and 10.71%, respectively. Assumed the same or a little bit higher specificity achieved (i.e 2.27%, 25.00%, 52.27%, 79.55% and 97.73%), our new model had a higher or the same sensitivity of 100.00%, 98.21%, 87.50%, 60.71% and 28.57%, respectively (e Table 2).
The DCA for the new model and SBQ based on corresponding population was also presented (e Figure 7). The results demonstrate that setting the threshold probability of a patient between 20% and 80% yields greater benefits when utilizing the new model compared to diagnosing severe OSA in all patients, none of the patients, or only those diagnosed positive with SBQ. These findings suggest that the new model provides higher net benefit across a reasonably wide range of threshold probabilities for predicting severe OSA, thus indicating its good clinical utility.
Discussion
We constructed a statistical model for predicting severe OSA based on 1920 hospitalized Chinese patients extracted from the hospital electronic medical record system with guaranteed data quality. Further, we provided a visual nomogram as an easy-to-use clinical screening tool accordingly. The nomogram requires only routinely collected information on admission (including gender, BMI, blood pressure, choke, sleepiness, apnea, WBC, hemoglobin, and triglyceride), but it still has a satisfactory performance in terms of discrimination, calibration and clinical utility. The sensitivity and specificity of our model were 73% and 66%, respectively, and the model outperformed SBQ.
Although many screening tools and predictive models had been developed to identify high-risk patients with severe OSA, most of them had low performance. A meta-analysis mentioned that the pooled specificity levels of Berlin questionnaire (BQ), SBQ, and STOP ranged 28%~38%, which were lower than our model, although the pooled sensitivity levels of these tools were higher (84%~93%).35 According to our result, the specificity and accuracy of SBQ were relatively lower than our model, but with higher sensitivity. The reason might be that Far-East Asian men were nonobese, despite the presence of severe OSA, which mean that Asian were more sensitive to BMI.36 Nevertheless, the measurement of neck circumference in SBQ also required certain skill.35 A relatively low specificity (36.2%) and high sensitivity (87.2%) were also reported for the American Society of Anesthesiologists checklist when applied in surgical patients in Canada.37 Questionnaires, scale and checklist mentioned above tend to have a low specificity and more non-severe OSA patients will be misdiagnosed,38 which means that the time-consuming and expensive PSG would be applied to a certain number of healthy patients when these tools are used. At the same time, it would further lead to a waste of medical resources and patients’ unwarranted panic and anxiety. Compared with these tools, our model has a relatively balanced sensitivity and specificity. Similarly, DES-OAS performed satisfactorily in differentiating between severe OSA and others, with a sensitivity and specificity of 89% and 65%, respectively among susceptible surgical patients in Belgium.39 However, most of the items in aforementioned questionnaires, scale, and checklist are not routinely obtained partially due to that it is difficult to collect the information during a hospital visit. (eg thyromental distance,40 thyroid-chin distance41) and some are subjective (eg degree of sleepiness,18 degree of snoring42), resulting in patients-report bias of the clinic sample. Besides, it takes time to complete such a file and therefore it might be inefficient to screen severe OSA using these tools, especially for urgent cases.
A limited number of studies used statistical methods to predict severe OSA with less information (and most of which are professional) as compared with the questionnaires, scale and checklist mentioned above. Huang et al applied a support vector machine (sensitivity: 70%, specificity: 70%) and a logistic regression model (sensitivity: 65%, specificity: 79%),43 while Amra et al used the decision tree algorithm to predict the severe OSA (sensitivity: 57%, specificity: 90%).44 The performance of these models is comparable to our nomogram. Nevertheless, these models require data which are not commonly collected during a consultation in most non-otolaryngology departments (such as neck circumference and waist circumference for the former and Mallampati indices for the later). Our model would be of more clinical significance in the screening of severe OSA, since all of the data needed are often obtained on admission.
To our knowledge, this is the first study using indices from routine blood tests for the screening of severe OSA. We found that patients with ≥9.5 ×10⁹/L WBC counts were more likely to be severe OSA compared with those with WBC counts ranging from 3.5 to 9.5 ×10⁹/L. Similarly, a study reported that the severity of OSA might be positively associated with WBC counts.45 In addition, our findings suggested that patients with a high level of hemoglobin (≥175 g/L) were at an elevated risk of severe OSA. Patients with severe OSA are chronically hypoxic. Hypoxia can induce inflammation and cause a compensatory increase in hemoglobin, therefore high levels of WBC and hemoglobin would be predictors of severe OSA.
Our results show that rising triglyceride to 1.7 mmol/L increases the risk of OSA. Previous studies have shown that OSA is independently associated with cardiovascular risk factors, such as hypertension and dyslipidemia.46 Consistent with previous studies, we observed that males, high BMI, high blood pressure, choke, sleepiness, and apnea were predictors of severe OSA.1
Our study had some limitations. First, although the data used in the article are retrospective data, and there are confounding factors and biases in the data. We collected data from 1920 patients, only 100 patients had the information of Stop-Bang. The relatively small sample size may explain the statistically non-significant difference between Stop-Bang and our model with the optimal thresholds. Nevertheless, in terms of point estimation of sensitivity, specificity and accuracy, our model is not inferior to SBQ, and has better clinical maneuverability. Besides, when the specificity of our model is equal to the specificity of 71.43% for SBQ, the sensitivity obtained is significantly higher than SBQ. Second, we did not perform external validation for the model since no data were available for such an assessment. However, we did attempt internal validation and temporal validation in an effort to prevent data overinterpretation, and the result suggested satisfactory validation of the model. Third, some factors that may be related to OSA have not been considered, such as cardiovascular disease and ethnic differences. In view of these limitations, further efforts in forward-looking and multicenter data collection are encouraged to demonstrate the robustness of nomogram.
Conclusion
To sum up, demographical characteristics and indices obtained from routine blood tests can be used for screening the severe OSA. Our findings have important implications for identifying the severe OSA and improving the prognosis of surgical patients. Further studies are warranted to detect more predictors of severe OSA and thereafter to improve the predictive power of the nomogram.
Abbreviations
OSA, obstructive sleep apnea; SBQ, Stop-Bang Questionnaire; BMI, body mass index; AUC, receiver operator characteristic curve; AHI, Apnea Hypopnea Index; PSG, polysomnography; AF, atrial fibrillation; ICU, intensive care unit; BQ, Berlin questionnaire; CRP, c-reactive protein; TNF, tumor necrosis factor; IL, Interleukin; EEG, electroencephalogram; EMG, electromyogram; ECG, electrocardiogram; SD, standard deviations; GVIF, generalized variance inflation factor; ROC, receiver operator characteristic; WBC, white blood cell count; RBC, red blood cells count; Hb, hemoglobin; TG, triglycerides; HBP, high blood pressure; OR, odds ratio; SBP, systolic blood pressure; DBP, diastolic blood pressure; HDL-C, high-density lipoprotein cholesterol; LDL-C, low-density lipoprotein cholesterol; VLDL-C, very low-density lipoprotein cholesterol; PPV, Positive Predictive Value; NPV, Negative Predictive Value; CI, confidence interval; TC, Total cholesterol; DCA, Decision curve analysis.
Ethics
The data obtained had been approved by ethics committee of Nanfang Hospital of Southern Medical University. Our original data originated from Yidu Cloud Technology database platform which cleaned the patient’s critical private information, such as name, gender and ID. Since we had no personal information about the study participants, it is impossible to obtain the informed consent of patients. We followed definitely the guidelines outlined in the Declaration of Helsinki.
Acknowledgments
We gratefully acknowledge the staff at Yidu Cloud Technology Ltd, Beijing, China for their assistance in data mining, extraction, and processing.
Disclosure
The authors report no conflicts of interest in this work.
References
1. Berry RB, Brooks R, Gamaldo C, et al. AASM scoring manual updates for 2017 (version 2.4). J Clin Sleep Med. 2017;13(05):665–666. doi:10.5664/jcsm.6576
2. Benjafield AV, Ayas NT, Eastwood PR, et al. Estimation of the global prevalence and burden of obstructive sleep apnoea: a literature-based analysis. Lancet Respir Med. 2019;7(8):687–698. doi:10.1016/S2213-2600(19)30198-5
3. Skaer TL, Sclar DA. Economic implications of sleep disorders. Pharmacoeconomics. 2010;28(11):1015–1023. doi:10.2165/11537390-000000000-00000
4. Tarasiuk A, Reuveni H. The economic impact of obstructive sleep apnea. Curr Opin Pulm Med. 2013;19(6):639–644. doi:10.1097/MCP.0b013e3283659e1e
5. Shafazand S. Guideline: insufficient evidence exists on screening for obstructive sleep apnea in asymptomatic adults. Ann Intern Med. 2017;166(10):C50. doi:10.7326/ACPJC-2017-166-10-050
6. Yaggi HK, Concato J, Kernan WN, et al. Obstructive sleep apnea as a risk factor for stroke and death. N Engl J Med. 2005;353(19):2034–2041. doi:10.1056/NEJMoa043104
7. Adderley NJ, Subramanian A, Toulis K, et al. Obstructive sleep apnea, a risk factor for cardiovascular and microvascular disease in patients with type 2 diabetes: findings from a population-based cohort study. Diabetes Care. 2020;43(8):1868–1877. doi:10.2337/dc19-2116
8. Randerath W, Bassetti CL, Bonsignore MR, et al. Challenges and perspectives in obstructive sleep apnoea: report by an ad hoc working group of the sleep disordered breathing group of the European Respiratory Society and the European Sleep Research Society. Eur Respir J. 2018;52(3):1702616. doi:10.1183/13993003.02616-2017
9. Lim DC, Pack AI. Obstructive sleep apnea: update and future. Annu Rev Med. 2017;68:99–112. doi:10.1146/annurev-med-042915-102623
10. Thunstrom E, Manhem K, Rosengren A, et al. Blood pressure response to losartan and continuous positive airway pressure in hypertension and obstructive sleep apnea. Am J Respir Crit Care Med. 2016;193(3):310–320. doi:10.1164/rccm.201505-0998OC
11. Chan MTV, Wang CY, Seet E, et al. Association of unrecognized obstructive sleep apnea with postoperative cardiovascular events in patients undergoing major noncardiac surgery. JAMA. 2019;321(18):1788. doi:10.1001/jama.2019.4783
12. Singh M, Liao P, Kobah S, et al. Proportion of surgical patients with undiagnosed obstructive sleep apnoea. Br J Anaesth. 2013;110(4):629–636. doi:10.1093/bja/aes465
13. Finkel KJ, Searleman AC, Tymkew H, et al. Prevalence of undiagnosed obstructive sleep apnea among adult surgical patients in an academic medical center. Sleep Med. 2009;10(7):753–758. doi:10.1016/j.sleep.2008.08.007
14. Kaw R, Chung F, Pasupuleti V, et al. Meta-analysis of the association between obstructive sleep apnoea and postoperative outcome. Br J Anaesth. 2012;109(6):897–906. doi:10.1093/bja/aes308
15. Gozal D. Serum, urine, and breath-related biomarkers in the diagnosis of obstructive sleep apnea in children: is it for real? Curr Opin Pulm Med. 2012;18(6):561–567. doi:10.1097/MCP.0b013e328358be2d
16. Deflandre E, Piette N, Bonhomme V, et al. Comparison of clinical scores in their ability to detect hypoxemic severe OSA patients. PLoS One. 2018;13(5):e196270. doi:10.1371/journal.pone.0196270
17. Senaratna CV, Perret JL, Lowe A, et al. Detecting sleep apnoea syndrome in primary care with screening questionnaires and the Epworth sleepiness scale. Med J Aust. 2019;211(2):65–70. doi:10.5694/mja2.50145
18. Johns MW. A new method for measuring daytime sleepiness: the Epworth sleepiness scale. Sleep. 1991;14(6):540. doi:10.1093/sleep/14.6.540
19. Luo J, Huang R, Zhong X, et al. STOP-Bang questionnaire is superior to Epworth sleepiness scales, Berlin questionnaire, and STOP questionnaire in screening obstructive sleep apnea hypopnea syndrome patients. Chin Med J Peking. 2014;127:3065–3070.
20. Chung F, Abdullah HR, Liao P. STOP-Bang questionnaire: a practical approach to screen for obstructive sleep apnea. Chest. 2016;149(3):631–638. doi:10.1378/chest.15-0903
21. Abrishami A, Khajehdehi A, Chung F. A systematic review of screening questionnaires for obstructive sleep apnea. Can J Anaesth. 2010;57(5):423–438. doi:10.1007/s12630-010-9280-x
22. Cheung K, Ishman SL, Benke JR, et al. Prediction of obstructive sleep apnea using visual photographic analysis. J Clin Anesth. 2016;32:40–46. doi:10.1016/j.jclinane.2015.12.020
23. Roche N, Herer B, Roig C, et al. Prospective testing of two models based on clinical and oximetric variables for prediction of obstructive sleep apnea. Chest. 2002;121(3):747–752. doi:10.1378/chest.121.3.747
24. Shamsuzzaman ASM, Winnicki M, Lanfranchi P, et al. Elevated C-reactive protein in patients with obstructive sleep apnea. Circulation. 2002;105(21):2462–2464. doi:10.1161/01.CIR.0000018948.95175.03
25. Minoguchi K, Tazaki T, Yokoe T, et al. Elevated production of tumor necrosis factor-alpha by monocytes in patients with obstructive sleep apnea syndrome. Chest. 2004;126(5):1473–1479. doi:10.1378/chest.126.5.1473
26. Roytblat L, Rachinsky M, Fisher A, et al. Raised interleukin-6 levels in obese patients. Obes Res. 2000;8(9):673–675. doi:10.1038/oby.2000.86
27. Tammemagi CM, Pinsky PF, Caporaso NE, et al. Lung cancer risk prediction: prostate, lung, colorectal and ovarian cancer screening trial models and validation. J Natl Cancer Inst. 2011;103(13):1058–1068. doi:10.1093/jnci/djr173
28. Steyerberg EW, Mushkudiani N, Perel P, et al. Predicting outcome after traumatic brain injury: development and international validation of prognostic scores based on admission characteristics. PLOS MED. 2008;5(8):e165, e165. doi:10.1371/journal.pmed.0050165
29. Snee R. ”Some aspects of nonorthogonal data analysis, part I. J Qual Technol. 1973;5(2):67–79. doi:10.1080/00224065.1973.11980577
30. Moons KG, Altman DG, Reitsma JB, et al. Transparent Reporting of a multivariable prediction model for Individual Prognosis or Diagnosis (TRIPOD): explanation and elaboration. Ann Intern Med. 2015;162(1):W1–W73. doi:10.7326/M14-0698
31. DeLong ER, DeLong DM, Clarke-Pearson DL. Comparing the areas under two or more correlated receiver operating characteristic curves: a nonparametric approach. Biometrics. 1988;44(3):837–845. doi:10.2307/2531595
32. Balachandran VP, Gonen M, Smith JJ, et al. Nomograms in oncology: more than meets the eye. Lancet Oncol. 2015;16(4):e173–e180. doi:10.1016/S1470-2045(14)71116-7
33. Trajman A, Luiz RR. McNemar chi2 test revisited: comparing sensitivity and specificity of diagnostic examinations. Scand J Clin Lab Invest. 2008;68(1):77–80. doi:10.1080/00365510701666031
34. Vickers AJ, Cronin AM, Elkin EB, et al.Extensions to decision curve analysis, a novel method for evaluating diagnostic tests, prediction models and molecular markers. BMC Med Inform Decis Mak. 2008;8:53. doi:10.1186/1472-6947-8-53
35. Chiu H, Chen P, Chuang L, et al. Diagnostic accuracy of the berlin questionnaire, STOP-Bang, STOP, and Epworth sleepiness scale in detecting obstructive sleep apnea: a bivariate meta-analysis. Sleep Med Rev. 2016;36:57–70. doi:10.1016/j.smrv.2016.10.004
36. Li KK, Kushida C, Powell NB, et al. Obstructive sleep apnea syndrome: a comparison between Far-East Asian and white men. Laryngoscope. 2000;110(10 Pt 1):1689–1693. doi:10.1097/00005537-200010000-00022
37. Chung F, Yegneswaran B, Liao P, et al. Validation of the berlin questionnaire and American society of anesthesiologists checklist as screening tools for obstructive sleep apnea in surgical patients. Anesthesiology. 2008;108:822–830. doi:10.1097/ALN.0b013e31816d91b5
38. Saldías PF, Gassmann PJ, Canelo LA, et al. Evaluación de los cuestionarios de sueño en la pesquisa de pacientes con síndrome de apneas obstructivas del sueño [Accuracy of sleep questionnaires for obstructive sleep apnea syndrome screening]. Rev Med Chil. 2018;146(10):1123–1134. Spanish. doi:10.4067/S0034-98872018001001123
39. Deflandre E, Degey S, Brichant J, et al. Pre-operative ability of clinical scores to predict obstructive Sleep Apnea (OSA) severity in susceptible surgical patients. Obes Surg. 2017;27(3):716–729. doi:10.1007/s11695-016-2352-4
40. Ramachandran SK, Kheterpal S, Consens F, et al. Derivation and validation of a simple perioperative sleep apnea prediction score. Anesth Analg. 2010;110(4):1007–1015. doi:10.1213/ANE.0b013e3181d489b0
41. Deflandre E, Degey S, Brichant J, et al. Development and validation of a morphologic obstructive sleep apnea prediction score. Anesth Analg. 2016;122(2):363–372. doi:10.1213/ANE.0000000000001089
42. Netzer NC, Stoohs RA, Netzer CM, et al. Using the Berlin Questionnaire to identify patients at risk for the sleep apnea syndrome. Ann Intern Med. 1999;131(7):485–491. doi:10.7326/0003-4819-131-7-199910050-00002
43. Huang W, Lee P, Liu Y, et al. Support vector machine prediction of obstructive sleep apnea in a large-scale Chinese clinical sample. Sleep. 2020;43(7). doi:10.1093/sleep/zsz295
44. Amra B, Pirpiran M, Soltaninejad F, et al. The prediction of obstructive sleep apnea severity based on anthropometric and Mallampati indices. J Res Med Sci. 2019;24(1):66. doi:10.4103/jrms.JRMS_653_18
45. Wu M, Zhou L, Zhu D, et al. Hematological indices as simple, inexpensive and practical severity markers of obstructive sleep apnea syndrome: a meta-analysis. J Thorac Dis. 2018;10(12):6509–6521. doi:10.21037/jtd.2018.10.105
46. Coughlin S. Obstructive sleep apnoea is independently associated with an increased prevalence of metabolic syndrome. Eur Heart J. 2004;25(9):735–741. doi:10.1016/j.ehj.2004.02.021
 © 2023 The Author(s). This work is published and licensed by Dove Medical Press Limited. The
full terms of this license are available at https://www.dovepress.com/terms
and incorporate the Creative Commons Attribution
- Non Commercial (unported, 3.0) License.
By accessing the work you hereby accept the Terms. Non-commercial uses of the work are permitted
without any further permission from Dove Medical Press Limited, provided the work is properly
attributed. For permission for commercial use of this work, please see paragraphs 4.2 and 5 of our Terms.
© 2023 The Author(s). This work is published and licensed by Dove Medical Press Limited. The
full terms of this license are available at https://www.dovepress.com/terms
and incorporate the Creative Commons Attribution
- Non Commercial (unported, 3.0) License.
By accessing the work you hereby accept the Terms. Non-commercial uses of the work are permitted
without any further permission from Dove Medical Press Limited, provided the work is properly
attributed. For permission for commercial use of this work, please see paragraphs 4.2 and 5 of our Terms.