Back to Journals » Cancer Management and Research » Volume 15
A Novel and Validated Inflammation-Based Prognosis Score (IBPS) Predicts Outcomes in Patients with Diffuse Large B-Cell Lymphoma
Authors Liu Y, Sheng L, Hua H, Zhou J, Zhao Y, Wang B ![]()
Received 10 February 2023
Accepted for publication 24 June 2023
Published 13 July 2023 Volume 2023:15 Pages 651—666
DOI https://doi.org/10.2147/CMAR.S408100
Checked for plagiarism Yes
Review by Single anonymous peer review
Peer reviewer comments 2
Editor who approved publication: Professor Kattesh Katti
Yajiao Liu,1,* Li Sheng,1,* Haiying Hua,1,2 Jingfen Zhou,1,2 Ying Zhao,2 Bei Wang3
1Wuxi School of Medicine, Jiangnan University, Wuxi, Jiangsu Province, 214000, People’s Republic of China; 2Department of Hematology, Affiliated Hospital of Jiangnan University, Wuxi, Jiangsu Province, 214000, People’s Republic of China; 3Institute of Integration of Traditional Chinese and Western Medicine, Affiliated Hospital of Jiangnan University, Wuxi, Jiangsu Province, People’s Republic of China
*These authors contributed equally to this work
Correspondence: Haiying Hua, Hematology Department, Affiliated Hospital of Jiangnan University, 1000 Hefeng Road, Binhu District, Wuxi, Jiangsu Province, 214000, People’s Republic of China, Tel +86 15301516125, Email [email protected]
Purpose: We aimed to create a novel prognostic score, the inflammation-based prognosis score (IBPS). In addition, we attempted to establish and validate a nomogram to predict the overall survival (OS) of patients with DLBCL.
Patients and Methods: We retrospectively investigated the data of 213 patients with DLBCL diagnosed and treated in the Affiliated Hospital of Jiangnan University and used these data to develop nomograms. At the same time, 89 patients diagnosed and treated in Wuxi People’s Hospital Affiliated with Nanjing Medical University from January 2015 to June 2021 were collected as an external validation cohort. We developed IBPS through the least absolute shrinkage and selection operator (LASSO) Cox regression. The univariate and multivariate Cox regression method was used to develop the nomogram. We used the concordance index (C-index), calibration chart, time-dependent receiver operating characteristic (ROC) analysis, decision curve analysis (DCA), and the Kaplan–Meier curve were used to assess the nomogram.
Results: The systemic immune inflammation index (SII), prognostic nutrition index (PNI), and modified Glasgow prognostic score (mGPS) were used to construct IBPS. The Eastern Cooperative Oncology Group performance status (ECOG PS), IBPS, response to treatment, and whether accept surgery were used to construct the nomogram to predict the OS of DLBCL patients. The C-index in the training and validation cohorts were 0.844 and 0.828, respectively. According to the time-dependent ROC curve and DCA, the nomogram has good predictive accuracy and clinical net benefit. The Kaplan–Meier curve showed that according to the nomogram score, patients in the training and validation cohorts could be classified into three risk groups.
Conclusion: In patients with DLBCL, baseline IBPS was a reliable predictor of OS. The survival probability of DLBCL patients can be precisely predicted using the prognosis nomogram based on IBPS.
Keywords: diffuse large B-cell lymphoma, inflammatory indicators, overall survival, prediction model
Corrigendum for this paper has been published.
Introduction
Diffuse large B-cell lymphoma (DLBCL) is a group of B cell-derived malignant tumors with obvious heterogeneity.1 After obtaining standardized treatment, a sizeable portion of DLBCL patients can be cured and survive for a long time. However, roughly one-third of DLBCL patients experience drug resistance and disease recurrence.2,3 Therefore, it is essential to identify high-risk patients as early as possible and develop and modify treatment plans as needed to maximize the survival benefits of patients.
The International Prognostic Index (IPI) is the most widely used predictive scoring system for DLBCL. The traditional IPI scoring system’s capacity to stratify the risk of DLBCL patients has decreased due to the shift in treatment modalities.4 The discussion of a new prognosis model of DLBCL has become one of the focuses of researchers. In the rituximab era, the accuracy and risk differentiation of DLBCL patients’ prognosis evaluation has been enhanced by the new prognostic evaluation system represented by National Comprehensive Cancer Network (NCCN)-IPI.5 However, the predictive factors of the new scoring system are still limited to the five clinical indicators of traditional IPI, and no new prognostic factors have been included; its guiding role in prognosis evaluation and individualized treatment of DLBCL patients still needs to be further strengthened. The prognosis of DLBCL patients can be impacted by various factors, including cell of origin,6 protein expression,7,8 gene mutation,9 and others, according to an increasing number of studies as genetics and molecular cell biology have advanced. However, these means often have a high price and technical threshold, and the feasibility of comprehensive implementation in actual clinical work still needs to be improved. Establishing a more accurate prognosis evaluation method that is appropriate for the era of rituximab and simple to use in clinical settings is therefore necessary.
In recent years, the relationship between inflammatory status and the occurrence and development of cancer has been the subject of many studies. Some peripheral blood parameters such as neutrophil-lymphocyte ratio (NLR), platelet lymphocyte ratio (PLR), monocyte lymphocyte ratio (LMR), systemic immune-inflammatory index (SII), systemic inflammatory response index (SIRI), prognostic nutritional index (PNI), modified Glasgow prognosis score (mGPS), the ratio of C-reactive protein to albumin (CAR) and the ratio of albumin to globulin (AGR) can reflect the baseline inflammatory status of cancer patients, and is a prognostic marker for overall survival (OS) rates of many cancers.10–13 However, in the published studies, the predictive value of all these variables based on inflammation for DLBCL patients has yet to be thoroughly evaluated. Considering that there is no fixed cut-off value for the above parameters, using only one parameter may not be reliable. Combining such indicators may be more beneficial than a single biomarker and offer more precise data for predicting survival. So, in this study, we sought to create a novel inflammation-based prognosis score (IBPS) system with multiple parameters and investigate its link to the survival outcome of DLBCL patients. Subsequently, we established a prediction model including IBPS and other relevant parameters, which may provide a reference for doctors to accurately estimate the survival probability of patients and timely adjust the treatment plan.
Materials and Methods
Patients
This retrospective study was conducted in two centers. 213 patients diagnosed as DLBCL in the Affiliated Hospital of Jiangnan University from January 2009 to December 2021 were used as training cohorts to develop the model. From January 2015 to December 2021, 89 DLBCL patients admitted by Wuxi People’s Hospital Affiliated with Nanjing Medical University were used as an external validation cohort. Inclusion criteria were as follows: (1) DLBCL was diagnosed according to typical immunophenotype and histological characteristics; (2) have not received any anti-tumor treatment in the past; (3) receive R-CHOP (rituximab plus cyclophosphamide, doxorubicin, vincristine, and prednisone) or R-CHOP-like chemotherapy for at least three cycles; and (4) all baseline laboratory examination data, clinical pathological records, and follow-up data are available. Exclusion criteria included: HIV-positive, acute or chronic inflammatory diseases, transformed inert lymphoma, primary central nervous system lymphoma, primary mediastinal large B-cell lymphoma, another tumor history, and incomplete baseline and follow-up data. This research conforms to the principles of the Helsinki Declaration and has been approved by the Ethics Committee of the Affiliated Hospital of Jiangnan University. Due to the study’s retrospective nature, patients’ written informed consent was exempted.
Data Collection
Collect relevant data of patients from the electronic medical record system. Including (1) Clinical indicators of patients: age, gender, Ann Arbor stage, B symptoms (presence of at least one of the following: night sweats, 10% weight loss over six months, recurrent fever [temperature: >38.3°C]), Eastern Cooperative Oncology Group Performance Status (ECOG PS), and the number and location of extranodal involvement; (2) Pathological data: cells of origin (COO), BCL-2, C-MYC, and Ki67. The cut-off values corresponding to BCL2, MYC, and Ki67 are 50%, 40%, and 90%, respectively. Two pathologists confirmed all histopathological sections. Immunohistochemical staining was used to classify germinal center B-cell-like (GCB) or non-GCB according to Hans standard; (3) Treatment-related factors: reaction to chemotherapy, whether to accept surgery, whether to accept radiotherapy. According to the international treatment evaluation standard of NHL, the response to chemotherapy can be divided into complete remission (CR), partial remission (PR), stable disease (SD), and progressive disease (PD). In this study, CR+PR was recorded as the remission group and SD+PD as the non-remission group; (4) Laboratory test results: serum lactate dehydrogenase (LDH) level, serum β2-microglobulin (β2-MG), globulin, albumin, C-reactive protein, platelet count, neutrophil count, lymphocyte count, monocyte count. Calculate relevant indicators NLR, PLR, LMR, CAR, AGR, SII, SIRI, PNI, and mGPS. Use the ROC curve to determine the cut-off values of each inflammatory indicator and β2-MG. The construction of each parameter and the corresponding cut-off value are shown in Table 1. Obtain follow-up information on patients by viewing their hospital visit records and calling their relatives or themselves. The study’s endpoint event was OS, defined as the time between disease diagnosis and death from any cause or final follow-up. The deadline for the last follow-up was June 30, 2022.
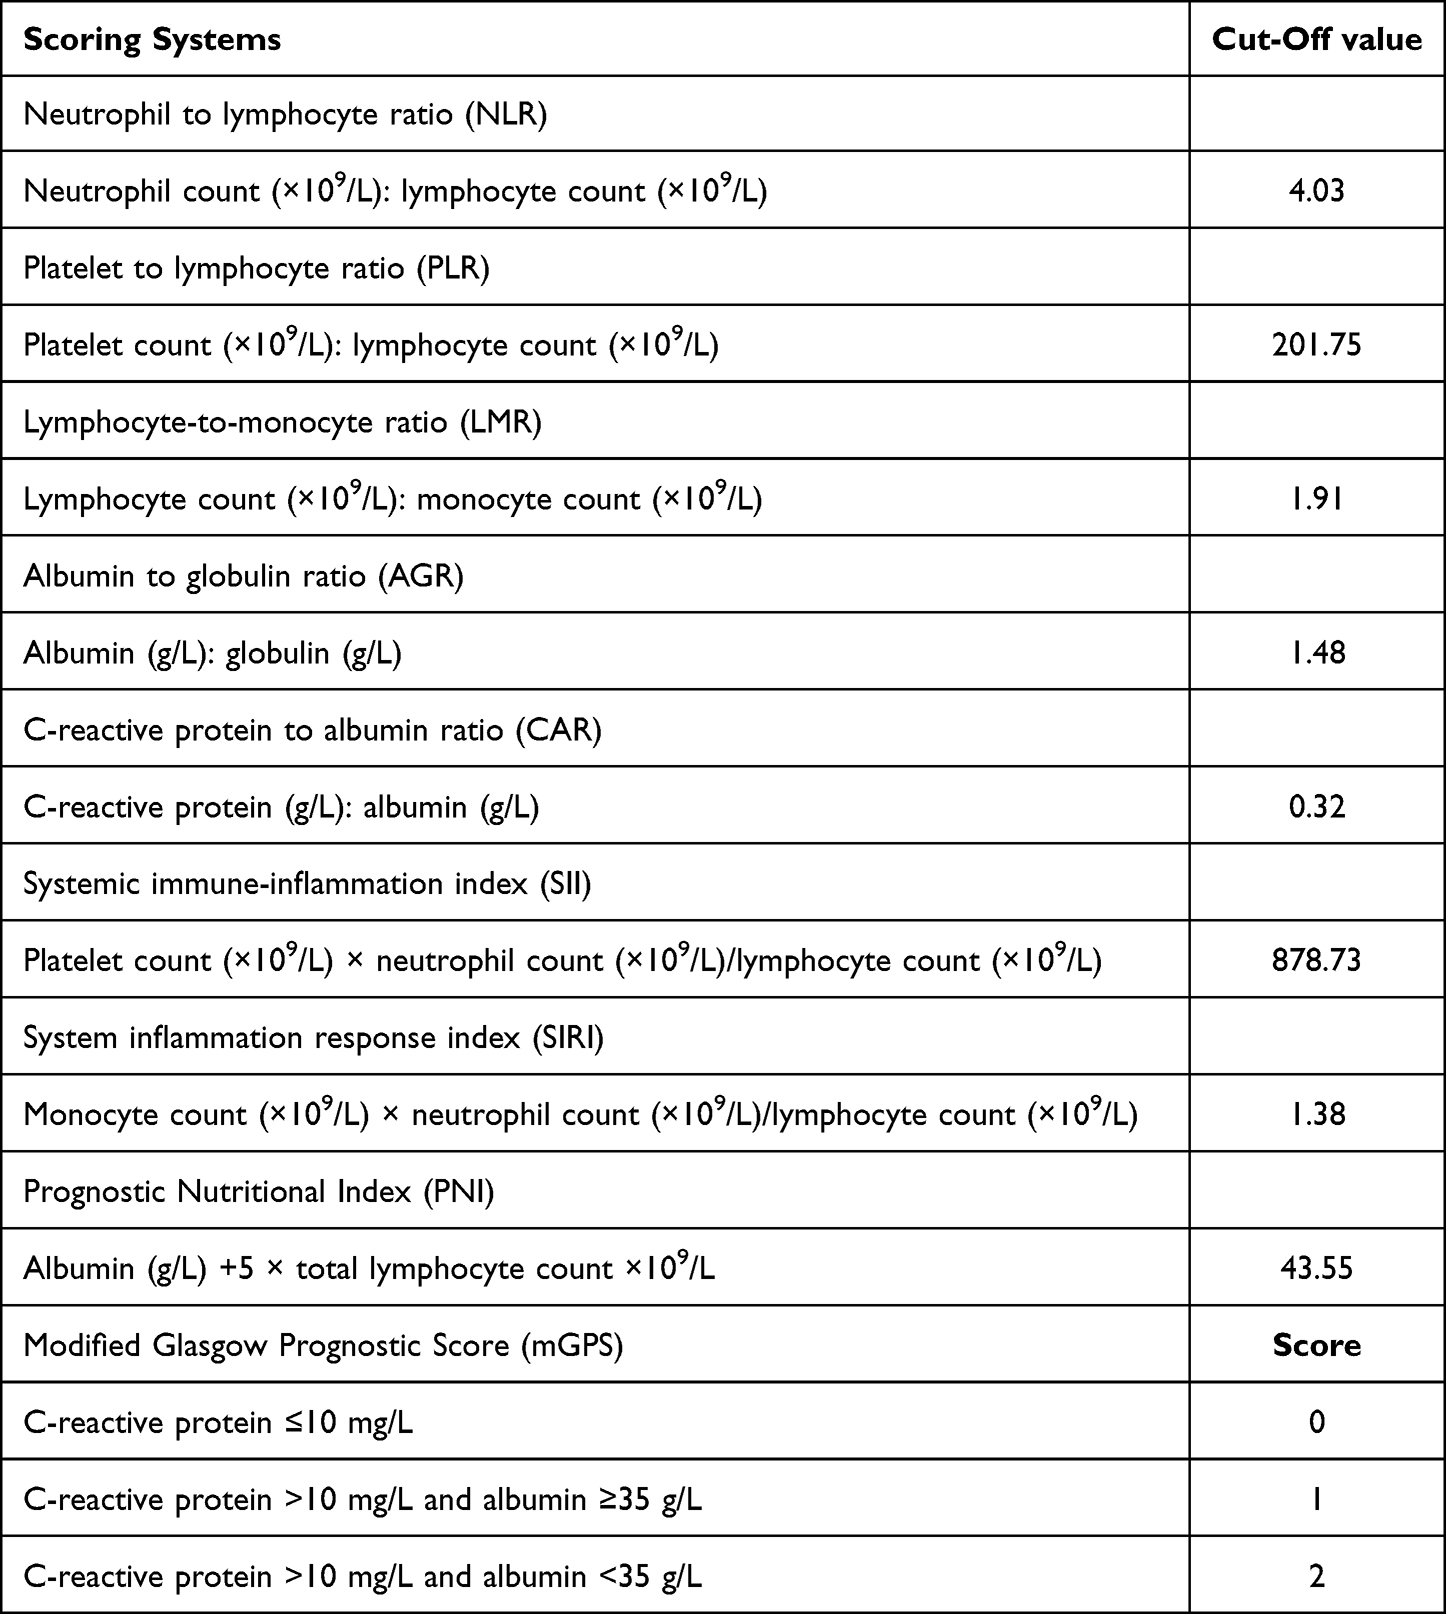 |
Table 1 Construction and an Optimal Cut-Off Value of Each Indicator |
Statistical Analysis
The receiver operating characteristic (ROC) curve was used to convert inflammation and nutrition indicators into classification variables to make the model more concise and easier to use. Classified variables were reported in frequency and percentage. The chi-square test or Fisher’s exact test was used to compare the variable distribution between the training and verification cohorts. The Spearman correlation coefficient was used to test the correlation between sequence variables. Considering the possibility of multicollinearity, we used the “glmnet” package of R software to run the least absolute shrinkage and selection operator (LASSO) analysis to screen the most valuable indicators among all candidate markers. After that, we construct the non-zero coefficient variable in LASSO analysis as a new IBPS. Subsequently, IBPS and other potential prognostic factors were input into the multivariate Cox regression model to select independent predictors further. Variables with P <0.05 were included in the nomogram. The “rms” package in R was used to prepare a nomogram to predict the OS rate in 1-, 3-, and 5-year. The Akaike information criterion (AIC) and Bayesian information criterion (BIC) were used to assess the model’s goodness of fit. The concordance index (C-index) and area under the ROC curve (AUC) were used to compare the performance of nomogram, IPI, and NCCN-IPI models. A calibration chart with 1000 bootstrap resamples was used to show the consistency between the predicted and actual survival probabilities. Decision curve analysis (DCA) was performed to study the clinical value of the nomogram. The X-tile software (version 3.3.1, Yale University, New Haven, CT, USA) was used to determine the optimal cut-off value of the nomogram score and divide the patients into low, medium, and high-risk groups. The Kaplan–Meier method was used to plot survival curves, which were then compared using the Log rank test. SPSS 25.0 (IBM, Chicago, IL, USA) and R software (version 4.1.3, http://www.Rproject.org) was used for statistical analysis.
Results
Patient Cohorts and Characteristics
302 DLBCL patients were enrolled in this study, including 213 in the training cohort and 89 in the external validation cohort. The median age of onset in the training cohort was 63 years old (interquartile range: 52–71 years old), 108 women (50.7%), and 106 patients (49.8%) were in the advanced stage; The median age in the validation cohort was 64 years (interquartile range: 54–72 years), 45 women (50.6%), and 51 patients (57.3%) were in an advanced stage. The median follow-up time for the training set was 46 months (range: 4–104 months), while the median follow-up time for the validation set was 39 months (range: 5–89 months). The baseline characteristics between the two groups are shown in Table 2.
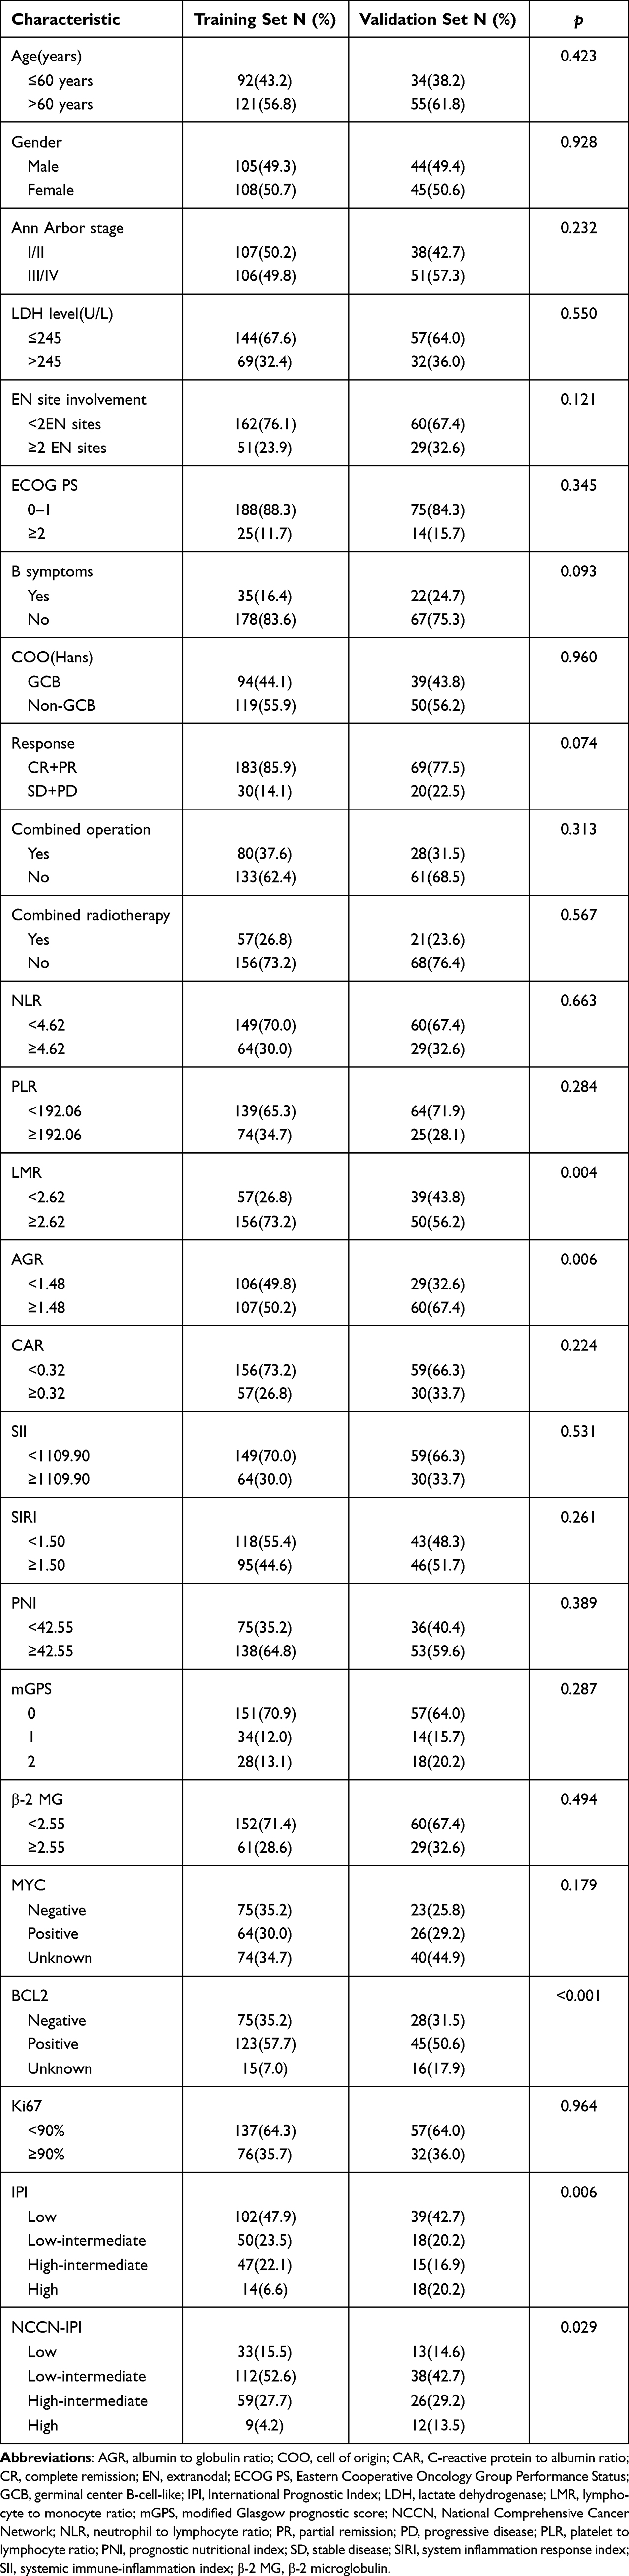 |
Table 2 Baseline Characteristics of Patients |
Construction of the IBPS
We constructed a correlation coefficient matrix. The correlation coefficient r ranges from - 1 to 1. The closer the absolute value is to 1, the stronger the correlation is. The correlation between variables is shown in Figure 1A. Considering the possible collinearity effect between variables, we use LASSO regression to select variables. When one standard error (1-SE) criterion was adopted, the optimal λ was 0.141. Three non-zero coefficient factors were determined through 10-fold cross-validation to prevent overfitting, namely SII, PNI, and mGPS (Figures 1B and C). Use these three variables to build a new scoring system, namely IBPS. When defining IBPS, we use the regression coefficient of variables in Cox regression analysis (β) and hazard ratio (HR). Due to HR and β Very similar, so we give the same weight to each factor in the new prognostic scoring model. The score of IBPS ranges from 0 to 3, and the scoring method is shown in Table 3. We have drawn Kaplan–Meier curves for each IBPS score in the training and verification sets (Supplementary Figure 1A and B). According to the trend shown by Kaplan–Meier curves, IBPS was divided into a high group (IBPS ≥ 2) and a low group (IBPS < 2). In the training set, the 3-year OS rates of high IBPS and low IBPS were 92.8% and 32.3%, respectively, and there was a significant difference between the two groups (Figure 1D, P <0.001); Similarly, in the validation set, the 3-year OS rates of high IBPS and low IBPS were 77.6% and 30.3%, respectively, and there was a significant difference between the two groups (Figure 1E, P <0.001).
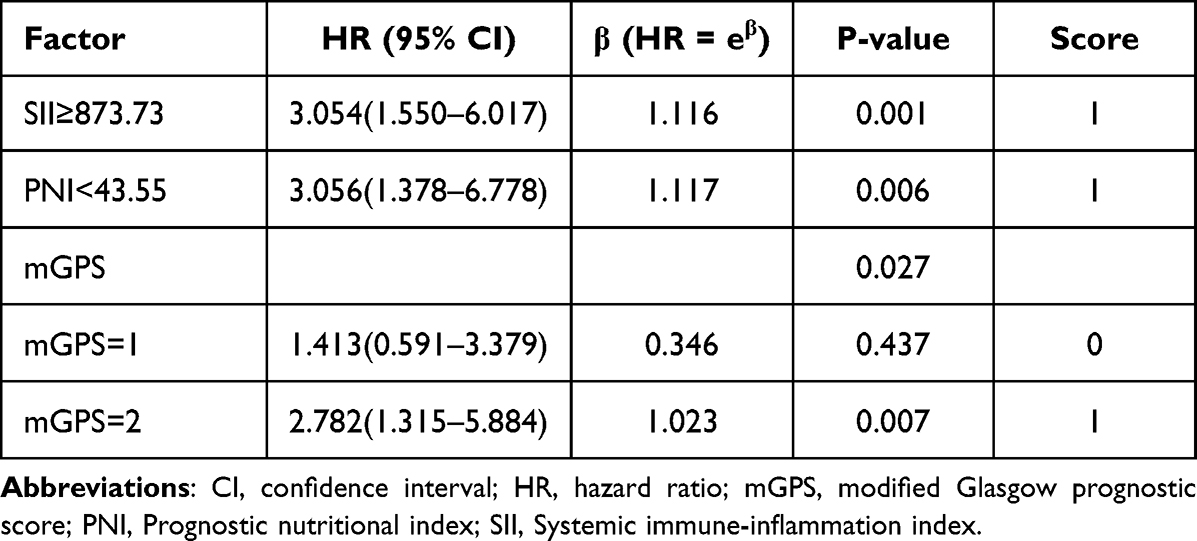 |
Table 3 Hazard Ratio (HR) and Regression Coefficient (β) of Each Index and Corresponding Score |
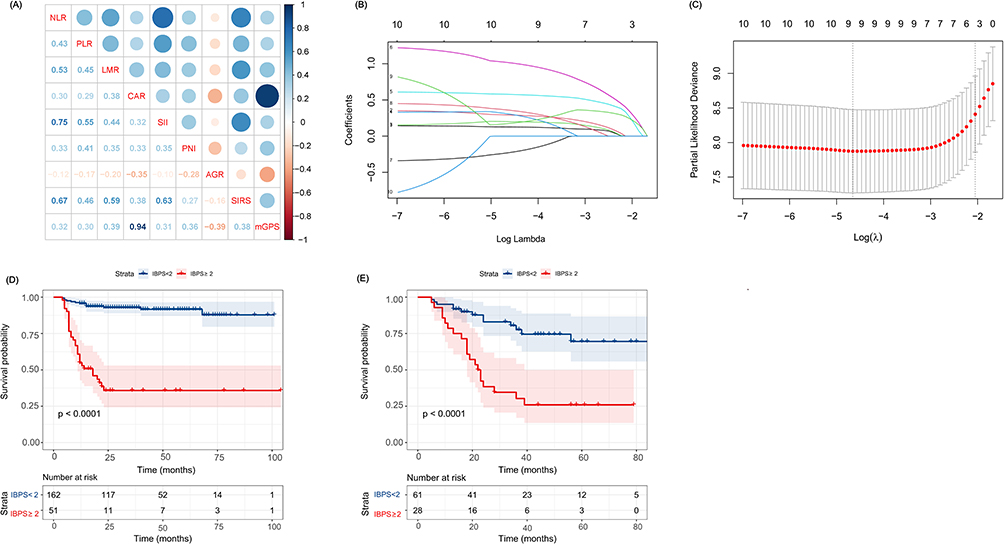 |
Figure 1 The least absolute shrinkage and selection operator (LASSO) Cox regression model was used to select the elements to build inflammation-based prognosis score (IBPS), and the Kaplan–Meier analysis was used to generate survival curves between different IBPS groups. (A) A correlation matrix with correlation coefficients from −1 (negative correlation; red) to 1 (positive correlation; blue). (B) The LASSO coefficient profiles of inflammatory biomarkers. (C) Tuning parameter (λ) selection cross-validation error curve. (D) Survival curves in the training cohort (E) Survival curves in the validation cohort. |
IBPS-Based Prediction Model Development
Independent prognostic factors affecting OS in DLBCL patients were screened by univariate and multivariate Cox regression. The results of univariate and multivariate Cox regression models in the training and validation cohorts are listed in Table 4. In univariate analysis, all significant factors related to OS (P<0.1) were included in multivariate analysis. In multivariate analysis, IBPS was still an independent indicator of OS in DLBCL patients (P<0.05) (Table 4). In addition, ECOG PS, response to chemotherapy, and whether combined with surgery were independent prognostic factors of OS. Based on the above four variables, a prognostic nomogram was established to predict OS in DLBCL patients at 1-, 3-, and 5 years (Figure 2). By adding the scores corresponding to each prognostic factor, the total score of each patient can be obtained on the total score line; Then, it was easy to find the corresponding 1-, 3-, and 5-year OS probabilities through the total score.
 |
Table 4 Univariate and Multivariate Analysis of the Training and Validation Cohorts |
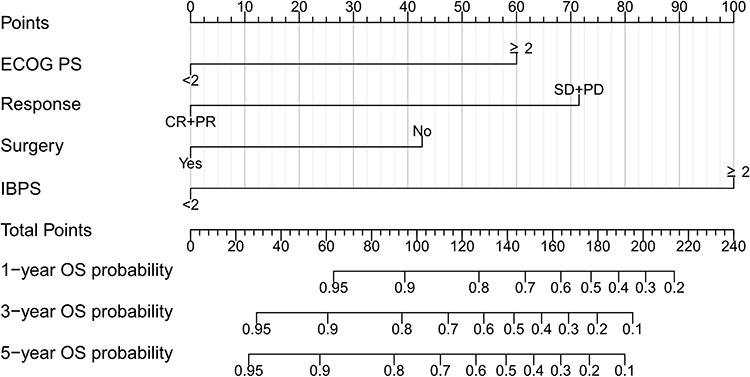 |
Figure 2 The nomogram for predicting the overall survival (OS) in patients with diffuse large B-cell lymphoma (DLBCL). The total points are calculated as the sum of the individual scores of each of the four variables included in the nomogram. |
Evaluation and Validation of Models
In the training cohort, the AIC and BIC were used to assess the nomogram’s goodness of fit. The AIC and BIC of the nomogram (AIC, 367.598; BIC, 374.743) were lower than the IPI (AIC, 429.736; BIC, 435.088) and NCCN-IPI (AIC, 422.580; BIC, 427.933), demonstrating that the nomogram’s goodness-of-fit was greater. The C-index of the nomogram model, IPI model, and NCCN-IPI model were 0.844, 0.704, and 0.723, respectively. The time-dependent ROC curve shows that the 1-, 3-, and 5-year AUCs of the nomogram model were 0.899 (95% CI: 0.834–0.964), 0.882 (95% CI: 0.814–0.950) and 0.879 (95% CI: 0.802–0.955) respectively, which was superior to IPI and NCCN-IPI (Figure 3A–C), indicating that the nomogram model has better prediction accuracy. The calibration curve of 1000 bootstrap resamples shows a good coincidence between the predicted probability and the actual probability of the nomogram model (Figure 4A–C), indicating that the model has a good calibration.
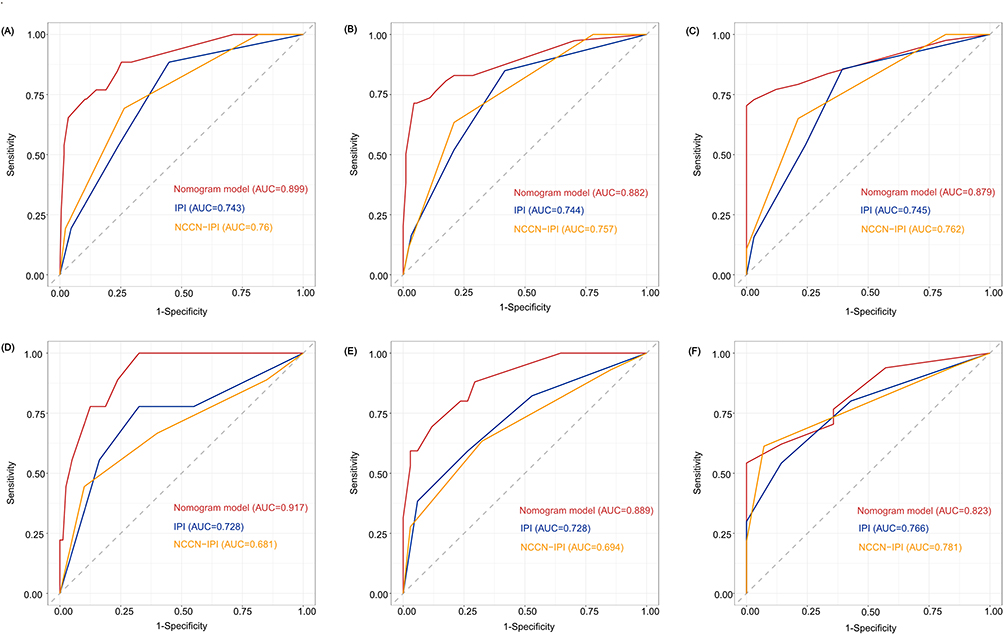 |
Figure 3 Receiver operating characteristic (ROC) verified the predictive value of nomogram, International Prognostic Index (IPI), and National Comprehensive Cancer Network (NCCN)-IPI in different sets. (A) ROC for 1-year OS in the training set; (B) ROC for 3-year OS in the training set; (C) ROC for 5-year OS in the training set; (D) ROC for 1-year OS in the validation set; (E) ROC for 3-year OS in the validation set; (F) ROC for 5-year OS in the validation set. |
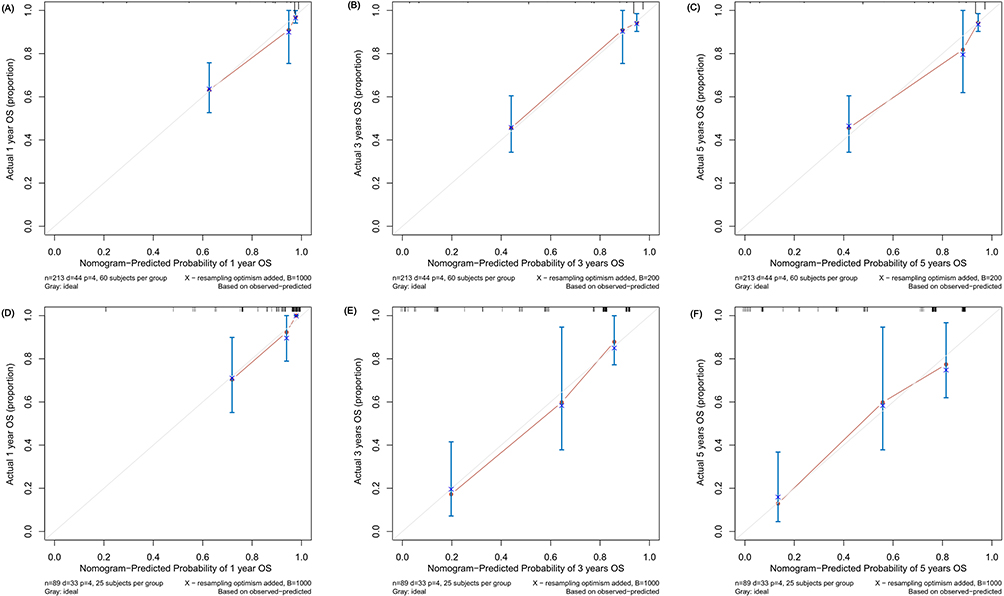 |
Figure 4 Calibration plot of the 1-, 3-, and 5-year OS nomogram in training and validation sets. (A) 1-year OS in the training set; (B) 3-year OS in the training set; (C) 5-year OS in the training set; (D) 1-year OS in the validation set; (E) 3-year OS in the validation set; (F) 5-year OS in the validation set. |
Another center collected 89 patients for external validation of the model. The AIC and BIC of the nomogram (AIC, 228.770; BIC, 234.756) were lower than the IPI (AIC, 258.008; BIC, 262.598) and NCCN-IPI (AIC, 259.223; BIC, 263.713). The C-index of the nomogram (0.778, 95% CI: 0.702–0.854) outperformed the IPI (0.711, 95% CI: 0.637–0.785) and NCCN-IPI (0.685, 95% CI: 0.599–0.771). The C-index of the nomogram in the validation cohort was 0.828, while the IPI and NCCN-IPI were 0.687 and 0.662, respectively. The 1-, 3-, and 5-year AUC of nomogram were 0.917 (95% CI: 0.846–0.989), 0.889 (95% CI: 0.811–0.966), and 0.823 (95% CI: 0.697–0.949) respectively, which was superior to IPI and NCCN-IPI (Figure 3D–F). Similarly, the calibration curve in the external validation cohort also shows good calibration (Figure 4D–F).
The Clinical Utility of the Nomogram
We used DCA to assess the net clinical benefit of the nomogram. In the training and validation cohorts, our nomogram showed better clinical net benefits than IPI and NCCN-IPI (Figures 5A and B). In the training cohort, according to the score of the nomogram, the best cut-off value was determined by using X-tile, and patients were divided into three risk groups: low-risk (0–60 points), medium-risk (61–115 points), and high-risk (>115 points). According to the Kaplan–Meier survival curve, the 3-year OS rates of the three risk groups were 93.8%, 64.1%, and 32.9%, respectively, and there was a significant difference between the three groups (P<0.001, Figure 5C). Similarly, in the validation cohort, the 3-year OS of the three risk groups were 86.3%, 57.1%, and 14.7%, respectively, with significant differences among the three groups (P<0.001, Figure 5D).
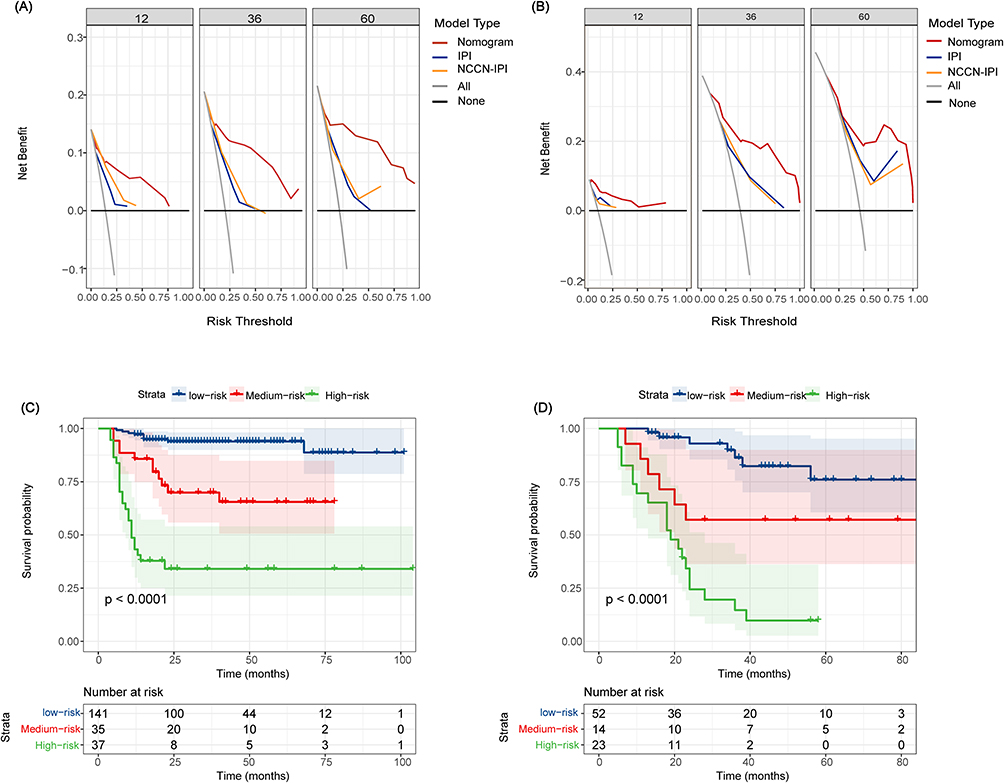 |
Figure 5 Clinical net benefits and risk stratification of nomogram. (A) Net benefit curves based on nomogram as compared with IPI and NCCN-IPI model in the training set; (B) Net benefit curves based on nomogram as compared with IPI and NCCN-IPI model in the validation set; (C) The survival curves for OS based on the prediction of nomogram in the training set; (D) The survival curves for OS based on the prediction of nomogram in the validation set. |
To further evaluate the prognostic ability of the nomogram model for patients with different clinicopathological characteristics, we conducted a subgroup analysis of patients. MYC ≥ 40% and BCL2 ≥ 50% were defined as high expression. If MYC ≥ 40% and BCL2 ≥ 50%, it was defined as a double expression of MYC/BCL2. In the training cohort, the Kaplan–Meier analysis found that the nomogram model could re-stratify the prognosis of DLBCL patients with age>60 years, Annapolis III–IV, LDH>245U/L, MYC ≥ 40%, BCL2 ≥ 50% and double expression of MYC/BCL2 (P<0.05, Figure 6A–F). The validation cohort also found that the nomogram model had excellent stratification ability for these patients (P < 0.05, Supplementary Figure 2A–F).
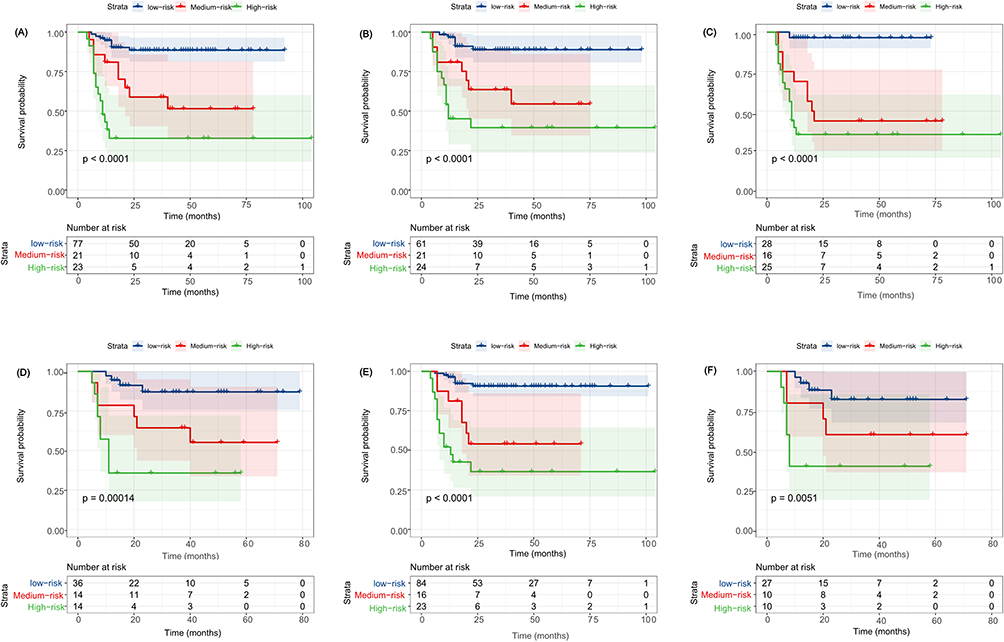 |
Figure 6 Kaplan–Meier curve of OS of DLBCL patients in different subgroups stratified according to risk stratification system in the training cohort. (A) OS of age >60; (B) OS of Ann Arbor Stage III/IV; (C) OS of LDH≥ 245U/L; (D) OS of BCL2 ≥50%; (E) OS of MYC ≥40%; (F) OS of MYC ≥40% and BCL2 ≥50%. |
Discussion
In conclusion, we created a new nutrition-inflammation prognosis scoring system INPS by combining baseline SII, PNI, and GPS and validated its accuracy in predicting the prognosis of DLBCL patients. The univariate and multivariate Cox regression analysis revealed that a higher INPS score was associated with shorter overall survival of DLBCL patients. Subsequently, we integrated INPS with other critical clinical variables with statistical significance in multivariate Cox analysis (ECOG PS, response to chemotherapy, whether combined with surgery) and established a nomogram for predicting DLBCL patients’ 1-, 3-, and 5-year OS. The results showed that compared with the IPI model and NCCN-IPI model, the prediction accuracy of the nomogram model was significantly increased.
Some hematological parameters reflecting systemic inflammatory status are common indicators to predict DLBCL patient survival rate, with NLR, PLR, and LMR being the most commonly used. However, the prognostic value of some newer inflammatory scores (such as SII, PNI, and mGPS) has not been fully explored. Two recent studies indicated that SII could predict the prognosis of DLBCL patients more accurately than traditional inflammatory indicators (such as NLR, PLR, and LMR).14,15 PNI is also thought to be a prognostic factor for DLBCL patients. PNI is an independent predictor of DLBCL patients, according to Shen et al,16 and can be used to stratify the prognosis of patients with distinct clinicopathologic groupings. He et al17 discovered that the accuracy of the new scoring system composed of PNI is better than that of NCCN-IPI. This suggests that PNI could be a strong predictor as well. Furthermore, mGPS is also thought to be a reliable prognostic indicator, which can predict the OS of DLBCL patients.18 Although some studies have validated these indicators’ prognostic significance, the predictive efficacy of a single hematological indicator may be limited. For example, in the study of Wang et al14 and Wu et al,15 high SII is an independent predictor of DLBCL patient prognosis; however, in the study of Liu et al,19 only PNI is an independent predictor of DLBCL patient prognosis, while SII is not. This could be because the cut-off value of each biomarker varies substantially between research. To decrease these disparities, we developed a novel prognostic scoring method that combines three biomarkers to provide more accurate and reliable stratification. To avoid the influence of multicollinearity across variables in this study, we used LASSO Cox regression analysis to screen out the most valuable indicators. Then, we compute each indicator’s regression coefficient and Hazard Ratio and assign matching values based on the regression coefficient and risk ratio. The Kaplan–Meier survival curve of OS demonstrates that the new scoring system may accurately predict patient prognosis.
Increasingly more evidence suggests that the tumor microenvironment and host immunity play a crucial role in lymphoma progression. As a mediator of inflammatory reaction, inflammatory cells play an essential role in the tumor microenvironment. Systemic inflammation promotes the occurrence and progression of cancer through genetic toxicity, cell transformation, proliferation, invasion, and metastasis.20,21 The blood cell count in the IBPS scoring system includes lymphocyte count, neutrophil count, platelet count, serum albumin level, and C-reactive protein level. The infiltration of neutrophils around the tumor can release metalloproteinases to promote angiogenesis and inhibit the anti-tumor response of CD8+T lymphocytes to promote tumor proliferation.22–24 On the contrary, lymphocytes play an essential role in tumor-related immunity.25 They have a strong anti-tumor immune function and can inhibit the progress of tumors.26,27 Platelets can regulate tumor angiogenesis and promote tumor growth by transporting and releasing vascular endothelial growth factor (VEGF).28 In addition, platelets can also help tumor cells escape immune elimination and promote tumor growth and metastasis.29 The decrease in serum albumin level indicates that there may be cancer-related inflammation and reflects malnutrition or cachexia caused by tumor progression.30 C-reactive protein is a marker of acute inflammation. Interleukin (IL) - 6 enhances the ability of the liver to synthesize C-reactive protein. IL-6 can promote the inflammatory signal transduction of cancer, thus maintaining and activating the proliferative activity of cancer.31 These mechanisms explain why these blood cell counts can become important biomarkers for predicting cancer prognosis.
In addition to inflammatory markers, ECOG PS and response to chemotherapy have also been found to be prognostic factors for patients in both the training and validation cohorts, and surgery was a prognostic factor for patients in the training cohort, but not in the validation cohort. The ECOG PS is a significant component of the IPI score and a prognostic assessment factor for patients with DLBCL. Patients with high ECOG PS scores have poor health and often fail to tolerate chemotherapy responses, resulting in a poor prognosis. This study demonstrates that ECOG PS and response to chemotherapy are independent prognostic factors for DLBCL patients, which is consistent with prior research findings.32,33 With the application of the targeted anti-tumor drug Rituximab, the remission rate and cure rate of Diffuse large B-cell lymphoma have improved. The goal of DLBCL treatment is to obtain CR to obtain long-term survival. Patients who have achieved complete remission in first-line treatment are more likely to achieve the ultimate clinical cure. Multiple studies have also confirmed that patients who achieve complete remission have a better prognosis.34,35 For patients with large tumors at initial diagnosis, especially in the early stages, surgical resection of the tumor to reduce tumor burden and adjuvant chemotherapy can improve patient survival.36 For patients who are resistant to chemotherapy, surgery may be the main treatment method.37 For patients who are not suitable for Rituximab treatment, radical surgery and the combined use of clinical and pathological staging systems have been found to help predict disease outcomes in patients with DLBCL.38 However, some studies have shown that surgical treatment has not significantly benefited the survival of DLBCL patients,39,40 and the therapeutic effect of surgery on DLBCL is highly controversial, and further exploration is needed in the future.
Some nomogram models based on genomes and radionics features have been developed to assess the prognosis of DLBCL patients.41,42 Our predictive model was more straightforward and less expensive than these methods. At the same time, the nomogram model we developed was accurate. The nomogram’s C-index in the training cohort was 0.844, and 0.828 in the validation cohort. Furthermore, the ROC curve demonstrates that our prognostic model outperforms the IPI and NCCN-IPI models in training and validation cohorts. Patients were well categorized into three risk categories based on the nomogram score. Furthermore, the findings of subgroup analysis of patients with diverse clinical and pathological characteristics reveal that the nomogram model still performs well in terms of prediction. These findings suggest that our IBPS-based prediction nomogram may be an excellent addition to the traditional prognosis model and might assist clinicians in further directing treatment. For example, routine therapy should be given in instances with a favorable prognosis to minimize unpleasant effects induced by over-treatment. To enhance patient survival outcomes in high-risk cases, we can raise the strength of chemotherapy and employ stem cell transplantation and CAR-T cell therapy.
There are still some limitations to this study. First, selection bias is unavoidable because of the nature of retrospective research. Second, while we have undertaken external verification, the scale is tiny. Therefore, the support for the prediction model is limited. In the future, we need to carry out multi-center collaboration and large sample-size research to verify our research results. Third, each biomarker will change in response to the body’s state and therapy, and this study focuses solely on the link between these variables and prognosis before treatment; however, the importance of dynamic changes in these indicators on prediction warrants additional investigation, which may be the direction of our future study.
Conclusion
In conclusion, we have constructed a new prognostic scoring system (IBPS) based on the baseline inflammatory biomarkers. The nomogram composed of IBPS accurately predicts the outcome of patients with DLBCL, which may help doctors choose and adjust treatment plans.
Abbreviations
DLBCL, diffuse large B-cell lymphoma; OS, overall survival; IPI, International Prognostic Index; NCCN, National Comprehensive Cancer Network; LDH, lactate dehydrogenase; EN, extranodal; ECOG PS, Eastern Cooperative Oncology Group Performance Status; COO, cell of origin; GCB, germinal center B-cell-like; SII, systemic immune-inflammation index; SIRI, system inflammation response index; PNI, prognostic nutritional index; NLR, neutrophil to lymphocyte ratio; PLR, platelet to lymphocyte ratio; LMR, lymphocyte to monocyte ratio; AGR, albumin to globulin ratio; CAR, C-reactive protein to albumin ratio; mGPS, modified Glasgow Prognostic Score; β-2 MG, β-2 microglobulin; LASSO, the least absolute shrinkage and selection operator; C-index: concordance index; ROC, receiver operating characteristic; AUC, the area under the curve; DCA, decision curve analysis; IBPS, inflammation-based prognosis score; CR, complete remission; PR, partial remission; SD, stable disease; PD, progressive disease.
Data Sharing Statement
Data can be made available by contacting the corresponding author.
Ethics Approval and Informed Consent
This study was approved by the Medical Ethics Committee of Jiangnan University Affiliated Hospital (number LS2022037). The requirement for written informed consent was waived due to the retrospective nature of the study. All data used in this manuscript were anonymized.
Acknowledgments
We thank all the patients who participated in this study.
Author Contributions
All authors made substantial contributions to conception and design, acquisition of data, or analysis and interpretation of data; took part in drafting the article or revising it critically for important intellectual content; agreed to submit to the current journal; gave final approval of the version to be published; and agree to be accountable for all aspects of the work.
Disclosure
The authors report no conflicts of interest in this work.
References
1. Chapuy B, Stewart C, Dunford AJ, et al. Molecular subtypes of diffuse large B cell lymphoma are associated with distinct pathogenic mechanisms and outcomes. Nat Med. 2018;24(5):679–690. doi:10.1038/s41591-018-0016-8
2. Zelenetz AD, Gordon LI, Abramson JS, et al. NCCN guidelines insights: b-cell lymphomas, version 3.2019. J Natl Compr Canc Netw. 2019;17(6):650–661. doi:10.6004/jnccn.2019.0029
3. Crump M, Neelapu SS, Farooq U, et al. Outcomes in refractory diffuse large B-cell lymphoma: results from the international SCHOLAR-1 study. Blood. 2017;130(16):1800–1808. doi:10.1182/blood-2017-03-769620
4. Sehn LH, Berry B, Chhanabhai M, et al. The revised International Prognostic Index (R-IPI) is a better predictor of outcome than the standard IPI for patients with diffuse large B-cell lymphoma treated with R-CHOP. Blood. 2007;109(5):1857–1861. doi:10.1182/blood-2006-08-038257
5. Ruppert AS, Dixon JG, Salles G, et al. International prognostic indices in diffuse large B-cell lymphoma: a comparison of IPI, R-IPI, and NCCN-IPI. Blood. 2020;135(23):2041–2048. doi:10.1182/blood.2019002729
6. Marcus C, Maragkos GA, Alterman RL, Uhlmann E, Pihan G, Varma H. GCB-type is a favorable prognostic factor in primary CNS diffuse large B-cell lymphomas. J Clin Neurosci. 2021;83:49–55. doi:10.1016/j.jocn.2020.11.031
7. Roh J, Cho H, Yoon DH, et al. Quantitative analysis of tumor-specific BCL2 expression in DLBCL: refinement of prognostic relevance of BCL2. Sci Rep. 2020;10(1):10680. doi:10.1038/s41598-020-67738-4
8. Bouroumeau A, Bussot L, Bonnefoix T, et al. c-MYC and p53 expression highlight starry-sky pattern as a favourable prognostic feature in R-CHOP-treated diffuse large B-cell lymphoma. J Pathol Clin Res. 2021;7(6):604–615. doi:10.1002/cjp2.223
9. Alsaadi M, Khan MY, Dalhat MH, et al. Dysregulation of miRNAs in DLBCL: causative factor for pathogenesis, diagnosis and prognosis. Diagnostics. 2021;11(10). doi:10.3390/diagnostics11101739
10. Jomrich G, Paireder M, Kristo I, et al. High systemic immune-inflammation index is an adverse prognostic factor for patients with gastroesophageal adenocarcinoma. Ann Surg. 2021;273(3):532–541. doi:10.1097/sla.0000000000003370
11. Schiefer S, Wirsik NM, Kalkum E, et al. Systematic review of prognostic role of blood cell ratios in patients with gastric cancer undergoing surgery. Diagnostics. 2022;12:3.
12. Wu XB, Hou SL, Liu H. Systemic immune inflammation index, ratio of lymphocytes to monocytes, lactate dehydrogenase and prognosis of diffuse large B-cell lymphoma patients. World J Clin Cases. 2021;9(32):9825–9834. doi:10.12998/wjcc.v9.i32.9825
13. Gradel KO, Larsen TS, Frederiksen H, et al. Impact of C-reactive protein and albumin levels on short, medium, and long term mortality in patients with diffuse large B-cell lymphoma. Ann Med. 2022;54(1):713–722. doi:10.1080/07853890.2022.2046287
14. Wang Z, Zhang J, Luo S, Zhao X. Prognostic significance of systemic immune-inflammation index in patients with diffuse large B-cell lymphoma. Front Oncol. 2021;11:655259. doi:10.3389/fonc.2021.655259
15. Wu J, Zhu H, Zhang Q, et al. Nomogram based on the systemic immune-inflammation index for predicting the prognosis of diffuse large B-cell lymphoma. Asia Pac J Clin Oncol. 2022;19:e138–e148. doi:10.1111/ajco.13806
16. Shen Z, Wang F, He C, et al. The Value of Prognostic Nutritional Index (PNI) on newly diagnosed diffuse large B-cell lymphoma patients: a multicenter retrospective study of HHLWG based on propensity score matched analysis. J Inflamm Res. 2021;14:5513–5522. doi:10.2147/jir.S340822
17. He J, Yin H, Xia Y, et al. Prognostic nutritional index, a novel biomarker which predicts worse prognosis in diffuse large B cell lymphoma. Leuk Res. 2021;110:106664. doi:10.1016/j.leukres.2021.106664
18. Kim Y, Kim SJ, Hwang D, et al. The modified Glasgow Prognostic Scores as a predictor in diffuse large B cell lymphoma treated with R-CHOP regimen. Yonsei Med J. 2014;55(6):1568–1575. doi:10.3349/ymj.2014.55.6.1568
19. Liu T, Ye F, Li Y, Liu A. Comparison and exploration of the prognostic value of the advanced lung cancer inflammation index, prognostic nutritional index, and systemic immune-inflammation index in newly diagnosed diffuse large B-cell lymphoma. Ann Palliat Med. 2021;10(9):9650–9659. doi:10.21037/apm-21-2067
20. Wang D, DuBois RN. Immunosuppression associated with chronic inflammation in the tumor microenvironment. Carcinogenesis. 2015;36(10):1085–1093. doi:10.1093/carcin/bgv123
21. Singh N, Baby D, Rajguru JP, Patil PB, Thakkannavar SS, Pujari VB. Inflammation and cancer. Ann Afr Med. 2019;18(3):121–126. doi:10.4103/aam.aam_56_18
22. Hinshaw DC, Shevde LA. The tumor microenvironment innately modulates cancer progression. Cancer Res. 2019;79(18):4557–4566. doi:10.1158/0008-5472.Can-18-3962
23. Nozawa H, Chiu C, Hanahan D. Infiltrating neutrophils mediate the initial angiogenic switch in a mouse model of multistage carcinogenesis. Proc Natl Acad Sci U S A. 2006;103(33):12493–12498. doi:10.1073/pnas.0601807103
24. Yoon CI, Park S, Cha YJ, et al. Associations between absolute neutrophil count and lymphocyte-predominant breast cancer. Breast. 2020;50:141–148. doi:10.1016/j.breast.2019.09.013
25. Cefalì M, Efstathopoulou A, De Dosso S, Saletti P. Lymphocyte count and lymphocyte-to-white blood cells ratio as indicators of survival in specific cancer subtypes. Int Immunopharmacol. 2019;77:105982. doi:10.1016/j.intimp.2019.105982
26. Mohsen A, Taalab M, Abousamra N, Mabed M. Prognostic significance of absolute lymphocyte count, absolute monocyte count, and absolute lymphocyte count to absolute monocyte count ratio in follicular non-Hodgkin lymphoma. Clin Lymphoma Myeloma Leuk. 2020;20(9):e606–e615. doi:10.1016/j.clml.2020.03.007
27. Huang JJ, Jiang WQ, Lin TY, et al. Absolute lymphocyte count is a novel prognostic indicator in extranodal natural killer/T-cell lymphoma, nasal type. Ann Oncol. 2011;22(1):149–155. doi:10.1093/annonc/mdq314
28. Di Vito C, Navone SE, Marfia G, et al. Platelets from glioblastoma patients promote angiogenesis of tumor endothelial cells and exhibit increased VEGF content and release. Platelets. 2017;28(6):585–594. doi:10.1080/09537104.2016.1247208
29. Schlesinger M. Role of platelets and platelet receptors in cancer metastasis. J Hematol Oncol. 2018;11(1):125. doi:10.1186/s13045-018-0669-2
30. Sheinenzon A, Shehadeh M, Michelis R, Shaoul E, Ronen O. Serum albumin levels and inflammation. Int J Biol Macromol. 2021;184:857–862. doi:10.1016/j.ijbiomac.2021.06.140
31. Matsubara T, Takamori S, Haratake N, et al. Identification of the best prognostic marker among immunonutritional parameters using serum C-Reactive protein and albumin in non-small cell lung cancer. Ann Surg Oncol. 2021;28(6):3046–3054. doi:10.1245/s10434-020-09230-x
32. Fan X, Zang L, Zhao BB, et al. Development and validation of prognostic scoring in primary intestinal diffuse large B-cell lymphoma: a single-institution study of 184 patients. Ann Transl Med. 2021;9(20):1542. doi:10.21037/atm-21-4761
33. Zhang X, Tang H, Miao Y, et al. Multiple primary malignancies in 788 Chinese patients with diffuse large B-cell lymphoma. Cancer Med. 2023. doi:10.1002/cam4.6070
34. Ulu BU, Yiğenoğlu TN, Başcı S, et al. Factors affecting survival in elderly patients with diffuse large B-Cell lymphoma. Leuk Res. 2021;110:106700. doi:10.1016/j.leukres.2021.106700
35. Zhao J, Zhang W, Zhou D. Primary extranodal diffuse large B-cell lymphoma in the rituximab era: a single center, retrospective analysis. Hematology. 2022;27(1):757–764. doi:10.1080/16078454.2022.2091197
36. Kim SJ, Kang HJ, Kim JS, et al. Comparison of treatment strategies for patients with intestinal diffuse large B-cell lymphoma: surgical resection followed by chemotherapy versus chemotherapy alone. Blood. 2011;117(6):1958–1965. doi:10.1182/blood-2010-06-288480
37. Lin JL, Lin JX, Li P, et al. The impact of surgery on long-term survival of patients with primary gastric diffuse large B-cell lymphoma: a SEER population-based study. Gastroenterol Res Pract. 2019;2019:9683298. doi:10.1155/2019/9683298
38. Wang M, Ma S, Shi W, Zhang Y, Luo S, Hu Y. Surgery shows survival benefit in patients with primary intestinal diffuse large B-cell lymphoma: a population-based study. Cancer Med. 2021;10(10):3474–3485. doi:10.1002/cam4.3882
39. Varelas AN, Eggerstedt M, Ganti A, Tajudeen BA. Epidemiologic, prognostic, and treatment factors in sinonasal diffuse large B -cell lymphoma. Laryngoscope. 2019;129(6):1259–1264. doi:10.1002/lary.27639
40. Binn M, Ruskoné-Fourmestraux A, Lepage E, et al. Surgical resection plus chemotherapy versus chemotherapy alone: comparison of two strategies to treat diffuse large B-cell gastric lymphoma. Ann Oncol. 2003;14(12):1751–1757. doi:10.1093/annonc/mdg495
41. Li M, Yao H, Zhang P, et al. Development and validation of a [(18)F]FDG PET/CT-based radiomics nomogram to predict the prognostic risk of pretreatment diffuse large B cell lymphoma patients. Eur Radiol. 2022;33:3354–3365. doi:10.1007/s00330-022-09301-5
42. He J, Chen Z, Xue Q, et al. Identification of molecular subtypes and a novel prognostic model of diffuse large B-cell lymphoma based on a metabolism-associated gene signature. J Transl Med. 2022;20(1):186. doi:10.1186/s12967-022-03393-9
 © 2023 The Author(s). This work is published and licensed by Dove Medical Press Limited. The
full terms of this license are available at https://www.dovepress.com/terms
and incorporate the Creative Commons Attribution
- Non Commercial (unported, 3.0) License.
By accessing the work you hereby accept the Terms. Non-commercial uses of the work are permitted
without any further permission from Dove Medical Press Limited, provided the work is properly
attributed. For permission for commercial use of this work, please see paragraphs 4.2 and 5 of our Terms.
© 2023 The Author(s). This work is published and licensed by Dove Medical Press Limited. The
full terms of this license are available at https://www.dovepress.com/terms
and incorporate the Creative Commons Attribution
- Non Commercial (unported, 3.0) License.
By accessing the work you hereby accept the Terms. Non-commercial uses of the work are permitted
without any further permission from Dove Medical Press Limited, provided the work is properly
attributed. For permission for commercial use of this work, please see paragraphs 4.2 and 5 of our Terms.