Back to Journals » International Journal of General Medicine » Volume 16
A Nomogram for Predicting the Risk of CKD Based on Cardiometabolic Risk Factors
Authors Yu P, Kan R, Meng X, Wang Z ![]() , Xiang Y, Mao B
, Xiang Y, Mao B ![]() , Yu X
, Yu X
Received 27 June 2023
Accepted for publication 15 August 2023
Published 11 September 2023 Volume 2023:16 Pages 4143—4154
DOI https://doi.org/10.2147/IJGM.S425122
Checked for plagiarism Yes
Review by Single anonymous peer review
Peer reviewer comments 4
Editor who approved publication: Dr Scott Fraser
Peng Yu,1– 4 Ranran Kan,1,3 Xiaoyu Meng,1,3 Zhihan Wang,1,3 Yuxi Xiang,1,3 Beibei Mao,1,3 Xuefeng Yu1,3
1Department of Endocrinology, Tongji Hospital, Huazhong University of Science and Technology, Wuhan, People’s Republic of China; 2Department of Endocrinology, the Central Hospital of Wuhan, Tongji Medical College, Huazhong University of Science and Technology, Wuhan, People’s Republic of China; 3Branch of National Clinical Research Center for Metabolic Diseases, Hubei, People’s Republic of China; 4Key Laboratory for Molecular Diagnosis of Hubei Province, Wuhan, People’s Republic of China
Correspondence: Xuefeng Yu, Department of Internal Medicine, Tongji Hospital, Huazhong University of Science and Technology, No. 1095, Jiefang Road, Wuhan, 430030, People’s Republic of China, Tel +8602783663331, Email [email protected]
Background: In China, the spectrum of causes for CKD has been changing in recent years, and the proportion of CKD caused by cardiometabolic diseases, such as diabetes and hypertension continues to increase. Thus, predicting CKD based on cardiometabolic risk factors can to a large extent help identify those at increased risk and facilitate the prevention of CKD. In this study, we aimed to develop a nomogram for predicting CKD risk based on cardiometabolic risk factors.
Methods: We developed a nomogram for predicting CKD risk by using a subcohort population of the 4C study, which was located in central China. The prediction model was designed by using a logistic regression model, and a backwards procedure based on the Akaike information criterion was applied for variable selection. The performance of the model was evaluated by the concordance index (C-index), and Hosmer‒Lemeshow goodness-of-fit test. The bootstrapping method was applied for internal validation.
Results: During the 3-years follow-up, 167 cases of CKD developed. By using univariate and multivariate logistic regression models, the following factors were identified as predictors in the nomogram: age, sex, HbA1c, baseline eGFR, low HDL-C levels, high TC levels and SBP. The bootstrap-corrected C-index for the model was 0.84, which indicated good discrimination ability. The Hosmer‒Lemeshow goodness-of-fit tests yielded chi-square of 13.61 (P=0.192), and the calibration curves demonstrated good consistency between the predicted and observed probabilities, which indicated satisfactory calibration ability.
Conclusion: We developed a convenient and practicable nomogram for the 3‑year risk of incident CKD among a population in central China, which may help to identify high-risk individuals for CKD and contribute to the prevention of CKD.
Keywords: CKD, cardiometabolic risk factors, nomogram
Introduction
Chronic kidney disease (CKD) is defined by abnormalities in kidney structure or function that persist for at least 3 months. The criteria for diagnosing CKD include an estimated glomerular filtration rate (eGFR) less than 60 mL/min per 1.73 m2, albuminuria (urinary albumin creatinine ratio, UACR ≥ 30 mg/g), abnormal urine sediment, abnormal kidney histology, abnormal kidney imaging, electrolytes and other abnormalities due to tubular disorders and a history of kidney transplantation.1 The global prevalence of CKD continues to increase in recent years, making it one of the greatest public health challenges to all nations.2 Although only 2% of CKD patients will progress to end-stage kidney disease, which requires renal replacement therapy, CKD patients are at increased risk of cardiovascular complications, cardiovascular death and all-cause death.3,4 However, CKD awareness is low in the general population,5 and early CKD stages are silent and lack specific symptoms. A considerable number of patients are not referred to the clinical until the onset of symptomatic disease. Given this, early detection of CKD in individuals who are at high risk raises clinical concerns as accessible and inexpensive treatments can be implemented in this stage.
CKD can be caused by heterogeneous conditions, such as glomerulonephritis, diabetes, hypertension, dyslipidaemia, cardiovascular disease and nephrotoxic drugs. Traditionally, cardiometabolic risk factors, including diabetes and hypertension, are the main causes of CKD in high-income and middle-income countries, while in developing countries, glomerulonephritis and unknown causes predominate.6 In recent years, with a dramatic transition in dietary patterns and lifestyles from traditional moderation to Western excess, the spectrum of CKD in China has gradually changed. The survey indicated that CKD owing to glomerulonephritis was exceed by CKD owing to diabetes in 2011, and the gap continued to increase since then. In 2017, the percentage of hospitalized patients with CKD, CKD owing to diabetes, and CKD owing to glomerulonephritis was 4.95%, 1.14% and 0.68%, respectively, and a prominent explanation was the increasing prevalence of overweight and obesity.7 This survey emphasized the increasing importance of the cardiometabolic risk factors in the pathogenesis of CKD in China.
Various predictive factors that are representative of cardiometabolic risk have been demonstrated to be associated with the risk of CKD. Of note, the predicted value of a signal factor is always limited. A multivariable prediction model combining clinical characteristics and biochemical markers may be useful for risk stratification, which may allow large-scale identification of the high-risk population who would benefit most from early intervention for CKD. However, unlike coronary artery disease and stroke, which have standardized prediction tools such as the Framingham risk score,8 there is no widely acceptable risk assessment tool for CKD. Although several prediction algorithms for CKD have been developed, a majority of them were developed in Western populations, and prediction models suitable for Chinese rural populations are still lacking. In this study, we aimed to develop and validate a nomogram to predict the 3-year risk of CKD in a Chinese rural population by using a subcohort from the China Cardio-metabolic Disease and Cancer Cohort study, which may provide personalized predictions and contribute to the early prevention of CKD.
Methods
Study Design and Study Population of the Derivation Cohort
The design of the China Cardiometabolic Disease and Cancer Cohort study has been described in detail in previous study.9,10 In brief, this cohort was designed to investigate the association between metabolic risk factors and health outcomes, such as diabetes, cardiovascular diseases and cancer. The study population of the current study comes from one of the community sites of this cohort. A total of 10,999 individuals aged more than 40 years from the general population were recruited in 2011, and the follow-up study was conducted in 2014. The study protocol was approved by the ethics review committee of Tongji Hospital, Tongji Medical College, Huazhong University of Science and Technology. Informed consent was obtained from each study participant.
The exclusion criteria were as follows: (1) individuals lost to follow-up or without eGFR measurements at follow-up; (2) individuals with chronic kidney disease or eGFR less than 60 mL/min/1.73 m2 at baseline; and (3) individuals with missing data or abnormal values for potential predictive variables. In total, 5499 participants were included in this study.
Measurements and Definitions
Lifestyle data and medical history were collected by a structured questionnaire. A person who smoked one or more cigarettes a day for at least six months was defined as a current smoker, and a person who consumed alcohol at least once per week for at least the previous six months was defined as a current drinker. Participants with a history of myocardial infarction, coronary heart disease, stroke or peripheral artery disease were considered to have a history of cardiovascular disease.
Body weight was measured to the nearest 0.1 kg with subjects wearing light clothes and without shoes. Height was determined in the Frankfort plane position to the nearest 0.1 cm using a calibrated digital scale. BMI was calculated as body weight divided by squared height. Waist circumference (WC) was measured at the midpoint between the lower border of the rib cage and the iliac crest to the nearest 0.5 cm. The waist-to-height ratio (WHtR) was calculated as WC dividedby height. The systolic and diastolic blood pressure was measured in a seated position after 5 minutes’ rest by an Omron professional blood pressure monitor. The measurements were repeated 3 times with a 1-minute interval between two measurements and the average value was calculated. The mean of two measures was calculated in cases where three values were unavailable. Hypertension was defined as systolic blood pressure ≥140mmHg, diastolic blood pressure ≥90mmHg, and/or use of antihypertensive medications.
A 75-g OGTT after overnight fasting was performed after overnight fasting. Plasma fasting and 2-h postload glucose were evaluated using the glucose oxidase method. Serum total cholesterol (TC), low-density lipoprotein cholesterol (LDL-C), high-density lipoprotein cholesterol (HDL-C), triglycerides (TG), creatinine, aspartate aminotransferase (AST) and alanine aminotransferase (ALT) were tested using an autoanalyzer. Diabetes was defined as fasting plasma glucose ≥7.0 mmol/L, 2-hour postload plasma glucose concentrations ≥11.1 mmol/L, HbA1c >6.5% or a self-reported previous diagnosis of diabetes. Dyslipidaemia was defined as TG ≥2.26 mmol/L, TC ≥6.22 mmol/L, HDL-C <1.04 mmol/L, or LDL-C ≥4.14 mmol/L according to the Chinese guidelines on the prevention and treatment of dyslipidemia in adults.11
Outcome
The primary outcome was the incidence of CKD, which was defined as an eGFR of less than 60 mL/min/1.73 m2 at follow-up. eGFR was calculated by using the 2009 Chronic Kidney Disease Epidemiology Collaboration (CKD-EPI) equation.12
Statistical Analysis
Development of the Nomogram
Continuous variables that were symmetrically distributed or approximately symmetrically distributed are presented as the mean and SD, and variables with skewed distributions are presented as the median and interquartile interval (IQI).
Based on the results of published literature and the availability of relevant variables in our database, we chose the following potential predictors: age, sex, current smoking status (yes/no), current drinking status (yes/no), diabetes (yes/no), hypertension (yes/no), CVD history (yes/no), dyslipidaemia (yes/no), HbA1C, baseline eGFR, WHtR, SBP, and DBP. First, for the two biochemical parameters, HbA1c and baseline eGFR, we adopted restricted cubic splines (RCS) to detect whether a nonlinear relationship existed between the variable and outcome. A knot was located at the 5th, 50th, and 95th percentiles for each variable. Likelihood ratio tests were used to test for nonlinearity, which compared a model containing only the linear term with a model containing the linear and restricted cubic spline terms. We found a nonlinear relationship between baseline eGFR and outcome (p value for nonlinearity <0.05) (Supplementary Figure 1). Then, we converted baseline eGFR into 3 groups (≥90, 75–89, and 60–74 mL/min/1.73 m2) according to RCS and the cut-off points in clinical practice. For HbA1c, a linear relationship existed between this variable and outcome. Based on the commonly used cut-off points in clinical practice, HbA1c was categorized into 3 groups (<6.5%, 6.5%–7.4%, and ≥7.5%).
Second, univariate and multivariate logistic regression models were used to depict candidate predictors of CKD. For the development of the nomogram in our study population, backwards stepwise selection based on the Akaike information criterion (AIC) was used for variable selection in multivariate regression, and the model with the lowest AIC was selected as the final prediction model. The resulting multivariate logistic regression model was used to calculate the risk score and build the final nomogram.
Model Performance Assessment
The performance of the nomogram was evaluated by two features: discrimination and calibration. The receiver operating characteristic curve (AUC) and the concordance statistic (c-statistic) were used to assess the discrimination power, considering AUCs of 0.70–0.79 as indicating acceptable discrimination and ≥0.80 as excellent discrimination.13 Calibration curves were plotted to evaluate the consistency between predicted and actual incidence of CKD. Perfect calibration is indicated by a 45° diagonal line, whereas any deviation above or below this line indicates underprediction or overprediction. At the same time, Hosmer‒Lemeshow (H-L) chi-square statistics was also performed to evaluate calibration, and a P value greater than 0.05 supported the goodness of calibration.
Model Validation
The model was internally validated using bootstraps with 1000 resamples. In brief, repeated samples were taken with replacement from the original sample to build bootstrap samples, in which the number of individuals was equal to the number of individuals from the original sample. The model was refitted in each bootstrap sample, and the performance, including discrimination and calibration ability, was tested on both the bootstrap sample and the original sample. Optimism was quantified as the mean difference in performance between the bootstrap samples and the original sample. Finally, optimism-adjusted c-statistics and calibration curves were calculated, which reflected the stability of a prediction model to random changes in sample composition.
We used SPSS version 26.0 software and R version 3.4.2 software for all statistical analyses.
Results
Baseline Characteristics of Participants
A total of 5499 (1873 men and 3626 women) participants were included in this study. The baseline characteristics of the participants are shown in Table 1. The average age of the included participants was 60.87 ± 9.46 years. A total of 773 (13.3%) participants were current smokers, and 670 (12.2%) participants were current alcohol drinkers. The baseline eGFR level of the total population was 94.94±9.97 mL/min/1.73m2. A total of 3835 participants (69.7%) had hypertension, 718 (13.1%) participants had diabetes, and 400 (7.3%) participants had a history of cardiovascular disease.
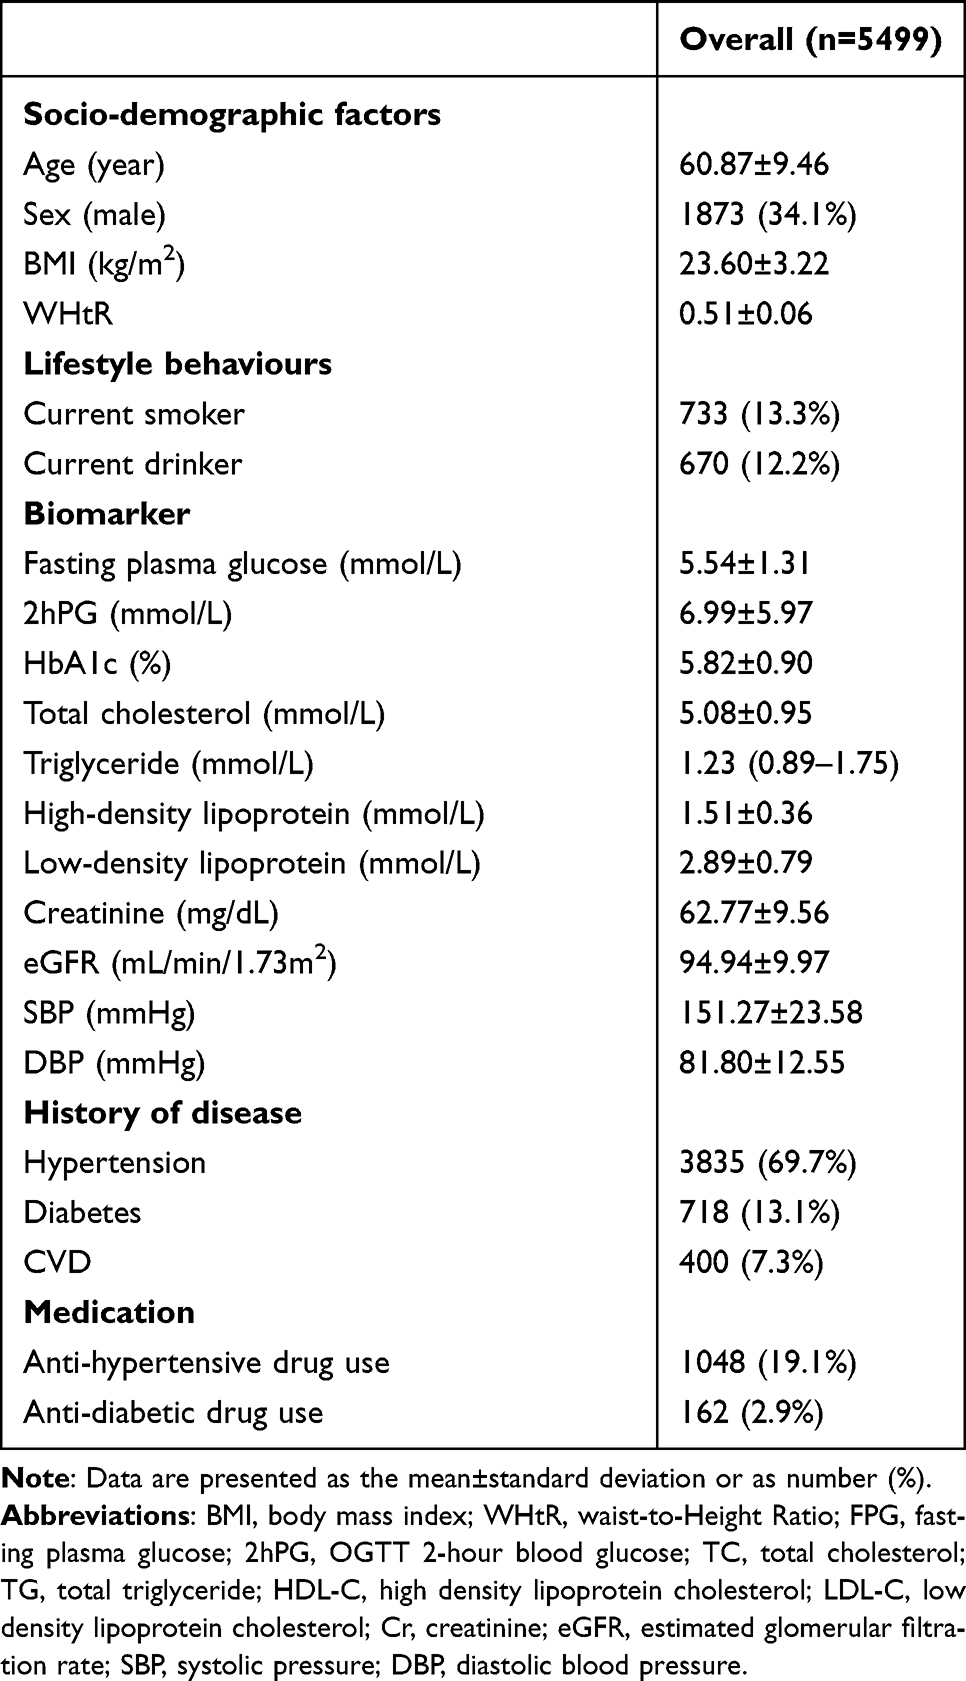 |
Table 1 Clinical Features of the Participants |
Univariate and Multivariate Analyses of Factors for Incident CKD
During the 3-year follow-up, 167 (3.03%) people developed CKD. In univariate analyses, the predictive factors significantly associated with CKD incidence were age, sex, high HbA1c level, high cholesterol level (≥6.22 mmol/L), low high-density lipoprotein level (<1.04 mmol/L), high low-density lipoprotein level (≥4.14 mmol/L), baseline eGFR level, SBP and history of CVD (Table 2).
 |
Table 2 Univariable and Multivariate Analysis of Variables Associated with CKD Risk |
In the multivariate analyses, through backwards elimination, we found 7 independent predictors associated with the 3 year risk of incident CKD as follows: (1) age (RR 1.03, 95% CI, 1.00 to 1.06, p=0.001); (2) sex: men had significantly higher risk of developing CKD compared to women (RR 2.03, 95% CI, 1.44–2.85, p<0.001); (3) HbA1c categories (compared with HbA1c<6.5; RR 1.55, 95% CI, 0.81 to 2.98, p=0.186 for HbA1c within 6.5 to 7.4; RR 3.89, 95% CI, 2.10 to 7.21, p<0.001 for HbA1c≥7.5); (4) high cholesterol levels (RR 1.68, 95% CI, 1.07 to 2.66, p=0.025); (5) low high-density lipoprotein levels (RR 1.99, 95% CI, 1.14 to 3.46, p=0.015); and (6) baseline eGFR categories (compared with eGFR≥90; RR 5.07, 95% CI, 3.24 to 7.94, p<0.001 for eGFR within 75 to 89; RR 26.50, 95% CI, 16.41 to 42.78, p<0.001 for eGFR within 60 to 74); (7) SBP (RR 1.01, 95% CI, 1.00 to 1.02, p=0.002) (Table 2).
Development of the Prediction Model
The prediction model was developed and presented as a nomogram by incorporating the above 7 independent predictors selected from multivariate analysis. For each predicted variable, relevant line labelled points were given according to their regression coefficients (Figure 1). When the nomogram was used to determine the estimated probability of CKD over three years, the scores of each point were summed up and located on the total score scale, and then a vertical line was drawn down to locate the predicted value of the model. For instance, for a 64-year-old (24 points) man (21 points) presented with a baseline eGFR of 81.77 mL/min/1.73 m2 (50 points), HbA1c of 8.0% (41 points), HDL-C of 0.96 mmol/L (21 points), TC of 4.29 mmol/L (0 points), and SBP of 190 (41 points), his total points were 199 according to the characteristics listed above. That score corresponded to a 3-year risk of CKD of approximately 42% (Figure 2).
 |
Figure 1 The nomogram developed in this study to calculate the predicted 3-year CKD risk. |
 |
Figure 2 A case of using the nomogram to calculate the predicted 3-year CKD risk. |
Performance of the Nomogram
The performance of the nomogram was evaluated by AUC and validated by the bootstrap method. The original c-statistic of the model was 0.85 (95% CI, 0.81–0.88), and the optimism-corrected C statistic was 0.84 in bootstrap validation, demonstrating good discrimination (Figure 3). Hosmer‒Lemeshow goodness-of-fit tests yielded chi-square values of 13.61, indicating no significant deviation between the observed and predicted values. Moreover, the original calibration plot curve and the optimism adjusted calibration curve for internal validation are shown in Figure 4, showing good overall agreement between the nomogram’s estimated and actual probabilities.
 |
Figure 3 Receiver operating characteristic curve (ROC) for predicting the 3-year risk of CKD. AUCs (areas under the curve) with 95% confidence intervals (red area) were calculated by 1000 bootstrap resamples. |
 |
Figure 4 Calibration plots for observed and predicted 3-year risks of CKD. The black dashed line indicates the reference line that represents where a perfect calibration would lie, the solid red line indicates the result for our risk prediction model, and the solid green line indicates optimism-corrected calibration plots derived from 1000 bootstrap resamples. |
Sensitivity and Specificity
Table 3 shows the sensitivity, specificity, PPV, and NPV for predicting CKD at different thresholds. At a cut-off value of ≥ 0.50, the specificity was 0.86, sensitivity was 0.65, positive predictive value was 0.13, and negative predictive value was 0.99. When the cut-off value increased to 0.50, the specificity was 0.99, sensitivity was 0.04, positive predictive value was 0.70, and negative predictive value was 0.97. Thus, the specificity of the nomogram was increased with higher cut-off values; at the same time, the sensitivity gradually decreased to a relatively low point at which a subset of high-risk individuals may be omitted.
 |
Table 3 Values of Sensitivity, Specificity, PPV and NPV for the Nomogram Scores at Different Cut-off Values |
Discussion
Main Findings
In this study, we developed a nomogram to predict the 3-year risk of decreased GFR in individuals aged more than 40 years. Our prediction model was based on 7 cardiometabolic risk factors that are routinely collected in clinical practice. In model assessment and internal validation, this nomogram demonstrated excellent discrimination and adequate calibration. Thus, by using this nomogram, we can identify those at elevated risk of developing CKD and provide personalized interventions such as lifestyle modification, glycaemic control or blood pressure management to improve clinical outcomes.
Comparison with Previous Studies/Risk Scores
To date, several prediction models for CKD have been developed. The major models in Western populations include the algorithms developed from the Atherosclerosis Risk in Communities (ARIC) study/Cardiovascular Health Study (CHS), the Framingham Heart Study (FHS), and the QResearch® database (QKidney®).14–16 Among the above models, the QKidney score was the most complicated one and included 16 predictors. These models all showed adequate discrimination and calibration in their original derivation cohort. Aiming to explore the generalizability of current CKD prediction models, Paolo et al externally validated seven CKD prediction models, including the ARIC/CHS score, FHS score and QKidney® score in a British population.17 Their results revealed that the ARIC/CHS score overpredicted the risk, and the FHS score underestimated the risk in their validation study; only the QKidney® score was well-calibrated. As the QKidney® score outperformed the other models and was the only model developed from the UK population, they proposed that the differences in the incidence of CKD and risk factor profiles in distinct populations may influence the performance of CKD prediction models. Currently, these Western models have not been validated in a multicentre, large sample size Chinese population. Considering the differences in genetic background, dietary habits, lifestyles and disease spectrums among different ethnicities, the accuracy of applying those models to the Chinese population is debatable.
In the Chinese population, Chien et al developed CKD prediction models in the Taiwan population based on age, diastolic blood pressure, history of stroke, postprandial glucose, HbA1c, proteinuria, and uric acid. After a median follow-up of 2.2 years, the incidence of CKD (defined as an eGFR of< 60 mL/min/1.73 m2) was 3.7%, and the C statistic for their model was approximately 0.75. However, when they validated their model in another Taiwan cohort, the C-statistic was only 0.667.18 Our study was performed in a population in central China. The risk factors included in our model and the incidence of CKD (3.03%) were similar to those in the model performed by Chien et al. However, our model had a significantly higher C-statistic value, which showed be explained: in different study population, the contribution of the same predictor/risk factor to the incidence of CKD may also be different; for example, 69.7% of the participants had hypertension at baseline in our cohort, while only 23.9% hypertension at baseline in Chien et al’s study. Wen et al developed risk models in a rural population of northern China which based on the urinary albumin-to-creatinine ratio, SBP, C-reactive protein, triglycerides, sex, education, and diabetes. In their study, 6.4% of the participants developed CKD (defined as eGFR< 60 mL/min/1.73 m2) during a median of 5.6 years of follow-up, and they carried out internal model validation by splitting the total population into a training set and a validation set. In the validation set, the C-statistic for the best fitting model was 0.721.19 Our model had several differences when compared with their model: First, in both studies, dyslipidaemia was considered an important risk factor for CKD, but they only included TC in their model. We also considered TG, HDL-C and LDL-C as candidate predictors. Second, they included C-reactive protein as a predictor and current study indicates that low-grade inflammation contributes to the pathogenesis of CKD. However, due to the lack of C-reactive protein data, we failed to take this risk factor into consideration; thus, whether the inclusion of C-reactive protein in our model would further improve model performance still needs to be determined. Third, as our study had a shorter follow-up period and a lower incidence rate of CKD, to ensure adequate statistical power, we used the bootstrap method in model validation instead of splitting the total population into a training set and a validation set.
The variables included in our best-fitting model were generally consistent with previous risk evaluation studies. Hypertension and diabetes are two major risk factors for CKD. Some CKD risk prediction models use a history of hypertension and diabetes as predictors. Considering individual differences in the treatment and control of disease, we used glycemic status as evaluated by HbA1c and hypertension control as reflected by SBP as predictors for CKD. Meanwhile, we considered hyperlipidemia in the process of model development. In the final model, high TC levels and low HDL-C levels were included. Currently, low HDL-C levels have been reported to be associated with an increased risk of CKD in several studies. For example, a US cohort with a median follow-up of 9 years showed that, compared with HDL-C more than 40 mg/dl, low HDL-C (HDL-C less than 30 mg/mL) was associated with an increased risk for CKD after adjusting for age, race, baseline eGFR, comorbidities, history of cardiovascular disease, BMI, LDL-C, triglycerides and statin use.20 In a cohort of patients with type 2 diabetes, HDL-C showed an inverse independent association with the risk of diabetic nephropathy.21 Mendelian randomization analyses also support a causal relationship between HDL-C and CKD.22,23 However, studies examining the association between TC level and the risk of CKD have given inconsistent results. Elke et al reported that men with a baseline TC level higher than 240 mg/dl had a 77% higher risk of developing CKD after adjusting for age, alcohol consumption, smoking, body mass index, history of hypertension, history of self-reported diabetes, physical activity, parental history of myocardial infarction, and current or past use of cholesterol-lowering medication at baseline.24 Liang et al subdivided their study participants into quartiles according to their baseline serum TC levels. After adjusting for age, sex, BMI, BP, TG, HDL, LDL, BUN, FPG, SCr, SUA, hypertension, diabetes and proteinuria, individuals with TC levels within the third (4.80–5.40 mmol/L) and fourth quartiles (>5.40 mmol/L) had a significantly higher risk of developing CKD.25 In contrast, other studies have reported no association between baseline TC levels and the subsequent development of CKD.26,27 The inconsistent results may result from differences in population characteristics and the follow-up period. Our study supported the view that TC can be a good indicator of poor cardio-metabolic health and helpful in the assessment of future CKD risk. As an important risk factor for CKD, we also considered excessive visceral fat in the process of model development. We used WHtR as the proxy for central obesity, as it has been proven to have high correlations with imaging derived body composition measures and is widely used in CVD risk evaluation.28,29 In theory, visceral adiposity may directly increase CKD risk in addition to its indirect contribution through the development of diabetes, hypertension and hyperlipidemia. However, although univariate analyses revealed a significant relation between WHtR and CKD, it was not included in our parsimonious model.
Strengths and Limitations
Our prediction model had several strengths. First, our model has good practicability, the variables in our model are routinely available and easily accessible by health care practitioners. Second, instead of displaying the model in the form of mathematical equations, we used the nomogram, which was convenient to use by physicians. There were also several limitations in our study. First, the outcome of our study was eGFR less than 60 mL/min/1.73 m2, which did not fully meet the clinical diagnostic criteria for chronic kidney disease, which was defined as abnormalities of kidney structure or function for more than 3 months, with implications for health. As we did not have repeated measures of eGFR, we cannot clarify how long the decreased eGFR persisted; thus, we cannot completely exclude those with acute kidney injury when defining the outcome, although we collected their recent medical history at the time of follow-up. Second, we lacked the measurement of urinary albumin, which is a useful marker of kidney damage. Individuals with isolated albuminuria and without decreased GFR were not taken into consideration in our study, which may have influenced the false-negative rate of the prediction model. Third, the follow-up period of our study was relatively short and the outcome events were relatively low, which may have influenced the calibration of our model. Fourth, our model has not undergone external validation and account for competing risks,30 which limits its use in a wider population.
Conclusion
We developed a convenient and practicable nomogram for the 3‑year risk of incident CKD among a population in central China, which incorporated age, sex, HbA1c, high cholesterol levels, low high-density lipoprotein levels, and baseline eGFR. Our model showed favorable discrimination and calibration, it has the potential to identify individuals at high risk of developing CKD and may contribute to the prevention of CKD.
Abbreviations
CKD, chronic kidney disease; eGFR, estimated glomerular filtration rate; WC, waist circumference; WHtR, waist-to-height ratio; TC, total cholesterol; LDL-C, low-density lipoprotein cholesterol; HDL-C, high-density lipoprotein cholesterol; TG, triglyceride; AST, aspartate aminotransferase; ALT, alanine aminotransferase; SD, standard deviation; IQI, interquartile interval; CVD, cardiovascular disease; RCS, restricted cubic spline; ROC, receiver operating characteristic curve; AUC, area under curve.
Data Sharing Statement
The datasets analyzed in the current study are not publicly available due to the limits on the data-sharing agreement of the China Cardiometabolic Disease and Cancer Cohort study group but are available upon reasonable request and approval.
Ethics Approval and Consent to Participate
Informed consent was obtained from all subjects involved in the study and our study complies with the Declaration of Helsinki.
Acknowledgments
We thank all members in China Cardiometabolic Disease and Cancer Cohort Study Group for their great efforts in the survey.
Funding
This research was funded by grants from the National Natural Science Foundation of China (82270880).
Disclosure
The authors declare no competing interests in this work.
References
1. Stevens PE, Levin A. Evaluation and management of chronic kidney disease: synopsis of the kidney disease: improving global outcomes 2012 clinical practice guideline. Ann Intern Med. 2013;158(11):825–830. doi:10.7326/0003-4819-158-11-201306040-00007
2. Bikbov B, Purcell CA, Levey AS. Global, regional, and national burden of chronic kidney disease, 1990-2017: a systematic analysis for the Global Burden of Disease Study 2017. Lancet. 2020;395(10225):709–733. doi:10.1016/s0140-6736(20)30045-3
3. Matsushita K, Coresh J, Sang Y, et al. Estimated glomerular filtration rate and albuminuria for prediction of cardiovascular outcomes: a collaborative meta-analysis of individual participant data. Lancet Diabetes Endocrinol. 2015;3(7):514–525. doi:10.1016/s2213-8587(15)00040-6
4. Matsushita K, van der Velde M, Astor BC, et al. Association of estimated glomerular filtration rate and albuminuria with all-cause and cardiovascular mortality in general population cohorts: a collaborative meta-analysis. Lancet. 2010;375(9731):2073–2081. doi:10.1016/s0140-6736(10)60674-5
5. Tuot DS, Wong KK, Velasquez A, et al. CKD Awareness in the General Population: performance of CKD-Specific Questions. Kidney Medicine. 2019;1(2):43–50. doi:10.1016/j.xkme.2019.01.005
6. Webster AC, Nagler EV, Morton RL, Masson P. Chronic Kidney Disease. Lancet. 2017;389(10075):1238–1252. doi:10.1016/s0140-6736(16)32064-5
7. Yang C, Wang H, Zhao X, et al. CKD in China: evolving Spectrum and Public Health Implications. Am J Kidney Dis. 2020;76(2):258–264. doi:10.1053/j.ajkd.2019.05.032
8. D’Agostino RB Sr, Vasan RS, Pencina MJ, et al. General cardiovascular risk profile for use in primary care: the Framingham Heart Study. Circulation. 2008;117(6):743–753. doi:10.1161/circulationaha.107.699579
9. Wang T, Lu J, Su Q, et al. Ideal Cardiovascular Health Metrics and Major Cardiovascular Events in Patients With Prediabetes and Diabetes. JAMA Cardiology. 2019;4(9):874–883. doi:10.1001/jamacardio.2019.2499
10. Lu J, He J, Li M, et al. Predictive Value of Fasting Glucose, Postload Glucose, and Hemoglobin A1c on Risk of Diabetes and Complications in Chinese Adults. Diabetes Care. 2019;42(8):1539–1548. doi:10.2337/dc18-1390
11. Joint Committee for Developing Chinese guidelines on Prevention and Treatment of Dyslipidemia in Adults. Chinese guidelines on prevention and treatment of dyslipidemia in adults. Zhonghua Xin Xue Guan Bing Za Zhi. 2007;35(5):390–419.
12. Levey AS, Stevens LA, Schmid CH, et al. A new equation to estimate glomerular filtration rate. Ann Intern Med. 2009;150(9):604–612. doi:10.7326/0003-4819-150-9-200905050-00006
13. Hosmer DW. Assessing the Fit of the Model. Applied Logistic Regression. 2000;143–202.
14. Kshirsagar AV, Bang H, Bomback AS, et al. A simple algorithm to predict incident kidney disease. Arch Intern Med. 2008;168(22):2466–2473. doi:10.1001/archinte.168.22.2466
15. O’Seaghdha CM, Lyass A, Massaro JM, et al. A risk score for chronic kidney disease in the general population. Am J Med. 2012;125(3):270–277. doi:10.1016/j.amjmed.2011.09.009
16. Hippisley-Cox J, Coupland C. Predicting the risk of chronic Kidney Disease in men and women in England and Wales: prospective derivation and external validation of the QKidney Scores. BMC Fam Pract. 2010;11:49. doi:10.1186/1471-2296-11-49
17. Fraccaro P, van der Veer S, Brown B, et al. An external validation of models to predict the onset of chronic kidney disease using population-based electronic health records from Salford, UK. BMC Med. 2016;14:104. doi:10.1186/s12916-016-0650-2
18. Chien KL, Lin HJ, Lee BC, Hsu HC, Lee YT, Chen MF. A prediction model for the risk of incident chronic kidney disease. Am J Med. 2010;123(9):836–846.e2. doi:10.1016/j.amjmed.2010.05.010
19. Wen J, Hao J, Zhang Y, et al. Risk scores for predicting incident chronic kidney disease among rural Chinese people: a village-based cohort study. BMC Nephrol. 2020;21(1):120. doi:10.1186/s12882-020-01787-9
20. Bowe B, Xie Y, Xian H, Balasubramanian S, Al-Aly Z. Low levels of high-density lipoprotein cholesterol increase the risk of incident kidney disease and its progression. Kidney Int. 2016;89(4):886–896. doi:10.1016/j.kint.2015.12.034
21. Morton J, Zoungas S, Li Q, et al. Low HDL cholesterol and the risk of diabetic nephropathy and retinopathy: results of the ADVANCE study. Diabetes Care. 2012;35(11):2201–2206. doi:10.2337/dc12-0306
22. Lanktree MB, Thériault S, Walsh M, Paré G. HDL Cholesterol, LDL Cholesterol, and Triglycerides as Risk Factors for CKD: a Mendelian Randomization Study. Am J Kidney Dis. 2018;71(2):166–172. doi:10.1053/j.ajkd.2017.06.011
23. Miao L, Min Y, Qi B, et al. Causal effect between total cholesterol and HDL cholesterol as risk factors for chronic kidney disease: a Mendelian randomization study. BMC Nephrol. 2021;22(1):35. doi:10.1186/s12882-020-02228-3
24. Schaeffner ES, Kurth T, Curhan GC, et al. Cholesterol and the risk of renal dysfunction in apparently healthy men. J Am Soc Nephrol. 2003;14(8):2084–2091. doi:10.1681/asn.V1482084
25. Liang X, Ye M, Tao M, et al. The association between dyslipidemia and the incidence of chronic kidney disease in the general Zhejiang population: a retrospective study. BMC Nephrol. 2020;21(1):252. doi:10.1186/s12882-020-01907-5
26. Zuo PY, Chen XL, Liu YW, Zhang R, He XX, Liu CY. Non-HDL-cholesterol to HDL-cholesterol ratio as an independent risk factor for the development of chronic kidney disease. Nutr Metab Cardiovasc Dis. 2015;25(6):582–587. doi:10.1016/j.numecd.2015.03.003
27. Wen J, Chen Y, Huang Y, et al. Association of the TG/HDL-C and Non-HDL-C/HDL-C Ratios with Chronic Kidney Disease in an Adult Chinese Population. Kidney Blood Press Res. 2017;42(6):1141–1154. doi:10.1159/000485861
28. Soto González A, Bellido D, Buño MM, et al. Predictors of the metabolic syndrome and correlation with computed axial tomography. Nutrition. 2007;23(1):36–45. doi:10.1016/j.nut.2006.08.019
29. Browning LM, Hsieh SD, Ashwell M. A systematic review of waist-to-height ratio as a screening tool for the prediction of cardiovascular disease and diabetes: 0·5 could be a suitable global boundary value. Nutr Res Rev. 2010;23(2):247–269. doi:10.1017/s0954422410000144
30. Ramspek CL, Evans M, Wanner C, et al. Kidney Failure Prediction Models: a Comprehensive External Validation Study in Patients with Advanced CKD. J Am Soc Nephrol. 2021;32(5):1174–1186. doi:10.1681/asn.2020071077
 © 2023 The Author(s). This work is published and licensed by Dove Medical Press Limited. The
full terms of this license are available at https://www.dovepress.com/terms
and incorporate the Creative Commons Attribution
- Non Commercial (unported, 3.0) License.
By accessing the work you hereby accept the Terms. Non-commercial uses of the work are permitted
without any further permission from Dove Medical Press Limited, provided the work is properly
attributed. For permission for commercial use of this work, please see paragraphs 4.2 and 5 of our Terms.
© 2023 The Author(s). This work is published and licensed by Dove Medical Press Limited. The
full terms of this license are available at https://www.dovepress.com/terms
and incorporate the Creative Commons Attribution
- Non Commercial (unported, 3.0) License.
By accessing the work you hereby accept the Terms. Non-commercial uses of the work are permitted
without any further permission from Dove Medical Press Limited, provided the work is properly
attributed. For permission for commercial use of this work, please see paragraphs 4.2 and 5 of our Terms.