Back to Journals » Infection and Drug Resistance » Volume 16
A Nomogram for Early Diagnosis of Community-Acquired Pneumonia Based on Bronchoalveolar Lavage Fluid Metabolomics
Authors Chen S, Su M, Lei W, Wu Z, Wu S, Liu J, Huang X, Chen G, Zhang Q, Zhong H, Rong F, Li X, Xiao Q ![]()
Received 21 December 2022
Accepted for publication 21 February 2023
Published 1 March 2023 Volume 2023:16 Pages 1237—1248
DOI https://doi.org/10.2147/IDR.S400390
Checked for plagiarism Yes
Review by Single anonymous peer review
Peer reviewer comments 2
Editor who approved publication: Professor Suresh Antony
Siqin Chen,1,* Minhong Su,2,* Wei Lei,1,* Zhida Wu,1 Shuhong Wu,1 Jing Liu,1 Xiaoyan Huang,1 Guiyang Chen,1 Qian Zhang,1 Hua Zhong,1 Fu Rong,1 Xi Li,1 Qiang Xiao1
1Pulmonary and Critical Care Medicine, Shunde Hospital, Southern Medical University (The First People’s Hospital of Shunde Foshan), Foshan, Guangdong, People’s Republic of China; 2Pulmonary and Critical Care Medicine, Zhujiang Hospital, Southern Medical University, Guangzhou, Guangdong, People’s Republic of China
*These authors contributed equally to this work
Correspondence: Qiang Xiao; Xi Li, Pulmonary and Critical Care Medicine, Shunde Hospital, Southern Medical University (The First People’s Hospital of Shunde Foshan), No. 1, Jiazi Road, Lunjiao Street, Shunde District, Foshan, Guangdong, 528300, People’s Republic of China, Tel +86-757-22318689 ; +86-757-22318690, Email [email protected]; [email protected]
Purpose: There is a high disease burden associated with community-acquired pneumonia (CAP) around the world. A timely and correct diagnosis of CAP can facilitate early treatment and prevent illness progression. The present study aimed to find some novel biomarkers of CAP by metabolic analysis and construct a nomogram model for precise diagnosis and individualized treatment of CAP patients.
Patients and Methods: 42 CAP patients and 20 controls were enrolled in this study. The metabolic profiles of bronchoalveolar lavage fluid (BALF) samples were identified by untargeted LC-MS/MS analysis. With a VIP score ≥ 1 in OPLS-DA analysis and P < 0.05, the significantly dysregulated metabolites were estimated as potential biomarkers of CAP, which were further included in the construction of the diagnostic prediction model along with laboratory inflammatory indexes via stepwise backward regression analysis. Discrimination, calibration, and clinical applicability of the nomogram were evaluated by the C-index, the calibration curve, and the decision curve analysis (DCA) estimated by bootstrap resampling.
Results: The metabolic profiles differed obviously between CAP patients and healthy controls, as shown by PCA and OPLS-DA plots. Seven metabolites significantly dysregulated in CAP were established: dimethyl disulfide, oleic acid (d5), N-acetyl-a-neuraminic acid, pyrimidine, choline, LPC (12:0/0:0) and PA (20:4/2:0). Multivariate logistic regression revealed that the expression levels of PA (20:4/2:0), N-acetyl-a-neuraminic acid, and CRP were associated with CAP. After being validated by bootstrap resampling, this model showed satisfactory diagnostic performance.
Conclusion: A novel nomogram prediction model containing metabolic potential biomarkers in BALF that was developed for the early diagnosis of CAP offers insights into the pathogenesis and host response in CAP.
Keywords: community-acquired pneumonia, biomarker, precision medicine, metabolomics, prediction model, logistic regression
Introduction
Despite the rapid development of new technology, community-acquired pneumonia (CAP) is one of the leading infectious causes of high mortality and morbidity around the world.1,2 Although the criteria of CAP diagnosis are well-defined and include specific symptoms, inflammation laboratory indicators, and pulmonary infiltration on a chest radiograph, there remains a demand for a better diagnostic method, in particular during early stages, when the symptoms and radiologic changes are inapparent,3 due to the complex pathophysiology and heterogeneity of the disease.2,4 Bedside, portable chest radiographies are available for severe cases or bedridden, immobile patients that can reveal lung inflammation and other changes, but in certain cases it can be difficult to provide high-quality evidence of pulmonary infection, for instance when patients suffer from heart failure or pleural effusion.5 Radiography is less suitable for frequent assessment of a patient to monitor disease development as exposure to radioactivity should be limited.6 Furthermore, if the diagnosis is delayed or incorrect, it may directly influence the treatment effect, aggravate the patient’s condition, or significantly contribute to the burden of antibiotic consumption.7,8 Clinical cases can present with symptoms and signs data that do not permit an accurate diagnosis, and etiological culture of pathogens residing in the lower respiratory tract is hard to succeed.9,10 Compared to the diversity and difficult detection of culprit pathogens, the host response to such infection is relative stable and consistent, and this is increasingly recognized as a feasible target for diagnosis and treatment development.11–13 Therefore, we aimed to identify biomarkers for CAP by metabolomic analysis of bronchoalveolar lavage fluid (BALF) samples.
Biomarkers can facilitate early diagnosis, prompt precision therapy, and may provide new insights into the pathophysiological changes in CAP patients.14,15 Procalcitonin, C-reactive protein (CRP), and other serum inflammatory markers have been used to diagnose CAP and assess treatment effects; however, none appear ideal. A recent study on novel biomarkers in CAP focused on molecular expression profiles, including genomics, metabolomics and proteomics.16,17 Metabolomics is rapidly gaining attention in many fields of biomedical research.18 Typically, the downstream of the biological system consists of small molecule metabolites, such as carbohydrates, amino acids, and lipids, which play a critical role in disease occurrence, oxidative stress, inflammation, signaling, and apoptosis.19 Serkova et al reported that the level of several metabolites altered during inflammatory illnesses.20 Another metabolomics study suggested that lipid metabolites are potential new biomarkers that differentiate CAP from other acute noninfective pulmonary diseases with high specificity and sensitivity.21 However, most of the studies are based on serum metabolomics, but a few are based on the metabolomic analysis of BALF derived from CAP patients.
Serum biomarkers present systemic inflammatory response and metabolic changes but cannot detect the precise origin of the changes. However, BALF metabolomics provides a relevant and reliable signature about CAP that can be used to identify new biomarkers for CAP diagnosis. Moreover, bronchoalveolar lavage can provide samples as well as an effective treatment for patients. Some studies analyzed the metabolomic profile of acute lung diseases. Zheng et al demonstrated a specific lower airway lipid composition in CAP individuals based on the analysis of BALF lipidome profiles.22 However, only little is known about the application of metabolomics to the diagnosis of CAP.
In this study, untargeted LC-MS/MS analysis was conducted to identify new CAP-related biomarkers in BALF samples. Based on metabolic biomarkers and clinical features, a predictive model for the early diagnosis of CAP was developed, which was displayed as a nomogram, a user-friendly graphic depiction of event probabilities.
Materials and Methods
Study Populations
In this study, 62 individuals were enrolled, including 42 CAP patients and 20 controls
without active infection who were treated for other pulmonary conditions. The diagnostic criteria for CAP are as follows: clinical manifestations of pneumonia started in communities (recent coughing, expectoration, or exacerbated symptoms of the previous respiratory illnesses, with or without chest pain, dyspnea, or hemoptysis; fever; evidences of pulmonary consolidation and/or moist rales in auscultation; peripheral white blood cell (WBC) count > 10*109/L or < 4*109/L); a new infiltrate of lungs on chest radiograph.23,24 The enrolled patients in our study lacked etiological diagnosis due to the difficulty of successful etiological culture. The pathogens in the lower respiratory tract of the patients included in this study were most likely bacteria, as the patients clinically improved after receiving appropriate antibacterial drugs. Meanwhile, three routine sputum smear tests for acid-fast bacilli, a sputum TB-DNA test and sputum fungus culture were performed for all patients. Patients without CAP who had pulmonary nodules of unknown nature requiring pathological examination by tracheoscopic lung biopsy were included as controls, all of which were ultimately determined to be non-neoplastic or inactively infectious. Patients with nosocomial infection, non-infectious interstitial lung disease, malignancy, active pulmonary tuberculosis, and severe immunosuppression were excluded. The clinical features were assimilated from the hospital’s electronic medical record system, including demographic characteristics (age, gender, and smoking history) and laboratory indexes. The outcome variable of the event was the diagnosis of CAP. This study complied with the Declaration of Helsinki and the Institutional Human Research and Ethics Committee of Shunde Hospital of the Southern Medical University approved this study. All participants were informed about the purpose of the study and informed consent was obtained from all participants before the collection of any data. Any individual who declined to provide a sample or refused cooperation following initial consent was excluded from further participation without consequences to those individuals.
BALF Sample Preprocessing
An equivalent of 50 mg of BALF sample was combined with 1000 μL of extract solvent (acetonitrile-methanol-water, 2:2:1, containing internal standard) and mixed for 30s. Mixture was homogenized at 45 Hz for 4 minutes and sonicated for 5 minutes in ice water. Three homogenization and sonication cycle were performed, followed by incubation at −20 °C for 1 h and centrifugation at 12,000 rpm and 4 °C for 15 minutes. The supernatants were collected into LC-MS vials, which were stored at −80 °C until untargeted LC-MS analysis. Mixing an equivalent aliquot of the supernatants from all samples produced the quality control (QC) sample.
Untargeted LC-MS/MS Analysis and Metabolite Identification
LC-MS/MS analysis was performed using a UPLC HSS T3 column (2.1 mm × 100 mm, 1.8 μm) on a UHPLC system (1290, Agilent Technologies) coupled with Q Exactive (Orbitrap MS, Thermo). The mobile phase A for positive and negative mode was 0.1% formic acid aqueous solution and 5 mmol/L ammonium acetate in water respectively, while the mobile phase B was acetonitrile. We set the elution gradient as follows: 0 min, 1% B; 1 min, 1% B; 8 min, 99% B; 10 min, 99% B; 10.1 min, 1% B; 12 min, 1% B. The injection volume was 2 μL and the flow rate was set to 0.5 mL/min. The QE mass spectrometer was used to acquire MS/MS spectra on an information-dependent basis (IDA)t. The conditions of ESI source were as follows: capillary temperature was 320 °C, sheath gas flow rate was 45 Arb, aux gas flow rate was 15 Arb, full ms resolution was 70,000, MS/MS resolution was 17,500, collision energy was 20/40/60 eV, and the spray voltage of positive and negative mode was 3.8 kV and −3.1 kV respectively.
MS raw data were converted to the mzML files by ProteoWizard and processed by R package XCMS (version 3.2). The samples containing metabolites < 50% in a group (QC was also a group) were filtered. Then, the data of each sample were normalized to those of the internal standard and the missing values were replaced by half of the minimums in the dataset. After preprocessing, a data matrix consisting of the retention time (RT), mass-to-charge ratio (m/z) values, and peak intensity was generated and peak annotation was performed by OSI-SMMS (version 1.0, Dalian Chem Data Solution Information Technology Co. Ltd) with an in-house MS/MS database.
Multivariate Data Analysis
The unsupervised dimensionality reduction method principal component analysis (PCA) was used to preliminarily visualize the difference between the samples of two groups. Partial least squares discriminant analysis (PLS-DA) is a supervised dimensionality reduction method to distinguish the two groups. Orthogonal partial least squares discriminant analysis (OPLS-DA) is an extension of PLS-DA after adding an orthogonal signal correction (OSC) filter. It was employed to further distinguish two groups and identify variables differentially expressed by variable importance in projection (VIP) score. The OPLS-DA model was further validated by cross-validation analysis of variance (CV-ANOVA), R2Y, and Q2 values. In addition, t-test was used to select differential metabolites; those with P-value < 0.05 in t-test and VIP ≥ 1 in OPLS-DA were supposed to be potential metabolites that could discriminate CAP from controls. These analyses were carried out by R package (http://www.r-project.org/).
Statistical Analysis
The subjects were divided into two groups according to the clinical outcomes: healthy individuals and pneumonia patients. All laboratory findings were classified into categorical variables according to normal range, and the expression of metabolites identified in the alveolar lavage fluid was classified into binary variables according to their optimal cutoff values of the receiver operating characteristic (ROC) analyses.25 The categorical variables were described as counts and percentages. Firstly, the chi-square test was used to compare the demographic characteristics (age, gender, and smoking history) between groups. Then, the nomogram for predicting CAP diagnosis was developed in three steps: (1) performing univariate logistic regression analysis with one dummy categorical variable of inflammation-related laboratory tests and metabolites at a time; (2) fitting a multivariate logistic regression model with backward stepwise regression, including variables with P < 0.05 in the univariate logistic regression analyses; (3) constructing a nomogram based on the result of step (2).26 Moreover, the predictive performance of the nomogram, in terms of discrimination, calibration, and clinical utility, would be validated by bootstrap resampling with 1000 replications. The ability to distinguish healthy individuals from CAP was assessed by the area under the ROC curve (AUC). The calibration was estimated by the Hosmer–Lemeshow test and the comparison between predicted and observed probabilities of CAP diagnosis. Decision curve analysis (DCA) was employed to assess the clinical utility of the prediction nomogram. Analysis above would be realized by SPSS 22.0 (IBM Inc., Chicago, IL, USA) and R software V.3.6.2.
Results
Demographic and Clinical Characteristics of Participants
42 CAP patients and 20 controls were enrolled in this study. The demographic characteristics of the subjects are presented in Table 1. The subjects in our study were 54.69 ± 16.84 years old. None of the individuals had diabetes. There were no significant differences in terms of age, sex, and smoking history.
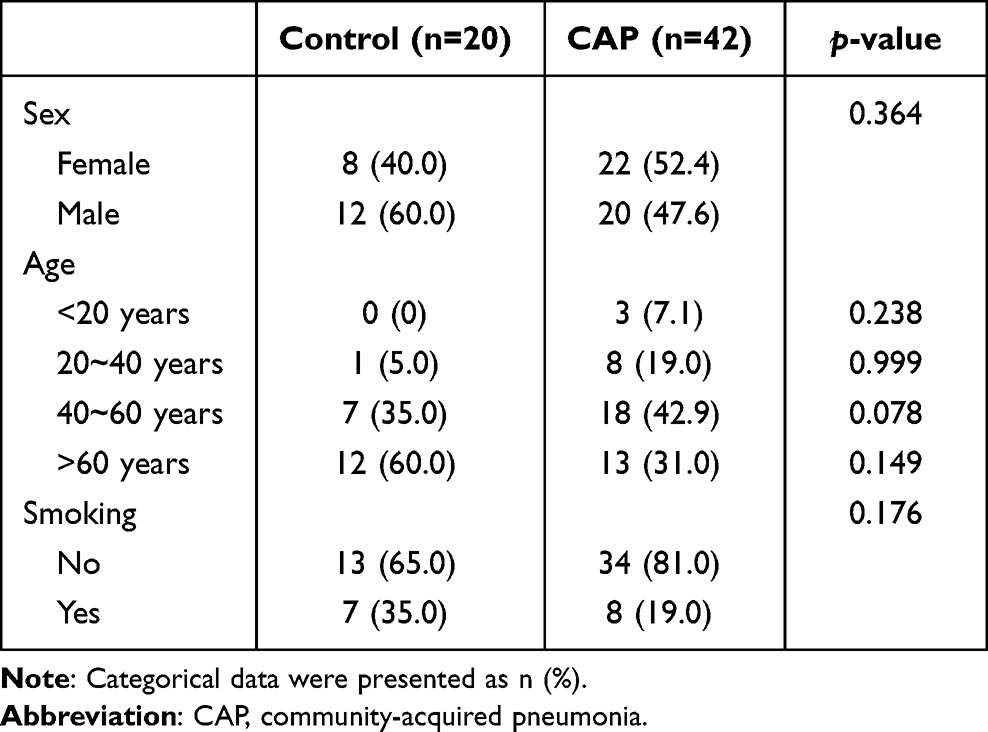 |
Table 1 Demographical Features of Included Subjects |
Metabolomic Profiling of BALF Samples
From a total of 62 BALF samples, there were 132 and 20 metabolites detected by untargeted LC-MS/MS analysis in positive and negative mode respectively. These metabolites were further identified by matching their retention times (RTs) and MS/MS spectra with those obtained from the metabolomics database. PCA performed on all subjects showed that most of the samples from controls and CAP patients clustered separately in positive and negative mode (Figure 1a and b). On the PCA plot, QC samples were tightly clustered, indicating consistent analytical repeatability and stability of the instruments. As a supervised method, OPLS-DA further revealed the differences between the metabolic profiles of controls and CAP patients (Figure 1c and d). Univariate analysis including Student’s t-test and fold-change analysis identified 49 statistically significant metabolites, which was shown in the volcano plot (Figure 2a). Under the condition that VIP score ≥ 1 and P < 0.05, seven significantly dysregulated metabolites were selected as the potential biomarkers for CAP diagnosis (Table 2). The relative intensity of dimethyl disulfide, oleic acid (d5), N-acetyl-a-neuraminic acid, pyrimidine, and choline was increased in CAP patients, and LPC (12:0/0:0) and PA (20:4/2:0) was decreased. A heatmap about the relative intensity of the above metabolites in all samples is displayed in Figure 2b.
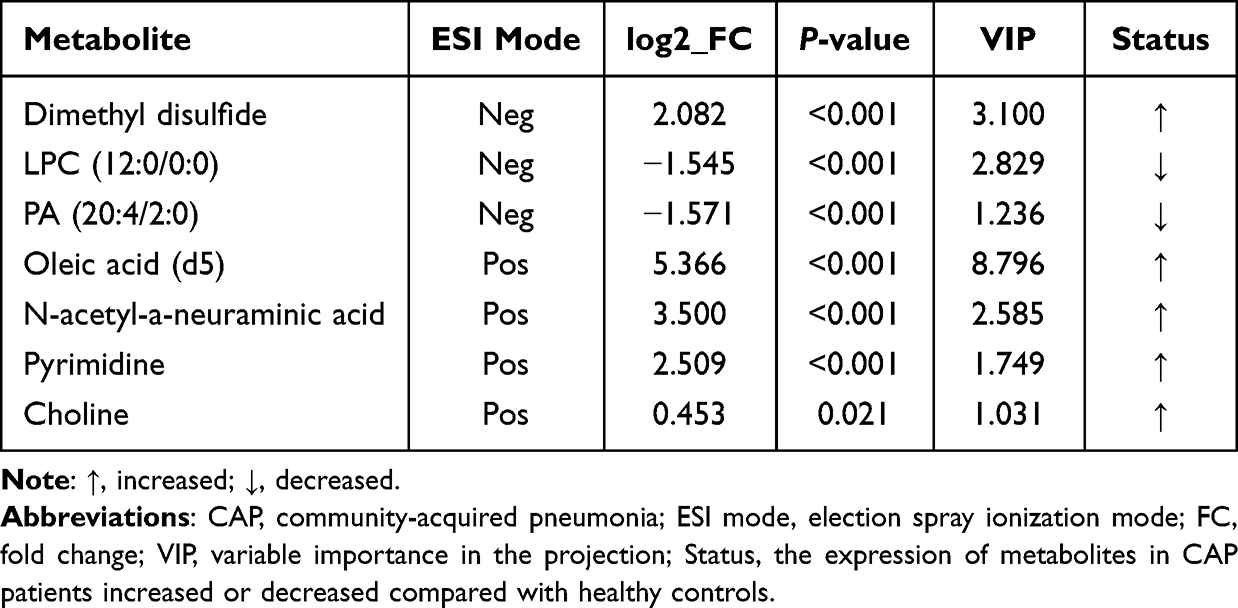 |
Table 2 Seven Metabolites Discriminating CAP from Controls |
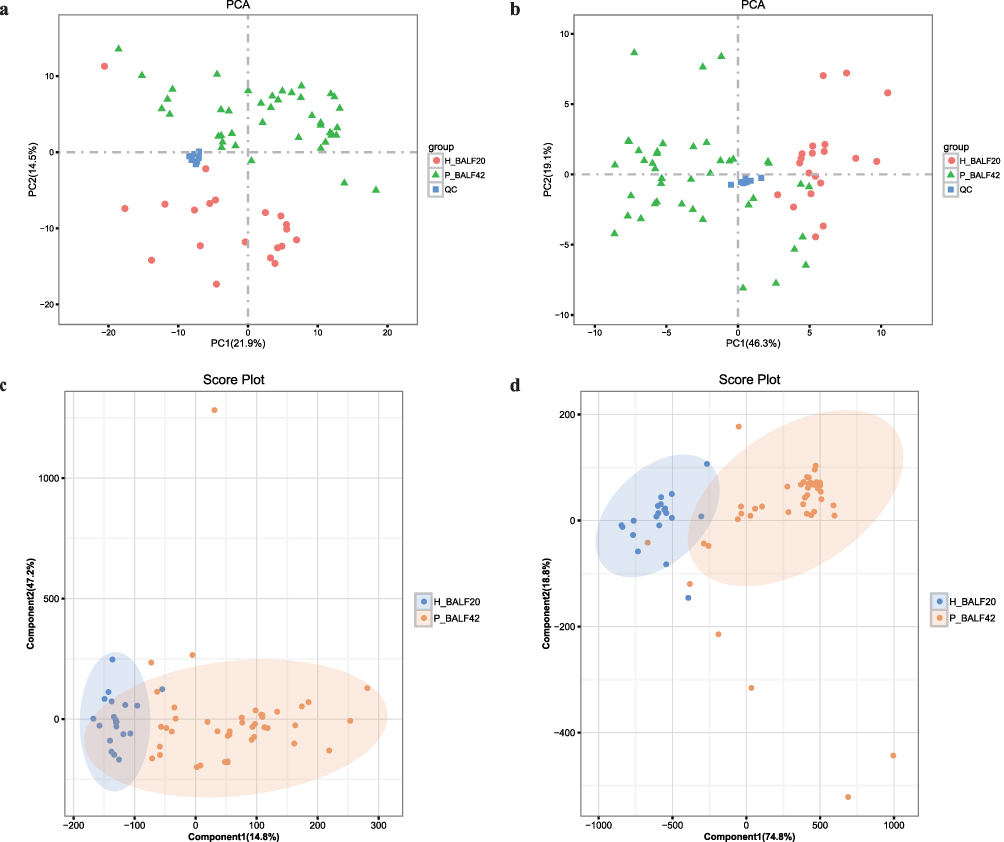 |
Figure 1 Multivariate statistical analysis of BALF samples. (a) PCA score plot of metabolic profiles in BALF samples of positive mode data. PCA score plot colored according to the sample group: green triangles, CAP; red circles, healthy control; blue squares, QC samples. (b) PCA score plot of negative mode data. (c) OPLS-DA score plot of positive mode data. Red circles, CAP; blue circles, healthy control. (d) OPLS-DA score plot of negative mode data. |
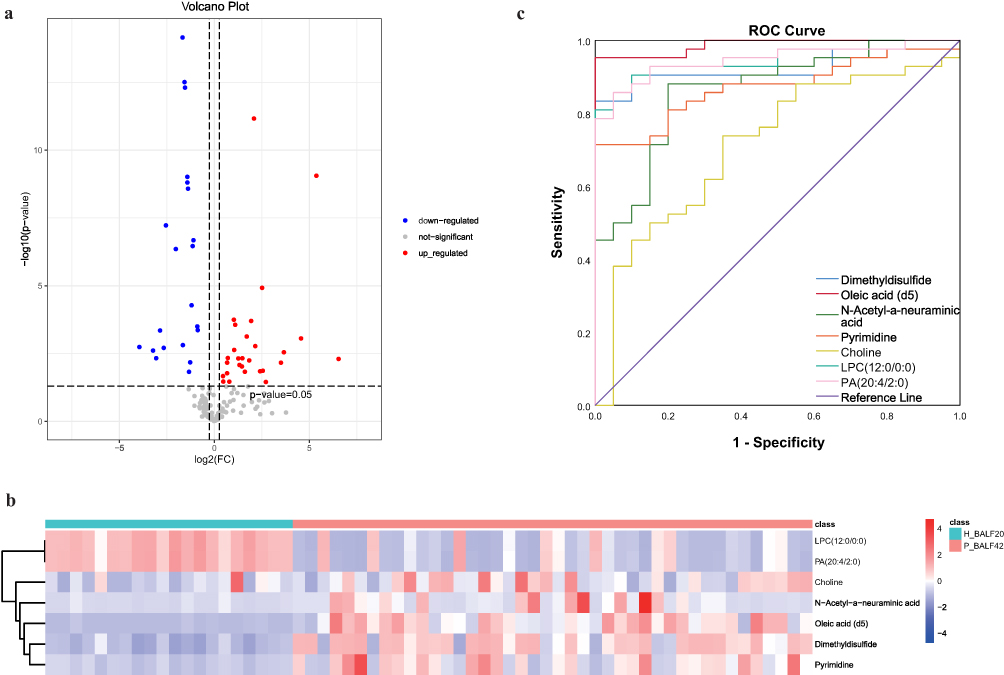 |
Figure 2 Metabolic profiles of CAP patients and controls. (a) Volcano plot shows statistically significant metabolites in positive and negative modes between two groups based on P-value from Student’s t-test and fold-change value. Red circles, significantly upregulated differential metabolites in CAP group; blue circles, significantly downregulated; gray circles, insignificant differential metabolites. (b) Heatmap of the seven significantly different metabolites between CAP and controls with VIP ≥ 1 and P < 0.05. The abscissa represents samples (blue, controls; red, CAP), and the ordinate represents metabolites. The color from blue to red indicates the expression abundance of metabolites from low to high. (c) ROC curve analysis of various metabolite parameters for discrimination of CAP from controls. |
Diagnostic Performance of Metabolites
ROC analysis was used to investigate whether the seven metabolites could effectively distinguish CAP patients from controls (Table 3 and Figure 2c). All metabolites exhibited a satisfactory performance in diagnosing CAP with AUC > 0.7, indicating that they could serve as new biomarkers for CAP diagnosis. The expression of these metabolites was converted into categorical variables along with relevant laboratory indexes, according to the optimal cutoff value and the reference range, which would be included in the construction of the next prediction model (Table S1).
 |
Table 3 ROC Curve Analysis Results of Metabolites for Diagnosing CAP |
Construction and Validation of a Predictive Model
In the univariate logistic regression analysis (Table 4), variables, such as WBC, CRP, PCT, ESR, PA (20:4/2:0), N-acetyl-a-neuraminic acid and choline, were statistically significant, which were then subjected to multivariate logistic regression analysis. Finally, the predictive model showed that the following three variables were significantly related with CAP: PA (20:4/2:0) (OR=0.007, 95% CI: 0–0.191), N-acetyl-a-neuraminic acid (OR=45.803, 95% CI: 2.213–948.054), and CRP (OR=32.101, 95% CI: 1.515–680.077) (Table 5). In order to make the model convenient for clinical application, a nomogram for CAP diagnosis was constructed based on the result of multivariate logistic regression analysis (Figure 3a). This nomogram served as a new scoring system from which the individual probability of CAP was obtained according to the patient’s profile. This model had good discrimination ability, with an AUC of 0.984 (Figure 3b). The bias-corrected C-index by bootstrap resampling was 0.970, indicating good internal validation. The Hosmer-Lemeshow test (χ2=0.711, P=0.701) and the calibration curve obtained from bootstrap resampling suggested satisfactory calibration (Figure 3c). As for the clinical utility of this diagnostic nomogram, decision curve analysis (DCA) showed that patients with CAP benefit more from using this nomogram than from the situation of treating all or none at the highest threshold probability (Figure 3d).
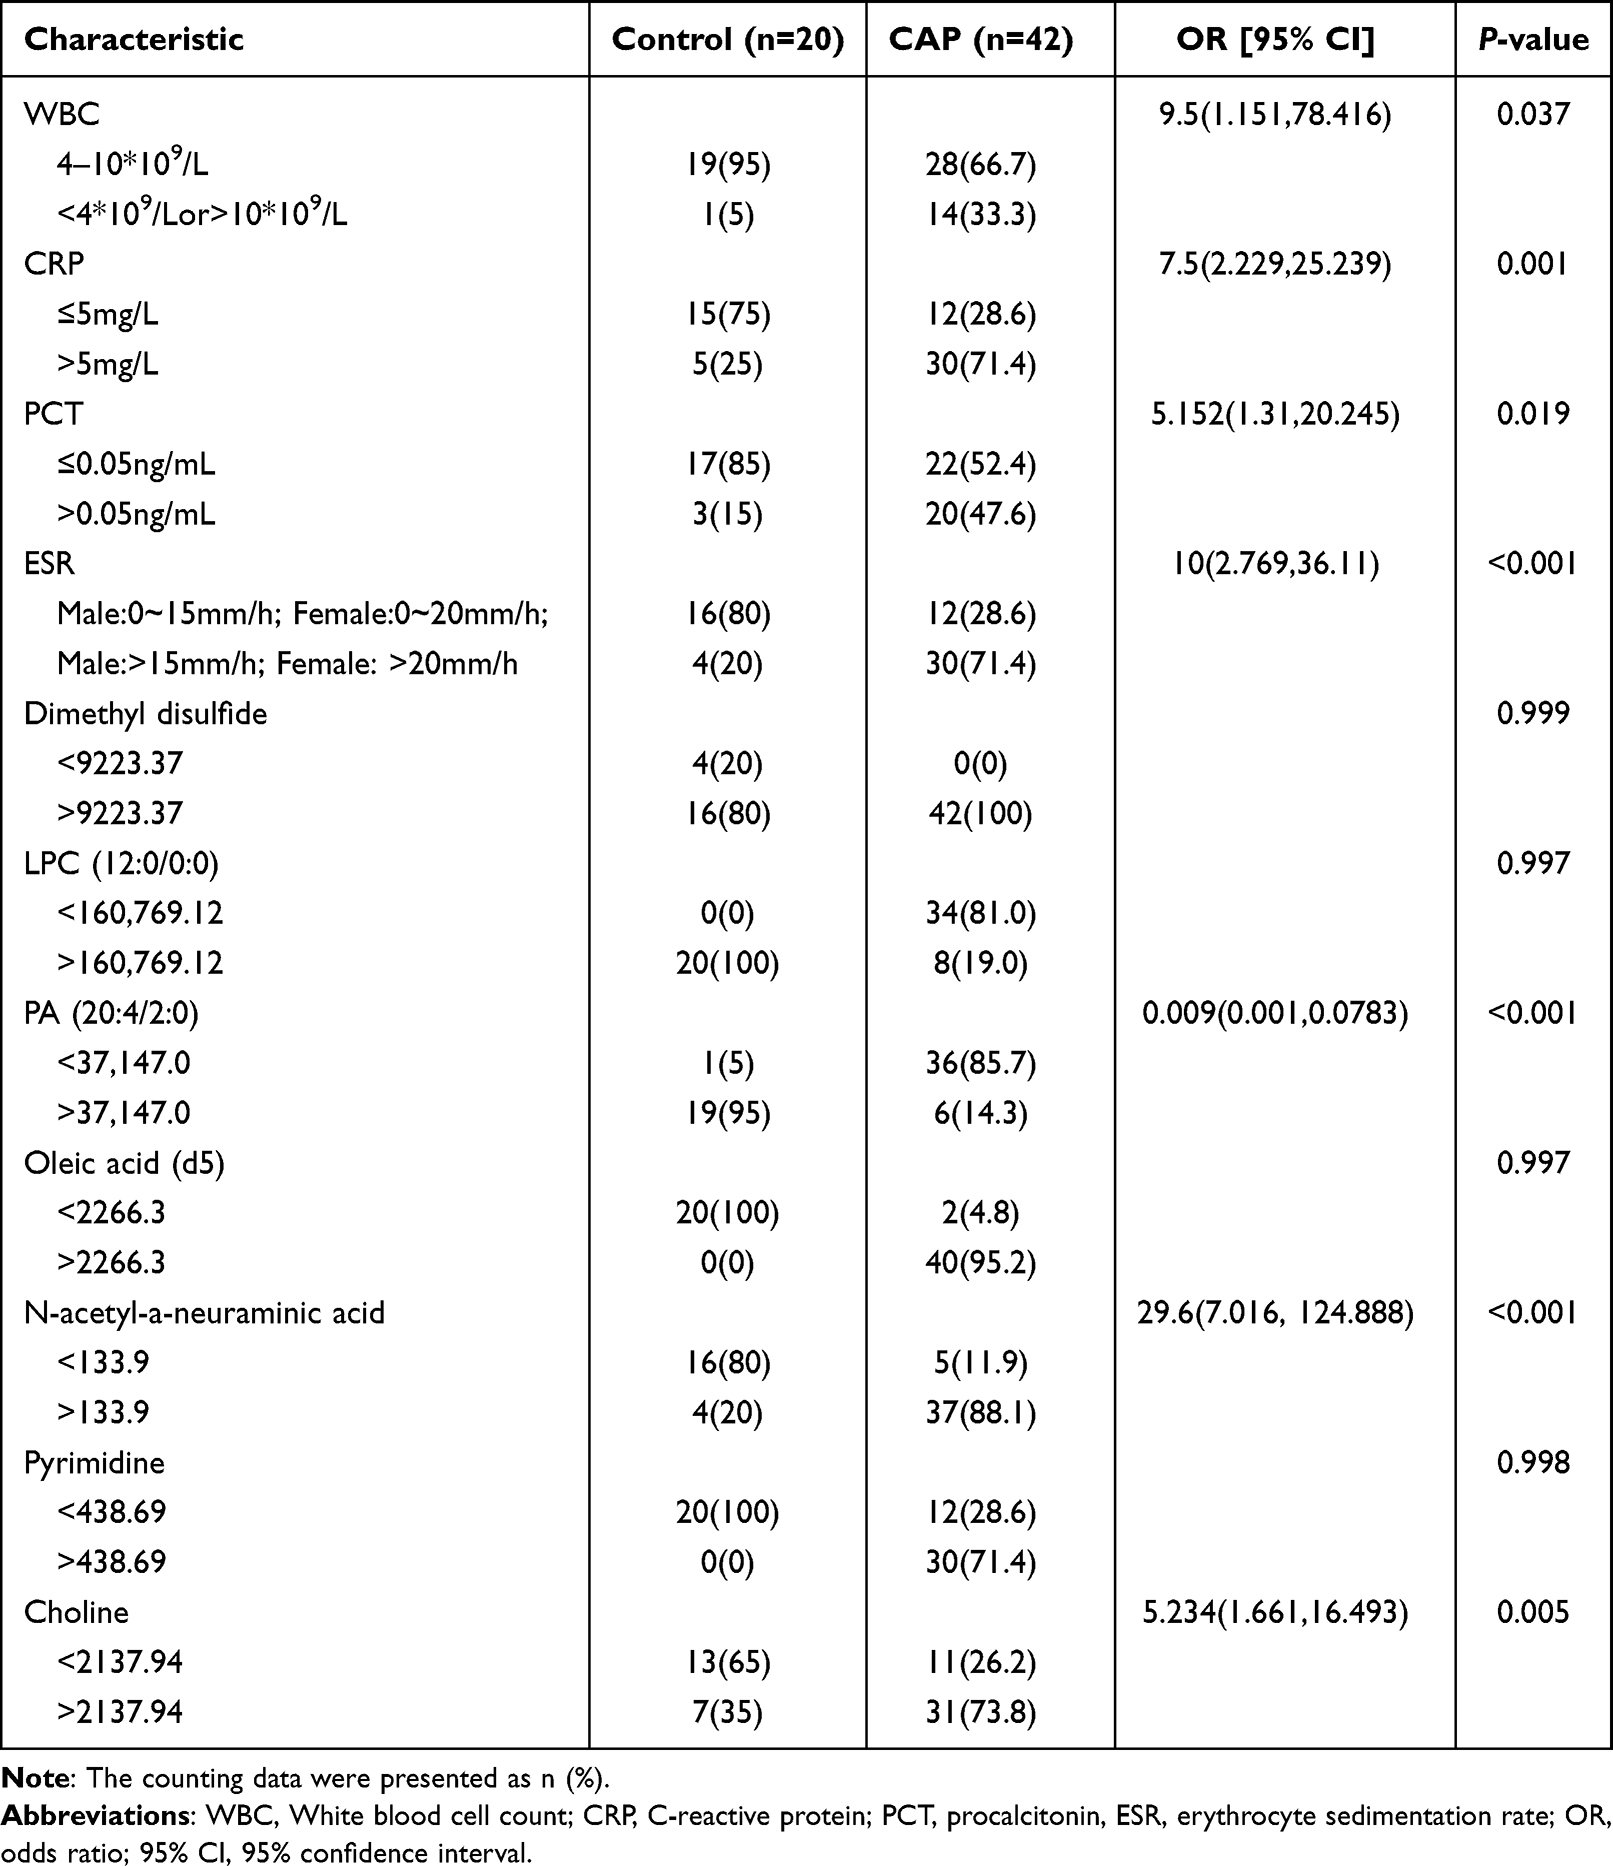 |
Table 4 Characteristics of Healthy Controls and CAP Patients [n (%)] |
 |
Figure 3 Diagnostic nomogram for CAP and its validation. (a) Diagnostic nomogram for distinguishing CAP patients from healthy individuals. (b) ROC curves of the nomogram model with a true positive rate (sensitivity) as the ordinate and a false-positive rate (1-specificity) as the abscissa. (c) Validity of the predictive performance of the nomogram in estimating the risk of CAP by 1000 bootstrap resampling. (d) DCA of the diagnostic nomogram. |
 |
Table 5 Results of Multivariate Logistic Regression Model to the Diagnosis of CAP |
Discussion
In this study, we identified seven differential metabolites in BALF samples derived from 42 CAP patients and 20 controls by untargeted LC-MS/MS analysis. These metabolites were potential biomarkers of CAP with considerable AUC in ROC analysis, and they were included in the univariate analysis along with an inflammatory index. The statistically significant variables were further included in the multivariate logistic regression analysis. In the end, a nomogram model with three risk factors of CAP was built up: PA (20:4/2:0), N-acetyl-a-neuraminic acid, and CRP. All three represented objective indicators, avoiding the inclusion of variables with strong subjectivity, which will assist less-experienced clinicians to identify CAP. The internal validation of bootstrap resampling showed that this predictive model had good discrimination, validation, and clinical applicability in CAP diagnosis.
Different from genomics, transcriptomics, and proteomics, only metabolomics can reveal the final downstream products in the inflammation process.27,28 Metabolomics analysis, a thriving technology, can sensitively and accurately capture complex disease pathological changes and is increasingly used in recent studies. Ning et al demonstrated that serum metabolomics analysis could be applied as a tool to identify the signature related to CAP.29 Other studies identified a number of urinary, serum, and BALF metabolites with the potential to diagnose CAP.
The metabolites found in our study are mainly reflected in the lipid profile, which is in line with previous studies.22,29,30 Salazar et al used a combined OMICS screening approach from plasma and serum samples to obtain the protein and metabolome profiles associated with the severity of CAP.30 The study found that the concentration of LPC decreases as pneumonia severity increases, which was in agreement with previous findings.31–35 In addition to LPC, Li et al found many other differently expressed metabolites with significant correlations with the inflammatory index, including PA in the class of glycerophospholipids.36 The glycerophospholipids participate in the composition of the cell membrane and regulate various biological processes, indicating the activation of immunity.37,38 The current findings supported by previous studies showed that LPC, PA, and other metabolites have the potential to be the diagnostic markers of CAP and the assessment tools of CAP severity.
Furthermore, metabolomics analysis is based on the molecular level with high specificity and sensitivity, but the diagnosis only made by this variable is not comprehensive, accurate, and personalized. The recognition of early signs and symptoms of CAP varies among clinicians and the relatively subjective symptom descriptions or physical examinations used for early diagnosis can vary. A nomogram prediction model based on a combination of different objective risk factors can help clinicians easily to make timely, precise, and individualized decisions. Recently, studies based on the construction of regression prediction models are rising. Chen et al established a nomogram to predict fatal outcomes of patients with COVID-19 according to individual characteristics, symptoms, and laboratory indicators.39 Fei Y analyzed the factors of patients with severe pneumonia to establish a prognostic assessment model.40
Different from other studies, the laboratory indexes related to inflammation in this study were considered to be the risk factors for CAP; also, BALF metabolites differently expressed between the two groups were included in the construction of the nomogram prediction model for the diagnosis of CAP. The clinical outcomes effectuated by this model were more precise, comprehensive, and individualized than other diagnostic criteria.
Nevertheless, the current study had some limitations. Firstly, the number of samples may be insufficient, which may explain the wide 95% CIs of ORs in the multivariate logistic regression analysis. Secondly, except for the metabolite concentration variable, only laboratory indexes were involved in the regression analysis in this study, which may weaken the prediction ability of the diagnostic model. To avoid this, we aim to incorporate more risk factors of CAP while improving the predictive model in the near future, such as symptoms, signs, and other laboratory indicators. Furthermore, it remains so far unknown whether or to which extent comorbidities and the severity of the disease will affect the composition and expression of the lower respiratory tract metabolites, and whether the metabolic markers are completely specific to CAP. To ensure the accuracy of the reported results, future studies with a larger sample size are necessary to clarify the effects of comorbidities and severity of patients and, if possible, to identify subgroups of other respiratory diseases for comparative analysis.
The recent progress of molecular diagnosis technology has revealed an increase in frequency of viral infectious CAP.41 When properly diagnosed, viral CAP and bacterial CAP should be differently treated. Wrong treatment can not only aggravate the disease, but inappropriate administration of antibiotics can also lead to antibiotic resistance. In our study, we did not specifically determine whether the lower respiratory tract metabolic profiles are different between viral CAP patients and bacterial CAP patients. The enrolled patients in our study lacked an etiological diagnosis as bacteriological culture failed, but we consider the pathogens in question to be of bacterial nature, as all patients clinically improved after receiving appropriate antibacterial drugs. The differential metabolites mainly reflect the changes of respiratory secretions in the early stage of host infection. More attention should be paid to the host response of acute CAP induced by infection with different pathogens in subsequent studies.
Due to the small sample size, data were not sufficient for the external validation of the fitted model. Thus, we used the internal validation by bootstrap resampling and it showed that the C-index, the calibration curve and clinical applicability were satisfactory. However, before applying this diagnosis prediction model to clinical practice, external verification, preferably in a multicenter study, is highly recommended. Admittedly, not all patients are suitable for BAL, but for those that tolerate the procedure,42,43 this nomogram will help their diagnosis, especially when symptoms are inconclusive and a differential diagnosis according to radiographic and other examination results is difficult.
Furthermore, since this was a retrospective and observational study, the validity of our data is limited and requires prospective studies to compare the estimated outcome using the diagnosis nomogram in clinical practice with prospective data. Moreover, the BALF samples of CAP convalescence phase were not obtained for further analyses; hence, the change in metabolite concentration over time was unknown, which might be predictive of CAP pathogenesis, disease progression, or therapeutic effect.
We observed that the BALF metabolic profile differed significantly in CAP patients compared to controls, which we interpret to mean that BALF metabolites have the potential to be used as CAP markers. The development of clinical prediction models is a newly emerging and quantitative diagnostic method,44–46 which we applied here to build a nomogram for more accurate diagnosis of (early) CAP. The approach reported here may evolve into other directions for more accurate diagnosis, disease classification, and targeted treatment of a variety of pulmonary diseases. For CAP, the first steps are taken, but the data are still preliminary and at present we envisage it can be used as a supplementary diagnostic method, especially in cases where a classical diagnosis is difficult. Before our nomogram for CAP can be more widely applied in clinical practice, the procedure must be tested with multiple studies and larger sample sizes derived from a more diverse patient population.
Conclusion
We found that the lung metabolome was altered during an acute respiratory disease of unknown etiology but most likely bacterial, and we developed a nomogram prediction model based on metabolic markers for CAP diagnosis. Although BAL is not applicable to every patient, we envisage that this nomogram can be helpful as a supplementary diagnosis for CAP. Although future research is needed to reach a higher accuracy in CAP diagnosis by this approach, the reported findings provide new clues for future research to improve CAP diagnosis, disease severity assessment, and targeted therapy.
Abbreviations
CAP, community-acquired pneumonia; BALF, bronchoalveolar lavage fluid; OPLS-DA, orthogonal partial least squares discriminant analysis; PCA, Principal component analysis; ESI mode, election spray ionization mode; FC, fold Change; VIP, variable importance in the projection; ROC curve analysis, receiver operating characteristic curve analysis; AUC, area under the curve; DCA, the decision curve analysis; WBC, White blood cell count; CRP, C-reactive protein; PCT, procalcitonin; ESR, erythrocyte sedimentation rate; OR, odds ratio; 95% CI, 95% confidence interval; β, regression coefficient of the equation; S.E., standard error; OR, odds ratio.
Acknowledgments
This work was supported by grants from China Postdoctoral Science Foundation (2020M670014ZX), Guangdong Basic and Applied Basic Research Foundation (2019A1515110787, 2020A1515110973), Young Innovative Talents Project of Colleges and Universities in Guangdong Province (2020KQNCX014), Foshan Science and Technology Innovation Project (FS0AA-KJ218-1301-0014), Medical Scientific Research Foundation of Guangdong Province (B2019033), Research launch project of Shunde Hospital of Southern Medical University (SRSP2019003).
Disclosure
The authors report no conflicts of interest in this work.
References
1. Wunderink RG, Waterer GW, Solomon CG. Community-acquired pneumonia. N Engl J Med. 2014;370(19):1863. doi:10.1056/NEJMcp1214869
2. Franco J. Community-acquired Pneumonia. Radiol Technol. 2017;88(6):621–636.
3. Maughan BC, Asselin N, Carey JL, et al. False-negative chest radiographs in emergency department diagnosis of pneumonia. R I Med J. 2014;97(8):20–23.
4. Huang Y, Liu A, Liang L, et al. Diagnostic value of blood parameters for community-acquired pneumonia. Int Immunopharmacol. 2018;64:10–15. doi:10.1016/j.intimp.2018.08.022
5. Toy D, Siegel MD, Rubinowitz AN. Imaging in the intensive care unit. Semin Respir Crit Care Med. 2022;43(6):899–923. doi:10.1055/s-0042-1750041
6. Scott J, Waite S, Napolitano A. Restricting daily chest radiography in the intensive care unit: implementing evidence-based medicine to decrease utilizationt. J Am Coll Radiol. 2021;18(3Pt A):354–360. doi:10.1016/j.jacr.2020.05.035
7. Kaziani K, Sotiriou A, Dimopoulos G. Duration of pneumonia therapy and the role of biomarkers. Curr Opin Infect Dis. 2017;30(2):221–225. doi:10.1097/QCO.0000000000000351
8. Genné D, Kaiser L, Kinge TN, Lew D. Community-acquired pneumonia: causes of treatment failure in patients enrolled in clinical trials. Clin Microbiol Infect. 2003;9(9):949–954. doi:10.1046/j.1469-0691.2003.00679.x
9. Seo H, Cha SI, Shin KM, et al. Community-acquired pneumonia with negative chest radiography findings: clinical and radiological features. Respiration. 2019;97(6):508–517. doi:10.1159/000495068
10. Rendon DR, Shiau J, Sherman SV. Lobar pneumonia presenting as fever, headaches, and a negative chest radiograph. Am J Med. 2023. doi:10.1016/j.amjmed.2022.12.022
11. Ravi LI, Li L, Sutejo R, et al. A systems-based approach to analyse the host response in murine lung macrophages challenged with respiratory syncytial virus. Bmc Genom. 2013;14:190. doi:10.1186/1471-2164-14-190
12. Kash JC, Taubenberger JK. The role of viral, host, and secondary bacterial factors in influenza pathogenesis. Am J Pathol. 2015;185(6):1528–1536. doi:10.1016/j.ajpath.2014.08.030
13. Mizgerd JP. Acute lower respiratory tract infection. N Engl J Med. 2008;358(7):716–727. doi:10.1056/NEJMra074111
14. Sungurlu S, Balk RA. The role of biomarkers in the diagnosis and management of pneumonia. Clin Chest Med. 2018;39(4):691–701. doi:10.1016/j.ccm.2018.07.004
15. Salluh J, Souza-Dantas VC, Póvoa P. The current status of biomarkers for the diagnosis of nosocomial pneumonias. Curr Opin Crit Care. 2017;23(5):391–397. doi:10.1097/MCC.0000000000000442
16. Scicluna BP, Klein KP, van Vught LA, et al. A molecular biomarker to diagnose community-acquired pneumonia on intensive care unit admission. Am J Respir Crit Care Med. 2015;192(7):826–835. doi:10.1164/rccm.201502-0355OC
17. Severino P, Silva E, Baggio-Zappia GL, et al. Patterns of gene expression in peripheral blood mononuclear cells and outcomes from patients with sepsis secondary to community acquired pneumonia. PLoS One. 2014;9(3):e91886. doi:10.1371/journal.pone.0091886
18. Schuetz P, Wolbers M, Christ-Crain M, et al. Prohormones for prediction of adverse medical outcome in community-acquired pneumonia and lower respiratory tract infections. Crit Care. 2010;14(3):R106. doi:10.1186/cc9055
19. Stringer KA, McKay RT, Karnovsky A, Quémerais B, Lacy P. Metabolomics and Its application to acute lung diseases. Front Immunol. 2016;7:44. doi:10.3389/fimmu.2016.00044
20. Serkova NJ, Standiford TJ, Stringer KA. The emerging field of quantitative blood metabolomics for biomarker discovery in critical illnesses. Am J Respir Crit Care Med. 2011;184(6):647–655. doi:10.1164/rccm.201103-0474CI
21. To KK, Lee KC, Wong SS, et al. Lipid metabolites as potential diagnostic and prognostic biomarkers for acute community acquired pneumonia. Diagn Microbiol Infect Dis. 2016;85(2):249–254. doi:10.1016/j.diagmicrobio.2016.03.012
22. Zheng Y, Ning P, Luo Q, et al. Inflammatory responses relate to distinct bronchoalveolar lavage lipidome in community-acquired pneumonia patients: a pilot study. Respir Res. 2019;20(1):82. doi:10.1186/s12931-019-1028-8
23. Chinese Thoracic Society. Guidelines for the diagnosis and treatment of Chinese adult community-acquired pneumonia (2016). Chin J Tuberculosis Respir Dis. 2016;39(4):253–279.
24. Mandell LA, Wunderink RG, Anzueto A, et al. Infectious Diseases Society of America/American Thoracic Society consensus guidelines on the management of community-acquired pneumonia in adults. Clin Infect Dis. 2007;44(Suppl 2):S27–S72. doi:10.1086/511159
25. Wang S, Tian S, Li Y, et al. Development and validation of a novel scoring system developed from a nomogram to identify malignant pleural effusion. Ebiomedicine. 2020;58:102924. doi:10.1016/j.ebiom.2020.102924
26. Liu C, Li L, Song K, et al. A nomogram for predicting mortality in patients with COVID-19 and solid tumors: a multicenter retrospective cohort study. J Immunother Cancer. 2020;8(2):e001314. doi:10.1136/jitc-2020-001314
27. Mirnezami R, Kinross JM, Vorkas PA, et al. Implementation of molecular phenotyping approaches in the personalized surgical patient journey. Ann Surg. 2012;255(5):881–889. doi:10.1097/SLA.0b013e31823e3c43
28. Su L, Huang Y, Zhu Y, et al. Discrimination of sepsis stage metabolic profiles with an LC/MS-MS-based metabolomics approach. BMJ Open Respir Res. 2014;1(1):e56. doi:10.1136/bmjresp-2014-000056
29. Ning P, Zheng Y, Luo Q, et al. Metabolic profiles in community-acquired pneumonia: developing assessment tools for disease severity. Crit Care. 2018;22(1):130. doi:10.1186/s13054-018-2049-2
30. Gesell Salazar M, Neugebauer S, Kacprowski T, et al. Association of proteome and metabolome signatures with severity in patients with community-acquired pneumonia. J Proteomics. 2020;214:103627. doi:10.1016/j.jprot.2019.103627
31. Neugebauer S, Giamarellos-Bourboulis EJ, Pelekanou A, et al. Metabolite profiles in sepsis: developing prognostic tools based on the type of infection. Crit Care Med. 2016;44(9):1649–1662. doi:10.1097/CCM.0000000000001740
32. Ferrario M, Cambiaghi A, Brunelli L, et al. Mortality prediction in patients with severe septic shock: a pilot study using a target metabolomics approach. Sci Rep. 2016;6:20391. doi:10.1038/srep20391
33. Langley RJ, Tsalik EL, van Velkinburgh JC, et al. An integrated clinico-metabolomic model improves prediction of death in sepsis. Sci Transl Med. 2013;5(195):195r. doi:10.1126/scitranslmed.3005893
34. To KK, Lee KC, Wong SS, et al. Lipid mediators of inflammation as novel plasma biomarkers to identify patients with bacteremia. J Infect. 2015;70(5):433–444. doi:10.1016/j.jinf.2015.02.011
35. Drobnik W, Liebisch G, Audebert FX, et al. Plasma ceramide and lysophosphatidylcholine inversely correlate with mortality in sepsis patients. J Lipid Res. 2003;44(4):754–761. doi:10.1194/jlr.M200401-JLR200
36. Li J, Luu L, Wang X, et al. Metabolomic analysis reveals potential biomarkers and the underlying pathogenesis involved in Mycoplasma pneumoniae pneumonia. Emerg Microbes Infect. 2022;11(1):593–605. doi:10.1080/22221751.2022.2036582
37. Hishikawa D, Hashidate T, Shimizu T, Shindou H. Diversity and function of membrane glycerophospholipids generated by the remodeling pathway in mammalian cells. J Lipid Res. 2014;55(5):799–807. doi:10.1194/jlr.R046094
38. Zeng C, Wen B, Hou G, et al. Lipidomics profiling reveals the role of glycerophospholipid metabolism in psoriasis. Gigascience. 2017;6(10):1–11. doi:10.1093/gigascience/gix087
39. Chen R, Liang W, Jiang M, et al. Risk factors of fatal outcome in hospitalized subjects with coronavirus disease 2019 from a nationwide analysis in China. Chest. 2020;158(1):97–105. doi:10.1016/j.chest.2020.04.010
40. Fei Y. Analysis of relevant factors affecting the prognosis with severe pneumonia and research on the value of establishing nomogram prediction model. J Clin Emerg. 2020;21(10):819–825.
41. Shang L, Xu J, Cao B. Viral pneumonia in China: from surveillance to response. Lancet Public Health. 2020;5(12):e633–e634. doi:10.1016/S2468-2667(20)30264-4
42. Hoffman AM. Bronchoalveolar lavage: sampling technique and guidelines for cytologic preparation and interpretation. Vet Clin North Am Equine Pract. 2008;24(2):423–35, vii–viii. doi:10.1016/j.cveq.2008.04.003
43. Anan K, Oshima Y, Ogura T, et al. Safety and harms of bronchoalveolar lavage for acute respiratory failure: a systematic review and meta-analysis. Respir Investig. 2022;60(1):68–81. doi:10.1016/j.resinv.2021.07.008
44. Gerds TA, Cai T, Schumacher M. The performance of risk prediction models. Biometrical J. 2008;50(4):457–479. doi:10.1002/bimj.200810443
45. Pencina MJ, Goldstein BA, D’Agostino RB. Prediction models - development, evaluation, and clinical application. N Engl J Med. 2020;382(17):1583–1586. doi:10.1056/NEJMp2000589
46. Staffa SJ, Zurakowski D. Statistical development and validation of clinical prediction models. Anesthesiology. 2021;135(3):396–405. doi:10.1097/ALN.0000000000003871
 © 2023 The Author(s). This work is published and licensed by Dove Medical Press Limited. The
full terms of this license are available at https://www.dovepress.com/terms
and incorporate the Creative Commons Attribution
- Non Commercial (unported, 3.0) License.
By accessing the work you hereby accept the Terms. Non-commercial uses of the work are permitted
without any further permission from Dove Medical Press Limited, provided the work is properly
attributed. For permission for commercial use of this work, please see paragraphs 4.2 and 5 of our Terms.
© 2023 The Author(s). This work is published and licensed by Dove Medical Press Limited. The
full terms of this license are available at https://www.dovepress.com/terms
and incorporate the Creative Commons Attribution
- Non Commercial (unported, 3.0) License.
By accessing the work you hereby accept the Terms. Non-commercial uses of the work are permitted
without any further permission from Dove Medical Press Limited, provided the work is properly
attributed. For permission for commercial use of this work, please see paragraphs 4.2 and 5 of our Terms.
Recommended articles
A Prediction Model for Rapid Identification of Ischemic Stroke: Application of Serum Soluble Corin
Lu Y, Wang W, Tang Z, Chen L, Zhang M, Zhang Q, Wu L, Jiang J, Zhang X, He C, Peng H
Journal of Multidisciplinary Healthcare 2022, 15:2933-2943
Published Date: 22 December 2022
Characterization of the Microbiome and Host’s Metabolites of the Lower Respiratory Tract During Acute Community-Acquired Pneumonia Identifies Potential Novel Markers
Xiao Q, Tan S, Liu C, Liu B, Li Y, Guo Y, Hu P, Su Z, Chen S, Lei W, Li X, Su M, Rong F
Infection and Drug Resistance 2023, 16:581-594
Published Date: 26 January 2023
Awareness and Predictors of the Use of Bioinformatics in Genome Research in Saudi Arabia
Alomair L, Abolfotouh MA
International Journal of General Medicine 2023, 16:3413-3425
Published Date: 11 August 2023
Establishment and Clinical Application of the Nomogram Related to Risk or Prognosis of Hepatocellular Carcinoma: A Review
Wang X, Zhao M, Zhang C, Chen H, Liu X, An Y, Zhang L, Guo X
Journal of Hepatocellular Carcinoma 2023, 10:1389-1398
Published Date: 22 August 2023
Metabolomics Reveals Molecular Signatures for Psoriasis Biomarkers and Drug Targets Discovery
Song Q, Chen Y, Ma J, Zhou W, Song J, Wu C, Liu J
Clinical, Cosmetic and Investigational Dermatology 2023, 16:3181-3191
Published Date: 4 November 2023