Back to Journals » Clinical Epidemiology » Volume 15
A New Drug Safety Signal Detection and Triage System Integrating Sequence Symmetry Analysis and Tree-Based Scan Statistics with Longitudinal Data
Authors Hsieh MHC ![]() , Liang HY, Tsai CY, Tseng YT, Chao PH, Huang WI, Chen WW, Lin SJ
, Liang HY, Tsai CY, Tseng YT, Chao PH, Huang WI, Chen WW, Lin SJ ![]() , Lai ECC
, Lai ECC ![]()
Received 2 November 2022
Accepted for publication 14 December 2022
Published 18 January 2023 Volume 2023:15 Pages 91—107
DOI https://doi.org/10.2147/CLEP.S395922
Checked for plagiarism Yes
Review by Single anonymous peer review
Peer reviewer comments 2
Editor who approved publication: Professor Henrik Toft Sørensen
Miyuki Hsing-Chun Hsieh,1,2,* Hsun-Yin Liang,2,* Chih-Ying Tsai,2 Yu-Ting Tseng,2 Pi-Hui Chao,2 Wei-I Huang,2 Wen-Wen Chen,2 Swu-Jane Lin,3 Edward Chia-Cheng Lai1
1Institute of Clinical Pharmacy and Pharmaceutical Sciences, College of Medicine, National Cheng Kung University, Tainan, Taiwan; 2Taiwan Drug Relief Foundation (TDRF), Taipei, Taiwan; 3Department of Pharmacy Systems, Outcomes & Policy, College of Pharmacy, University of Illinois at Chicago, Chicago, IL, USA
*These authors contributed equally to this work
Correspondence: Edward Chia-Cheng Lai, Email [email protected]
Purpose: Development and evaluation of a drug-safety signal detection system integrating data-mining tools in longitudinal data is essential. This study aimed to construct a new triage system using longitudinal data for drug-safety signal detection, integrating data-mining tools, and evaluate adaptability of such system.
Patients and Methods: Based on relevant guidelines and structural frameworks in Taiwan’s pharmacovigilance system, we constructed a triage system integrating sequence symmetry analysis (SSA) and tree-based scan statistics (TreeScan) as data-mining tools for detecting safety signals. We conducted an exploratory analysis utilizing Taiwan’s National Health Insurance Database and selecting two drug classes (sodium-glucose co-transporter-2 inhibitors (SGLT2i) and non-fluorinated quinolones (NFQ)) as chronic and episodic treatment respectively, as examples to test feasibility of the system.
Results: Under the proposed system, either cohort-based or self-controlled mining with SSA and TreeScan was selected, based on whether the screened drug had an appropriate comparator. All detected alerts were further classified as known adverse drug reactions (ADRs), events related to other causes or potential signals from the triage algorithm, building on existing drug labels and clinical judgement. Exploratory analysis revealed greater numbers of signals for NFQ with a relatively low proportion of known ADRs; most were related to indication, patient characteristics or bias. No safety signals were found. By contrast, most SGLT2i signals were known ADRs or events related to patient characteristics. Four were potential signals warranting further investigation.
Conclusion: The proposed system facilitated active and systematic screening to detect and classify potential safety signals. Countries with real-world longitudinal data could adopt it to streamline drug-safety surveillance.
Keywords: drug safety, signal detection, triage, sequence symmetry analysis, tree-based scan statistics
Introduction
Drug safety signal detection is the very first step of drug safety signal management. In most countries, quantitative signal detection relies on data from spontaneous reporting systems (SRS).1 However, SRS comes with some limitations.2–4 Although individual case safety reports from SRS provide valuable information for clinical review, its inherent under-reporting, biased reporting and lack of drug-exposure data make it hard to estimate real-world incidence of potential ADRs. Furthermore, due to the limited number of cases documented in SRS, signal detection is prone to insufficient power to detect ADRs with low incidence, and is subject to high risk of false-positive findings.5
In the recent decade of advancements in pharmacovigilance, longitudinal health care data has been proposed as an important data source besides SRS to detect potential safety signals of medications in real world where patients’ characteristics were more complicated than in clinical trials.6,7 Compared to SRS, long considered the cornerstone for drug safety signal detection, longitudinal datasets, especially those of population-sized scale, have the advantage of containing data on population-level exposure to drugs, ensuring greater accuracy in risk estimates of adverse drug reactions (ADRs). Furthermore, given that they allow patients to be followed over time, longitudinal health care data can provide more comprehensive information, thus making the exploration of associations between drug exposures and specific outcomes more convincing.6 To detect drug safety signals from longitudinal health care data, data-mining approaches have been utilized to perform proactive screening.8 In addition to conventional disproportionality analysis, novel tools have been under development. Among these, sequence symmetry analysis (SSA) and tree-based scan statistics (TreeScan) are two data-mining techniques8 that are relatively well-developed tools which have been used in multiple FDA Sentinel projects9,10 and have been increasingly applied to drug safety signal detection, given their relative ease of comprehension and high efficiency when generating potential drug-event pairs.11–17
Combining the advantages of both longitudinal data and novel data-mining approaches is likely to enhance the efficiency of drug safety surveillance. Although some studies13,18 have proven the strengths of the aforementioned signal detection methods, only limited studies have explored how to integrate these tools into an existing signal triage algorithm. Once data-mining methods are applied, it is anticipated that a very large number of signals will be generated, leading to a challenge in prioritizing the signals. Therefore, it is important to evaluate the applicability of data-mining tools in signal identification and to establish a triage mechanism for signal prioritization. In this study, we aimed to delineate a new triage system integrating SSA and TreeScan for drug safety signal generation and prioritization. We also conducted an exploratory study in which we chose one class of drug used in chronic disease (ie, sodium-glucose co-transporter-2 inhibitors (SGLT2i)) and one used as episodic treatment (ie, non-fluorinated quinolones (NFQ)) in order to evaluate the adaptability of incorporating these methods into the new system.
Methods
Data Source
Taiwan’s National Health Insurance Database (NHID), under the custody of the Health and Welfare Data Science Centre was used as the major data source to conduct the signal detection analyses of our proposed triage system. The NHID is a longitudinal nationwide database containing over 99% of all citizens’ health insurance claims.19 Medical diagnoses and prescriptions from outpatient visits and inpatient hospitalizations between 2010 and 2018 were retrieved from the NHID. Patient identification numbers, which were encrypted to protect individual data privacy, were used to link individuals between data subsets. This study was approved by the Research Ethics Committee Board of National Taiwan University Hospital (201803030RINC).
Construction of the Triage System
This study covered the aspect of signal detection and refinement under the broader scope of signal management. Signal detection concerned the application of data-mining tools to identify potential safety signals of the drug of interest, while signal refinement concerned an algorithm to classify and prioritize the detected signals. The goal of constructing the triage system was to improve the proactiveness of the current drug safety surveillance system in Taiwan. Post-marketing drug safety should ideally be monitored by both passive and active surveillance methods. In addition to the existing SRS which has been seen as the cornerstone of drug safety surveillance, we proposed a triage algorithm utilizing longitudinal data for active surveillance. We incorporated guidance from the Council for International Organizations of Medical Sciences (CIOMS) Working Group VIII20 and the current structural framework used in Taiwan’s national pharmacovigilance system21 to construct the new system, with integrated data-mining approaches to aid in signal generation and with a classification algorithm to categorize and prioritize safety signals.
Data-Mining Methods
We applied data-mining approaches in the step of signal identification, using SSA and TreeScan as the major tools in the NHID. Both tools are well-established methods that have been applied in various studies for generating potential safety signals.11–13,15,16,22 Validation studies have shown that both methods have moderate-to-high sensitivity and specificity.23–25 SSA examines the relationship between two drugs by comparing the sequence of introduction of the drug of interest (ie, the index drug) and other drugs during a pre-specified period for all subjects. If the frequency of the prescription sequence of index drug followed by marker drug is greater than the frequency of the inverse sequence, this may imply that it is the use of the index drug that increases the use of the marker drug, the latter possibly being used to treat an adverse event (AE) induced by the index drug. By contrast, TreeScan scans for excess risk of potential ADRs in a hierarchical level and simultaneously adjusts for the multiple testing inherent in the large number of overlapping groups of data evaluated. In pharmacovigilance, it could be used to evaluate hundreds or thousands of potential AEs at the same time to see if any event or group of events occur with a higher probability than expected. Accumulating evidence has shown the applicability of using SSA and TreeScan to generate potential safety signals. A more detailed description of SSA and TreeScan is provided in the Supplement. Considering the simplicity and efficiency of SSA in estimating risk of ADRs and also the benefits of TreeScan in hierarchical screening without the need for prior definition of certain events and in controlling type 1 error rate across multiple testing, we believe that the two methods could complement each other in the interpretation of identified signals. In this study, TreeScan analysis and SSA were conducted using TreeScan™ (https://www.treescan.org/) and SAS v9.4 software.
Exploratory Analysis
We conducted an exploratory analysis using SGLT2i and NFQ as test examples to examine the applicability of the proposed system. SGLT2is represent a newer class of drugs indicated for diabetes, a chronic disease with high prevalence, while NFQs represent an old class of medications only applied in short-term therapy for certain infections. NFQs are no longer available in many countries because newer fluoroquinolones (FQs) appear to have broader antibacterial activity and have been widely used in clinical practice;26 however, NFQs are still available and frequently prescribed in some countries, especially in Asia.27 In Taiwan, NFQs accounted for 26 to 46% of prescribed, defined daily doses of all quinolone antibiotics between 2008 and 2009.28 Therefore, it is important to assure both effectiveness and safety of NFQs.
We applied both SSA and TreeScan as safety signal detection approaches. We used medication prescriptions and diagnostic codes for the SSA and TreeScan analyses, respectively, as the mining data. To avoid potential selection bias, we included only new users of the index drugs (ie, SGLT2i or NFQ). New users were defined as those without exposure to the study drugs during the year prior to the index date, which was the first prescription date of each study drug during the study period.
For the SSA analysis, we extracted the first prescriptions of the index drug and all other drugs within a pre-specified time window for each individual. We then assessed whether the frequency of the prescription sequence of index drug followed by each of the other drugs was greater than the inverse sequence thereof, and calculated a sequence ratio (SR) for each possible drug-event pair. The SRs were further adjusted using Tsiropoulos’ method29 to account for potential bias resulting from prescribing trends of specific drugs.
For TreeScan, we prespecified a diagnosis tree with 5 levels of hierarchy coded by the International Classification of Diseases, Ninth or Tenth Revision, Clinical Modification (ICD-9-CM or ICD-10-CM). TreeScan can be conducted in a cohort- or self-controlled design. If an appropriate comparator candidate exists for the index drug, a cohort design can be applied, and the index drug’s risk of a pre-specified event can be assessed by comparing the observed number with the expected number (as calculated from the comparator drug). If, however, the index drug lacks an adequate comparator, then a self-controlled TreeScan design comparing the risk of a pre-specified event during exposure- versus non-exposure period can be applied. Schemata of different TreeScan designs are provided in Supplement Figure 1. For this analysis, we carried out a cohort-design TreeScan comparing new use of the index drug with the comparator drug to minimize confounding by indication. We calculated propensity score (PS) which is the probability of a patient being treated with the index drug and performed 1:1 matching to create two groups with balanced characteristics. The incident event was defined as any diagnosis that had not appeared before the index date. Considering that different physicians might code the same clinical condition using slightly different ICD codes, we judged incident events by the first three digits of the ICD codes. A patient might encounter multiple incident events in the follow-up period, with each of these events being tested by TreeScan individually. Considering the probability of being a case would be 0.5 under the 1 to 1 matching design, unconditional Bernoulli model was applied. In this study, we defined the detected drugs from SSA and the detected events from TreeScan as alerts with the significance level at 0.05.
Investigation of SGLT2i
For the SSA, we included new users of SGLT2i from May 2016 to December 2018. We collected every first prescription of drugs other than SGLT2i (potential marker drugs) within 12 months before and after the index date. To qualify as a first prescription of each drug, we applied a washout period of one year. For every potential marker drug, we calculated the adjusted SR based on the prescribing order of the index drug and the marker drug. We selected dipeptidyl peptidase-4 inhibitors (DPP4i) as the comparator drug because it was considered the same line of therapy in diabetes treatment and we conducted SSA for DPP4i as well.
For TreeScan, we included new users of SGLT2i during the same cohort entry period as for SSA. New users of DPP4i were also identified during the same inclusion period as active comparators. Variables considered in the generation of PS included age, sex, Charlson Comorbidity Index (CCI), health resource utilization and disease- and medication history collected at the index date or during the baseline (within 1 year before the index date). We followed the patients from the index date to outcome occurrence, drug switching, drug discontinuation, death or 365 days after the index date, whichever came first.
Investigation of NFQ
For SSA analysis of NFQs, we included new users from January 2016 to December 2016. Considering the short-term clinical use of NFQs, we set the time window for SSA analysis at 90 days before and after the index date. Adjusted SR was calculated for every possible pair of index drug and marker drug. We selected FQ as the comparator drug and conducted the same SSA.
For the TreeScan analysis of NFQs, we conducted a cohort study design with PS matching, similar to the analysis of SGLT2i. We identified new users of NFQs and FQs between 2011 and 2014, whereby the FQ users were included to serve as the comparator group. Considering that quinolone antibiotics are used for a diverse set of infection indications, we collected general covariates that included baseline demographics, CCI and health resource utilization for the calculation of PS. Consistent with the SSA of NFQs, we set the end of observation 90 days after the index date. Patients were followed up until occurrence of an incident event, drug switching, drug discontinuation, death or 90 days after the index date.
Results
The Proposed Triage System
The proposed triage system includes both prescription SSA and TreeScan as quantitative signal detection tools for safety signal detection in longitudinal databases (Figure 1). The system starts with the requirement for detection of safety signals for a (class of) target medication (drug X). Once drug X to be analysed is determined, we assess if there is an appropriate (class of) comparator drug Y to be compared with, as a reference drug. If an appropriate comparator exists, a parallel prescription SSA of both drugs and a TreeScan analysis with cohort design and propensity score-adjustment are conducted. If drug X lacks an appropriate comparator, a single SSA of drug X and a self-controlled TreeScan are performed instead. Next, all alerts detected as significant are collected. In the parallel SSA, alerts detected in both drug X and Y are considered as potential ADRs within the same class of drug (in the situation where drug Y is of the same drug class as drug X), or due to bias resulting from mutual indications with common use of medications among the study population. We exclude these alerts at this stage because these alerts are not considered to be specific to the use of drug X. The final alerts are then classified further.
 |
Figure 1 Proposed signal detection and triage algorithm. Abbreviations: ADRr, ADR-related event; CCDS, company core data sheets; CH, Cohort-related event; SRS, spontaneous reporting system; Ir, Indication-related event; PT, Protopathic bias. |
Classification and Triage of Detected Signals
After the signal detection step, we rank all detected alerts by their statistical significance (ie, adjusted SRs from SSA or p-values followed by log likelihood ratio from TreeScan) and clinical pharmacists experienced in pharmacovigilance from TDRF (a designated foundation which operates the Taiwan National ADR reporting system) further classify these alerts. First, an alert is assessed as to whether it is a known ADR or a clinical indication. If neither, the pharmacists review other information from the risk profile, literature and case reports of the drug from SRS, or consult clinical experts to ultimately categorize the detected alert as an event related to a known ADR, an event related to indication, an event related to characteristics of patients, potential bias, or unknown. The risk profile (see Supplement Tables 4 and 5) contains safety information from drug labels, company core data sheets, and risks labelled as important identified risks and important potential risks from the Periodic Benefit-Risk Evaluation Report (PBRER) and Risk Management Plan (RMP) document of the drug. All detected alerts are classified into one of the following categories.
ADR – The event is a known ADR listed in the ‘adverse reactions’, ‘warnings’ or ‘precautions’ sections of drug labels or company core data sheets.
ADR-related event (ADRr) – The event is not specifically listed in the known risk profile, but is clinically considered to be related to known ADRs.
Indication (I) – The event is listed as an indication in the drug labelling.
Indication-related event (Ir) – The event is not specifically listed in the labelling as an approved indication, but is considered to be related to a clinical indication or represents an off-label use.
Cohort-related event (CH) – After ruling out known ADRs and indications, the event cannot be explained by the pharmacological effects of the drug and is judged to be related to the characteristics of the patient group.
Protopathic bias (PT) – After ruling out known ADRs and indications, the event is considered a disease or a symptom that the target drug is often prescribed to treat.
Unknown (U) – If the event cannot be classified into any of the above, then it is considered an unknown ADR and is identified as a signal.
Examples of different categories of alerts are listed in Supplement Table 6. Besides adverse events detected by TreeScan, this classification also applied to drug alerts that were detected by SSA. For SSA, events described in all classification were refer to events that are indications of the detected drugs.
After classification of the alerts, those identified as unknown (U) are considered as safety signals of the target drug that require further prioritization. Criteria for prioritizing a signal include clinical and statistical significance. Clinical significance encompasses the seriousness of the event, and incidence or prevalence of the event. Statistical significance includes the effect size of the association between drug X and the detected signal, and whether the signal was identified by both SSA and TreeScan. The specific criteria and weights can be designed depending on the needs under different circumstances. Signals or drug-event pairs with higher priority are then further evaluated using pharmaco-epidemiological studies with more specific design tailored to each signal.
Safety Signals of SGLT2i
We identified 216,393 new users of SGLT2i for SSA and found an overall total of 46 alerts (Figure 2 and Table 1). Among them, 14 were medications used in the treatment of known ADRs, generally urinary tract infections, 28 were related to the characteristics of patients and 4 alerts were classified as signals that included the prescription of fluorouracil, calcium folinate, levodopa and decarboxylase inhibitor, and epinastine. Of the 46 alerts, 21 were also identified in the SSA of DPP4i.
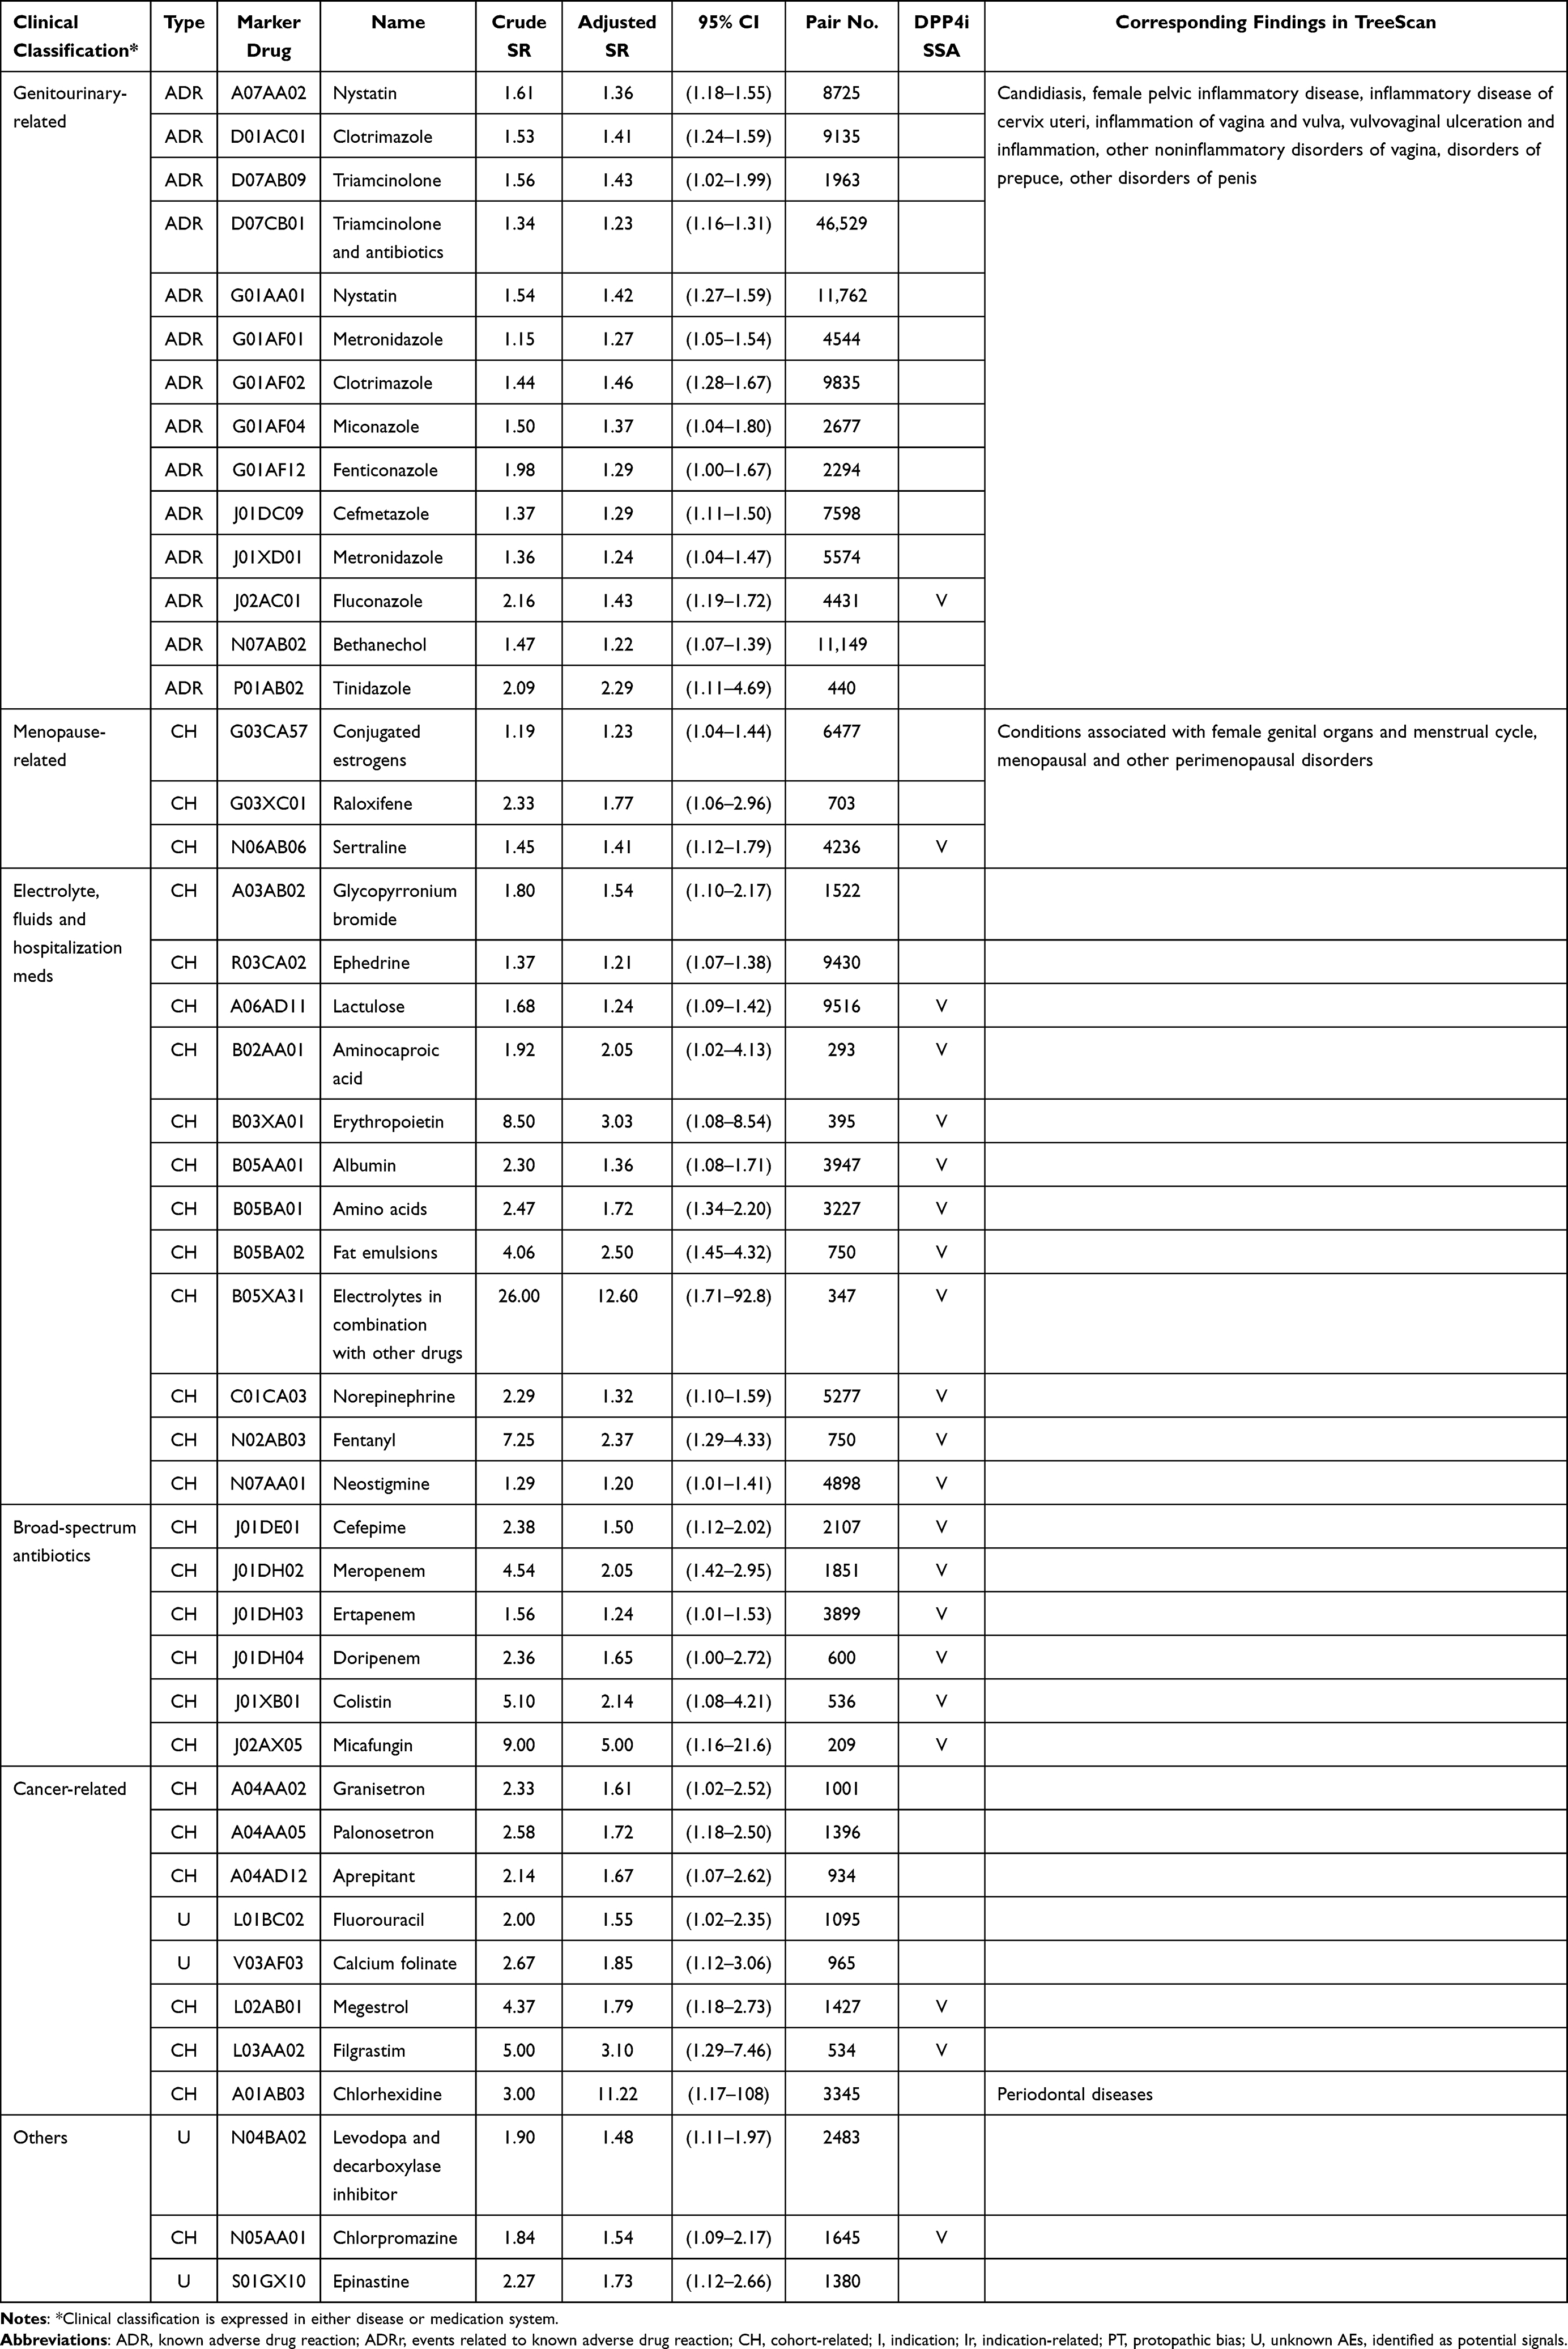 |
Table 1 Detected Alerts of SGLT2 Inhibitor: Results from Prescription Sequence Symmetry Analysis |
 |
Figure 2 Classification of detected alerts. Numbers shown are numbers of detected alerts for each type. Abbreviations: ADR, known adverse drug reaction; ADRr, events related to known adverse drug reaction; CH, cohort-related; I, indication; Ir, indication-related; PT, protopathic bias; U, unknown alerts identified as potential signals. |
For the TreeScan, we included 118,308 matched pairs of SGLT2i users and DPP4i users. The distributions of demographics, comorbidities and concurrent medications were similar for the groups after PS matching (Supplement Table 1). The results from TreeScan generated 38 alerts, all of which were known ADRs, ADR-related events or related clinical diagnoses of the patient cohort (Figure 2 and Table 2).
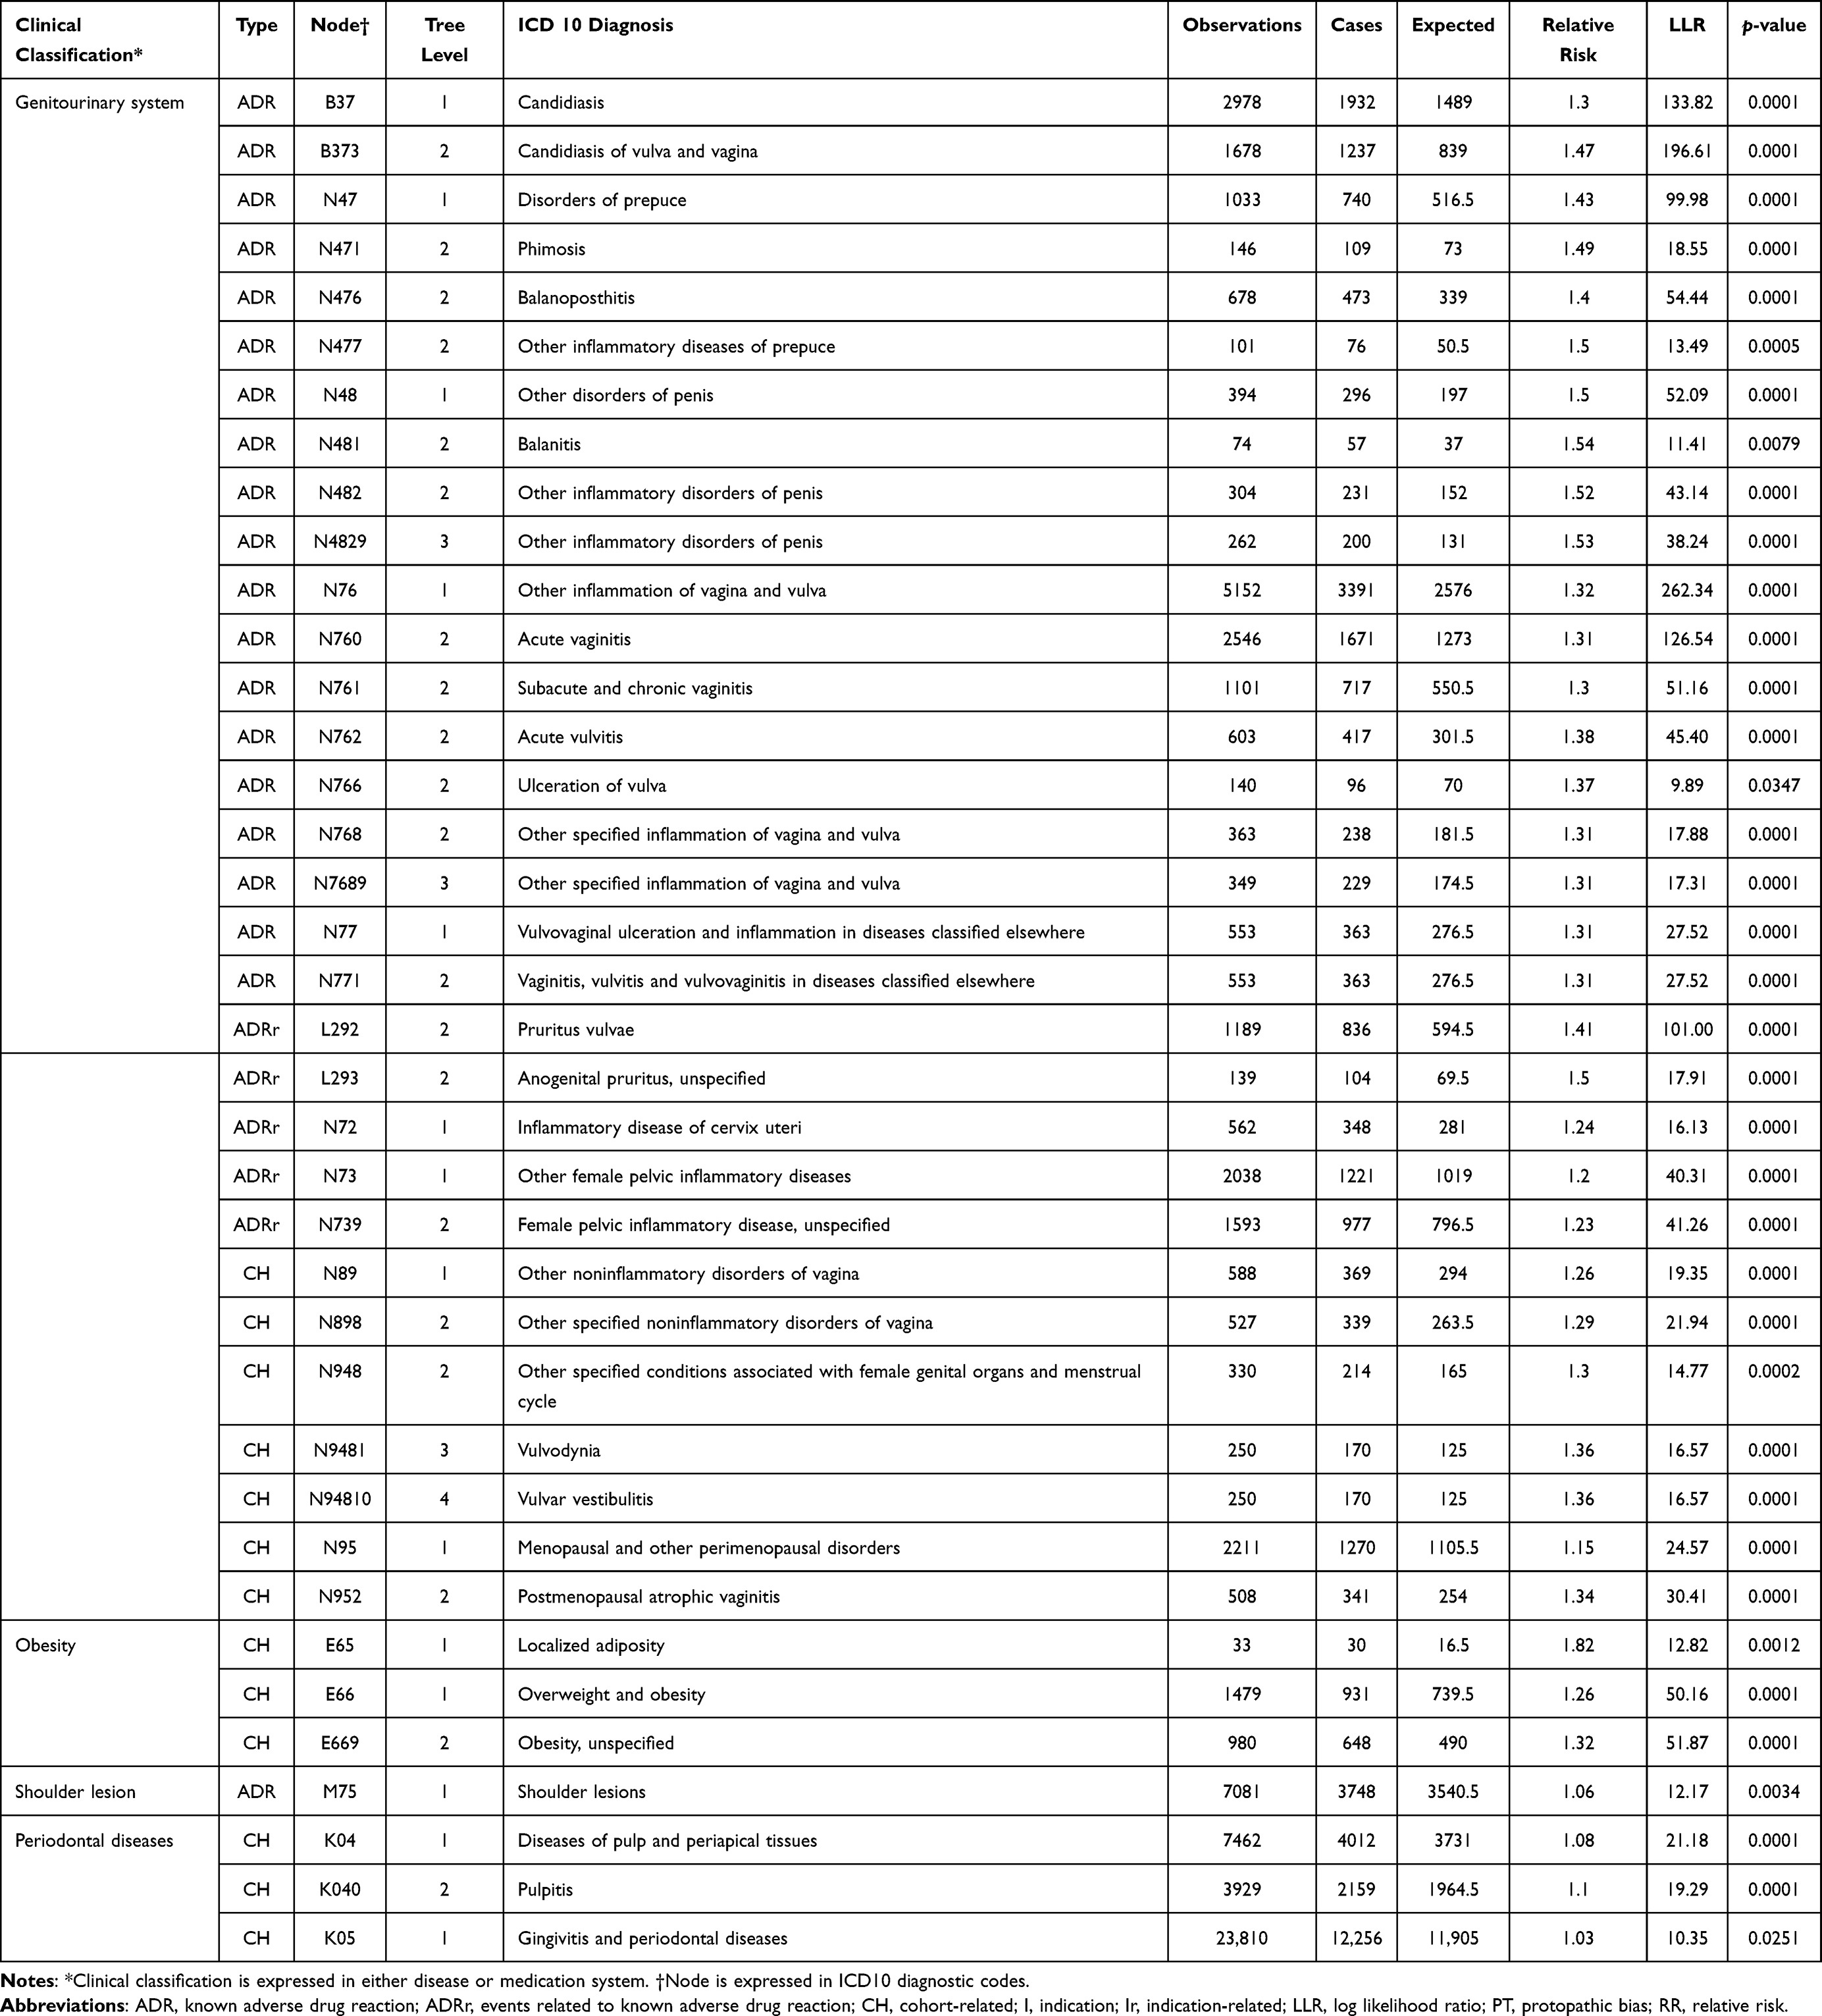 |
Table 2 Detected Alerts of SGLT2 Inhibitor: Results from Propensity Score-Matched TreeScan |
Safety Signals of NFQ
We found a total of 82 alerts from SSA of NFQs. Among these, 17 were medications used to treat known ADRs or related events, 9 were medications used in managing indication-related problems, 52 were related to cohort characteristics and the remaining 4 were considered as protopathic bias (Figure 2 and Supplement Table 2). Of the 82 alerts, 44 were also identified in the SSA of FQs.
In the TreeScan analysis, a total of 394 alerts were detected and no signals were identified. Of these alerts, 74 were known ADRs or related events, 149 were indications or related clinical diagnoses, 111 were related to patient characteristics and 60 were assessed to be protopathic bias (Figure 2). The individual alerts are summarized in Supplement Table 3.
Discussion
Overall Findings
Our study delineated a new triage system integrating SSA and TreeScan for drug safety signal generation and prioritization using population-based longitudinal data. One of the greatest strengths of the system is that it utilizes quantitative data-mining tools to perform automatic and mass screening for potential drug-event pairs, and to properly classify all detected safety alerts into different categories following a triage algorithm consistent with clinical evaluation. Based on an exploratory analysis, we selected two classes of drugs with different characteristics for scanning and found that SSA and TreeScan performed well in this system. For SGLT2i as the newer class of drugs used in a highly prevalent disease, most signals were known ADRs or clinical events related to the characteristics of the treated patients; while for NFQs, an older class of drugs indicated for short-term infection, no new safety signals were found.
Discussion of the Triage System
Complementary Benefit of Integrating SSA and TreeScan for Signal Detection
In the proposed system, we utilize prescription records for SSA and disease diagnoses for TreeScan as the data to be mined. Leveraging different types of data increases the sensitivity when identifying drug safety signals. In situations where patients suffer from adverse events and are treated by medications but these are not necessarily being coded as a specific disease or clinical event, using prescription data enables us to capture more relevant information. Additionally, a drug or a class of drug could be prescribed for multiple indications, and therefore using diagnosis data helps us to distinguish different clinical events. Hence, SSA and TreeScan complement each other, allowing a more comprehensive detection of potential safety signals.
Design of a Comparator for the Index Drug
The proposed triage system is designed to incorporate clinical consideration of the drug to be scanned. For each (class of) drug X (illustrated in Figure 1), we first determine if there is any appropriate comparator (drug Y), which could be a specific drug or a class of drugs. This is representative of most clinical care conditions where multiple-drug choices within or across classes are available, and a physician often selects the one that might provide the most effectiveness with the least risk, or is most convenient to the specific patient. The benefit of having a comparator is that it enables us to identify additional safety concerns that might be associated with drug X;20 hence we can focus on potential new AEs instead of those that have already been recognized with the comparator drugs. Another advantage of having a comparator drug is that it helps to remove possible AEs that are related to patient characteristics. Because the comparator is often another active ingredient within the same therapeutic category, the underlying conditions between groups can be considered similar, thus mitigating confounding by indication.30 Another strength of the triage system is the mechanism of safety signal classification. We categorize all detected alerts into different groups, either as known ADRs, indications, following other related events, bias, or unknown AEs based on various sources of evidence. These sources cover a broad range, including drug labels, regulatory information, literature reviews and safety reports generated from domestic SRS, and are thus unlikely to miss any possible known AEs. Overall, the proposed triage system functions as a filter to screen out potential drug-event pairs that require further investigation both statistically and clinically. Therefore, the new system can be expected to aid in prioritization of drug safety signals and to improve the efficiency of current drug safety surveillance.
Discussion on the Exploratory Analysis
Overall Performance of SSA and TreeScan in 2 Different Drug Classes
Comparing the results of prescription SSA and TreeScan, it was noted that fewer alerts were identified for SGLT2i relative to NFQ. This might be due to different lengths of time on the market and differences in the patient groups. SGLT2i is a newer class of oral antidiabetic drugs for which evidence regarding its safety profile is still accumulating, while NFQ is an old group of antibiotics which has long been used in treating a wide range of infections. Therefore, the probability of detecting multiple AEs in the latter might be higher, due to its longer time on the market and wider-ranging patient scope. Furthermore, it was noted that 39% and 50% of alerts detected by SSA for SGLT2i and NFQ, respectively, were also identified in TreeScan. By contrast, 47% and 8% of alerts detected by TreeScan for SGLT2i and NFQ, respectively, were also found in SSA. The results show the complementary benefit of utilizing both types of data-mining approaches in order to maximize the sensitivity of signal detection.
Further examination of the distribution of alert types revealed a predominant proportion of patient characteristics-related events from the results of SSA. Approximately 61% and 63% of the alerts detected by the SGLT2i and NFQ SSAs, respectively, were related to patient characteristics, while these proportions decreased to 34% and 23%, respectively, for SGLT2i and NFQ in the TreeScan analyses, which included a comparator group. Similarly, when we compared the results from parallel SSAs of SGLT2i vs DPP4i and NFQ vs FQ, we noticed that approximately half of the detected alerts were also found in the comparator drug groups. This finding emphasized the importance of the comparator drug in controlling confounding caused by the disease or indications shared among patient groups.
Interpretation of SGLT2i Alerts
The results of the SGLT2i analyses showed that both SSA and TreeScan found alerts related to genital mycotic or urinary tract infections, which are well-known ADRs of SGLT2is (Tables 1 and 2). In addition, TreeScan identified the shoulder lesion as an alert, which included inflammation or pain of the shoulder. This might correspond to arthralgia in the current risk profile. Both approaches found alerts related to patient characteristics as well. These included medications and diagnoses related to dental problems and postmenopausal women. Studies have found that diabetes patients have a high prevalence of periodontal disease.31 Poor glycaemic control in diabetes patients is associated with more severe periodontal disease.32 Furthermore, more than half of the SGLT2i new users were over 50 years old (data not shown), indicating that alerts related to menopausal disorders might be due to the characteristics of these patients. The SSA results showed there were alerts related to medications used in cancer treatment and during hospitalization such as electrolytes, fluids and broad-spectrum antibiotics. The SSA results for DPP4i yielded most of these alerts as well, implying that these medications were related to cohort characteristics of diabetes patients, rather than real ADRs. Nevertheless, the SSA yielded 4 alerts assessed to be potential signals: fluorouracil, calcium folinate, levodopa and decarboxylase inhibitor, and epinastine. The former two are used in multiple cancer treatment, including invasive bladder cancer and breast cancer,33 and are also listed as important potential risks in the PBRER of the pharmaceutical company (Supplement Table 4). Levodopa and epinastine are used to treat Parkinson’s disease and allergic conjunctivitis, respectively. However, we have found no evidence supporting any relationship between SGLT2i and the use of these medications as yet. Further analyses are required for clarification.
Interpretation of NFQ Alerts
Neither SSA nor TreeScan analysis of NFQ found new safety signals, and all alerts were classified as known ADRs, indications, cohort-related characteristics or protopathic bias (Figure 2). The SSA identified known ADRs including medications used in treating peptic ulcer, anaemia, dyslipidaemia, tissue inflammations and psychiatric disorders (Supplement Table 2). TreeScan found alerts consistent with disorders of the musculoskeletal and nervous system, such as synovitis, arthralgia and neuritis. In addition, TreeScan found more significant alerts related to the eyes, ears, and gastrointestinal system (Supplement Table 3). Since the design of the TreeScan analysis included a comparator drug group, which was the FQs, the results could be interpreted as additional safety concerns that NFQs might carry, when compared with FQs. However, the detected known ADR alerts of NFQs were mostly diagnoses with unspecific or less severe symptoms. This might have been due to the imbalance in NFQ- and FQ prescription rates between hospitals and clinics. A post hoc analysis (data not shown) supported this observation, finding that nearly 70% of NFQs were prescribed at local clinics, suggesting that the diagnoses behind NFQ prescriptions mostly involved less severe symptoms of diseases or disorders. However, although we did not find new signals for NFQ, we did identify many alerts related to diagnoses of pregnancy and childbirth, which we classified as cohort-related characteristics rather than true signals. This might imply that many NFQs were prescribed at obstetrics and gynaecology clinics, raising concerns that many pregnant women were being prescribed NFQs, which, as a class of antibiotics, are not recommended for first-line treatment during pregnancy due to a lack of safety evidence.
Strengths and Challenges of the Proposed Triage System
Through this exploratory study, we uncovered several strengths of applying the proposed system to enhance the current signal detection and triage algorithm. First, the utilization of data-mining methods on longitudinal data provides an additional tool for generating potential signals besides the conventional approach. Safety signals can be drawn from multiple sources, including SRS, active surveillance system, literature review, other regulatory bodies, etc.34 Implementation of the proposed system could aid in increasing the proactiveness of the active surveillance system. Second, data-mining approaches are primarily automatic and conducted through computerized programs. This can quickly narrow down the scope of potential signals within the ocean of all possible adverse reactions while reducing manpower costs and increasing signal detection efficiency. Third, longitudinal data usually involves larger sample sizes compared to SRS data, and therefore could enhance the detecting power of safety signals, which is especially critical for the identification of ADRs with lower incidence. Even more so, if population-based data can be acquired, then the incidence of different AEs can be more accurately estimated. Fourth, consideration of an appropriate comparator drug in the proposed system allows the investigators to filter out the background noise of confounding by patient characteristics or mutual indication, or by clinical events that occurred following the disease progression.
Some challenges remain for integrating the novel approaches into the current signal detection procedure. Many important considerations must go into the establishment of such an integrated system. What criteria should be met to trigger the triage system for a certain drug? How do we build the database for storing and maintaining the data? How often should we screen or end the mining process for a drug to update the safety information in a real-time manner? With regard to the data-mining step, it is difficult to set an appropriate statistical threshold to define a “significant” signal. Compared to results with a significance level of 0.01, those with a significance level of 0.05 would definitely yield more signals, which would potentially increase the sensitivity but compromise the specificity of signal detection. Caution should be exercised because the level of significance is directly related to the probability of false positive findings, to be considered as noise in signal detection and possibly a concern under multiple testing. SSA is likely to suffer from this problem while the statistics of TreeScan can spontaneously control the false positive rate introduced by multiple testing. Another challenge of this system is that a valid method to combine signals from different data sources has yet to be formulated. Aggregating signals detected from multiple databases is important for further prioritization and evaluation of potential drug-event pairs. So far, several models35–37 have been proposed to integrate signals, but it will require tests in real-world situations to demonstrate their practicality and efficiency.
Conclusion
This study proposed and tested a new triage system integrating prescription SSA and TreeScan for drug safety signal generation and prioritization in Taiwan. The exploratory analyses of SGLT2i and NFQ demonstrated the system’s utility in generating potential safety signals and categorizing different detected alerts, and thus could improve the efficiency of the drug safety signal detection and triage process.
Abbreviations
ADR, adverse drug reaction; AE, adverse event; CCI, Charlson Comorbidity Index; CIOMS, Council for International Organizations of Medical Sciences; DPP4i, dipeptidyl peptidase-4 inhibitors; FQ, fluoroquinolone; NFQ, non-fluorinated quinolone; NHID, Taiwan’s National Health Insurance Database; PBRER, Periodic Benefit-Risk Evaluation Report; PS, propensity score; RMP, Risk Management Plan; SGLT2i, sodium-glucose co-transporter-2 inhibitors; SR, sequence ratio; SRS, spontaneous reporting systems; SSA, sequence symmetry analysis; TreeScan, tree-based scan statistics.
Data Sharing Statement
The datasets generated and/or analysed during the current study are not publicly available due to legal restrictions governing data privacy protection under Taiwan’s regulations.
Acknowledgments
We are grateful to the Taiwan Food and Drug Administration (TFDA) for providing funding support, and to Dr. Fei-Yuan Sharon Hsiao for assisting in research consultation. We are grateful to Health Data Science Centre, National Taiwan University Hospital and Health Data Science Centre, National Cheng Kung University Hospital for providing administrative and technical support.
Author Contributions
All authors made a significant contribution to the work reported, whether that is in the conception, study design, execution, acquisition of data, analysis and interpretation, or in all these areas; took part in drafting, revising or critically reviewing the article; gave final approval of the version to be published; have agreed on the journal to which the article has been submitted; and agree to be accountable for all aspects of the work.
Funding
This work was supported by research grants from the Taiwan Food and Drug Administration (TFDA) (MOHW109-FDA-D-113-000411). The content of this article does not represent any official position of the TFDA.
Disclosure
Ms Miyuki Hsing-Chun Hsieh reports grants from Taiwan Food and Drug Administration, during the conduct of the study. Ms Hsun-Yin Liang reports grants from Taiwan Food and Drug Administration, during the conduct of the study. Ms Chih-Ying Tsai reports grants from Taiwan Food and Drug Administration, during the conduct of the study. Ms Yu-Ting Tseng reports grants from Taiwan Food and Drug Administration (TFDA), during the conduct of the study. Mr Pi-Hui Chao reports grants from Taiwan Food and Drug Administration, during the conduct of the study. Ms Wei-I Huang reports grants from Taiwan Food and Drug Administration, during the conduct of the study. Dr Wen-Wen Chen reports grants from Taiwan Food and Drug Administration, during the conduct of the study. The authors declare no other competing interests.
References
1. Fujita T. Signal Detection of Adverse Drug Reactions. Japanese J Pharmacoepidemiol. 2009;14(1):27–36. doi:10.3820/jjpe.14.27
2. Alatawi YM, Hansen RA. Empirical estimation of under-reporting in the U.S. Food and Drug Administration Adverse Event Reporting System (FAERS). Expert Opin Drug Saf. 2017;16(7):761–767. doi:10.1080/14740338.2017.1323867
3. Hoffman KB, Demakas AR, Dimbil M, Tatonetti NP, Erdman CB. Stimulated reporting: the impact of US food and drug administration-issued alerts on the adverse event reporting system (FAERS). Drug Saf. 2014;37(11):971–980. doi:10.1007/s40264-014-0225-0
4. Noguchi Y, Tachi T, Teramachi H. Detection algorithms and attentive points of safety signal using spontaneous reporting systems as a clinical data source. Brief Bioinform. 2021;22(6). doi:10.1093/bib/bbab347
5. Emanuel Raschi UM, Salvo F, Pariente A, Antonazzo IC, De Ponti F, Poluzzi E. Evolving roles of spontaneous reporting systems to assess and monitor drug safety. Pharmacovigilance. 2019;2019:1.
6. Suling M, Pigeot I. Signal detection and monitoring based on longitudinal healthcare data. Pharmaceutics. 2012;4(4):607–640. doi:10.3390/pharmaceutics4040607
7. Shao SC, Lin YH, Chang KC, et al. Sodium glucose co-transporter 2 inhibitors and cardiovascular event protections: how applicable are clinical trials and observational studies to real-world patients? BMJ Open Diabetes Res Care. 2019;7(1):e000742. doi:10.1136/bmjdrc-2019-000742
8. Arnaud M, Bégaud B, Thurin N, Moore N, Pariente A, Salvo F. Methods for safety signal detection in healthcare databases: a literature review. Expert Opin Drug Saf. 2017;16(6):721–732. doi:10.1080/14740338.2017.1325463
9. Sentinel F. Signal Identification in the Sentinel System; 2021.
10. Yih WK, Maro JC, Nguyen M, et al. Assessment of quadrivalent human papillomavirus vaccine safety using the self-controlled tree-temporal scan statistic signal-detection method in the sentinel system. Am J Epidemiol. 2018;187(6):1269–1276. doi:10.1093/aje/kwy023
11. King CE, Pratt NL, Craig N, et al. Detecting medicine safety signals using prescription sequence symmetry analysis of a national prescribing data set. Drug Safe. 2020;43(8):787–795. doi:10.1007/s40264-020-00940-5
12. Man KKC, Shao S-C, Chaiyakunapruk N, et al. Metabolic events associated with the use of antipsychotics in children, adolescents and young adults: a multinational sequence symmetry study. Eur Child Adolesc Psychiatry. 2020;2020. doi:10.1007/s00787-020-01674-6
13. Kim JH, Lee H, Shin JY. Bacillus Calmette-Guérin (BCG) vaccine safety surveillance in the Korea adverse event reporting system using the tree-based scan statistic and conventional disproportionality-based algorithms. Vaccine. 2020;38(21):3702–3710. doi:10.1016/j.vaccine.2020.04.007
14. Wintzell V, Svanström H, Melbye M, Ludvigsson JF, Pasternak B, Kulldorff M. Data mining for adverse events of tumor necrosis factor-alpha inhibitors in pediatric patients: tree-based scan statistic analyses of Danish nationwide health data. Clin Drug Investig. 2020;40(12):1147–1154. doi:10.1007/s40261-020-00977-5
15. Schachterle SE, Hurley S, Liu Q, Petronis KR, Bate A. An implementation and visualization of the tree-based scan statistic for safety event monitoring in longitudinal electronic health data. Drug Safe. 2019;42(6):727–741. doi:10.1007/s40264-018-00784-0.
16. Yih WK, Kulldorff M, Dashevsky I, Maro JC. Using the self-controlled tree-temporal scan statistic to assess the safety of live attenuated herpes zoster vaccine. Am J Epidemiol. 2019;188(7):1383–1388. doi:10.1093/aje/kwz104
17. Takada M, Fujimoto M, Yamazaki K, Takamoto M, Hosomi K. Association of statin use with sleep disturbances: data mining of a spontaneous reporting database and a prescription database. Drug Saf. 2014;37(6):421–431. doi:10.1007/s40264-014-0163-x
18. Brown JS, Petronis KR, Bate A, et al. Drug adverse event detection in health plan data using the gamma poisson shrinker and comparison to the tree-based scan statistic. Pharmaceutics. 2013;5(1):179–200. doi:10.3390/pharmaceutics5010179
19. Hsieh CY, Su CC, Shao SC, et al. Taiwan’s national health insurance research database: past and future. Clin Epidemiol. 2019;11:349–358. doi:10.2147/clep.S196293
20. Raine J, Close P, Dal G. Practical aspects of signal detection in pharmacovigilance: report of CIOMS Working Group VIII; 2010. Available from: https://cioms.ch/wp-content/uploads/2018/03/WG8-Signal-Detection.pdf.
21. Chen WW, Lin CW, Huang WI, Chao PH, Gau CS, Hsiao FY. Using real-world evidence for pharmacovigilance and drug safety-related decision making by a resource-limited health authority: 10 years of experience in Taiwan. Pharmacoepidemiol Drug Saf. 2020;29(11):1402–1413. doi:10.1002/pds.5084
22. Hallas J, Wang SV, Gagne JJ, Schneeweiss S, Pratt N, Pottegård A. Hypothesis-free screening of large administrative databases for unsuspected drug-outcome associations. Eur J Epidemiol. 2018;33(6):545–555. doi:10.1007/s10654-018-0386-8
23. Pratt NL, Ilomäki J, Raymond C, Roughead EE. The performance of sequence symmetry analysis as a tool for post-market surveillance of newly marketed medicines: a simulation study. BMC Med Res Methodol. 2014;14(1):66. doi:10.1186/1471-2288-14-66
24. Wahab IA, Pratt NL, Wiese MD, Kalisch LM, Roughead EE. The validity of sequence symmetry analysis (SSA) for adverse drug reaction signal detection. Pharmacoepidemiol Drug Saf. 2013;22(5):496–502. doi:10.1002/pds.3417
25. Lee H, Kim JH, Choe YJ, Shin JY. Safety surveillance of pneumococcal vaccine using three algorithms: disproportionality methods, empirical Bayes geometric mean, and tree-based scan statistic. Vaccines. 2020;8(2):242. doi:10.3390/vaccines8020242
26. von Rosenstiel N, Adam D. Quinolone antibacterials. An update of their pharmacology and therapeutic use. Drugs. 1994;47(6):872–901. doi:10.2165/00003495-199447060-00003
27. Panhotra BR, Saxena AK, Al-Ghamdi AM. Emerging nalidixic acid and ciprofloxacin resistance in non-typhoidal Salmonella isolated from patients having acute diarrhoeal disease. Ann Saudi Med. 2004;24(5):332–336. doi:10.5144/0256-4947.2004.332
28. Kuo S-C, Shih S-M, Hsieh L-Y, et al. Antibiotic restriction policy paradoxically increased private drug consumptions outside Taiwan’s National Health Insurance. J Antimicrob Chemother. 2017;72(5):1544–1545. doi:10.1093/jac/dkw595
29. Tsiropoulos I, Andersen M, Hallas J. Adverse events with use of antiepileptic drugs: a prescription and event symmetry analysis. Pharmacoepidemiol Drug Saf. 2009;18(6):483–491. doi:10.1002/pds.1736
30. Setoguchi S, Dreyer NA, Nourjah P, et al. Developing a Protocol for Observational Comparative Effectiveness Research: A User’s Guide. Rockville (MD): Agency for Healthcare Research and Quality (US); 2013.
31. Bascones-Martínez A, González-Febles J, Sanz-Esporrín J. Diabetes and periodontal disease. Review of the literature. Am J Dent. 2014;27(2):63–67.
32. Llambés F, Arias-Herrera S, Caffesse R. Relationship between diabetes and periodontal infection. World J Diabetes. 2015;6(7):927–935. doi:10.4239/wjd.v6.i7.927
33. Lokich J. Infusional 5-FU: historical evolution, rationale, and clinical experience. Oncology. 1998;12(10 Suppl 7):19–22.
34. Insani WN, Pacurariu AC, Mantel-Teeuwisse AK, Gross-Martirosyan L. Characteristics of drugs safety signals that predict safety related product information update. Pharmacoepidemiol Drug Saf. 2018;27(7):789–796. doi:10.1002/pds.4446
35. Harpaz R, LePendu P, Shah NH. Empirical Bayes model to combine signals of adverse drug reactions; 2013: 1339–1347.
36. Li Y, Ryan PB, Wei Y, Friedman C. A method to combine signals from spontaneous reporting systems and observational healthcare data to detect adverse drug reactions. Drug Safe. 2015;38(10):895–908. doi:10.1007/s40264-015-0314-8
37. Xiao C, Li Y, Baytas IM, Zhou J, Wang F. An MCEM framework for drug safety signal detection and combination from heterogeneous real world evidence. Sci Rep. 2018;8(1):1806. doi:10.1038/s41598-018-19979-7
 © 2023 The Author(s). This work is published and licensed by Dove Medical Press Limited. The
full terms of this license are available at https://www.dovepress.com/terms
and incorporate the Creative Commons Attribution
- Non Commercial (unported, 3.0) License.
By accessing the work you hereby accept the Terms. Non-commercial uses of the work are permitted
without any further permission from Dove Medical Press Limited, provided the work is properly
attributed. For permission for commercial use of this work, please see paragraphs 4.2 and 5 of our Terms.
© 2023 The Author(s). This work is published and licensed by Dove Medical Press Limited. The
full terms of this license are available at https://www.dovepress.com/terms
and incorporate the Creative Commons Attribution
- Non Commercial (unported, 3.0) License.
By accessing the work you hereby accept the Terms. Non-commercial uses of the work are permitted
without any further permission from Dove Medical Press Limited, provided the work is properly
attributed. For permission for commercial use of this work, please see paragraphs 4.2 and 5 of our Terms.