Back to Journals » Nature and Science of Sleep » Volume 16
A Machine Learning Prediction Model of Adult Obstructive Sleep Apnea Based on Systematically Evaluated Common Clinical Biochemical Indicators
Authors Huang J ![]() , Zhuang J
, Zhuang J ![]() , Zheng H
, Zheng H ![]() , Yao L, Chen Q
, Yao L, Chen Q ![]() , Wang J, Fan C
, Wang J, Fan C ![]()
Received 21 December 2023
Accepted for publication 10 April 2024
Published 24 April 2024 Volume 2024:16 Pages 413—428
DOI https://doi.org/10.2147/NSS.S453794
Checked for plagiarism Yes
Review by Single anonymous peer review
Peer reviewer comments 2
Editor who approved publication: Dr Sarah L Appleton
Jiewei Huang,1,2 Jiajing Zhuang,2,3 Huaxian Zheng,4 Ling Yao,5,6 Qingquan Chen,7,8 Jiaqi Wang,1,2 Chunmei Fan1
1The Clinical Laboratory Center of the Second Affiliated Hospital of Fujian Medical University, Quanzhou, Fujian Province, 362018, People’s Republic of China; 2The Graduate School of Fujian Medical University, Fuzhou, Fujian Province, 350108, People’s Republic of China; 3Department of Ultrasound, Fujian Medical University Union Hospital, Fuzhou, Fujian Province, 350001, People’s Republic of China; 4The School of Clinical Medicine, Fujian Medical University, Fuzhou, Fujian Province, 350108, People’s Republic of China; 5Fujian Maternity and Child Health Hospital, College of Clinical Medicine for Obstetrics & Gynecology and Pediatrics, Fujian Medical University, Fuzhou, 350000, People’s Republic of China; 6Department of Nephrology, Rheumatology and Immunology, Fujian Children’s Hospital, College of Clinical Medicine for Obstetrics & Gynecology and Pediatrics, Fujian Medical University, Fuzhou, 350014, People’s Republic of China; 7The Sleep Disorder Medicine Center of the Second Affiliated Hospital of Fujian Medical University, Quanzhou, Fujian Province, 362018, People’s Republic of China; 8The School of Public Health, Fujian Medical University, Fuzhou, Fujian Province, 350108, People’s Republic of China
Correspondence: Chunmei Fan, The Clinical Laboratory Center of the Second Affiliated Hospital of Fujian Medical University, Quanzhou, Fujian Province, 362018, People’s Republic of China, Tel +86 15906069575, Email [email protected]
Objective: Obstructive sleep apnea (OSA) is a common and potentially fatal sleep disorder. The purpose of this study was to construct an objective and easy-to-promote model based on common clinical biochemical indicators and demographic data for OSA screening.
Methods: The study collected the clinical data of patients who were referred to the Sleep Medicine Center of the Second Affiliated Hospital of Fujian Medical University from December 1, 2020, to July 31, 2023, including data for demographics, polysomnography (PSG), and 30 biochemical indicators. Univariate and multivariate analyses were performed to compare the differences between groups, and the Boruta method was used to analyze the importance of the predictors. We selected and compared 10 predictors using 4 machine learning algorithms which were “Gaussian Naive Bayes (GNB)”, “Support Vector Machine (SVM)”, “K Neighbors Classifier (KNN)”, and “Logistic Regression (LR)”. Finally, the optimal algorithm was selected to construct the final prediction model.
Results: Among all the predictors of OSA, body mass index (BMI) showed the best predictive efficacy with an area under the receiver operating characteristic curve (AUC) = 0.699; among the predictors of biochemical indicators, triglyceride-glucose (TyG) index represented the best predictive performance (AUC = 0.656). The LR algorithm outperformed the 4 established machine learning (ML) algorithms, with an AUC (F1 score) of 0.794 (0.841), 0.777 (0.827), and 0.732 (0.788) in the training, validation, and testing cohorts, respectively.
Conclusion: We have constructed an efficient OSA screening tool. The introduction of biochemical indicators in ML-based prediction models can provide a reference for clinicians in determining whether patients with suspected OSA need PSG.
Keywords: biochemical indicators, obstructive sleep apnea, machine learning, prediction model, triglyceride-glucose index
Graphical Abstract:

Introduction
Obstructive sleep apnea (OSA) is a globally recognized medical disease. Patients with OSA may experience the upper airway collapsing during sleep, resulting in decreased oxygen saturation and sleep disruption, which is characterized by snoring, apnea, and lethargy. It is common among middle-aged and elderly people and is associated with the development of long-term adverse health consequences, such as cardiovascular disease, cerebrovascular disease, and neurocognitive defects.1–4
In recent years, with the increasing obesity and the ageing population demographic, the overall prevalence of OSA is between 38% and 90%, with a higher prevalence among males.5 China is the most affected country, followed by the United States, Brazil, and India. OSA places a huge burden on the economy and society and also leads to an increased risk of motor vehicle accidents, decreased work efficiency, and a reduced quality of life.6 In 2015 alone, the cost of diagnosing and treating OSA in the United States was about USD 12.4 billion.7
Due to a lack of public awareness of OSA and medical resources, most suspected OSA patients with obesity, hypertension, habitual snoring, and lethargy8 have not been diagnosed or treated, even in developed countries with more resources and higher-quality education.9 According to the research estimates,9 936 million adults aged 30-69 worldwide have mild-to-severe OSA, of which 425 million have moderate-to-severe OSA. Therefore, it is particularly important to realize the large-scale screening of OSA, especially in the high-risk groups, so as to improve the diagnosis and treatment level of OSA and promote the sleep health of people.
Polysomnography (PSG) is the most accurate method for diagnosing OSA at present, which can be used to determine the severity of sleep apnea and to evaluate patients’ response to treatment,10 but it is difficult to popularize because of its cumbersome operation, patients’ non-compliance, and expensive medical expenses. Other PSG-based alternative methods are also difficult to complete for a large number of screening tasks due to economic reasons.11 Therefore, questionnaires are generally used to screen populations, including the Epworth Sleepiness Scale (ESS), the Pittsburgh Sleep Quality Questionnaire (PSQI), and the Function Outcomes of Sleep Questionnaire (FOSQ). However, these questionnaires cannot fully meet the requirements of OSA screening and are accompanied by a high rate of missed diagnoses. This may be related to factors such as low generalization, a large amount of readings, sensitivity to problems, and strong subjectivity.12 Machine learning algorithms have been widely used in the medical field.13–15 Studies have applied basic demographic data, physical examination, clinical history, comorbidities and cointerventions as variables to predict OSA, such as body mass index (BMI), neck circumference, hypertension.16–18 There are also many studies that utilize cephalometry, X-ray, computed tomography (CT), magnetic resonance imaging (MRI), ultrasound, and drug-induced sleep endoscopy to measure OSA-related data, including oral and maxillofacial anatomy measurements, the upper airway, respiratory muscles, subcutaneous adipose tissue (SAT), etc., to analyze the relationship between these data and the apnea-hypopnea index (AHI) and determine the upper airway collapsing, thus exploring their diagnostic efficacy for OSA.19–21 In addition, 3D face features were further extracted in some studies to establish classification algorithms that facilitate the utilization of information regarding linear distances and angles.22 Nevertheless, the application of these diagnostic methods in routine clinical settings is limited due to factors such as cost, human resources, and exposure to radiation.
In recent years, cell biology research on OSA has made great progress. Some biomarkers related to inflammation, oxidative stress, sympathetic activation, and metabolic activity have been shown to be associated with OSA, such as interleukin-6 (IL-6), nitric oxide (NO), cysteine, lipoprotein, etc.23 Due to the hypoxia caused by OSA, the renin-angiotensin-aldosterone system, endothelium, and sympathetic nervous system are activated, causing changes in catechol-O-methyltransferase (COMT) activity, which plays a role in regulating the cardiovascular and metabolic risks in OSA patients.24 What’s more, the level of biomarkers may be related to the severity of OSA. For example, it was found that patients with moderate-to-severe OSA had higher average glucose levels during sleep or waking periods compared to those of the patients with mild OSA,25 and OSA was significantly associated with elevated blood lipid levels.26 The application of these biomarkers may contribute to making the screening less subjective and enabling mass screening.27
This study aims to find easy-to-measure, inexpensive biochemical indicators related to the severity of the disease, which may benefit large-scale OSA screening and further study on the pathophysiological mechanism of OSA. Furthermore, in order to increase the detection rate of OSA and achieve better social and economic benefits, this study aims to construct an OSA prediction model based on selected biochemical indicators, which can provide clinicians with decision reference on prompt referral of patients with suspected OSA and whether they need to undergo PSG. The statement of significance is highlighted in Table 1.
 |
Table 1 Statement of Significance |
Method
Study Population
This study is a retrospective study. The clinical data of 4124 patients who were referred by other clinical departments or actively visited the Sleep Medicine Center of the Second Affiliated Hospital of Fujian Medical University (Donghai Branch) or the Sleep Medicine Center of the Second Affiliated Hospital of Fujian Medical University (Licheng Branch) and underwent PSG examination from December 1, 2020 to July 31, 2023 were retrospectively collected.
Patients were excluded according to the following criteria: (a) having incomplete clinical data, such as missing BMI and biochemical data, etc.; (b) being aged <18 years or ≥80 years; (c) having complicated with severe underlying diseases (such as acute heart failure, acute cerebral infarction, hypokalemia, respiratory failure, or patients who need oxygen due to other conditions), severe lung diseases, and nasopharyngeal and oral diseases.
After exclusion, the relevant clinical data of 892 patients were included, of which 695 patients were from the Donghai Branch, and 197 patients were from the Licheng Branch. The final model of this study selected Donghai Branch patients’ data as the training set and verification set, and Licheng Branch patients’ data as the testing set.
The flowchart of this study has been shown in Figure 1. This study was approved by the Ethics Review Committee of the Second Affiliated Hospital of Fujian Medical University, and this study complies with the Declaration of Helsinki.
 |
Figure 1 The flowchart of preprocessing, dataset splitting, model selecting and final model training. Abbreviations: BMI, body mass index; OSA, obstructive sleep apnea; AHI, apnea-hypopnea index. |
Data Collection
To avoid bias as much as possible, the PSG data and variable data of this study were extracted independently by two dedicated individuals who were unaware of the study background, and the data were analyzed after removing patient privacy information and setting dummy variables.
Data of PSG
According to the specialized medical database system of our sleep medicine center, we queried the patients’ PSG examination reports. Our data sources include two sleep medicine centers located in Donghai Branch and Licheng Branch.
The sleep breathing monitoring equipment in Donghai Branch includes the Australian Condi Grael high-definition polysomnography system and the Australian Condi Somte-PSG polysomnography system.
The sleep breathing detection equipment in Licheng Branch includes the German Snowman polysomnography monitoring system and Iceland Nox Medical’s NOX T3 sleep recorder.
The PSG detection operations in the two branches were performed by their respective nurses and were independent of each other. The interpretation of the PSG report was performed by their respective doctors.
The monitoring items included electroencephalogram, mandibular electromyography, electrooculogram, heat-sensitive and pressure-type oronasal airflow, chest and abdominal movement, oxygen saturation (SaO2), electrocardiogram, leg movement, and body position data. All the PSG data were manually evaluated according to the 2007 edition of the American Academy of Sleep Medicine.28,29 According to diagnostic standards, AHI serves as the main basis for diagnosing the obstructive sleep apnea. The OSA can be diagnosed if the patient has reported symptoms and has 5 or more obstructive respiratory events (AHI ≥ 5 e / h) during sleep per hour in the PSG record. Patients with an AHI between 5-15 are diagnosed with mild OSA, an AHI between 15 and 30 was defined as moderate OSA, and an AHI between 30 and more indicated severe OSA.30
Basic Clinical Data
The clinical basic data of patients were queried using the electronic medical record system of our hospital. These mainly include gender, age, weight, and height. At the same time, the main clinical diagnosis of each patient was inquired. BMI was defined as kg / m2.
Biochemical Indicators Data
The Donghai Branch used the automatic biochemical analyzer (model: Cobas C702; manufacturer: Germany Roche Diagnostics GmbH) to detect the biochemical indicators of patients during fasting.
The Licheng Branch used an automatic biochemical analyzer (model: AU5800; manufacturer: Beckman Coulter, Inc.) from the United States, which also tests the biochemical indicators of the patients during fasting.
Through the patient’s medical record number, the corresponding 30 biochemical indicators were queried using our hospital system.
The triglyceride-glucose (TyG) index was defined as (triglyceride [mg / dL] × glucose [mg / dL] / 2).31 It is considered to be a biomarker of insulin resistance.
Statistical Method
The standard descriptive statistical method was used to analyze the data. The continuous variables are described as mean and standard deviations (SD), and the categorical variables are described by percentages. The Shapiro-Wilk test was used to determine whether variables conform to normal distribution. The normal distribution values were tested using an independent t-test, and the abnormal distribution values were tested using a Mann-Whitney U-test. The chi-square test was used to test the difference between the observed data and the expected data. P < 0.05 was considered to be statistically significant. All statistical analyses were performed using R version 3.6.3 and python version 3.7.
Machine Learning Modeling
Selection of Predictors
Collinearity analysis: Collinearity analysis was performed on factors with statistically significant differences between groups, and factors with variance inflation factor (VIF) > 10 were excluded. Next, the rest of the factors were analyzed.
Univariate and multivariate logistic analysis: Univariate analysis and multivariate logistics were used to analyze the included predictors, and a corresponding odd ratio (OR) value forest map was drawn. Only statistically significant predictors were included in the subsequent analysis and considered as important (P < 0.05).
Then, the receiver operating characteristic (ROC) curve of each predictor was used to evaluate the ability of each predictor to identify the OSA and non-OSA patients.
Impact factor importance analysis: Boruta was used to analyze the importance of the predictors. Boruta is a packaging algorithm that uses random forests to conduct feature selection. The Boruta function evaluates the importance of each variable in a circular manner. For each iteration, the importance of the original variable and the shadow variable is compared.
Machine Learning Model Construction and Evaluation
The 695 patient data from Donghai Branch were randomly divided into a training cohort and validation cohort at a ratio of 7:3, while the 197 patient data from Licheng Branch were used as the testing cohort. Firstly, based on the data from the Donghai Branch, we tried to classify the OSA and non-OSA patients using four machine learning models: “Gaussian Naive Bayes (GNB)”, “Support Vector Machine (SVM)”, “K Neighbors Classifier (KNN)”, and “Logistic Regression (LR)”. The 10-fold cross-validation was applied to reduce the contingency caused by the single division of the training set and the validation set and improve the generalization ability of the prediction model.
Multiple evaluation indicators, including the AUC, sensitivity, specificity, positive predictive value, negative predictive value, and F1 score were used to comprehensively evaluate our machine learning models. Among them, the F1 Score is defined as  , which reconciles the two metrics of precision and recall to provide a more comprehensive model evaluation, especially in a modelling process with imbalanced sample sizes. Its maximum value is 1, while the minimum value is 0. By comprehensively considering these indicators, the optimal one was chosen as the final independent model. The learning curve was plotted to evaluate the relationship between the performance of the predictive model and the size of the training set. The calibration curve was performed to evaluate the predictive accuracy of the classification model, which is the difference between the predicted results of the model and the actual observed results. Decision curve analysis was conducted to calculate the net benefit of the predictive model in a clinical situation.
On the basis of selecting the best prediction model, we created an online risk calculator32 that can use new input patient data for OSA prediction.
Result
Participant Characteristics
After screening, 892 eligible patients were included in the study, of which 695 patients’ data from Donghai Branch were used as the training and validation cohorts, and 197 patients’ data from Licheng Branch were used as the testing cohort. The characteristics of the variables of the patients in the two hospital areas are shown in Supplementary Table 1.
Among the factors of the training cohort, a total of 18 variables were statistically significant in the difference between the OSA and non-OSA groups. In terms of demographic variables, there were significant differences in gender (P<0.001), BMI (P<0.001), and age (P=0.001) between the two groups. Regarding the biochemical indicators related to liver function injuries, the differences in aspartate aminotransferase (AST) (P=0.033), alanine aminotransferase (ALT) (P=0.005), and gamma-glutamyltransferase (GGT) (P<0.001) between the two groups were statistically significant. Among the biochemical indicators related to lipid metabolism, there were statistically significant differences in triglyceride (TG) (P<0.001), high density lipoprotein cholesterol (HDL-C) (P=0.017), apolipoprotein B (ApoB) (P=0.008), and apolipoprotein B/apolipoprotein A1 (ApoB/ApoA1) (P=0.016) between the two groups. Regarding the biochemical indicators related to renal function injuries, the differences in blood urea nitrogen (BUN) (P=0.024), serum creatinine (SCr) (P=0.021), uric acid (UA) (P=0.007), and anion gap (AG) (P=0.004) between the two groups were statistically significant. Among the biochemical indicators related to glucose metabolism, the difference in glucose (GLU) (P<0.001) values between the two groups was statistically significant. In terms of the biochemical indicators related to myocardial injuries, the difference between lactate dehydrogenase (LDH) (P<0.001) and creatine kinase (CK) (P=0.024) was statistically significant. The difference between the TyG indexes (P<0.001) was also statistically significant. The VIF of 18 variables with differences between the groups was less than 10, and it was considered that these variables did not have serious collinearity problems (Details are seen in Supplementary Table 2).
Univariate and Multivariate Analysis
A binary logistics regression model was constructed for univariate analysis. A relationship between age, BMI, ALT, AST, GGT, TG, HDL-C, ApoB, ApoB/ApoA1, BUN, SCr, UA, GLU, LDH, CK, AG, TyG index, gender, and OSA grade was observed, and multivariate analysis was performed. The covariates of the multivariate model were complications, including cardiovascular, cerebrovascular diseases, and diabetes (Details are shown in Supplementary Table 3; a corresponding OR value forest map is presented in Figure 2).
 |
Figure 2 The OR value forest maps of the univariate and multivariate analysis. (A) The forest maps of OR values; (B) The forest maps of adjusted OR values. Abbreviations: OR, odds radio; CI, confidence interval; BMI, body mass index; ALT, alanine aminotransferase; AST, aspartate aminotransferase; GGT, gamma-glutamyltransferase; TG, triglyceride; HDL-C, high density lipoprotein cholesterol; ApoB, apolipoprotein B; ApoB/ApoA1, apolipoprotein B/apolipoprotein A1; BUN, blood urea nitrogen; SCr, serum creatinine; UA, uric acid; GLU, glucose; LDH, lactate dehydrogenase; CK, creatine kinase; AG, anion gap; TyG index, triglyceride-glucose index. |
The results showed that BMI, gender, age, GGT, TG, TyG index, LDH, ApoB, ApoB/ApoA1, AG, HDL-C, GLU, and UA were statistically significant in the univariate and multivariate analyses (P < 0.05). Among them, HDL-C is a protective factor for OSA, and being male and other indicators are risk factors for OSA.
The ROC Curves of Each Variable
The predictive factors generated according to the analysis results were used to identify the OSA and non-OSA groups, and a corresponding receiver operating characteristic curve (ROC curve) (Figure 3) was obtained, and the ROC-related parameters of each variable were calculated (Supplementary Table 4). Among all the predictors, the AUC value of BMI was the highest, reaching 0.699. Among the predictors of biochemical indicators, the AUC value of TyG index was the highest, reaching 0.656.
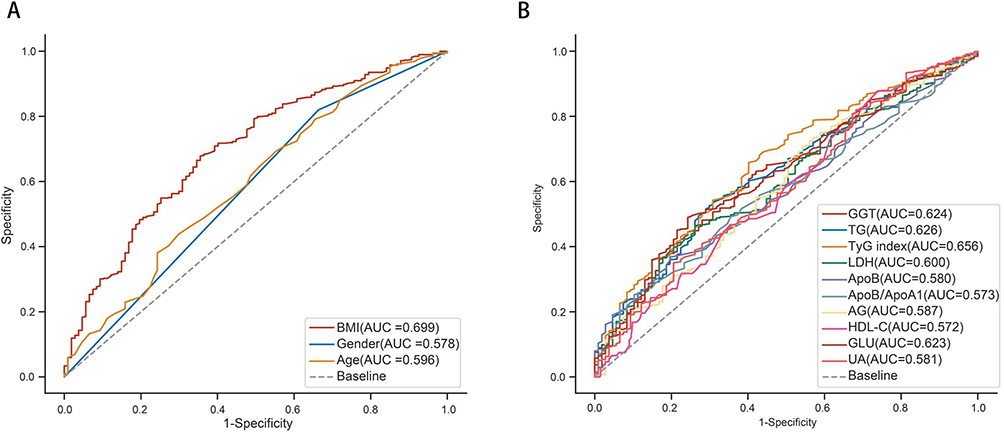 |
Figure 3 The ROC curves of each variable. (A) The ROC curves of demographic variables. (B) The ROC curves of biochemical indicators. Abbreviations: BMI, body mass index; GGT, gamma-glutamyltransferase; TG, triglyceride; TyG index, triglyceride-glucose index; LDH, lactate dehydrogenase; ApoB, apolipoprotein B; ApoB/ApoA1, apolipoprotein B/apolipoprotein A1; AG, anion gap; HDL-C, high density lipoprotein cholesterol; GLU, glucose; UA, uric acid. |
Feature Screening
Boruta was used to analyze the importance of the predictors (Figure 4). Finally, age, BMI, TyG index, TG, gender, ApoB, GGT, ApoB/ApoA1, LDH, and GLU were included as predictors of modeling.
 |
Figure 4 The results of Boruta predictor importance analysis. In the figure, Tentative is yellow, Rejected is red, Accepted is green, and Shadow is blue. Abbreviations: AG, anion gap; UA, uric acid; HDL-C, high density lipoprotein cholesterol; GLU, glucose; LDH, lactate dehydrogenase; ApoB/ApoA1, apolipoprotein B/apolipoprotein A1; GGT, gamma-glutamyltransferase; ApoB, apolipoprotein B; TG, triglyceride; TyG index, triglyceride-glucose index; BMI, body mass index. |
Four Machine Learning Models
The models were established using the training/verification mechanism of 10-fold cross-validation. The parameters and performance evaluation indexes of the four models are shown in Supplementary Tables 5–7. Ranked according to the AUC, the KNN performed best in the training set, and the LR model performed best in the validation set among all the models (Figure 5). The inconsistency between the two results may indicate that KNN over-fits, while the LR model may have relatively good stability. With the highest F1 score and the best performance shown in the calibration curve, the LR model was selected as the final model.
 |
Figure 5 Results of four prediction models. (A) The ROC curves of four prediction models in the training set; (B) The ROC curves of four prediction models in the validation set; (C) The forest plots of AUCs in each model; (D) The calibration curves of four prediction models. Abbreviations: ROC, receiver operating characteristic; AUC, area under the receiver operating characteristic curve; SD, standard deviations; LR, Logistic Regression; GNB, Gaussian Naive Bayes; SVM, Support Vector Machine; KNN, K Neighbors Classifier. |
Logistic Regression Prediction Model
The LR machine learning method was used to classify the OSA and non-OSA groups. The variables in the model included age, gender, BMI, ApoB/ApoA1, ApoB, LDH, GLU, TG, GGT, and TyG index.
The model parameters are: C (regularization factor): 1.0; max_iter (number of iterations): 100; penalty (regularization type): l2; Tol (convergence measure): 0.0001.
In this model, the patient data from Licheng were used as the testing cohort, N = 197 cases (22.09%), and the patient data from Donghai were used as the training cohort. Ten-fold cross-validation was performed, and an AUC = 0.777 ± 0.071 was obtained in the validation cohort. The final model had an AUC = 0.732 and accuracy = 0.701 in the testing cohort (Table 2; Figure 6).
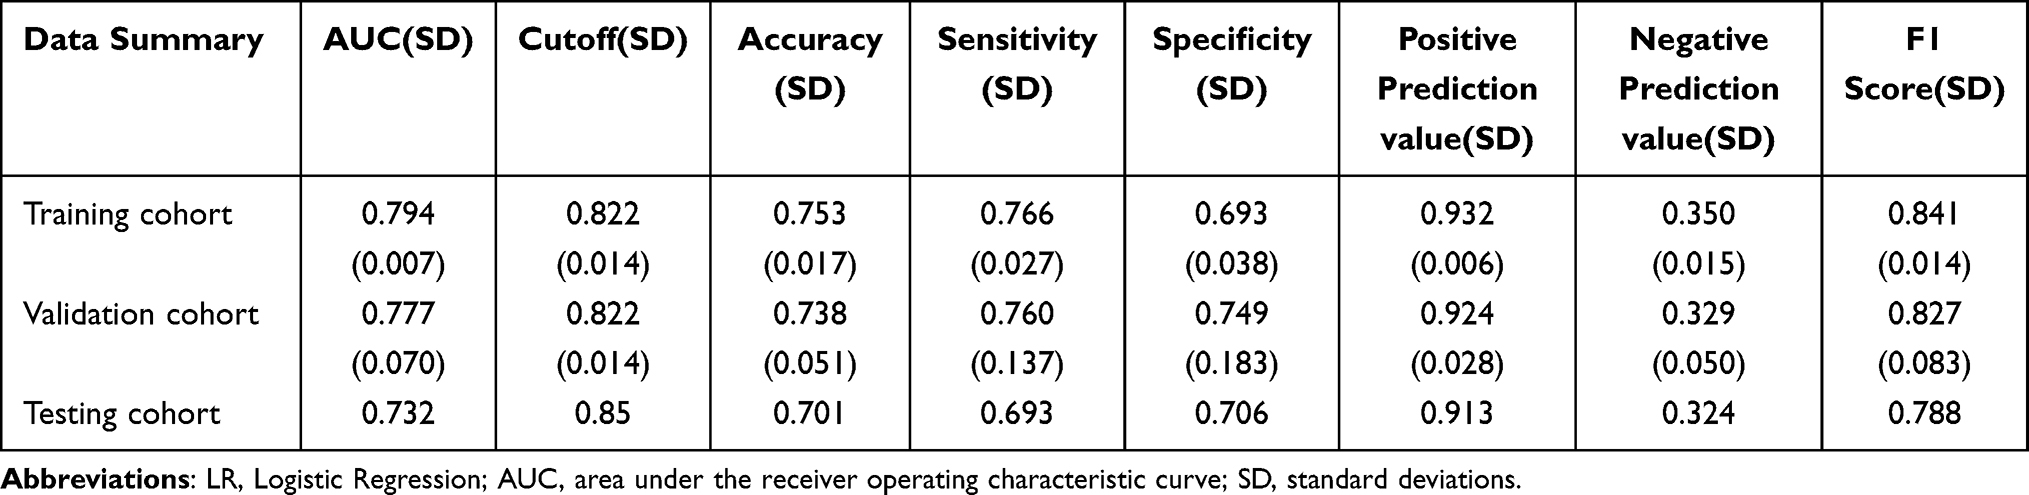 |
Table 2 Model Performance and AUC of the LR Model |
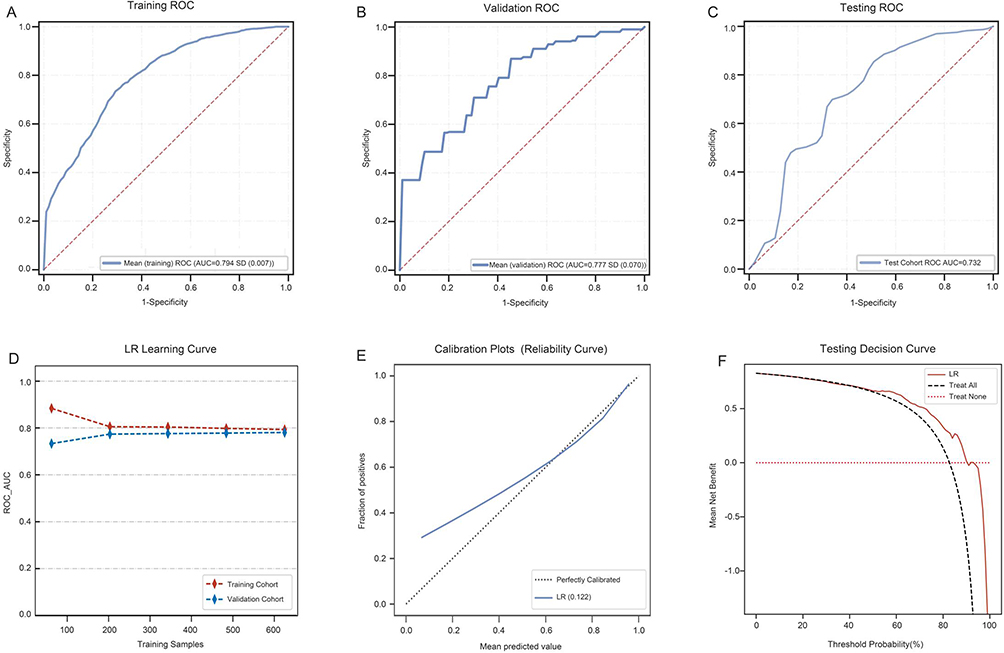 |
Figure 6 Results of the LR prediction model. (A) The ROC curve of the LR model in the training set; (B) The ROC curve of the LR model in the validation set; (C) The ROC curve of the LR model in the test set; (D) The learning curve of the LR model; (E) The calibration curve of the LR model; (F) The clinical decision curve of the LR model. Abbreviations: ROC, the receiver operating characteristic; AUC, area under the receiver operating characteristic curve; SD, standard deviations; LR, Logistic Regression. |
The AUC difference between the validation and testing cohorts was less than 10%, which reflected successful fitting. The learning curve of the model (Figure 6) showed that the performance of the LR model in the training cohort and the validation cohort tended to be stable after 500 samples were acquired. Considering the sample imbalance in the data, the F1 score was a more reasonable model evaluation index than the accuracy rate. In the test set, the F1 score of the model reached 0.788, indicating that this model had a higher quality. In addition to the above indicators, the calibration and clinical decision curves of this LR model performed well (Figure 6) and had a practical clinical application value. Based on this model, an online risk calculator tool was built at http://psg.angelong.cn/.
Discussion
Principal Findings
OSA patients may have complications such as hypertension, coronary heart disease, stroke, and other serious consequences such as sudden death at night. Therefore, early screening and diagnosis of OSA are very important for the timely detection and treatment of related complications and the improvement of patients’ quality of life.
To our knowledge, this study was the first one to systematically evaluate the relationship between the common clinical biochemical indicators and OSA. Among the included demographic indicators and 30 biochemical indicators, 10 predictors were ultimately selected to discriminate OSA patients from non-OSA groups. The applied predictors included age, gender, BMI, ApoB/ApoA1, ApoB, LDH, GLU, TG, GGT, and TyG index.
Among the biochemical indicators, the TyG index achieved a highest AUC for differentiating the OSA and non-OSA groups, indicating that it may be a reliable predictor. This is consistent with the results of previous studies. It has been shown that OSA is independently associated with a higher TyG index, and the TyG index is associated with disease severity in non-obese and non-diabetic subjects.31,33 The predictive ability of the TyG index may be related to insulin resistance (IR), which is caused by changes in lipid metabolism, glucose treatment, the gastrointestinal microbiota, and inflammation.34 Due to the down-regulation of the insulin receptor in adipocytes and skeletal muscle,35 β cell dysfunction, sympathetic nerve bursts,36 and hormone changes, chronic intermittent hypoxia may lead to OSA-related IR,37–40 while the TyG index is a marker of IR.41
Elevated TG levels were found to increase the OSA risk, while there was a negative correlation between HDL-C and the risk of OSA, which was consistent with the results of Zheng et al’s study.42 OSA is closely related to the lipoprotein and lipid metabolisms. Among them, triglyceride/HDL-C, total cholesterol (TC)/HDL-C, and the atherogenic index are more predictive of severe OSA than the other non-traditional lipid indicators.43 For example, HDL-C can inhibit cytokine expression and has anti-inflammatory and anti-oxidative effects, while OSA patients have elevated levels of oxidative stress and systemic inflammatory response, which can lead to decreased HDL-C levels.44,45 The AHI of non-rapid eye movement sleep (NREM) was independently associated with the maximum number of changes in the blood lipid profile, including TC, low density lipoprotein cholesterol (LDL-C), and ApoB.46 This provides a new idea for the inclusion of predictors in subsequent research.
In addition, OSA is closely related to systemic damage, and our study also shows that OSA patients can have a number of abnormal blood biochemical indicators related to organ dysfunction.
OSA induces systemic inflammatory response and oxidative stress. Oxidative stress further activates the inflammatory pathway, leading to hepatocyte inflammation and various liver diseases of nonalcoholic steatohepatitis (NASH).47 The risk of liver disease in OSA patients doubled, and there was a relationship between OSA and steatosis progression to steatohepatitis.48,49 The OSA-related liver function damage is further reflected in abnormal blood biochemical indicators, such as GGT.
Abnormal indicators such as UA and AG suggests that OSA may be associated with renal function damage. It was reported that there may be a two-way relationship between OSA and chronic kidney disease (CKD), and the prevalence of CKD increases with the number of metabolic disease comorbidities.50,51
We found that the ApoB/ApoA1 ratio increased with the severity of OSA, which is consistent with other studies.52 OSA is considered to be a cardiovascular risk factor.53 Intermittent hypoxia (IH), one of the characteristics of OSA, can directly or indirectly lead to myocardial cell death and myocardial injury by regulating a variety of biological processes.54 This suggests that OSA may be associated with cardiovascular function damage, which is further reflected in abnormal blood biochemical indicators such as CK and LDH.
Considering the huge burden caused by the disease progress, OSA is still underdiagnosed in clinical settings. The developed questionnaire-based OSA prediction tools mostly face challenges such as strong subjectivity, a recall bias, the difficulty of observation, a large number of readings, and low-level accuracy.12,55,56 With the increasing application of machine learning in the medical field, there have been studies on the construction of disease prediction models based on clinical biochemical indicators.57–59 It is of great significance to construct an objective biochemical-indicator-based model combining common demographic and anthropometric indexes for distinguishing OSA patients, which has potential benefits in improving the diagnostic accuracy, avoiding a subjective bias, and reducing the observation difficulty.
The AUC of the model developed in this study reached 0.732 in the test set, which was similar to those of other studies. An OSA prediction model based on the BMI, gender, blood glucose, and age of obese patients achieved a predictive efficiency of 83%,60 while another OSA prediction model based on general demographic characteristics, blood gas analysis data, and the TyG index reached an AUC of 0.688.61 These studies indicate that the application of machine learning algorithms can improve the diagnostic value of biochemical metrics for OSA.
Considering that the clinical biochemical indicators applied in the model are all common and easy to obtain, with no additional cost and high equipment requirements, this model can be used to screen OSA in tertiary, secondary, and primary hospitals. All of these increase the generalization of the model.
When individuals at high risk of OSA undergo a physical examination or seek medical attention in other departments for complications, blood biochemical results can be utilized to generate predictive outcomes in the model. The online risk calculator tool can provide a numerical value of the probability of disease occurrence, when patients and doctors enter values for 10 predictors remotely on the website. For suspected OSA patients identified through the model, healthcare professionals can recommend a referral to a professional sleep medicine center for corresponding help, so as to enhance public awareness of OSA and improve the diagnosis and treatment rate of OSA. For patients with suspected OSA who have visited sleep medicine specialists, the model can assist doctors in making an early diagnosis and determining the necessity of polysomnography, considering its complexity and cost. In addition, the dynamic changes in blood biochemical indicators make this model a promising tool for continuous evaluation of the efficacy of OSA patients.
Strengths and Limitations
Compared with previous studies, we employed commonly used clinical biochemical indicators to predict OSA for the first time and incorporated additional objective indicators such as demographic data as predictors. This may mitigate subjective and recall biases, thereby enhancing the accuracy of OSA diagnosis. What’s more, the sample size calculations were performed using an online interactive tool.62 The findings indicated that a minimum sample size of 680 was required, in addition to the implementation of 10-fold cross validation, thereby demonstrating the adequacy of our sample size in ensuring the requisite statistical power for robust outcomes.
Despite the aforementioned advantages, our research still possesses certain limitations. Firstly, we only used age, BMI, gender, and common clinical biochemical indicators to establish the prediction models. However, it is important to acknowledge that OSA is also influenced by genetic factors, which we did not consider in this study. Secondly, both our internal and external validation were geographically limited and lacked validation across diverse ethnic groups and populations. Therefore, we intend to conduct external validation in other institutions to verify our prediction model. Thirdly, socio-economic factors are conducive to a more comprehensive understanding of OSA and its correlation. However, we were unable to collect socio-economic information due to the retrospective nature of our study. Lastly, the prevalence of OSA in our sleep center is higher than that in the general population, and our prediction model may be more suitable for guiding the referral of patients with suspected OSA.
Conclusions
Machine learning models have the potential to enhance the diagnostic value of biochemical metrics for obstructive sleep apnea. We have developed an efficient OSA screening tool, and incorporating biochemical indicators into machine learning-based prediction models holds promise in assisting clinicians to determine whether patients with suspected OSA require further diagnosis and treatment.
Abbreviations
OSA, obstructive sleep apnea; PSG, polysomnography; GNB, gaussian naive bayes; SVM, support vector machine; KNN, K Neighbors Classifier; LR, Logistic Regression; BMI, body mass index; AUC, area under the receiver operating characteristic curve; TyG index, triglyceride-glucose index; ML, machine learning; ESS, Epworth Sleepiness Scale; PSQI, Pittsburgh Sleep Quality Questionnaire; FOSQ, Function Outcomes of Sleep Questionnaire; CT, computed tomography; MRI, magnetic resonance imaging; SAT, subcutaneous adipose tissue; AHI, apnea-hypopnea index; IL-6, interleukin-6; NO, nitric oxide; COMT, catechol-O-methyltransferase; SaO2, oxygen saturation; SD, standard deviations; VIF, variance inflation factor; OR, odd ratio; ROC, receiver operating characteristic; AST, aspartate aminotransferase; ALT, alanine aminotransferase; GGT, gamma-glutamyltransferase; TG, triglyceride; HDL-C, high density lipoprotein cholesterol; ApoB, apolipoprotein B; ApoB/ApoA1, apolipoprotein B/apolipoprotein A1; BUN, blood urea nitrogen; SCr, serum creatinine; UA, uric acid; AG, anion gap; GLU, glucose; LDH, lactate dehydrogenase; CK, creatine kinase; IR, insulin resistance; TC, total cholesterol; NREM, non-rapid eye movement sleep; LDL-C, low density lipoprotein cholesterol; NASH, nonalcoholic steatohepatitis; CKD, chronic kidney disease; IH, intermittent hypoxia.
Institutional Review Board Statement
The ethical review number is [2023] The Second Affiliated Hospital of Fujian Medical University Ethical Review No. (324).
Data Sharing Statement
The datasets used and/or analyzed during the current study are available from the corresponding author on reasonable request.
Informed Consent Statement
Informed consent was obtained from all subjects involved in the study.
Author Contributions
All authors made a significant contribution to the work reported, whether that is in the conception, study design, execution, acquisition of data, analysis and interpretation, or in all these areas; took part in drafting, revising or critically reviewing the article; gave final approval of the version to be published; have agreed on the journal to which the article has been submitted; and agree to be accountable for all aspects of the work.
Funding
This research was financially supported by Quanzhou City Science & Technology Program of China [grant numbers: 2021C061R].
Disclosure
The authors declare no conflicts of interest in this work.
References
1. Jordan AS, McSharry DG, Malhotra A. Adult obstructive sleep apnoea. Lancet. 2014;383(9918):736–747. doi:10.1016/S0140-6736(13)60734-5
2. Yaggi HK, Strohl KP. Adult obstructive sleep apnea/hypopnea syndrome: definitions, risk factors, and pathogenesis. Clinics Chest Med. 2010;31(2):179–186. doi:10.1016/j.ccm.2010.02.011
3. Chang JL, Goldberg AN, Alt JA, et al. International consensus statement on obstructive sleep apnea. Int Forum Allergy Rhinol. 2023;13:1061–1482. doi:10.1002/alr.23079
4. Malec SA, Taneja SB, Albert SM, et al. Causal feature selection using a knowledge graph combining structured knowledge from the biomedical literature and ontologies: a use case studying depression as a risk factor for Alzheimer’s disease. J Biomed Informat. 2023;142:104368. doi:10.1016/j.jbi.2023.104368
5. Senaratna CV, Perret JL, Lodge CJ, et al. Prevalence of obstructive sleep apnea in the general population: a systematic review. Sleep Med Rev. 2017;34:70–81. doi:10.1016/j.smrv.2016.07.002
6. Léger D, Stepnowsky C. The economic and societal burden of excessive daytime sleepiness in patients with obstructive sleep apnea. Sleep Med Rev. 2020;51:101275. doi:10.1016/j.smrv.2020.101275
7. Watson NF; Watson NF. Health care savings: the economic value of diagnostic and therapeutic care for obstructive sleep apnea. J Clin Sleep Med. 2016;12(08):1075–1077. doi:10.5664/jcsm.6034
8. Ward FW. Obstructive sleep apnea. New Engl J Med. 2002. doi:10.1056/NEJMcp012849
9. Benjafield AV, Ayas NT, Eastwood PR, et al. Estimation of the global prevalence and burden of obstructive sleep apnoea: a literature-based analysis. Lancet Respir Med. 2019;7(8):687–698. doi:10.1016/S2213-2600(19)30198-5
10. Kushida CA, Littner MR, Morgenthaler T, et al. Practice parameters for the indications for polysomnography and related procedures: an update for 2005. Sleep. 2005;28(4):499–523. doi:10.1093/sleep/28.4.499
11. Kapoor M, Greenough G. Home sleep tests for Obstructive Sleep Apnea (OSA). J Am Board Family Med. 2015;28(4):504–509. doi:10.3122/jabfm.2015.04.140266
12. Gamaldo C, Buenaver L, Chernyshev O, et al. Evaluation of clinical tools to screen and assess for obstructive sleep apnea. J Clin Sleep Med. 2018;14(07):1239–1244. doi:10.5664/jcsm.7232
13. Yue H, Lin Y, Wu Y, et al. Deep learning for diagnosis and classification of obstructive sleep apnea: a nasal airflow-based multi-resolution residual network. Nat Sci Sleep. 2021;13:361–373. doi:10.2147/NSS.S297856
14. Hu M, Duan A, Huang Z, et al. Development and validation of a nomogram for predicting obstructive sleep apnea in patients with pulmonary arterial hypertension. Nat Sci Sleep. 2022;14:1375–1386. doi:10.2147/NSS.S372447
15. Benedetti D, Olcese U, Bruno S, et al. Obstructive sleep apnoea syndrome screening through wrist-worn smartbands: a machine-learning approach. NSS. 2022;14:941–956. doi:10.2147/NSS.S352335
16. Ferreira-Santos D, Rodrigues PP. Enhancing obstructive sleep apnea diagnosis with screening through disease phenotypes: algorithm development and validation. JMIR Med Inform. 2021;9(6):e25124. doi:10.2196/25124
17. Molnár V, Kunos L, Tamás L, Lakner Z. Evaluation of the applicability of artificial intelligence for the prediction of obstructive sleep apnoea. Appl Sci. 2023;13(7):4231. doi:10.3390/app13074231
18. Yan X, Wang L, Liang C, et al. Development and assessment of a risk prediction model for moderate-to-severe obstructive sleep apnea. Front Neurosci. 2022;16:936946. doi:10.3389/fnins.2022.936946
19. Molnár V, Lakner Z, Molnár A, et al. The predictive role of subcutaneous adipose tissue in the pathogenesis of obstructive sleep apnoea. Life. 2022;12(10):1504. doi:10.3390/life12101504
20. Liu SYC, Bosschieter PFN, Abdelwahab M, et al. Association of backscattered ultrasonographic imaging of the tongue with severity of obstructive sleep apnea in adults. JAMA Otolaryngol Head Neck Surg. 2023;149(7):580–586. doi:10.1001/jamaoto.2023.0589
21. Molnár V, Lakner Z, Molnár A, et al. The predictive role of the upper-airway adipose tissue in the pathogenesis of obstructive sleep apnoea. Life. 2022;12(10):1543. doi:10.3390/life12101543
22. Eastwood P, Gilani SZ, McArdle N, et al. Predicting sleep apnea from three-dimensional face photography. J Clin Sleep Med. 2020;16(4):493–502. doi:10.5664/jcsm.8246
23. Ramasamy I. Recent advances in physiological lipoprotein metabolism. Clin Chem Lab Med. 2014;52(12):1695–1727. doi:10.1515/cclm-2013-0358
24. Bisogni V, Maiolino G, Ceolotto G, et al. Design of a study to investigate the mechanisms of obstructive sleep apnoea by means of drug-induced sleep endoscopy. Clin Chem Lab Med. 2019;57(9):1406–1413. doi:10.1515/cclm-2019-0113
25. Aurora RN, Gaynanova I, Patel P, Punjabi NM. Glucose profiles in obstructive sleep apnea and type 2 diabetes mellitus. Sleep Med. 2022;95:105–111. doi:10.1016/j.sleep.2022.04.007
26. Gündüz C, Basoglu OK, Hedner J, et al. Obstructive sleep apnoea independently predicts lipid levels: data from the European Sleep Apnea Database. Respirology. 2018;23(12):1180–1189. doi:10.1111/resp.13372
27. Hauquiert B, Drion E, Deflandre E. Place des biomarqueurs dans le dépistage du SAHOS. Une revue narrative de la littérature. Revue des Maladies Respiratoires. 2021;38(5):455–465. doi:10.1016/j.rmr.2021.04.005
28. Iber C, Ancoli-Israel S, Chesson AL, Quan S. The AASM Manual for the Scoring of Sleep and Associated Events: Rules, Terminology and Technical Specifications. Westchester, IL: American Academy of Sleep Medicine; 2007.
29. Berry RB, Budhiraja R, Gottlieb DJ, et al. Rules for scoring respiratory events in sleep: update of the 2007 AASM Manual for the scoring of sleep and associated events: deliberations of the sleep apnea definitions task force of the American academy of sleep medicine. J Clin Sleep Med. 2012;08(05):597–619. doi:10.5664/jcsm.2172
30. Mendonca F, Mostafa SS, Ravelo-Garcia AG, et al. A review of obstructive sleep apnea detection approaches. IEEE J Biomed Health Inform. 2019;23(2):825–837. doi:10.1109/JBHI.2018.2823265
31. Bikov A, Frent SM, Meszaros M, et al. Triglyceride-Glucose Index in non-diabetic, non-obese patients with obstructive sleep apnoea. JCM. 2021;10(9):1932. doi:10.3390/jcm10091932
32. The logistic prediction model of adult obstructive sleep apnea based on common clinical biochemical indicators. Available from: http://psg.angelong.cn/.
33. Zou J, Wang Y, Xu H, et al. The use of visceral adiposity variables in the prediction of obstructive sleep apnea: evidence from a large cross-sectional study. Sleep Breath. 2020;24(4):1373–1382. doi:10.1007/s11325-019-01980-7
34. Gasmi A, Noor S, Menzel A, et al. Obesity and insulin resistance: associations with chronic inflammation, genetic and epigenetic factors. CMC. 2021;28(4):800–826. doi:10.2174/0929867327666200824112056
35. Sacramento JF, Ribeiro MJ, Rodrigues T, et al. Insulin resistance is associated with tissue-specific regulation of HIF-1α and HIF-2α during mild chronic intermittent hypoxia. Respir Physiol Neurobiol. 2016;228:30–38. doi:10.1016/j.resp.2016.03.007
36. Song SO, He K, Narla RR, et al. Metabolic consequences of obstructive sleep apnea especially pertaining to diabetes mellitus and insulin sensitivity. Diabetes Metab J. 2019;43(2):144. doi:10.4093/dmj.2018.0256
37. Lindberg E, Theorell-Haglöw J, Svensson M, et al. Sleep apnea and glucose metabolism: a long-term follow-up in a community-based sample. Chest. 2012;142(4):935–942. doi:10.1378/chest.11-1844
38. Punjabi NM, Sorkin JD, Katzel LI, et al. Sleep-disordered breathing and insulin resistance in middle-aged and overweight men. Am J Respir Crit Care Med. 2002;165(5):677–682. doi:10.1164/ajrccm.165.5.2104087
39. Meszaros M, Kunos L, Tarnoki AD, et al. The role of soluble low-density lipoprotein receptor-related protein-1 in obstructive sleep apnoea. J Clin Med. 2021;10(7):1494. doi:10.3390/jcm10071494
40. Gabryelska A, Karuga FF, Szmyd B, Białasiewicz P. HIF-1α as a mediator of insulin resistance, T2DM, and its complications: potential links with obstructive sleep apnea. Front Physiol. 2020;11:1035. doi:10.3389/fphys.2020.01035
41. Simental-Mendía LE, Rodríguez-Morán M, Guerrero-Romero F. The product of fasting glucose and triglycerides as surrogate for identifying insulin resistance in apparently healthy subjects. Metabol Syndr Relat Disord. 2008;6(4):299–304. doi:10.1089/met.2008.0034
42. Zheng M, Duan X, Zhou H, et al. Association between glycolipids and risk of obstructive sleep apnea: a population-based study. Front Nutr. 2023;10:974801. doi:10.3389/fnut.2023.974801
43. Fang Y, Su J, Zhao C, et al. Association between nontraditional lipid profiles and the severity of obstructive sleep apnea: a retrospective study. Clin LabAnal. 2022:e24499. doi:10.1002/jcla.24499
44. Nadeem R, Singh M, Nida M, et al. Effect of obstructive sleep apnea hypopnea syndrome on lipid profile: a meta-regression analysis. J Clin Sleep Med. 2014;10(05):475–489. doi:10.5664/jcsm.3690
45. Tan KCB, Chow W-S, Lam JCM, et al. HDL dysfunction in obstructive sleep apnea. Atherosclerosis. 2006;184(2):377–382. doi:10.1016/j.atherosclerosis.2005.04.024
46. Xu H, Xia Y, Li X, et al. Association between obstructive sleep apnea and lipid metabolism during REM and NREM sleep. J Clin Sleep Med. 2020;16(4):475–482. doi:10.5664/jcsm.8242
47. Jakubíková J, Kabátová Z, Pavlovčinová G, Profant M. Newborn hearing screening and strategy for early detection of hearing loss in infants. Int J Pediatr Otorhinolaryngol. 2009;73(4):607–612. doi:10.1016/j.ijporl.2008.12.006
48. Musso G, Cassader M, Olivetti C, et al. Association of obstructive sleep apnoea with the presence and severity of non-alcoholic fatty liver disease. A systematic review and meta-analysis: OSAS and NAFLD. Obes Rev. 2013;14(5):417–431. doi:10.1111/obr.12020
49. Chou T-C. Obstructive sleep apnea is associated with liver disease: a population-based cohort study. Sleep Med. 2015. doi:10.1016/j.sleep.2015.02.542
50. Hui M, Li Y, Ye J, et al. Obstructive sleep apnea-hypopnea syndrome (OSAHS) comorbid with diabetes rather than OSAHS alone serves an independent risk factor for chronic kidney disease (CKD). Ann Palliat Med. 2020;9(3):858–869. doi:10.21037/apm.2020.03.21
51. Lin C-H, Lurie RC, Lyons OD. Sleep Apnea and Chronic Kidney Disease. Chest. 2020;157(3):673–685. doi:10.1016/j.chest.2019.09.004
52. Cao B, Fan Z, Zhang Y, Li T. Independent association of severity of obstructive sleep apnea with lipid metabolism of atherogenic index of plasma (AIP) and apoB/apoAI ratio. Sleep Breath. 2020;24(4):1507–1513. doi:10.1007/s11325-020-02016-1
53. Salari N, Khazaie H, Abolfathi M, et al. The effect of obstructive sleep apnea on the increased risk of cardiovascular disease: a systematic review and meta-analysis. Neurol Sci. 2022;43(1):219–231. doi:10.1007/s10072-021-05765-3
54. Liu W, Zhu Q, Li X, et al. Effects of obstructive sleep apnea on myocardial injury and dysfunction: a review focused on the molecular mechanisms of intermittent hypoxia. Sleep Breathing. 2023. doi:10.1007/s11325-023-02893-2
55. Chiu H-Y, Chen P-Y, Chuang L-P, et al. Diagnostic accuracy of the Berlin questionnaire, STOP-BANG, STOP, and Epworth sleepiness scale in detecting obstructive sleep apnea: a bivariate meta-analysis. Sleep Med Rev. 2017;36:57–70. doi:10.1016/j.smrv.2016.10.004
56. Wang D, Ren Y, Chen R, et al. Establishment and application evaluation of an improved obstructive sleep apnea screening questionnaire for Chinese Community: the CNCQ-OSA. NSS. 2023;15:103–114. doi:10.2147/NSS.S396695
57. Cabitza F, Campagner A, Ferrari D, et al. Development, evaluation, and validation of machine learning models for COVID-19 detection based on routine blood tests. Clin Chem Lab Med. 2021;59(2):421–431. doi:10.1515/cclm-2020-1294
58. Hatami B, Asadi F, Bayani A, et al. Machine learning-based system for prediction of ascites grades in patients with liver cirrhosis using laboratory and clinical data: design and implementation study. Clin Chem Lab Med. 2022;60(12):1946–1954. doi:10.1515/cclm-2022-0454
59. Fleming WE, Holty J-EC, Bogan RK, et al. Use of blood biomarkers to screen for obstructive sleep apnea. Nat Sci Sleep. 2018;10:159–167. doi:10.2147/NSS.S164488
60. Ahlin S, Manco M, Panunzi S, et al. A new sensitive and accurate model to predict moderate to severe obstructive sleep apnea in patients with obesity. Medicine. 2019;98(32):e16687. doi:10.1097/MD.0000000000016687
61. Kang HH, Kim SW, Lee SH. Association between triglyceride glucose index and obstructive sleep apnea risk in Korean adults: a cross-sectional cohort study. Lipids Health Dis. 2020;19(1):182. doi:10.1186/s12944-020-01358-9
62. Riley RD, Ensor J, Snell KIE, et al. Calculating the sample size required for developing a clinical prediction model. BMJ. 2020:m441. doi:10.1136/bmj.m441
 © 2024 The Author(s). This work is published and licensed by Dove Medical Press Limited. The
full terms of this license are available at https://www.dovepress.com/terms
and incorporate the Creative Commons Attribution
- Non Commercial (unported, 3.0) License.
By accessing the work you hereby accept the Terms. Non-commercial uses of the work are permitted
without any further permission from Dove Medical Press Limited, provided the work is properly
attributed. For permission for commercial use of this work, please see paragraphs 4.2 and 5 of our Terms.
© 2024 The Author(s). This work is published and licensed by Dove Medical Press Limited. The
full terms of this license are available at https://www.dovepress.com/terms
and incorporate the Creative Commons Attribution
- Non Commercial (unported, 3.0) License.
By accessing the work you hereby accept the Terms. Non-commercial uses of the work are permitted
without any further permission from Dove Medical Press Limited, provided the work is properly
attributed. For permission for commercial use of this work, please see paragraphs 4.2 and 5 of our Terms.