")
Back to Journals » OncoTargets and Therapy » Volume 14
A Immune-Related Signature Associated with TME Can Serve as a Potential Biomarker for Survival and Sorafenib Resistance in Liver Cancer
Authors Ju M , Jiang L , Wei Q, Yu L, Chen L, Wang Y, Hu B, Qian P, Zhang M, Zhou C, Li Z, Wei M, Zhao L, Han J
Received 13 July 2021
Accepted for publication 6 October 2021
Published 20 October 2021 Volume 2021:14 Pages 5065—5083
DOI https://doi.org/10.2147/OTT.S326784
Checked for plagiarism Yes
Review by Single anonymous peer review
Peer reviewer comments 2
Editor who approved publication: Dr William C. Cho
Mingyi Ju,1,2,* Longyang Jiang,1,2,* Qian Wei,1,2 Lifeng Yu,1,2 Lianze Chen,1,2 Yan Wang,1,2 Baohui Hu,1,2 Ping Qian,1,2 Ming Zhang,1,2 Chenyi Zhou,1,2 Zinan Li,1,2 Minjie Wei,1– 3 Lin Zhao,1,2 Jiali Han4
1Department of Pharmacology, School of Pharmacy; China Medical University, Shenyang, Liaoning Province, 110122, People’s Republic of China; 2Liaoning Key Laboratory of Molecular Targeted Anti-Tumor Drug Development and Evaluation, Liaoning Cancer Immune Peptide Drug Engineering Technology Research Center, Key Laboratory of Precision Diagnosis and Treatment of Gastrointestinal Tumors, Ministry of Education, China Medical University, Shenyang, Liaoning Province, 110122, People’s Republic of China; 3Liaoning Medical Diagnosis and Treatment Center, Shenyang, Liaoning Province, People’s Republic of China; 4Department of Otolaryngology, The First Hospital of China Medical University, Shenyang, Liaoning, 110001, People’s Republic of China
*These authors contributed equally to this work
Correspondence: Jiali Han
Department of Otolaryngology, The First Hospital of China Medical University, Shenyang, Liaoning, 110001, People’s Republic of China
Tel +86 18102489275
Email [email protected]
Lin Zhao
Department of Pharmacology, School of Pharmacy, China Medical University, No. 77 Puhe Road, Shenyang North New Area, Shenyang, 110122, Liaoning, People’s Republic of China
Tel +86 18900911856
Email [email protected]; [email protected]
Objective: Although many curative treatments are being applied in the clinic, a significant number of patients with liver hepatocellular carcinoma (LIHC) suffer from drug resistance. The tumour microenvironment (TME) has been found to be closely associated with resistance, suggesting that identification of predictive biomarkers related to the TME for resistance in LIHC will be very rewarding. However, there has been no study dedicated to identifying a TME-related biomarker that has the potential to predict resistance in LIHC.
Methods: An integrated analysis was conducted based on data of patients with LIHC suffering from drug resistance from the TCGA database and four GEO datasets. Subsequently, we also validated the expression levels of the identified genes in paraffin-embedded LIHC samples by immunohistochemistry.
Results: In this study, we developed a robust and acute TME-related signature consisted of five immune-related genes (FABP6, CD4, PRF1, EREG and COLEC10) that could independently predict both the RFS and OS of LIHC patients. Moreover, the TME-related signature was significantly associated with the immune score, immune cytolytic activity (CYT), HLA, interferon (IFN) response and tumour-infiltrating lymphocytes (TILs), and it might influence tumour immunity mainly by affecting B cells, CD8+ T cells and dendritic cells. Furthermore, our analysis also indicated that the TME-related signature was correlated with the immunotherapy response and had an enormous potential to predict sorafenib resistance in LIHC.
Conclusion: Our findings demonstrated a TME-related signature which can independently predict both the RFS and OS of LIHC patients, highlighting the predictive potential of the signature for immunotherapy response and sorafenib resistance, potentially enabling more precise and personalized sorafenib treatment in LIHC in the future.
Keywords: liver cancer, tumour microenvironment, immunotherapy, sorafenib resistance, prognostic signature
Introduction
As one of the most frequent causes of cancer deaths across the globe, liver cancer, characterized by high mortality, recurrence, metastasis and poor prognosis, is the only one of the top five deadliest cancers to have an annual percentage increase in occurrence.1
Surgery, local destructive therapies, and liver transplantation are usually thought to be potentially curative treatments for patients with early liver hepatocellular carcinoma (LIHC). However, the recurrence of LIHC remains a major problem after curative treatment, reaching an incidence of more than 70% at 5 years.2
Tumor microenvironment (TME), broadly classified into cellular and non-cellular components, has been reported to have critically influence on liver cancer initiation, progression, invasion, and metastasis,3 as importantly, on responses to immunotherapy treatment.4 Liver is one of the three organs most susceptible to hypoxia and Existing studies have found that hypoxia was potential induction to the metastasis and poor prognosis of LIHC.5 As cellular components of TME, immune cells usually play crucial roles and have been demonstrated to be valuable for diagnostic and prognostic assessment of tumors.6 Previous studies have reported that hypoxia can regulate the status of tumor immune microenvironment, such as promoting the recruitment of innate immune cells and interfering with the differentiation and function of adaptive immune cells.7 Inflammatory monocytes, infiltration and M2-polarisation of tumor associated macrophages (TAMs) could induce the immunosuppression status of the TME in liver cancer, and therapeutic blocking of the CCL2/CCR2 axis could reverse this status.8 Moreover, TAMs were proved to promote expansion of liver cancer stem cells by producing interleukin 6 and signal via STAT3.9
There were many research have been reported that individualized immune signature selected from immune-related genes (IRGs) could accelerate prognostic estimations for patients, such as non-small cell lung cancer10 and papillary thyroid cancer.11 Previous study reported a small amount of prognostic biomarkers for liver cancer consisted of immune-related single gene, including CXCL10,12 NDRG113 and CXCL12.14 Moreover, Zhang et al have reported the landscape of immune cells in hepatocellular carcinoma.15
For patients with advanced LIHC, sorafenib has shown some survival benefit.16 Unfortunately, drug resistance is evident in many patients.16 Zhou et al reported that tumour-associated neutrophils could induce sorafenib resistance by recruiting macrophages and T-regulatory cells.17 Increased expression of triggering receptor expressed on myeloid cells-1 (TREM-1) in tumour-associated macrophages (TAMs) led to anti-programmed cell death ligand 1 (PD-L1) resistance in liver cancer.18 Given these data, we can realize that there is a marked correlation between TME and resistance in liver cancer, suggesting that the identification of predictive biomarkers related to TME for resistance in liver cancer will be very rewarding. However, gaps still exist in the current research regarding the prognostic significance and predictive potential related to the resistance of TME-related IRGs in a comprehensive, genome-wide profiling study of liver cancer.
Therefore, in this study, we developed a robust TME-related (FABP6, CD4, PRF1, EREG and COLEC10) prognostic signature that could independently predict both RFS and OS of LIHC. The prognostic signature was significantly associated with the immune score, immune cytolytic activity (CYT), HLA, interferon (IFN) response and tumour-infiltrating lymphocytes (TILs), and it might influence tumour immunity mainly by affecting B cells, CD8+ T cells and dendritic cells. Further analysis indicated that our TME-related signature was correlated with the immunotherapy response in LIHC. Moreover, we also found that the TME-related signature had the potential to predict sorafenib resistance in LIHC. These findings provide further insight into effective treatment strategies for LIHC and opportunities for further experimental and clinical validation. Moreover, the results from this study could offer a foundation for subsequent, in-depth immune-related work with great promise for the personalized treatment of LIHC.
Materials and Methods
Patient Data
Gene expression data and the associated clinical characteristics of the LIHC patients were downloaded from the Cancer Genome Atlas (TCGA, http://cancergenome.nih.gov/), including 370 LIHC samples with the corresponding gene expression data and clinical information. Then, 12 patients were removed from our analysis due to their zero overall survival (OS) or recurrence-free survival (RFS) time. Finally, 358 patients with complete follow-up information, including OS status and time and disease-free status and time, were included in our training dataset. Among them, 172 participants developed a recurrence, and 186 participants did not.
Principal component analysis (PCA) was performed to compare the expression differences of the genes between tumour and normal samples using the Gene Expression Profiling Interactive Analysis 2 (GEPIA 2) (http://gepia2.cancer-pku.cn/#index) database. There were 50 normal samples and 369 tumour samples included in the GEPIA 2 database, which overlapped with the LIHC samples downloaded from the TCGA.
For validation, gene expression data and associated clinical characteristics of 242 patients with LIHC were obtained from the publicly available GEO database (https://www.ncbi.nlm.nih.gov/geo/), which formed our validation set. GSE14520 from the GEO database was conducted by GPL571 (Affymetrix Human Genome U133A 2.0 Array) and GPL3921 (Affymetrix HT Human Genome U133A Array), including 242 LIHC samples with complete follow-up information (recurrence status and RFS). Among them, 136 participants had a recurrence, and 106 participants did not. We also downloaded three drug resistance datasets from the GEO database (GSE73571, GSE116118, GSE125180). The list of these datasets is displayed in Table S1.
Tumour tissues were also collected from 55 LIHC patients who underwent surgery at the First Affiliated Hospital of China Medical University between 2007 and 2017. None of the patients had received radiotherapy or chemotherapy before surgery. The use of human tissues was approved by the ethics committee of China Medical University.
Immune-Related Gene (IRG) Analysis in the Training Set of LIHC
The overall design and flow diagram of this study is presented in Figure 1. Here, we utilized estimation of STromal and Immune cells in MAlignant tumours using expression data (ESTIMATE), a method that could infer the fraction of immune cells within the TME based on the expression of immune genes.19 The list of immune genes has been reported by Yoshihara et al.19 Based on the ESTIMATE algorithm, we first calculated the immune scores of our TCGA training set. Next, 358 LIHC cases were divided into high- and low-score groups according to the cut-off value of 421.22 as the median immune score. Subsequently, we performed differential gene analysis of 60244 mRNAs using the package edgeR20 for comparisons based on immune scores. False discovery rate (FDR) < 0.05 and a log2 |fold change| > 1 were set as the cut-off values. We downloaded a list of IRGs via the Immunology Database and Analysis Portal (ImmPort) database. A protein-protein interaction (PPI) network of the differentially expressed IRGs was constructed by the Search Tool for the Retrieval of Interacting Genes (STRING) Database (https://string-db.org) and subsequently visualized by Cytoscape software. Common genes among the DEGs and IRGs were selected for further analysis. The Database for Annotation, Visualization and Integrated Discovery (DAVID) database (https://david.ncifcrf.gov/) was used to enrich for biological themes with GO terms and with the Kyoto Encyclopedia of Genes and Genomes (KEGG) pathway maps. A P value <0.05 was set as the cut-off criterion.
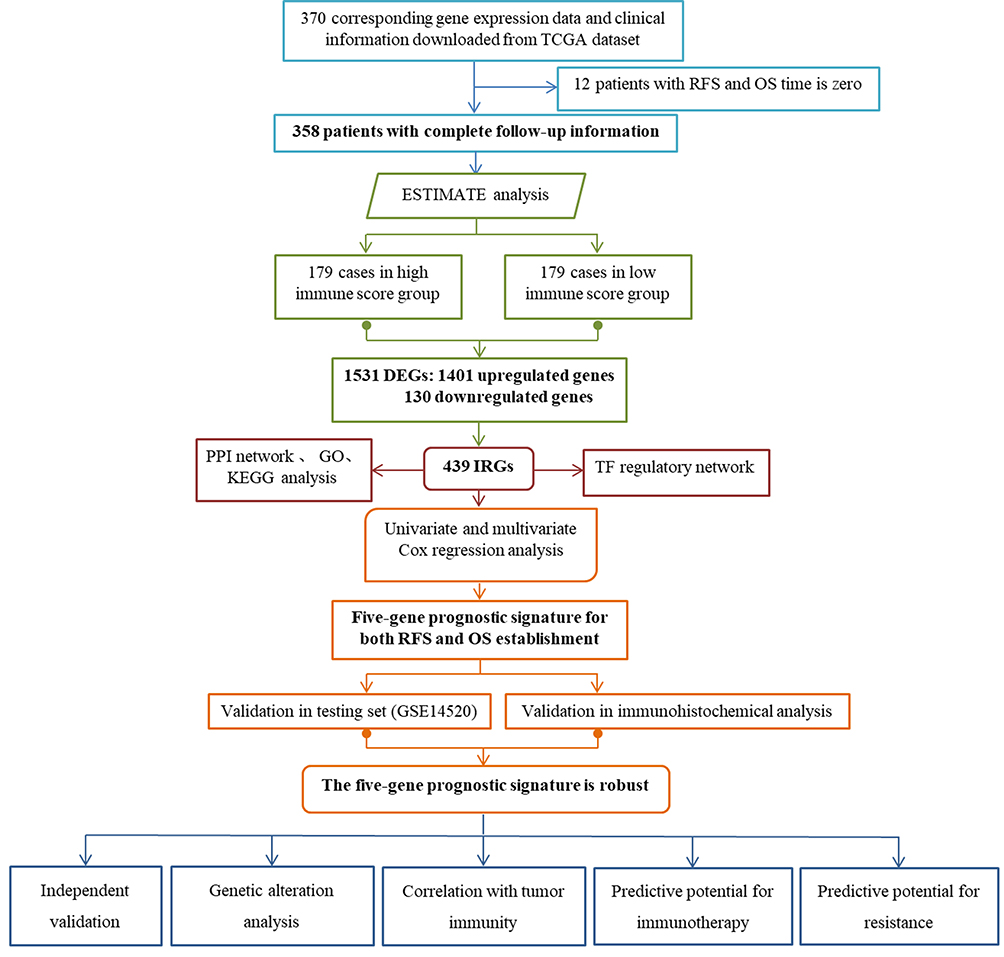 |
Figure 1 Overview of the analytic pipeline of this study. |
Regulatory Network Analysis of the IRGs and Transcription Factors (TFs)
We obtained a total of 318 TFs from the Cistrome Cancer database (http://cistrome.org/CistromeCancer/). Next, we selected clinically relevant TFs that were significantly associated with the RFS of CC using univariate Cox regression analysis by the cut-off criterion of a P value <0.001. Finally, we constructed a regulatory network of the current IRGs and clinically relevant TFs.
Construction and Confirmation of a Prognostic Signature
Differentially expressed IRGs were analysed by using Cox regression analysis to identify a prognostic signature for LIHC. The corresponding risk scores for the samples from both the training and validation sets were calculated according to the expression levels of the genes (expi) and the coefficients of the multivariate Cox regression analysis (bi). Subsequently, the patients were divided into low- and high-risk groups according to the mean risk score. The formula used was as follows:

Alteration Analysis of the Selected Genes in the Prognostic Signature
Alterations of genes commonly exist in the progression of tumours. Therefore, it is necessary to investigate the alterations of our selected genes in LIHC. The cBioPortal database (https://www.cbioportal.org/) can provide web resources for the visualization of genetic changes. The LIHC samples of the cBioPortal database we selected overlap somewhat with the LIHC samples in the TCGA database. To investigate the alterations of our selected genes, we employed the cBioPortal database for further analysis.
The Association Between Risk Score and Clinicopathological Factors
The general clinical characteristics of 358 LIHC patients in the TCGA training set are listed in Table 1. Here, we used SPSS version 19.0 software to carry out univariate and multivariate Cox regression analysis. A P value <0.005 was set as the cut-off value. The risk score and other clinicopathological factors were used as covariates.
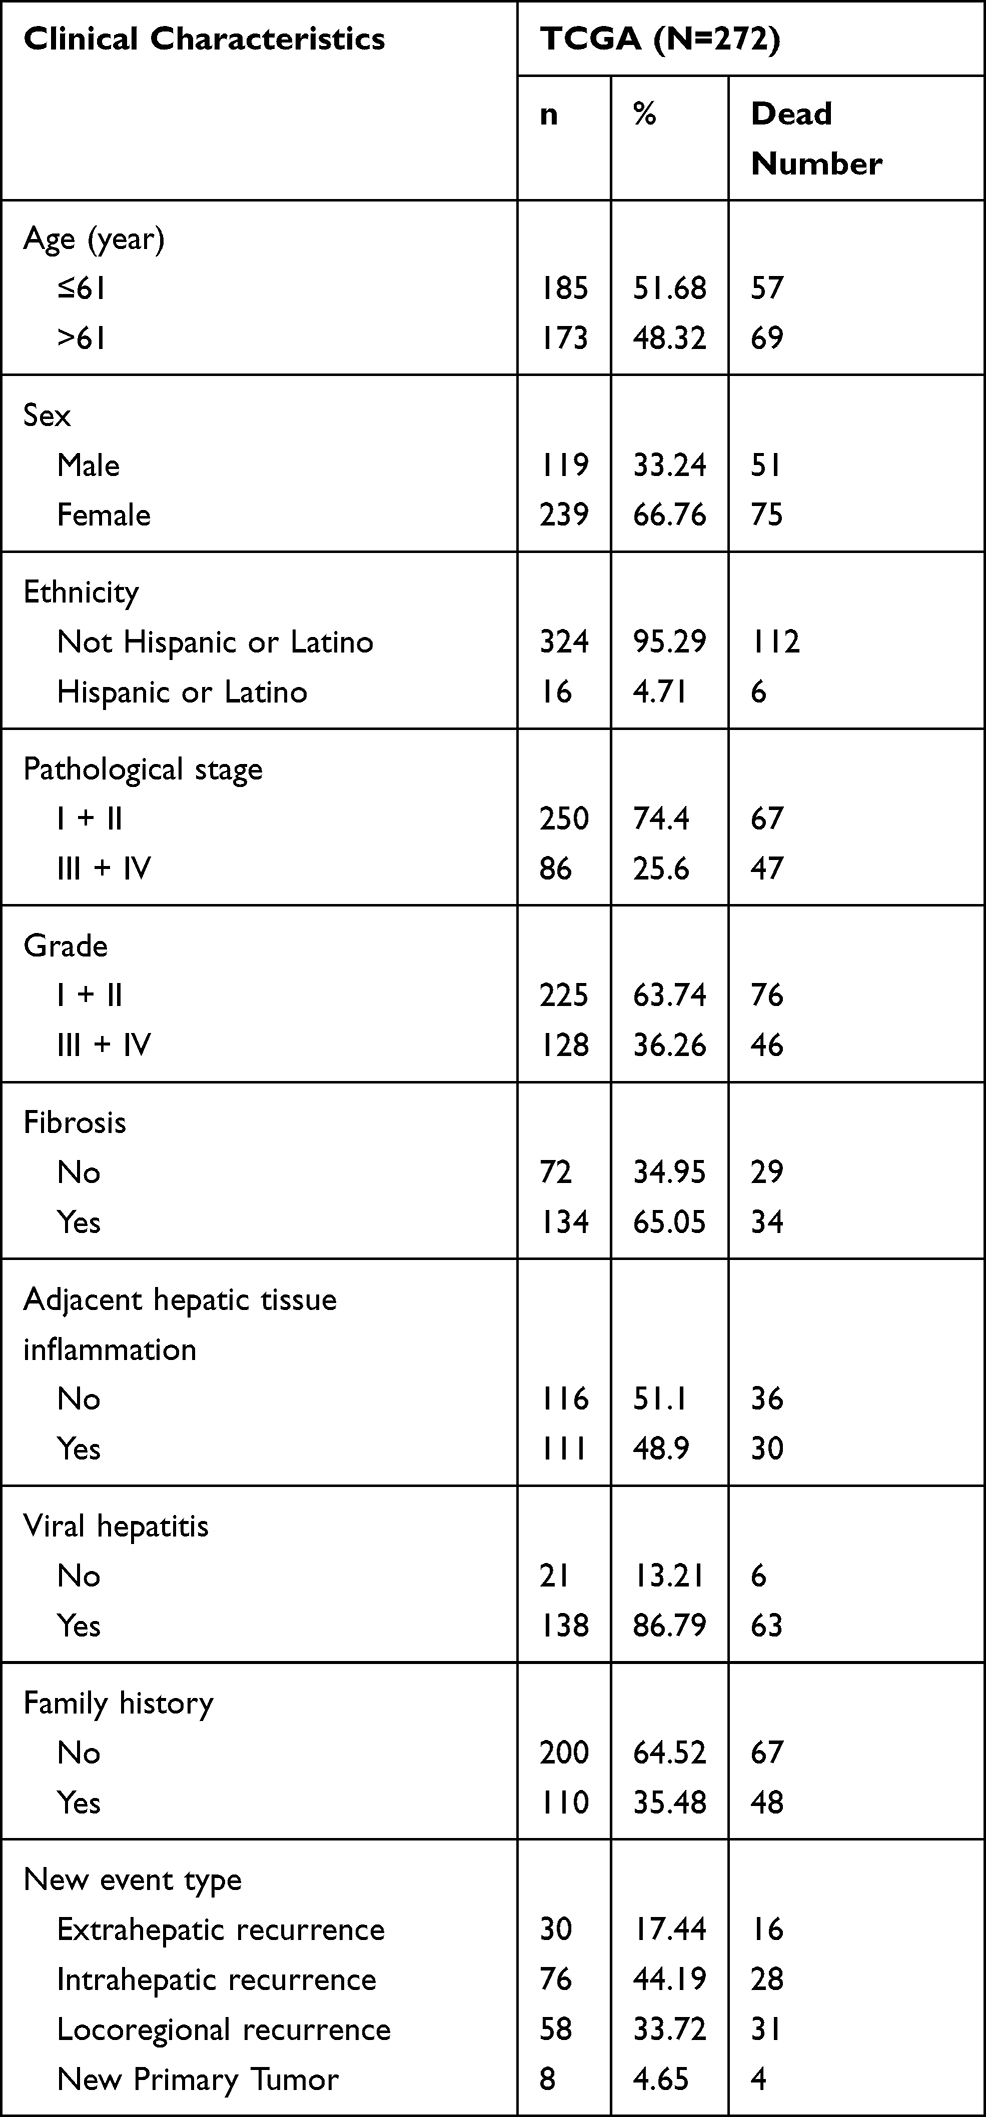 |
Table 1 Clinical Pathological Parameters of Patients with Liver Cancer in This Study |
The Relationship Analysis Between the Risk Score and Tumour Immunity
The gene sets that represented different immune signatures from several publications were involved in our analyses, including HLA,21 TILs,22 CYT, and IFN response. The full list of these genes is displayed in Table S2. Single-sample gene-set enrichment analysis (ssGSEA)23 was employed to calculate these immune signature scores using gene sets (Table S2). We analysed the correlation between the risk score and those of the immune signatures using the SPSS version 19.0 software package. A threshold of P <0.05 (Spearman correlation test) indicates the significance of the correlation.
The tumour immune estimation resource (TIMER, cistrome.shinyapps.io/timer) is a web dedicated to comprehensively evaluating the abundance of tumour-infiltrating immune cells.24 It includes 10,897 samples across 32 cancer types from TCGA to measure the abundance of six subtypes of tumour-infiltrating immune cells, including B cells, CD4+ T cells, CD8+ T cells, macrophages, neutrophils, and dendritic cells. The LIHC samples downloaded from the TIMER database overlap somewhat with the LIHC samples downloaded from the TCGA. Then, we calculated the associations between the risk score and immune cell infiltration.
The relationships between the risk score and immune cell infiltration were validated using the CIBERSORT algorithm.25 Gene expression datasets were prepared using standard annotation files and the data were uploaded to the CIBERSORT web portal (https://cibersort.stanford.edu). Total B cells were calculated as the sum of naive and memory B cells. Total CD4+ T cells were calculated as the sum of the CD4+ naive T cells, CD4+ memory resting T cells and CD4+ memory activated T cell fractions. Total NK cells, total dendritic cells, and total mast cells were calculated as the sum of the resting and activated NK cells, resting and activated dendritic cells, and resting and activated mast cells, respectively.
Immunohistochemical Analysis
We obtained 55 paired representative paraffin blocks (2007–2017) of HCC and adjacent tissue samples after reviewing the haematoxylin and eosin-stained slides. Tissue cores were extracted from each donor block using a 1.5 mm diameter puncture needle and arrayed into a new paraffin recipient block made of 60 cores. Sections were obtained from the re-prepared blocks, mounted on poly-L-lysine-coated glass slides, and used for immunohistochemical staining. After deparaffinization, the slides were pre-treated by steaming in sodium citrate buffer at 121°C for 5 min (pH 7.8 Tris-EDTA-citrate buffer). Then, endogenous peroxidase activity was blocked with 3% H2O2. Then, the sections were incubated with the appropriate antibody at the appropriate dilution, and DAB staining solution was added. The sections were counterstained with haematoxylin, dehydrated, and sealed.
Evaluation of Immunohistochemistry
Each stained slide was individually reviewed and scored by two independent pathologists blinded to the experimental conditions using a light microscope (magnification, ×200; selecting three fields/view). The intensity of immunoreactivity was scored as follows: zero for no staining, one for weak staining, two for moderate staining, and three for strong staining. The proportion of positive tumour cells was as follows: 0 (no positive cells), 1 (<25% positive cells), 2 (26–50% positive cells), 3 (51–75% positive cells), and 4 (>75% positive cells). The score was obtained by calculating the product of the intensity of the immunoreactivity and the proportion of the positive tumour cells. A score ≥6 represents high expression; otherwise, it is low expression.
Statistical Analysis
The expression profiles of the mRNAs from TCGA and GEO are shown as the raw data, then each mRNA was normalized by log2 transformation for further analysis. The receiver operating characteristic (ROC) curves were plotted based on the risk scores and the survival status or drug resistance status of each patient to compare the predictive accuracy of the gene signature. Kaplan-Meier (K-M) curves were carried out to compare the survival and recurrence or metastasis risk between high-risk and low-risk groups. P values from the Log rank tests were calculated, and a P value less than 0.05 was considered statistically significant. Statistical analysis was performed by using GraphPad Prism version 7.0 or SPSS version 19.0 software package. A two-tailed P < 0.05 was considered statistically significant.
Results
Immune Scores are Significantly Associated with RFS in Patients with LIHC
We employed the ESTIMATE algorithm to quantify the intratumoral immune content (immune score) of LIHC patients in our TCGA training set. Based on the ESTIMATE algorithm, the immune scores ranged from −901.34 to 3200.17 (Table S3). The K-M curves illustrated that patients in the low-score groups had significantly shorter RFS than those in the high-score groups (log-rank P=0.0035, Figure 2A). Subsequently, we plotted the distribution of immune scores based on the pathological stage of the LIHC cases, and the results showed that stage I and stage II had higher immune scores compared with stage III and stage IV (log-rank P=0.0254, Figure 2B).
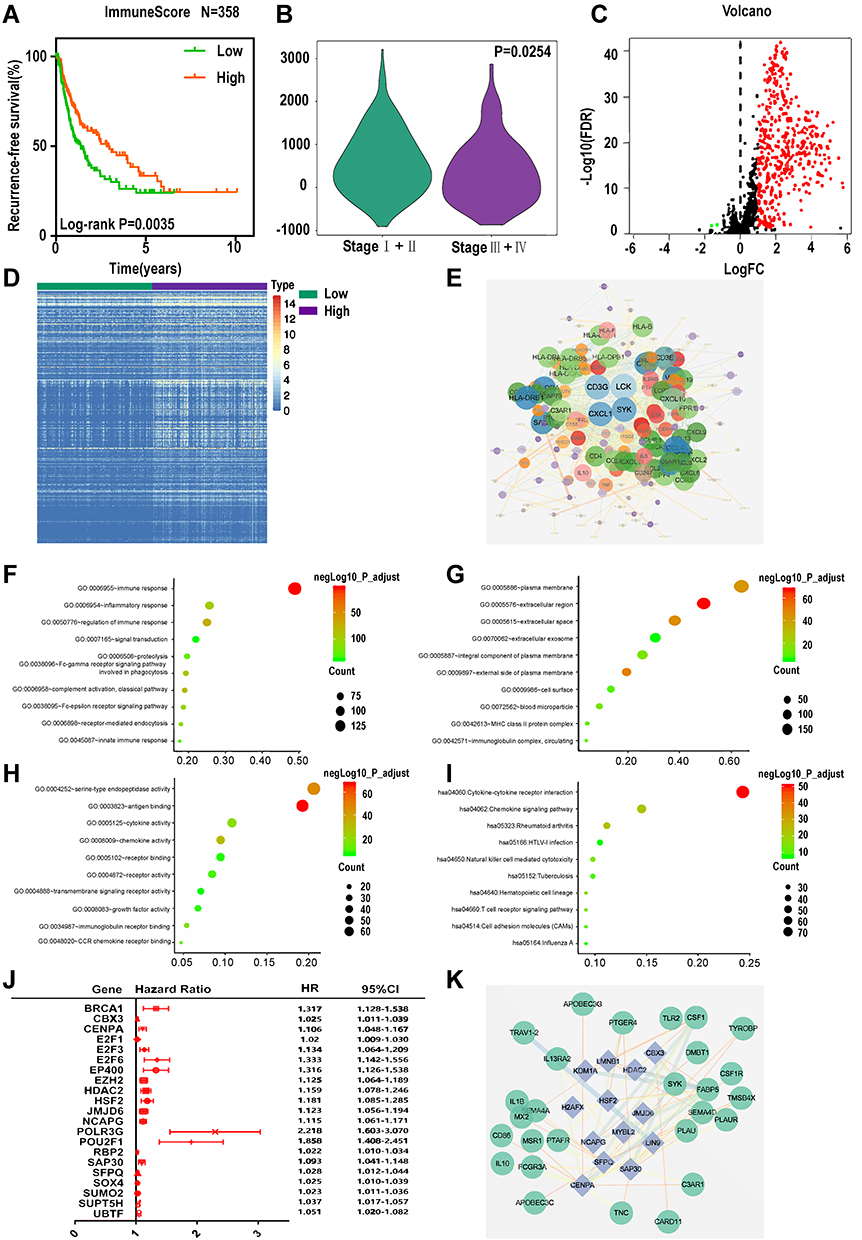 |
Figure 2 Identification of differentially expressed immune-related genes (IRGs). (A) K-M curves of RFS of low and high immune score groups. (B) Violin plot of immune scores’ distribution in pathological stage. Volcano plot (C) and heatmap (D) demonstrating differentially expressed IRGs between low and high immune score group, red and green dots represent differentially expressed genes and black dots represent no differentially expressed genes. (E) Protein-protein interaction network of differentially expressed IRGs. (F–H) Top 10 most significant GO terms and (I) KEGG pathways. (J) Forest plot of hazard ratios showing the RFS-related TFs. (K) Regulatory network constructed based on clinically relevant TFs and differentially expressed IRGs. |
Identification of Differentially Expressed IRGs
Based on the immune scores, we performed differential gene analysis in the TCGA training set. A total of 1531 DEGs were obtained, which consisted of 1401 upregulated mRNAs and 130 downregulated mRNAs. Of these 1531 genes, we extracted 439 genes that overlapped with the genes in the list of IRGs downloaded from the ImmPort database. These 439 common genes included 437 upregulated and 2 downregulated genes (Figure 2C and D, Table S4).
To better understand the interplay among these differentially expressed IRGs, we constructed a PPI network. The results indicated that CD3G, LCK, CXCL1 and SYK were the remarkable nodes and could be seen as hub genes, as they had higher degree values in this network (Figure 2E). Subsequently, functional enrichment analysis revealed that these genes were most enriched in several GO terms related to cell-cell interactions. Specifically, “immune response”, “plasma membrane” and “antigen binding” were the most frequent biological terms associated with cell-cell interactions among the biological processes (BP), cellular components (CC), and molecular functions (MF), respectively (Figure 2F–H). For the KEGG pathways, cytokine-cytokine receptor interactions were most often enriched for these differentially expressed IRGs (Figure 2I).
TF Regulatory Network
To unveil potential molecular mechanisms corresponding to our differentially expressed IRGs, we constructed a TF-mediated network to reveal the regulatory mechanisms of these genes. We analysed the expression of the 318 TFs using univariate Cox regression analysis. Thus, 21 TFs associated with the RFS of the LIHC patients were obtained (Figure 2J, Table S5). Then, we constructed a regulatory network based on these 21 TFs and our 439 differentially expressed IRGs. A correlation score greater than 0.4 and a P value greater than 0.001 were set as the cut-off values. The TF-based regulatory schematic diagram acutely revealed that HDAC2, SFPQ, NCAPG, SOX4, CBX3, JMJD6, HSF2, SAP30, and CENPA were featured prominently in this network (Figure 2K).
Construction of a Prognostic Signature That Can Predict Both the RFS and OS of LIHC
To explore candidate indicators for prognostication, we first examined the expression files of 439 differentially expressed IRGs by performing univariate Cox regression analysis. Thus, 18 genes associated with RFS were identified (Table S6). A forest plot of hazard ratios (HR) indicated that most of these genes were protective factors (Figure 3A). After that, we further applied these 18 genes to multivariate Cox regression analysis to develop a prognostic signature for LIHC. As a result, a prognostic signature consisting of five genes (FABP6, CD4, PRF1, EREG and COLEC10) was constructed to predict prognosis of LIHC patients using a risk score method. Hence, the LIHC risk score system was built as follows: risk score= (0.309 × expression value of FABP6) + (−0.154 × expression value of CD4) + (−0.1834 × expression value of PRF1) + (0.331 × expression value of EREG) + (−0.172 × expression value of COLEC10). A total of 358 LIHC patients were dichotomized into high- and low-risk groups according to the cut-off value of 1.012 as the median value of the risk score. Chi-square analysis indicated that a higher risk score was associated with tumour recurrence (P = 0.0060, Figure 3B). Intriguingly, PCA suggested that the expression of the five genes was significantly different between the LIHC tumour samples and the LIHC normal samples (Figure 3C). K-M curves revealed that patients in the high-risk groups tended to have poorer clinical outcomes (log-rank P<0.0001, Figure 3D). Furthermore, the AUC value of 5-year RFS was 0.712, suggesting moderate potential for the prognostic signature in DFS prediction of the LIHC patients (Figure 3E). The distribution of gene risk scores, disease-free status, and gene expression levels of 358 LIHC patients are shown in Figure 3F.
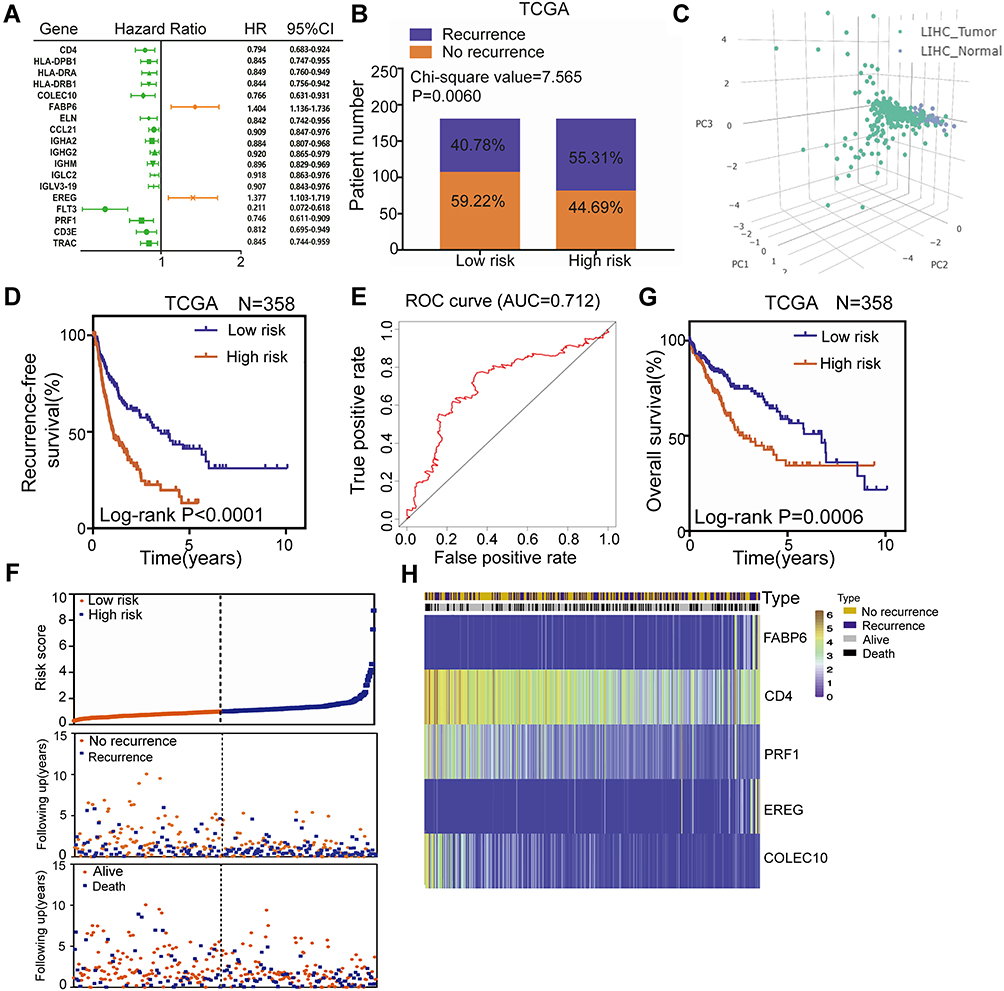 |
Figure 3 Construction of a TME-related prognostic signature for RFS and OS of LIHC in the TCGA training set. (A) Forest plot of hazard ratios showing the 18 RFS-related genes. (B) Recurrence rate in low- and high-risk score groups. (C) Principal components analysis (PCA) of the expression of the five genes between LIHC tumor and normal samples. (D) K-M curves of RFS of low- and high-risk groups. (E) The distribution of risk scores, patient recurrence-free status and gene expression levels. (F) ROC curve for the 5-year RFS prediction by the TME-related signature. (G) K-M curves of OS of low- and high-risk groups. (H) The distribution of risk scores, patient recurrence-free status and gene expression levels. |
In terms of OS, K-M curves illustrated that the high-risk groups had a significantly shorter OS than the low-risk groups (log-rank P=0.0006, Figure 3G). The distribution of gene risk scores, patient OS status and gene expression levels in the TCGA training set is shown in Figure 3H. The low-risk group was identified to have significantly better clinical outcomes than the high-risk group. Moreover, we also compared the predictive power for prognosis of some recognized factors, such as GLUT, LDHA, HIF, EPAS1, with our signature. The results suggest that our signature is a stronger predictor than recognized factors (GLUT, LDHA, HIF and EPAS1) for prognosis of LIHC (Figure S1).
The TME-Related Prognostic Signature is Robust in Patients with LIHC
To validate the predictive power of the gene signature, we applied the signature to our validation set (GSE14520). Then, 242 patients were divided into low- and high-risk groups according to the cut-off value of 2.380 as the median value of the risk score. As shown in Figure 4A, the K-M curves displayed great utility in predicting RFS with a P value of 0.0472. The distribution of gene risk scores, disease-free status, and gene expression levels of the 242 LIHC patients are shown in Figure 4B. In terms of OS, the K-M curves indicated that the high-risk groups had a significantly shorter OS than the low-risk groups (log-rank P=0.0064, Figure 4C). Moreover, the distribution of gene risk scores, patients’ overall status, and gene expression levels are shown in Figure 4D.
 |
Figure 4 Validation of the TME-related prognostic signature in the validation set (GSE14520). (A) K-M curves of RFS of low- and high-risk groups. (B) The distribution of risk scores, patient recurrence-free status and gene expression levels. (C) K-M curves of OS of low- and high-risk groups. (D) The distribution of risk scores, patient recurrence-free status and gene expression levels. |
We also detected the expression levels of these five proteins in paraffin-embedded liver cancer samples by immunohistochemistry. Representative immunohistochemistry images are shown in Figure 5A–E. Fifty-five patients were divided into low- and high-risk groups according to the cut-off value of 0.207 as the median value of the risk score. As shown in Figure 5F, the K-M curves displayed great utility in predicting RFS with a P value of 0.0033. In terms of OS, the K-M curves indicated that the high-risk groups had a significantly shorter OS than the low-risk groups (log-rank P=0.0283, Figure 5G).
 |
Figure 5 Validation of the TME-related prognostic signature in the 55 liver cancer samples by immunohistochemistry and the alteration analysis of the five genes in cBioPortal database. Representative immunohistochemistry staining for FABP6 (A),CD4 (B),PRF1 (C),EREG (D) and COLEC10 (E). (F) K-M curves of RFS of low- and high- risk groups. (G) K-M curves of OS of low- and high- risk groups. (H) Mutation landscape of the five genes in cBioPortal database. |
Overall, these results suggested that this TME-related signature for predicting both RFS and OS of LIHC patients was robust.
The Alterations of the Five Genes in Patients with LIHC in the cBioPortal Database
To comprehensively understand the molecular characteristics of the five genes, we examined the genetic alterations of these genes using the cBioPortal database. The results showed that all queried genes were altered in 13.43% of 350 cases, which involved 3 (0.86%) cases of mutations, 1 (0.29%) case of a gene fusion, 40 (11.43%) cases of amplification and 3 (0.86%) cases of a deep deletion. Thus, we found that amplification (11.43%) was the most commonly occurring type of mutation among these alterations (Table 2). The alteration heatmap of the five genes is displayed in Figure 5H. There were 0.3% changes in FABP6, 1.1% changes in CD4, 1.4% changes in PRF1, 0.3% changes in EREG and 11% changes in COLEC10. Specifically, the FABP6 gene included 1 case of amplification. The CD4 gene had 2 cases of amplification, 1 case of a deep deletion and 1 case of a gene fusion. The PRF1 gene had 2 cases of amplification, 2 cases of missense mutations and 1 case of a truncating mutation. The EREG gene had 1 case of a deep deletion. The COLEC10 gene had 37 cases of amplification and 1 case of a deep deletion.
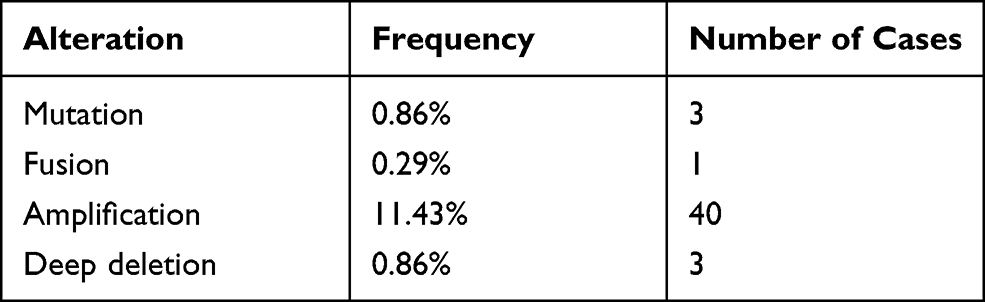 |
Table 2 Alterations of Five Query Genes in Detailed Mutation Type |
The Five-Gene Signature is an Independent Prognostic Factor in Patients with LIHC
Next, univariate and multivariate Cox regression analyses were carried out. In terms of RFS, the results indicated that the risk score (HR = 2.051, 95% CI = 1.475–2.850; P < 0.001) and pathological stage (HR = 2.120, 95% CI = 1.516–2.963; P <0.001) were significantly associated with the RFS of the LIHC patients and could be independent RFS prognostic factors for the LIHC patients in the TCGA training set (Figure 6A and B). For OS, both the risk score (HR = 1.658, 95% CI = 1.131–2.431; P = 0.01) and the pathological stage (HR = 2.330, 95% CI = 1.597–3.399; P < 0.001) were independent adverse OS indicators for LIHC patients (Figure 6C and D).
 |
Figure 6 The TME-related signature is an independent prognostic factor in LIHC patients. Univariate (A) and multivariate (B) Cox regression of prognosis factor for RFS. Univariate (C) and multivariate (D) Cox regression of prognosis factor for OS. (E) Kaplan–Meier analysis of RFS for LIHC patients stratified by stage, recurrence type and viral hepatitis. (F) Kaplan–Meier analysis of OS for LIHC patients stratified by stage, grade, gender, age, recurrence type, viral hepatitis, fibrosis, adjacent hepatic tissue inflammation and family cancer history. |
To further investigate the clinical potential of the risk score model, stratified analysis based on these clinical characteristics was implemented. The results indicated that the risk score retained the ability to predict RFS within each subgroup of gender, age and grade, family cancer history, fibrosis and adjacent hepatic tissue inflammation (Figure S2). However, as shown in Figure 6E, the TME-related prognostic signature seemed more applicable to predict the RFS of LIHC patients in subgroups of stage I and stage II, with locoregional recurrence and with viral hepatitis. For OS, patients in the subgroup of stage III and stage IV, grade I and grade II, male, younger than 61 years old, with locoregional recurrence, with viral hepatitis, without fibrosis, without adjacent hepatic tissue inflammation and with a family cancer history could benefit more from a prognosis developed by using this risk score system (Figures 6F and S3).
The TME-Related Signature May Influence Tumour Immunity Mainly by Affecting B Cells, CD8+ T Cells and Dendritic Cells
Given that the TME-related signature consisted of IRGs, we hypothesized that the TME-related signature could be correlated with tumour immunity. To test this hypothesis, we involved diverse immune signatures, including the immune score, immune CYT, HLA expression, IFN response and TIL infiltration. Strikingly, we found that the risk score was highly correlated with these immune signatures in LIHC (Figure 7A, Table S7). In particular, TIL infiltration had the highest degree of correlation with the risk score among these immune signatures (Figure 7A, Table S7). We also employed principal component analysis (PCA) to analyze the relationship between these factors and the weights they occupy. PCA identified that among CYT, HLA, IFN and TILs, IFN was the two most variable clusters, suggesting that IFN occupied dominated weights among these four factors (Figure 7B). In addition to the risk score, we found that the expression levels of two (CD4 and PRF1) of these five genes were also significantly associated with the immune signatures in LIHC (Figure 7C, Table S7).
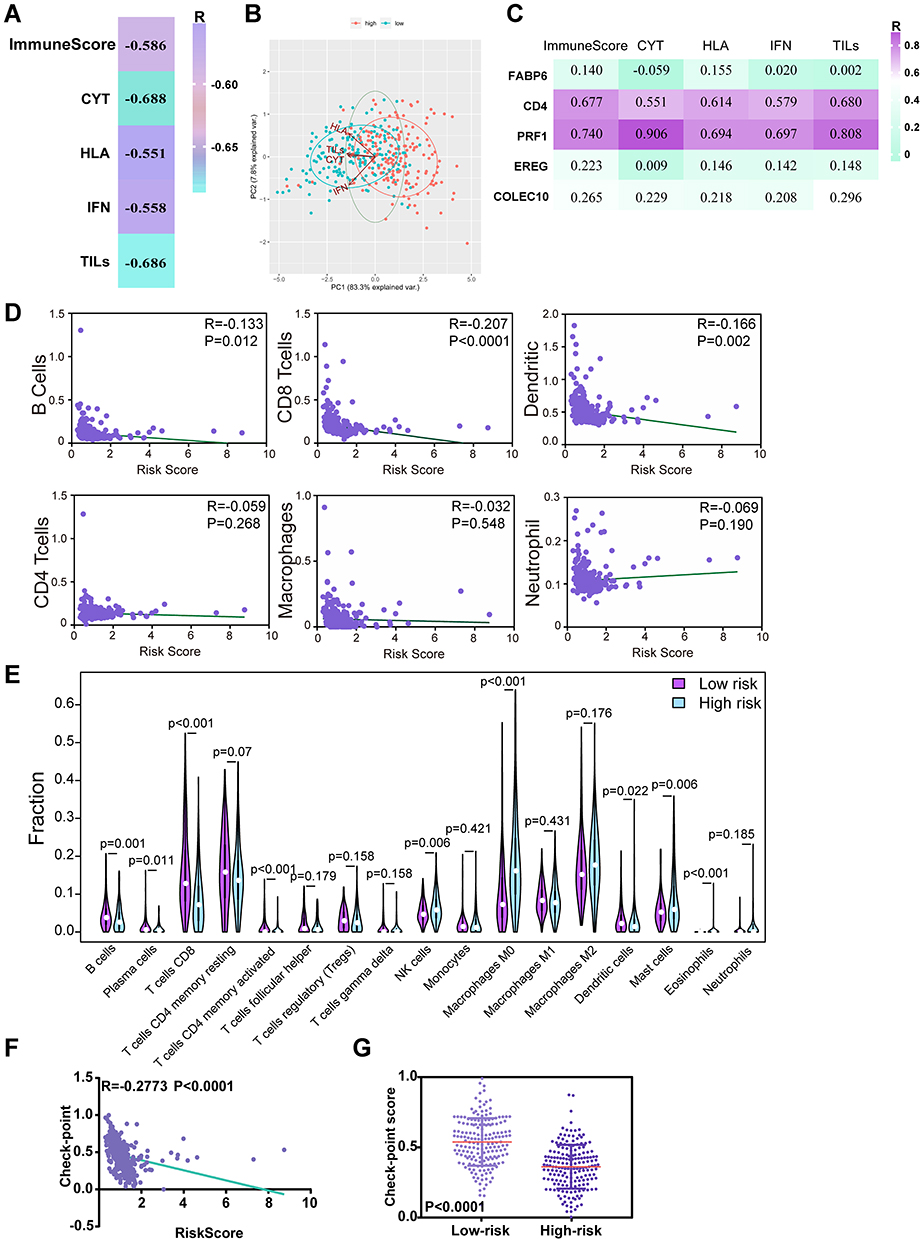 |
Figure 7 The TME-related signature is significantly correlated with tumour immunity in LIHC. (A) The correlation of the TME-related signature with immune score and four immune signatures including immune cytolytic activity (CYT), HLA, interferon (IFN) and tumor-infiltrating lymphocytes (TILs) in LIHC. R: Spearman correlation coefficient. (B) PCAs of CYT, HLA, IFN and TILs in low- and high- risk groups in LIHC patients. (C) The association of the expression levels of the five genes with immune score and diverse immune signatures including CYT, HLA, IFN and TILs in LIHC from the TCGA. R: Spearman correlation coefficient. (D) The correlation of the TME-related signature with immune cell infiltrations using TIMER database. (E) Validation of the relationships using CIBERSORT algorithm (left was the group of low risk and right was the group of high risk). (F) The correlation of the TME-related signature with the expression levels of checkpoint genes in LIHC. R: Spearman correlation coefficient. (G) The expression levels of checkpoint genes among patients in low and high groups stratified by risk scores in LIHC from TCGA. |
Given the highest degree of correlation between the risk score and TILs among these four immune signatures, we utilized the TIMER database to further illuminate the relationships between the risk score and immune cell infiltrations. Interestingly, as shown in Figure 7D, B cell, CD8+ T cell and dendritic cell infiltration levels were significantly negatively correlated with the risk score. These results demonstrated that lower infiltration levels of B cells, CD8+ T cells and dendritic cells might be observed in high-risk LIHC patients. Subsequently, we utilized the CIBERSORT algorithm to validate the relationships between the risk score and immune cell infiltrations. The results showed that B cell, CD8+ T cell and dendritic cell infiltration levels were negatively correlated with the risk score, which was in agreement with our previous findings from the TIMER database (Figure 7E). These results suggest that the TME-related signature may influence tumour immunity mainly by affecting B cells, CD8+ T cells and dendritic cells.
The TME-Related Signature is Correlated with the Immunotherapy Response
Given the correlation between the TME-related signature and the immune signature, we investigated whether the signature also correlated with the immunotherapy response. We first calculated the checkpoint score using the expression levels of the immune checkpoint genes (the list of genes shown in Table S2) for each patient by the ssGSEA algorithm and measured the association between the risk score and the checkpoint score. Strikingly, we observed that the risk score was significantly negatively correlated with the immune checkpoint genes in LIHC (Figure 7F). Patients in the high-risk groups had significantly lower checkpoint scores than those in the low-risk groups (Figure 7G). These results suggested that our TME-related signature might be associated with the immunotherapy response.
The TME-Related Signature Has the Potential to Predict Sorafenib Resistance in LIHC
Considering most advanced LIHC patients eventually succumb to drug resistance,26 we investigated whether our signature have potential for predicting drug resistance in LIHC to prolong survival. Thus, we estimated the relationship between the signature and drug resistance using GSEA analysis. As shown in Figure 8A, GSEA predicted that the TME-related signature was significantly associated with resistance to different therapies in LIHC (P<0.05, Figure 8A). Next, to validate the potential of our TME-related signature for predicting drug resistance, we further involved three drug resistance-related datasets from GEO database. The results showed that the sorafenib resistance rate was higher in the high-risk groups than those in the low-risk groups (Figure 8B). However, for gemcitabine and doxorubicin, patients in the high-risk groups had a lower drug resistance rate than those in the low-risk groups (Figure 8B). Subsequently, we also observed that patients with gemcitabine resistance had significantly lower risk scores than patients in the control groups (P=0.0086, Figure 8C), but there was no significant difference in the scores between patients with sorafenib or doxorubicin resistance and patients in the control groups (Figure 8C). Furthermore, the TME-related signature achieved AUCs of 0.667, 0 and 0.333 in predicting resistance to sorafenib, gemcitabine and doxorubicin, respectively, suggesting the moderate potential of the TME-related signature as a means of monitoring for sorafenib resistance in LIHC (Figure 8D). Above all, these data indicate that the TME-related signature is associated with sorafenib resistance and can be a potential biomarker for sorafenib resistance in LIHC.
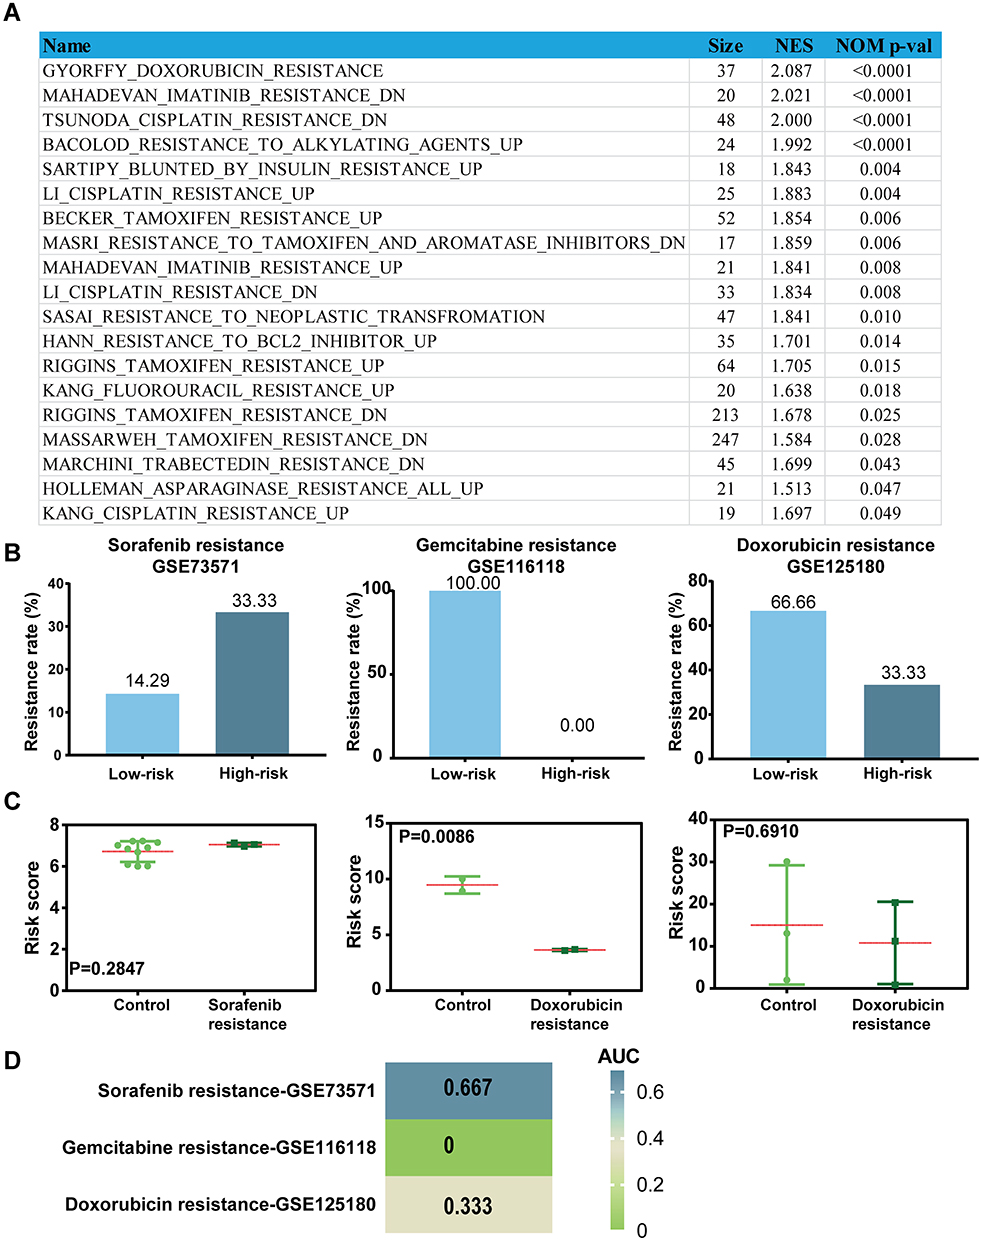 |
Figure 8 The TME-related signature can be served as a potential predictor for sorafenib resistance in LIHC. (A) The relationship between the TME-related signature and therapeutic resistance in LIHC using GSEA analysis. (B) The resistance rate of sorafenib, gemcitabine and doxorubicin in low and high groups stratified by risk scores in each dataset. (C) The distribution of the risk scores among patients grouped by resistance status in each dataset. (D) The heat map of AUC values of the risk score in predicting drug resistance using ROC curves. |
Discussion
Although many curative treatments are being applied in the clinic, many patients with LIHC suffer from resistance.2,16 A large body of evidence has indicated that the TME is closely associated with resistance.17,27 Therefore, the identification of predictive biomarkers related to TME for resistance in LIHC will be very rewarding. However, TME-related biomarkers that have the potential to predict resistance in LIHC have not yet been identified. Therefore, in this paper, we developed a prognostic signature consisting of TME-related IRGs for predicting survival and resistance in LIHC.
Here, we first utilized the ESTIMATE algorithm to analyse the potential correlation of RFS with the immune scores. These results suggested that the immune scores were significantly correlated with RFS in LIHC patients. Next, 439 IRGs were extracted from DEGs based on the immune scores of LIHC patients in the TCGA training set. The PPI network indicated that CD3G, LCK, CXCL1 and SYK were remarkable nodes and could be considered hub genes. Gene functional enrichment analysis suggested that these genes mainly played an important role in cell-cell interactions in the immune response to cancer. For the KEGG pathways, cytokine-cytokine receptor interactions were most often enriched by the differentially expressed IRGs. To explore the underlying molecular mechanisms corresponding to the potential clinical value of these IRGs, we drew a TF-mediated network using 21 TFs associated with RFS of LIHC to explore crucial TFs that could regulate the 439 IRGs. HDAC2, SFPQ, NCAPG, SOX4, CBX3, JMJD6, HSF2, SAP30, and CENPA were featured prominently in this network.
Subsequently, five TME-related IRGs (FABP6, CD4, PRF1, EREG and COLEC10) were identified that exhibited significant prognostic value for RFS (log-rank P<0.0001) and OS (log-rank P=0.0006) in the LIHC patients, which were validated in the GSE14520 validation set. Among these five genes, the roles of FABP6 and COLEC10 have not been well characterized in tumour biology. The CD4 molecule is a glycoprotein composed of several immunoglobulin-like domains expressed on the surface of lymphocyte subtypes, monocytes, macrophages, and some dendritic cells. CD4+ T cells can improve CTL responses in cancer immunotherapy to obtain more clinical benefit.28 Loss of intrahepatic CD4+ T lymphocytes can lead to accelerated hepatocarcinogenesis.29 Thus, we found that CD4 may be associated with a favourable prognosis of cancer patients, which is consistent with our present findings that CD4 is a positive indicator of LIHC. Perforin encoded by PRF1, as a key component of cytolytic killing, can clear tumours by inducing cell death.30 Furthermore, some new cancer therapies that promote antitumour cytotoxicity utilize the perforin-granzyme effector pathway.31 These findings are consistent with our findings that PRF1 is a positive indicator for LIHC. EREG was proven to promote tumour growth in colitis-associated neoplasms and lung metastasis of salivary adenoid cystic carcinoma.32 Moreover, Jacobs et al found that the expression of amphiregulin and EREG in primary tumours could predict the outcomes of cases of metastatic colorectal cancer treated with cetuximab.33 These studies might provide further evidence for our findings that the TME-related signature could predict the survival of patients with LIHC. Subsequently, genetic alteration analysis revealed that COLEC10 had the most changes (11%) among these five genes in LIHC. This finding has not been explored in a previous study. Our preliminary observations could provide a perspective to explore the potential molecular mechanisms, and further research is needed in the future.
Further correlation analysis revealed that the TME-related signature was significantly correlated with tumour immunity and might influence tumour immunity mainly by affecting B cells, CD8+ T cells and dendritic cells. B cells are well known for their contribution to the protective immune response by producing immunoglobulin and antitumour antibodies.34 Furthermore, the interaction between tumour-infiltrating B cells and T cells has been proven to be associated with a better prognosis of patients with liver cancer.35 The cytotoxicity of CD8+ T cells in the antitumour immunity of liver cancer has been demonstrated in many studies,36 and some cancer immunotherapies clear tumours, usually by activating CD8+ T cells.30 Dendritic cells can elicit tumour regression, and immunotherapy based on this antitumour potential has been proven effective in liver cancer.37,38 These studies are consistent with our current results that high infiltration of B cells, CD8+ T cells and dendritic cells was associated with a better prognosis in liver cancer patients.
Given the relationship between the TME-related signature and tumour immunity, we investigated whether the signature also correlated with the immunotherapy response. The results showed that the risk score was significantly negatively correlated with immune checkpoint genes in LIHC, and patients in the high-risk groups had significantly lower checkpoint scores than those in the low-risk groups, suggesting that our TME-related signature might be associated with the immunotherapy response.
The high resistance rate in LIHC patients highlights the urgent need for the identification of predictive biomarkers to predict resistance to treatment of LIHC. Therefore, in our study, we further analysed the predictive potential of our TME-related signature for sorafenib, gemcitabine, and doxorubicin resistance in LIHC using three GEO datasets. The results showed that the sorafenib resistance rate was higher in the high-risk group than in the low-risk group. However, for gemcitabine and doxorubicin, patients in the high-risk groups had a lower drug resistance rate than those in the low-risk groups. Moreover, patients with gemcitabine resistance had significantly lower risk scores than patients in the control groups, but there was no significant difference in the scores between the patients with sorafenib or doxorubicin resistance and patients in the control groups. Furthermore, the ROC curves indicated that the TME-related signature had moderate potential as an indicator of sorafenib resistance monitoring in LIHC, but the TME-related signature had no predictive power for gemcitabine and doxorubicin resistance in LIHC. A previous study indicated that TME disorder could induce sorafenib resistance by recruiting macrophages and T-regulatory cells in the TME.17 In this work, we found that patients in high-risk groups had higher infiltration levels of macrophages compared to those in low-risk groups. Moreover, CIBERSORT analysis showed that macrophages account for the largest proportion in TME of LIHC patients. Given this, we speculated that macrophages might be the potential mechanism of factors participate the sorafenib resistance in LIHC. However, this assumption requires further verification in vitro and vivo experiments in the future. Altogether, these results suggested that the TME-related signature could be a potential biomarker for sorafenib resistance. Of course, the association between the TME-related signature and sorafenib resistance revealed in this study needs to be validated in the clinic.
Despite the significant results obtained in the current study, there were inevitably several shortcomings of our study that should be acknowledged. First, gene expression data and associated clinical characteristics of LIHC patients were downloaded from publicly available datasets. However, the information of publicly available datasets is limited, so that the clinicopathological parameters analysed in this study are not comprehensive, which might induce bias results. Second, we did not consider the heterogeneity of the immune microenvironment related to the location of immune infiltrations. Third, there were no experimental data regarding the identified signature. Therefore, further research is needed to elucidate the inherent correlation between the five-mRNA signature and the prognosis of LIHC patients.
Conclusion
In conclusion, we developed and validated a TME-related signature consisting of five IRGs that could independently predict both the RFS and OS of patients with LIHC. Further analysis revealed that the TME-related signature was significantly associated with the immune score, CYT, HLA, IFN and TILs, and it might influence tumour immunity, mainly by affecting B cells, CD8+ T cells and dendritic cells. Furthermore, we also found that the TME-related signature was correlated with the immunotherapy response and has the potential to predict sorafenib resistance in LIHC. To the best of our knowledge, this is the first study to identify a prognostic biomarker based on TME-related IRGs, highlighting the impact of the TME-related signature on sorafenib resistance, potentially enabling more precise and personalized sorafenib treatment in the future.
Contribution to the Field Statement
Although many curative treatments are being applied in the clinic, a significant number of patients with liver hepatocellular carcinoma (LIHC) suffer from drug resistance. The tumour microenvironment (TME) has been found to be closely associated with resistance, suggesting that identification of predictive biomarkers related to the TME for resistance in LIHC will be very rewarding. However, there has been no study dedicated to identifying a TME-related biomarker that has the potential to predict resistance in LIHC. Our findings demonstrated a TME-related signature which can independently predict both the RFS and OS of LIHC patients, highlighting the predictive potential of the signature for immunotherapy response and sorafenib resistance, potentially enabling more precise and personalized sorafenib treatment in LIHC in the future.
Data Sharing Statement
The original TCGA data that support the findings of our study are available in the NCI GDC Data portal repository at the following URL: https://portal.gdc.cancer.gov/repository. Gene Expression Omnibus (GEO, https://www.ncbi.nlm.nih.gov/geo/) data were from NCBI GEO (accession numbers: GSE14520, GSE73571, GSE116118 and GSE125180).
The study was approved by the Medical Ethics Committee of China Medical University. Patients consented to have tissue collected at the time of admission for surgery using protocols approved by the Regional Human Ethics Committee of China Medical University. The patients did not receive radiotherapy or chemotherapy before surgery, and the histological determination operated according to WHO (World Health Organization) standards. All procedures performed in studies involving human participants were following the principles of the 1964 Declaration of Helsinki and its later amendments or comparable ethical standards.
Acknowledgments
This work was supported by grants from National Natural Science Foundation of China (No. 82073281, 82073884, U20A20413, 81903658), Science and Technology Program of Liaoning Province (2017225036), Shenyang S&T Projects (No. 19-109-4-09, 20-204-4-22), Program for Shenyang High Level Talent Innovation and Entrepreneurship Team (2019-SYRCCY-B-01), Liaoning Revitalization Talents Program (No. XLYC1807201) and Major Special S&T Projects in Liaoning Province [2019JH1/10300005].
Author Contributions
All authors made a significant contribution to the work reported, whether that is in the conception, study design, execution, acquisition of data, analysis and interpretation, or in all these areas; took part in drafting, revising or critically reviewing the article; gave final approval of the version to be published; have agreed on the journal to which the article has been submitted; and agree to be accountable for all aspects of the work.
Disclosure
The authors declare that they have no conflict of interest.
References
1. Siegel RL, Miller KD, Jemal A. Cancer statistics, 2019. CA Cancer J Clin. 2019;69(1):7–34.
2. Anwanwan D, Singh SK, Singh S, Saikam V, Singh R. Challenges in liver cancer and possible treatment approaches. Biochim Biophys Acta Rev Cancer. 2020;1873(1):188314. doi:10.1016/j.bbcan.2019.188314
3. Yang JD, Nakamura I, Roberts LR. The tumor microenvironment in hepatocellular carcinoma: current status and therapeutic targets. Semin Cancer Biol. 2011;21(1):35–43. doi:10.1016/j.semcancer.2010.10.007
4. Ringelhan M, Pfister D, O’Connor T, Pikarsky E, Heikenwalder M. The immunology of hepatocellular carcinoma. Nat Immunol. 2018;19(3):222–232.
5. Graham K, Unger E. Overcoming tumor hypoxia as a barrier to radiotherapy, chemotherapy and immunotherapy in cancer treatment. Int J Nanomedicine. 2018;13:6049–6058. doi:10.2147/IJN.S140462
6. Gajewski TF, Schreiber H, Fu YX. Innate and adaptive immune cells in the tumor microenvironment. Nat Immunol. 2013;14(10):1014–1022. doi:10.1038/ni.2703
7. Palazon A, Goldrath AW, Nizet V, Johnson RS. HIF transcription factors, inflammation, and immunity. Immunity. 2014;41(4):518–528. doi:10.1016/j.immuni.2014.09.008
8. Li X, Yao W, Yuan Y, et al. Targeting of tumour-infiltrating macrophages via CCL2/CCR2 signalling as a therapeutic strategy against hepatocellular carcinoma. Gut. 2017;66(1):157–167. doi:10.1136/gutjnl-2015-310514
9. Wan S, Zhao E, Kryczek I, et al. Tumor-associated macrophages produce interleukin 6 and signal via STAT3 to promote expansion of human hepatocellular carcinoma stem cells. Gastroenterology. 2014;147(6):1393–1404. doi:10.1053/j.gastro.2014.08.039
10. Li B, Cui Y, Diehn M, Li R. Development and validation of an individualized immune prognostic signature in early-stage nonsquamous non-small cell lung cancer. JAMA Oncol. 2017;3(11):1529–1537. doi:10.1001/jamaoncol.2017.1609
11. Lin P, Guo YN, Shi L, et al. Development of a prognostic index based on an immunogenomic landscape analysis of papillary thyroid cancer. Aging. 2019;11(2):480–500. doi:10.18632/aging.101754
12. Li L, Zhu YH, Li Y, Guan XY. Identification of chemokine CXCL10 in tumor microenvironment by antibody array as a prognostic marker in hepatocellular carcinoma. Neoplasma. 2017;64(5):778–786. doi:10.4149/neo_2017_517
13. Cheng J, Xie HY, Xu X, et al. NDRG1 as a biomarker for metastasis, recurrence and of poor prognosis in hepatocellular carcinoma. Cancer Lett. 2011;310(1):35–45. doi:10.1016/j.canlet.2011.06.001
14. Semaan A, Dietrich D, Bergheim D, et al. CXCL12 expression and PD-L1 expression serve as prognostic biomarkers in HCC and are induced by hypoxia. Virchows Arch. 2017;470(2):185–196. doi:10.1007/s00428-016-2051-5
15. Zhang Q, He Y, Luo N, et al. Landscape and dynamics of single immune cells in hepatocellular carcinoma. Cell. 2019;179(4):829–845.e820. doi:10.1016/j.cell.2019.10.003
16. El-Serag HB, Marrero JA, Rudolph L, Reddy KR. Diagnosis and treatment of hepatocellular carcinoma. Gastroenterology. 2008;134(6):1752–1763. doi:10.1053/j.gastro.2008.02.090
17. Zhou SL, Zhou ZJ, Hu ZQ, et al. Tumor-associated neutrophils recruit macrophages and T-regulatory cells to promote progression of hepatocellular carcinoma and resistance to sorafenib. Gastroenterology. 2016;150(7):1646–1658.e1617. doi:10.1053/j.gastro.2016.02.040
18. Wu Q, Zhou W, Yin S, et al. Blocking triggering receptor expressed on myeloid cells-1-positive tumor-associated macrophages induced by hypoxia reverses immunosuppression and anti-programmed cell death ligand 1 resistance in liver cancer. Hepatology. 2019;70(1):198–214. doi:10.1002/hep.30593
19. Yoshihara K, Shahmoradgoli M, Martínez E, et al. Inferring tumour purity and stromal and immune cell admixture from expression data. Nat Commun. 2013;4:2612. doi:10.1038/ncomms3612
20. Robinson MD, McCarthy DJ, Smyth GK. edgeR: a Bioconductor package for differential expression analysis of digital gene expression data. Bioinformatics. 2010;26(1):139–140. doi:10.1093/bioinformatics/btp616
21. Liu Z, Li M, Jiang Z, Wang X. A comprehensive immunologic portrait of triple-negative breast cancer. Transl Oncol. 2018;11(2):311–329. doi:10.1016/j.tranon.2018.01.011
22. Massink MPG, Kooi IE, Martens JWM, Waisfisz Q, Meijers-Heijboer H. Genomic profiling of CHEK2*1100delC-mutated breast carcinomas. BMC Cancer. 2015;15:877. doi:10.1186/s12885-015-1880-y
23. Hänzelmann S, Castelo R, Guinney J. GSVA: gene set variation analysis for microarray and RNA-seq data. BMC Bioinform. 2013;14:7. doi:10.1186/1471-2105-14-7
24. Li T, Fan J, Wang B, et al. TIMER: a web server for comprehensive analysis of tumor-infiltrating immune cells. Cancer Res. 2017;77(21):e108–e110. doi:10.1158/0008-5472.CAN-17-0307
25. Newman AM, Liu CL, Green MR, et al. Robust enumeration of cell subsets from tissue expression profiles. Nat Methods. 2015;12(5):453–457. doi:10.1038/nmeth.3337
26. Llovet JM, Montal R, Sia D, Finn RS. Molecular therapies and precision medicine for hepatocellular carcinoma. Nat Rev Clin Oncol. 2018;15(10):599–616. doi:10.1038/s41571-018-0073-4
27. Méndez-Blanco C, Fondevila F, García-Palomo A, González-Gallego J, Mauriz JL. Sorafenib resistance in hepatocarcinoma: role of hypoxia-inducible factors. Exp Mol Med. 2018;50(10):1–9. doi:10.1038/s12276-018-0159-1
28. Borst J, Ahrends T, Bąbała N, Melief CJM, Kastenmüller W. CD4 T cell help in cancer immunology and immunotherapy. Nat Rev Immunol. 2018;18(10):635–647. doi:10.1038/s41577-018-0044-0
29. Ma C, Kesarwala AH, Eggert T, et al. NAFLD causes selective CD4(+) T lymphocyte loss and promotes hepatocarcinogenesis. Nature. 2016;531(7593):253–257. doi:10.1038/nature16969
30. Wang W, Green M, Choi JE, et al. CD8 T cells regulate tumour ferroptosis during cancer immunotherapy. Nature. 2019;569(7755):270–274. doi:10.1038/s41586-019-1170-y
31. Voskoboinik I, Whisstock JC, Trapani JA. Perforin and granzymes: function, dysfunction and human pathology. Nat Rev Immunol. 2015;15(6):388–400. doi:10.1038/nri3839
32. Yang WW, Yang LQ, Zhao F, et al. Epiregulin promotes lung metastasis of salivary adenoid cystic carcinoma. Theranostics. 2017;7(15):3700–3714. doi:10.7150/thno.19712
33. Jacobs B, De Roock W, Piessevaux H, et al. Amphiregulin and epiregulin mRNA expression in primary tumors predicts outcome in metastatic colorectal cancer treated with cetuximab. J Clin Oncol. 2009;27(30):5068–5074. doi:10.1200/JCO.2008.21.3744
34. Seifert M, Küppers R. Human memory B cells. Leukemia. 2016;30(12):2283–2292. doi:10.1038/leu.2016.226
35. Garnelo M, Tan A, Her Z, et al. Interaction between tumour-infiltrating B cells and T cells controls the progression of hepatocellular carcinoma. Gut. 2017;66(2):342–351. doi:10.1136/gutjnl-2015-310814
36. Zhou G, Sprengers D, Boor PPC, et al. Antibodies against immune checkpoint molecules restore functions of tumor-infiltrating T cells in hepatocellular carcinomas. Gastroenterology. 2017;153(4):1107–1119.e1110. doi:10.1053/j.gastro.2017.06.017
37. Lee WC, Wang HC, Jeng LB, et al. Effective treatment of small murine hepatocellular carcinoma by dendritic cells. Hepatology. 2001;34(5):896–905. doi:10.1053/jhep.2001.29003
38. Lu Z, Zuo B, Jing R, et al. Dendritic cell-derived exosomes elicit tumor regression in autochthonous hepatocellular carcinoma mouse models. J Hepatol. 2017;67(4):739–748. doi:10.1016/j.jhep.2017.05.019
 © 2021 The Author(s). This work is published and licensed by Dove Medical Press Limited. The full terms of this license are available at https://www.dovepress.com/terms.php and incorporate the Creative Commons Attribution - Non Commercial (unported, v3.0) License.
By accessing the work you hereby accept the Terms. Non-commercial uses of the work are permitted without any further permission from Dove Medical Press Limited, provided the work is properly attributed. For permission for commercial use of this work, please see paragraphs 4.2 and 5 of our Terms.
© 2021 The Author(s). This work is published and licensed by Dove Medical Press Limited. The full terms of this license are available at https://www.dovepress.com/terms.php and incorporate the Creative Commons Attribution - Non Commercial (unported, v3.0) License.
By accessing the work you hereby accept the Terms. Non-commercial uses of the work are permitted without any further permission from Dove Medical Press Limited, provided the work is properly attributed. For permission for commercial use of this work, please see paragraphs 4.2 and 5 of our Terms.