Back to Journals » Diabetes, Metabolic Syndrome and Obesity » Volume 17
A Gender-, Age-, and Weight Status-Specific Analysis of the High Prevalence of Hyperuricemia Among Chinese Children and Adolescents with Obesity
Authors Liu M ![]() , Cao B, Luo Q
, Cao B, Luo Q ![]() , Song Y, Shi Y, Cheng M, Liu K, Mao D, Wang X, Gong C
, Song Y, Shi Y, Cheng M, Liu K, Mao D, Wang X, Gong C
Received 7 November 2023
Accepted for publication 19 January 2024
Published 23 January 2024 Volume 2024:17 Pages 381—391
DOI https://doi.org/10.2147/DMSO.S448638
Checked for plagiarism Yes
Review by Single anonymous peer review
Peer reviewer comments 2
Editor who approved publication: Dr Konstantinos Tziomalos
Meijuan Liu,1 Bingyan Cao,1 Qipeng Luo,2 Yanning Song,1 Yuting Shi,1 Ming Cheng,1 Kai Liu,1 Di Mao,1 Xinmeng Wang,1 Chunxiu Gong1
1Department of Endocrinology, Genetics and Metabolism, Beijing Children’s Hospital, Capital Medical University, National Center for Children’s Health, Beijing, People’s Republic of China; 2Department of Pain Medicine, Peking University Third Hospital, Beijing, 100191, People’s Republic of China
Correspondence: Chunxiu Gong, Department of Endocrinology, Genetics and Metabolism, Beijing Children’s Hospital, Capital Medical University, National Center for Children’s Health, Beijing, 100045, People’s Republic of China, Email [email protected]
Objective: To explore the gender-, age-, and weight status-specific prevalence of hyperuricemia (HUA) and its associated risk factors among Chinese children and adolescents with obesity.
Methods: A total of 1329 children aged 2– 17 years, who were diagnosed with obesity and hospitalized in our center from January 2016 to December 2022 were recruited. They were divided into mild obesity, moderate obesity, and severe obesity groups. HUA was defined as fasting serum uric acid level > 420 μmol/L for boys and > 360 μmol/L for girls. Multivariate logistic regression analyses were performed to identify risk factors for HUA.
Results: The highest proportion of hospitalized obese children was aged 10– 13 years comprising 677 (50.9%) followed by those aged 6– 9 years comprising 348 (26.2%) whereas the least proportion was aged 2– 5 years comprising 76 (5.7%). The above differences in age distribution were still present in subgroup analyses according to weight status. Most hospitalized obese children were boys (64.7%), especially in the severe obesity group (75.0%). The overall estimated prevalence of HUA in obese children was 54.8%. It presented a gradual increase trend over the last 7 years, with more rapidly in boys than in girls. Subgroup analysis by weight status showed that the prevalence of HUA was higher in children with moderate obesity (64.3%) and severe obesity (64.2%) when compared with mild obesity (48.2%) (P all< 0.01). Boys reached a relatively high HUA incidence level (≥ 60%) at age 12, which occurred about 2 years later than in girls (age 10). With 12 years as the cut-off point, a high prevalence of HUA (≥ 60%) was observed in both genders. Multivariable logistic regression analyses showed that boy (OR=2.844, 95% CI 2.024– 3.998), age (OR=1.253, 95% CI 1.155– 1.360), BMI-Z score (OR=2.132, 95% CI 1.438– 3.162), fasting blood glucose (OR=0.907, 95% CI 0.860– 0.956), phosphorus (OR=4.123, 95% CI 2.349– 7.239), alkaline phosphatase (OR=1.002, 95% CI 1.001– 1.004), creatinine (OR=1.067, 95% CI 1.037– 1.098), urea nitrogen (OR=1.193, 95% CI 1.032– 1.378), aspartate aminotransferase (OR=1.016, 95% CI 1.002– 1.030), triglycerides (OR=1.339, 95% CI 1.075– 1.667), and high-density lipoprotein cholesterol (OR=0.381, 95% CI 0.160– 0.910) were independently associated with odds of HUA (P all< 0.05).
Conclusion: The prevalence of HUA in Chinese obese children and adolescents is unexpectedly high. Childhood HUA was significantly associated with obesity. Gender and age differences were observed in the association between childhood obesity and HUA. Obese children aged ≥ 12 years should be focused on screening the risk of HUA.
Keywords: children, hyperuricemia, body mass index, sex, age, obesity
Introduction
Childhood obesity is a major public health issue worldwide and has been increasing rapidly in China. According to the latest data from the China National Nutrition Surveys (CNNSs), the prevalence of overweight and obesity among 6–17 years Chinese children and adolescents was 11.1% and 7.9%, respectively.1 The total population of obese children in China has ranked first in the world.2 The high prevalence of childhood obesity is of concern because of its link with adult obesity and its associated complications.3 Among these complications, hyperglycemia, dyslipidemia, hypertension, non-alcoholic fatty liver disease, and metabolic syndrome have received numerous attention from researchers and are generally well-known to the public.4,5 In contrast, the incidence and severity of hyperuricemia (HUA) among Chinese children and adolescents with obesity have been overlooked in China over the last decades.
Uric acid (UA) is the end-product of dietary and endogenous purine metabolism. HUA occurs as a consequence of either elevated UA production, or decreased renal UA excretion, or a combination of these two mechanisms.6 During the past few decades, with the rapid socio-economic development of China and the changing lifestyle and diet structure, the prevalence of HUA in children has been rapidly escalating. A recent meta-analysis of 11 population-based studies comprising 54,580 participants showed that the estimated overall prevalence of HUA in the general population of children aged 3–19 years in China was 23.3%.7 Moreover, previous studies showed that HUA was strongly associated with childhood obesity, and the prevalence of HUA increased with increasing weight status (18.2% in children with non-overweight, 37.6% in children with overweight, 50.6% in children with obesity, and 64.5% in children with extreme obesity, respectively).7 In addition to the high rate of HUA incidence, a growing concern is the adverse effects of HUA. HUA has been found to be associated with the components of metabolic syndrome and noncommunicable diseases, including insulin resistance, hypertension, dyslipidemia, liver dysfunction, cardiovascular disease, and chronic kidney disease, imposing a heavy burden on family, society, and the healthcare system.8–17 However, these studies mostly focused on adults, and there is limited data on children and younger populations.18,19 Therefore, childhood obesity and related HUA comorbidities are important issues that must be addressed to improve children’s health and well-being.
However, to date, the prevalence of HUA in obese Chinese children, particularly in different types of obesity has scarcely been studied and was poorly investigated. Thus, our primary aim was to estimate the prevalence of HUA in Chinese children and adolescents with mild obesity, moderate obesity, and severe obesity. The changes in the prevalence of HUA in boys and girls over the seven years from 2016 to 2022 were also explored in our study. In addition, considering child development does not follow a linear pattern like adult growth, and the age and gender differences in serum UA levels have been reported in previous research,7,20 the age- and gender-specific analysis of the high prevalence of hyperuricemia among Chinese children and adolescents with obesity were examined in our present study. Finally, the risk factors of HUA were also identified, which may provide a scientific basis for the prevention and treatment of HUA in children and adolescents. These data will enrich the cognitive ability of childhood HUA and play an important role in making screening policy decisions for childhood obesity-related HUA.
Methods
Study Population
This was a retrospective study among children and adolescents, aged 2–17 years, with obesity who were hospitalized in the Department of Endocrinology, Genetics and Metabolism, Beijing Children’s Hospital (Beijing, China) from January 2016 to December 2022. Children and adolescents meeting the following inclusion criteria were eligible for this study: ① age 2–17 years, ② obese children [body mass index (BMI) ≥95th of children of the same age and gender according to the Centers for Disease Control and Prevention (CDC) standards].21 The exclusion criteria were as follows: ① age <2 years or >18 years; ② non-obesity; ③ with chronic, systemic, or organic diseases; ④ taking medications known to affect UA metabolism. Finally, 1329 obese children (860 boys and 469 girls) aged 2–17 years (72 aged 2–5 years, 351 aged 6–9 years, 678 aged 10–13 years, 228 aged 14–17 years) were recruited in this study. Our present study was approved by the ethics committee of Beijing Children’s Hospital, Capital Medical University. Written and informed consent were obtained from all children and adolescents, their families or legal guardians. This study complies with Declaration of Helsinki.
Anthropometric Measurements and Definitions
Anthropometric measurements, including body weight, height, waist circumference (WC), and hip circumference (HC) were measured by specialized pediatric endocrinologists. Body weight was measured on a hospital scale with children dressed indoor clothing and without shoes. Height was measured without shoes with children standing with their backs against a vertical scale. WC was measured by a non-extensible measuring tape placed horizontally around the midpoint between the highest point of the anterior superior iliac crest and the bottom of the lower edge of the ribs, while HC was measured around the widest portion of the buttocks using the same tape.22 These measurements were recorded to the nearest 0.1 kg or cm. BMI was calculated as the weight in kilograms divided by the height squared in meters (kg/m2). Mild obesity was defined as BMI ≥95th for age and sex or a BMI ≥30 kg/m2; moderate obesity as BMI ≥120% of the 95th for age and sex or a BMI ≥35 kg/m2 (whichever is lower); and severe obesity as BMI ≥140% of the 95th for age and sex or a BMI ≥40 kg/m2 (whichever is lower).23,24
Fasting blood samples were collected in the morning by experienced nurses with the children in the fasting state. Serum potassium (K), calcium (Ca), phosphorus (P), alkaline phosphatase (ALP), creatinine (Cr), urea nitrogen (Urea), UA, aspartate aminotransferase (AST), alanine aminotransferase (ALT), gamma-glutamyl transferase (GGT), total cholesterol (TC); triglycerides (TG), high-density lipoprotein cholesterol (HDL-C); low-density lipoprotein cholesterol (LDL-C), very-low-density lipoprotein cholesterol (VLDL-C), nonesterified fatty acid (NEFA), creatine kinase (CK), lactate dehydrogenase (LDH) were measured by were measured enzymatically using an automatic analyzer (RX Daytona; Randox Laboratories Ltd, Antrim, Ireland) in Beijing Children’s Hospital. HUA was defined as the fasting serum UA level greater than 420 μmol/L (7 mg/dL) for boys and greater than 360 μmol/L (6 mg/dL) for girls.25,26
Statistical Analyses
Continuous variables were expressed as means±standard deviations (SD) and categorical variables as frequencies and percentages. The significance of differences between groups was assessed by the independent t-test for continuous variables and the chi-squared test for categorical variables. Multivariate logistic regression analyses were performed to identify risk factors for HUA, with odds ratios (ORs) and 95% confidence intervals (CIs) calculated for each potential risk factor. SPSS version 22.0 for Windows (SPSS Inc, Chicago, IL, USA) and GraphPad Prism version 9.0 (San Diego, CA) were used for statistical analyses and graphs, respectively. Values of P<0.05 were considered to indicate statistical significance.
Results
General Information About the Study Participants
A total of 1329 children (786 mild obesity, 367 moderate obesity, 176 severe obesity) aged 2–17 years were included in our present study. The highest proportion of hospitalized obese children was aged 10–13 years comprising 677 (50.9%) followed by those aged 6–9 years comprising 348 (26.2%) then those aged 14–17 years comprising 228 (17.2%), whereas the least proportion was aged 2–5 years comprising 76 (5.7%)(Table 1). The above differences in age distribution were still present in subgroup analyses according to weight status. Most hospitalized obese children were boys (64.7%), especially in the severe obesity group (75.0%)(Table 1).
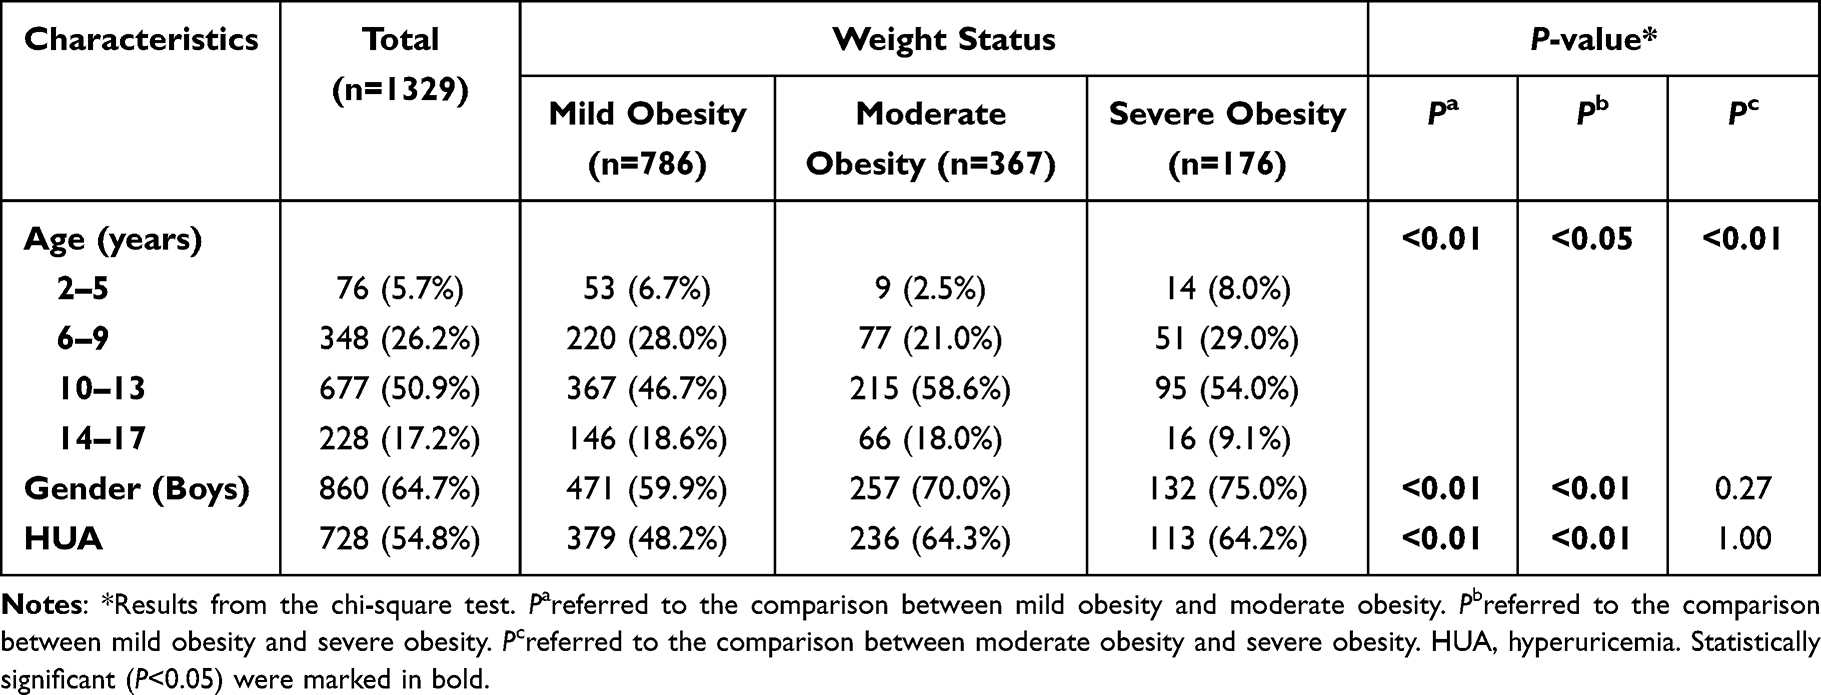 |
Table 1 Incidence of HUA Among Children and Adolescents with Obesity Hospitalized in the Beijing Children’s Hospital Between 2016 and 2022 |
Prevalence of HUA Among Obese Children by Weight Status, Years, Age
The overall estimated prevalence of HUA in obese children was 54.8%. Subgroup analysis by weight status showed that compared with children with mild obesity (48.2%), the prevalence of HUA was significantly higher in children with moderate obesity (64.3%) and in children with severe obesity (64.2%) (P all<0.01). However, no significant difference was found in the prevalence of HUA between the moderate obesity group and the severe obesity group (Table 1).
As depicted in Figure 1, the prevalence of HUA in obese children showed a gradual increase trend over the last 7 years. The prevalence of HUA from 2016 to 2022 was 48.1%, 45.9%, 56.9%, 49.3%, 60.0%, 64.1%, 62.4% for boys, 61.5%, 49.3%, 52.7%, 41.2%, 49.2%, 57.1%, 60.9% for girls, respectively. It is also worth noting that boys showed a more rapid increase than girls.
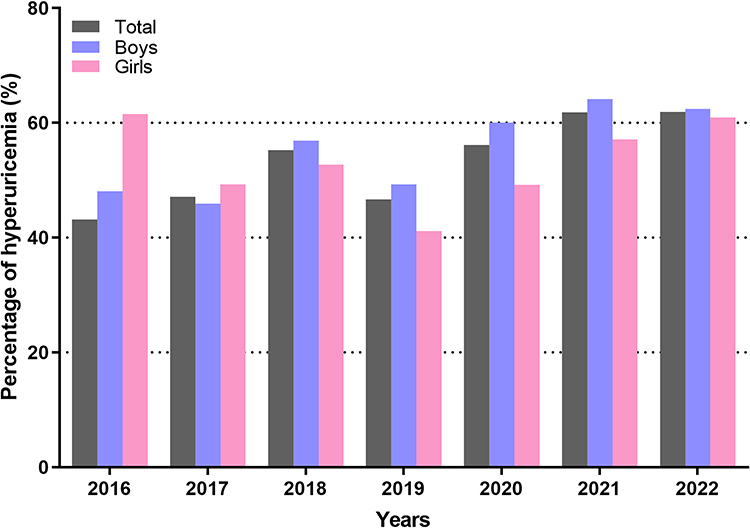 |
Figure 1 The percentage of hyperuricemia (by years) for boys and girls. |
As illustrated in Table 2, serum UA levels in boys were higher than that in girls. The prevalence of HUA appeared to show an increasing trend with age. The prevalence of HUA in children and adolescents aged 2 to 17 years was 33.3%, 20.0%, 0%, 18.2%, 8.3%, 26.7%, 28.2%, 41.5%, 28.9%, 51.9%, 65.1%, 74.7%, 71.6%, 70.2%, 69.6%, 50.0% for boys, 0%, 0%, 57.1%, 14.3%, 31.8%, 40.3%, 41.0%, 48.5%, 61.1%, 71.1%, 71.8%, 65.2%, 86.2%, 70.4%, 87.5%, 100.0% for girls, respectively. Boys reached a relatively high HUA incidence level (≥60%) at age 12, which occurs about 2 years later than in girls (age 10). With 12 years as the cut-off point, a high prevalence of HUA (≥60%) was observed in both genders.
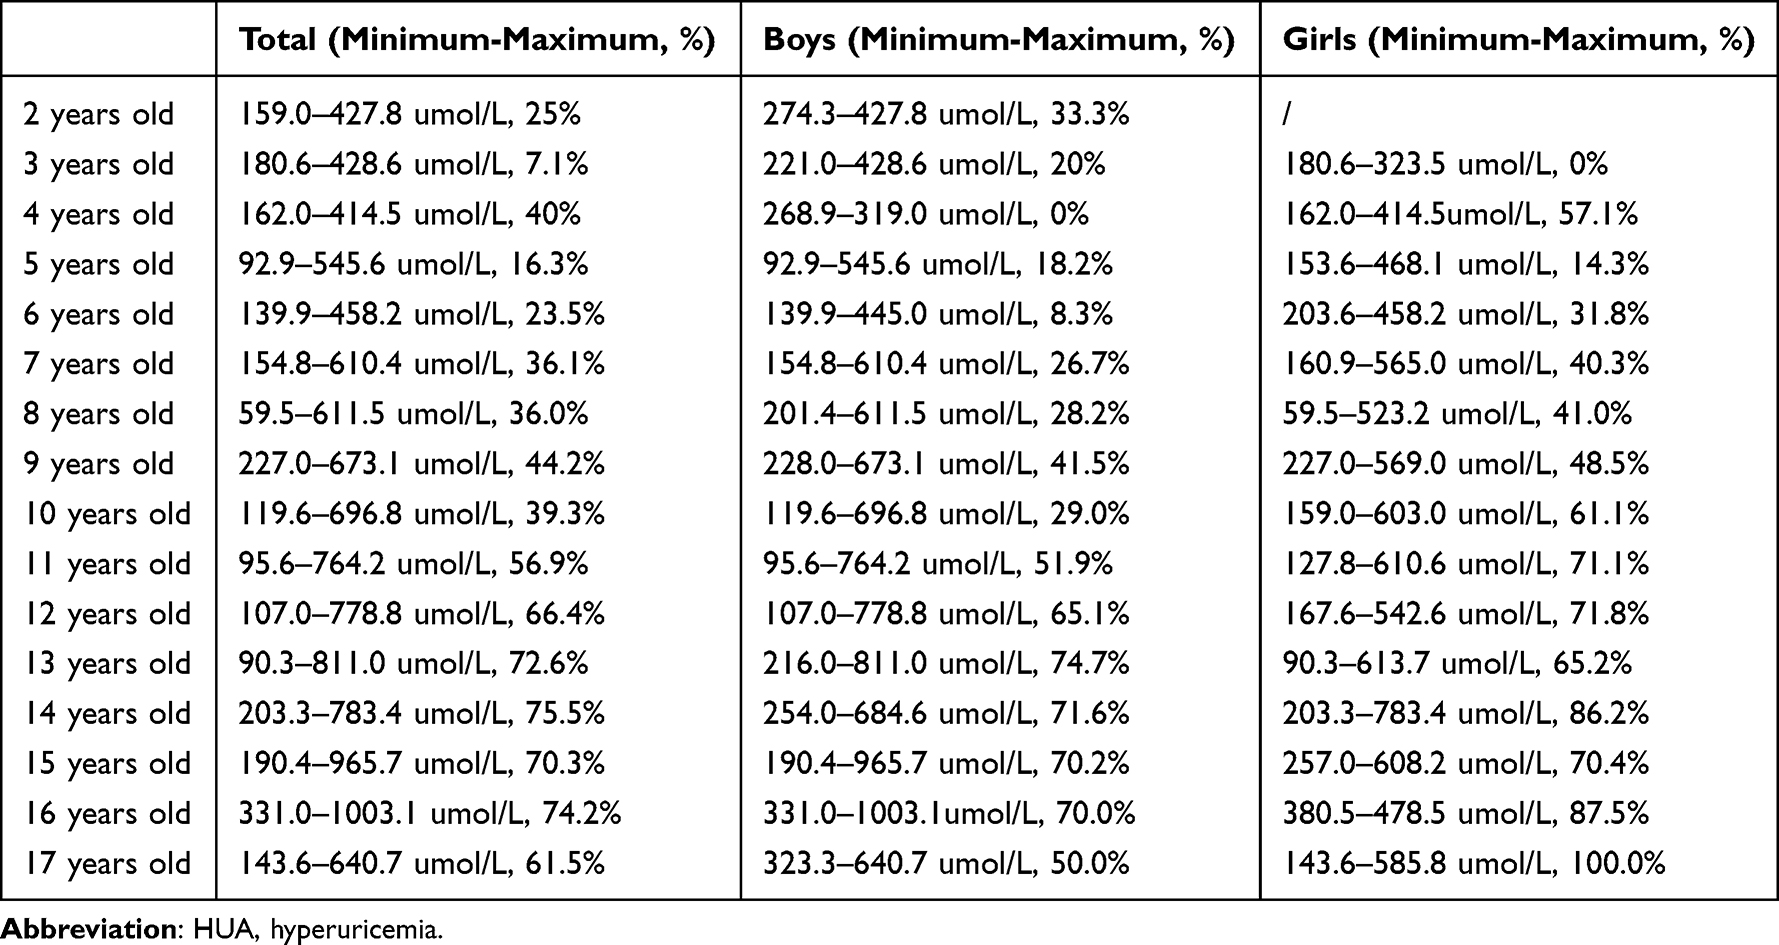 |
Table 2 The Percentage of HUA (by Age) for Boys and Girls |
To enable a clearer view, multi-layered pie charts were performed to show the distribution of the HUA (Figure 2). The highest proportion of HUA was children aged >10 years, followed by those aged 5–10 years, whereas the least proportion was aged <5 years. This phenomenon remained when this comparison was performed respectively in the mild obesity, moderate obesity, and severe obesity groups. Additionally, in the mild obesity and moderate obesity groups, girls accounted for a higher proportion in children aged 5–10 years. However, in the severe obesity group, boys accounted for a higher proportion in children aged 5–10 years.
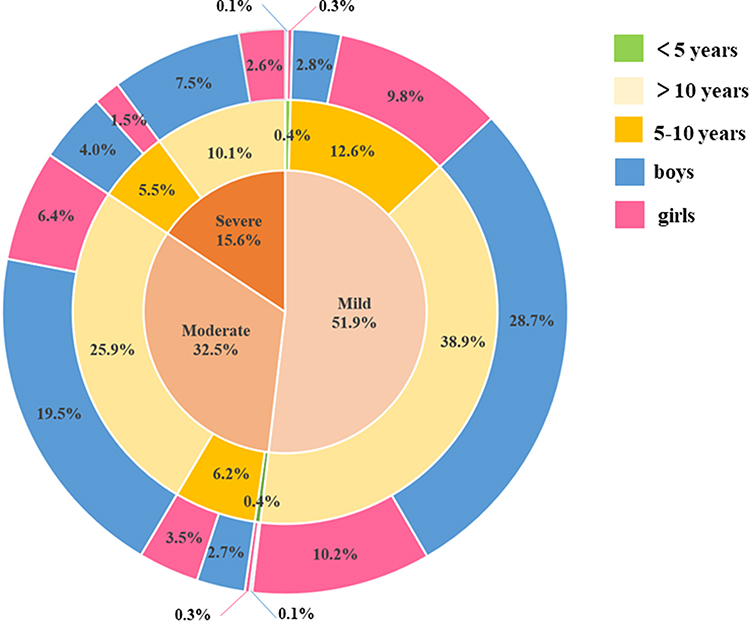 |
Figure 2 Multi-layered pie charts showing the distribution of the hyperuricemia. |
Comparison Between HUA and Non-HUA Groups
Table 3 shows the biochemical parameters in the HUA and non-HUA groups. In both genders, age, height, weight, BMI, WC, HC, Cr, Urea, eGFR, AST, ALT, GGT, TG, LDL-C, and VLDL-C were all higher, while HDL-C was lower in the HUA group than the non-HUA group (P all<0.05). In addition, the BMI-Z score and TC were higher, whereas ALP was lower in the HUA group than in the non-HUA group, and the differences were significant only in girls (P<0.05). In boys, serum Ca and P levels were found to be higher, while FBG was lower in the HUA group than in the non-HUA group (P<0.05). No significant difference was found in K, NEFA, or CK between the HUA group and non-HUA group (P>0.05).
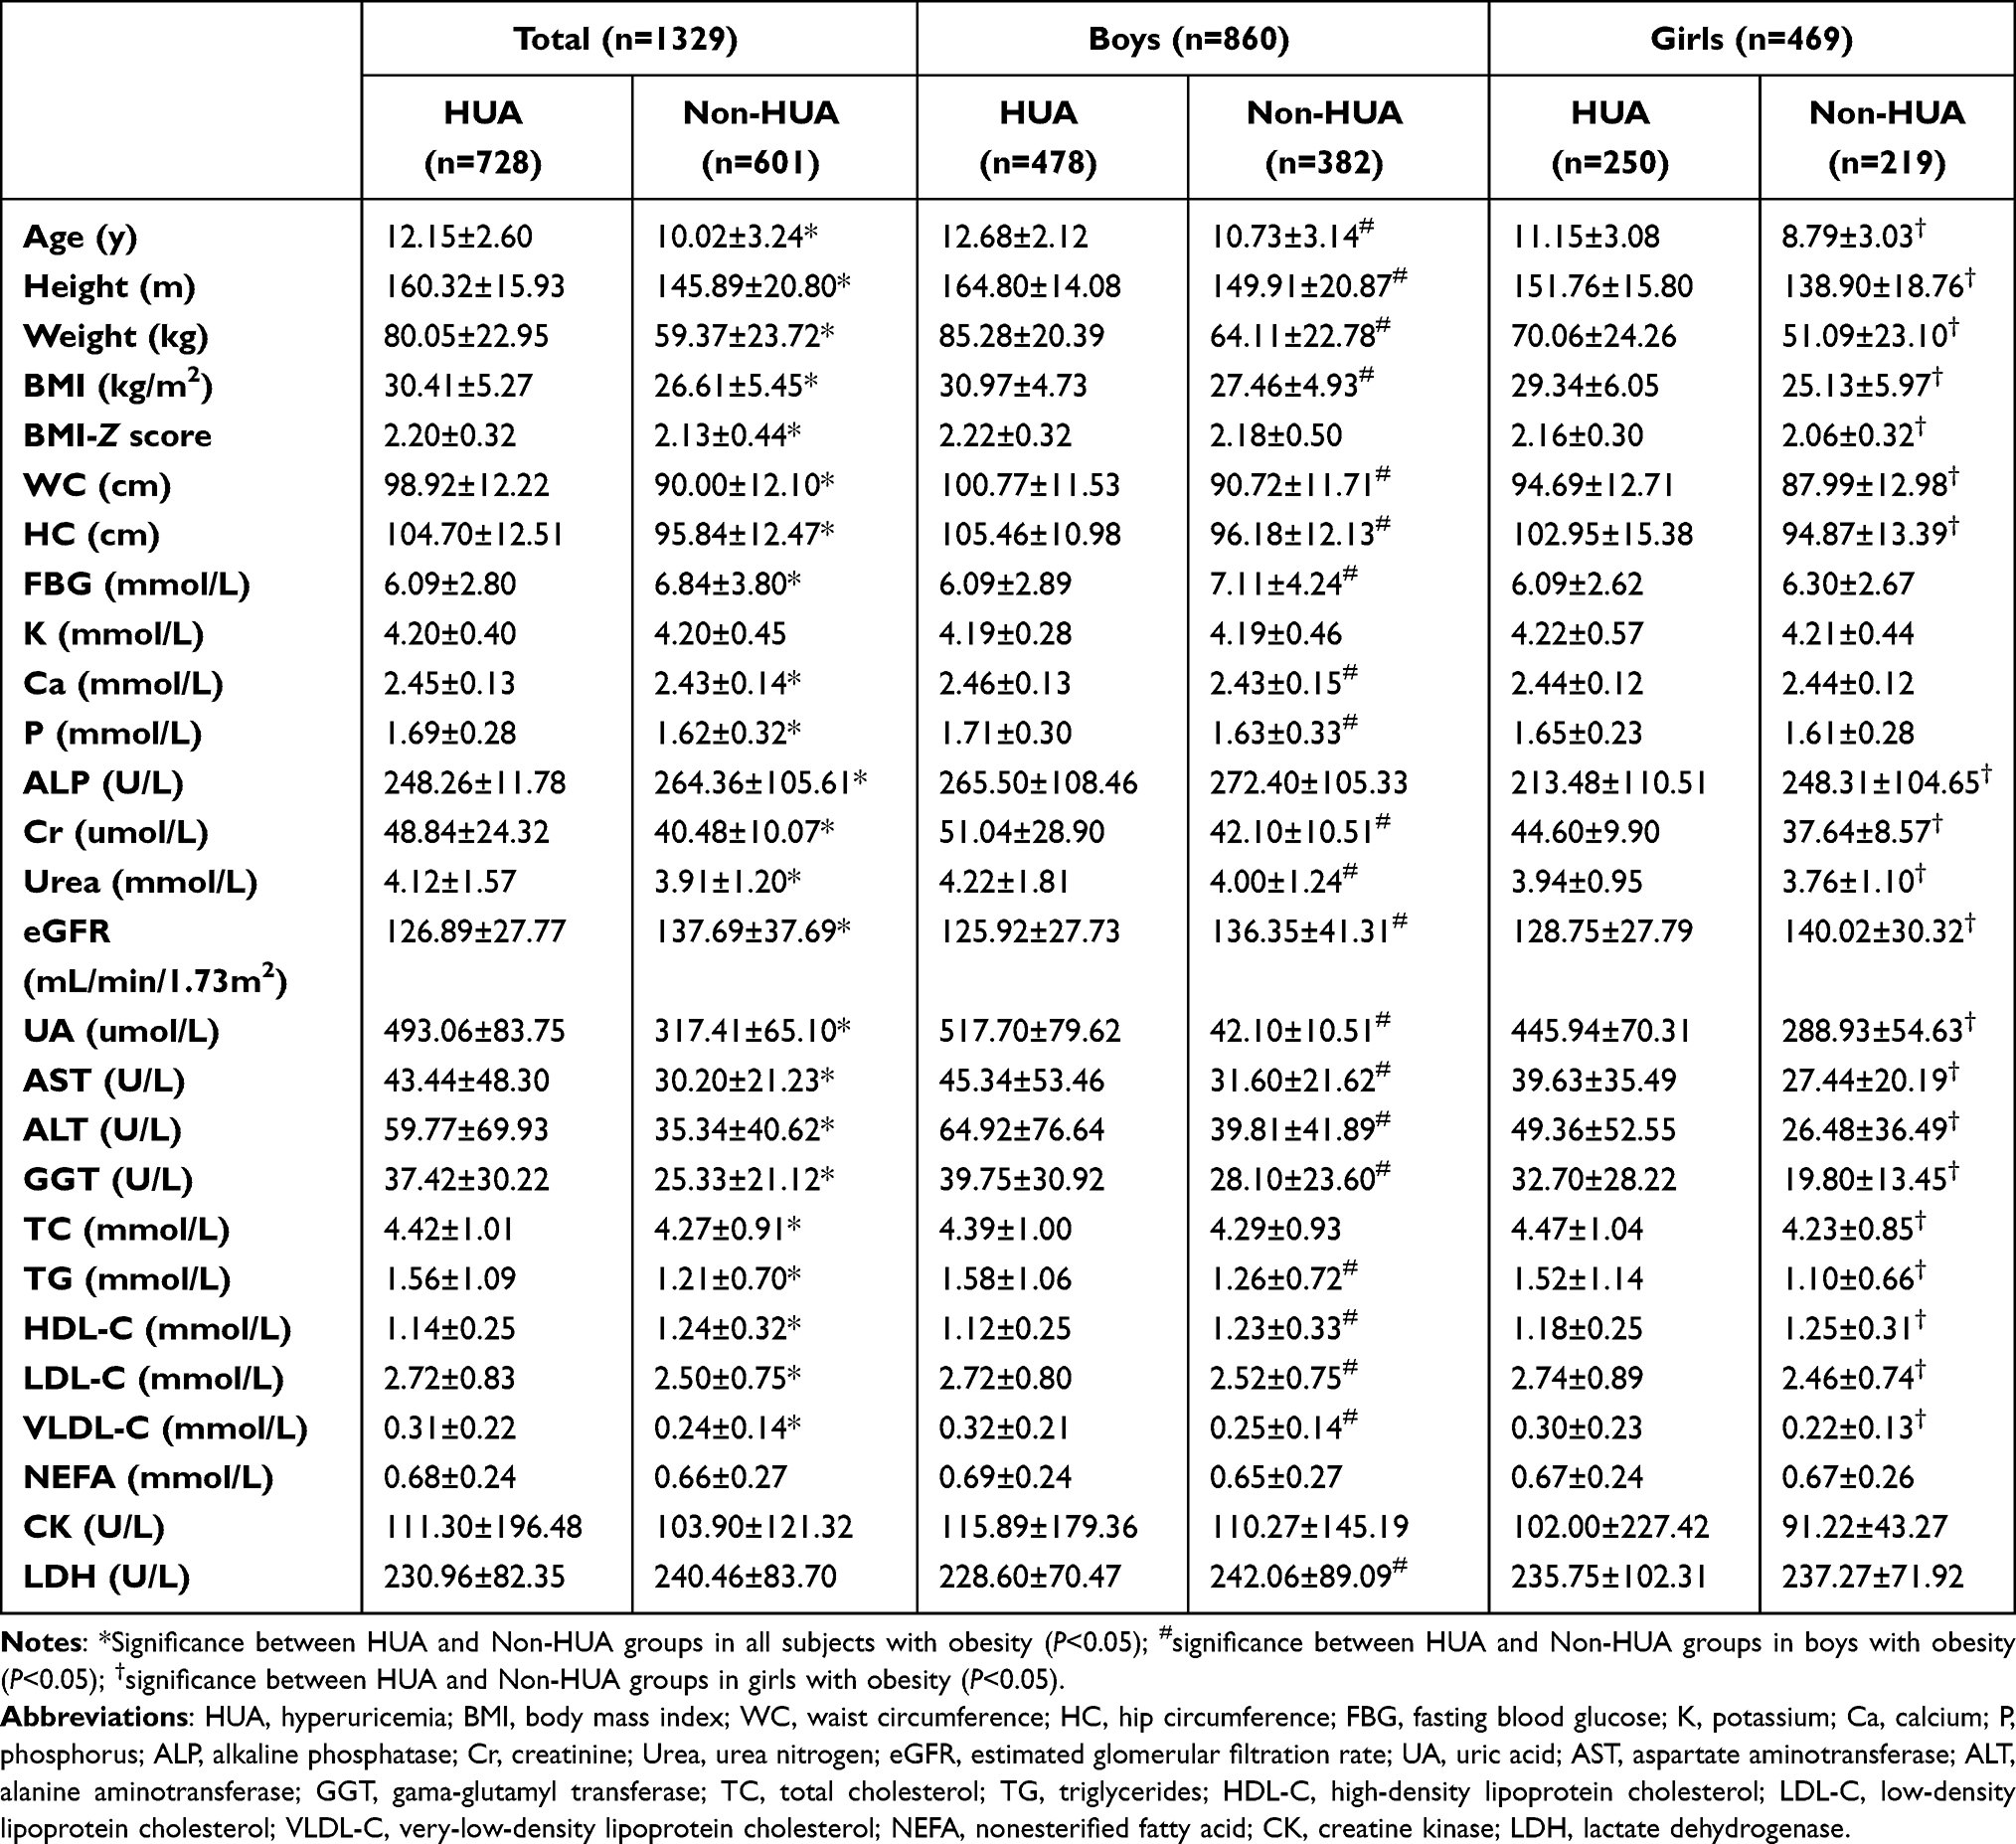 |
Table 3 Comparison of the Clinical Characteristics Between HUA and Non-HUA Groups |
Risk Factors Associated with HUA in Childhood Obesity
To further investigate the risk factors associated with HUA, the multi-factor logistic regression analysis was performed. As presented in Table 4, in all subjects, boy (OR=2.844, 95% CI 2.024–3.998), age (OR=1.253, 95% CI 1.155–1.360), BMI-Z score (OR=2.132, 95% CI 1.438–3.162), FBG (OR=0.907, 95% CI 0.860–0.956), P (OR=4.123, 95% CI 2.349–7.239), ALP (OR=1.002, 95% CI 1.001–1.004), Cr (OR=1.067, 95% CI 1.037–1.098), Urea (OR=1.193, 95% CI 1.032–1.378), AST (OR=1.016, 95% CI 1.002–1.030), TG (OR=1.339, 95% CI 1.075–1.667), and HDL-C (OR=0.381, 95% CI 0.160–0.910) were independently associated with risk of HUA (P all<0.05). However, after stratified by gender, risk factors for HUA among boys were not consistent with those observed in girls. FBG (OR=0.882, 95% CI 0.827–0.940), ALP (OR=1.002, 95% CI 1.001–1.004), Cr (OR=1.067, 95% CI 1.033–1.102), Urea (OR=1.220, 95% CI 1.021–1.457), TG (OR=1.473, 95% CI 1.116–1.945), and LDL-C (OR=2.526, 95% CI 1.015–6.283) were independent risk factors for HUA in boys but not in girls.
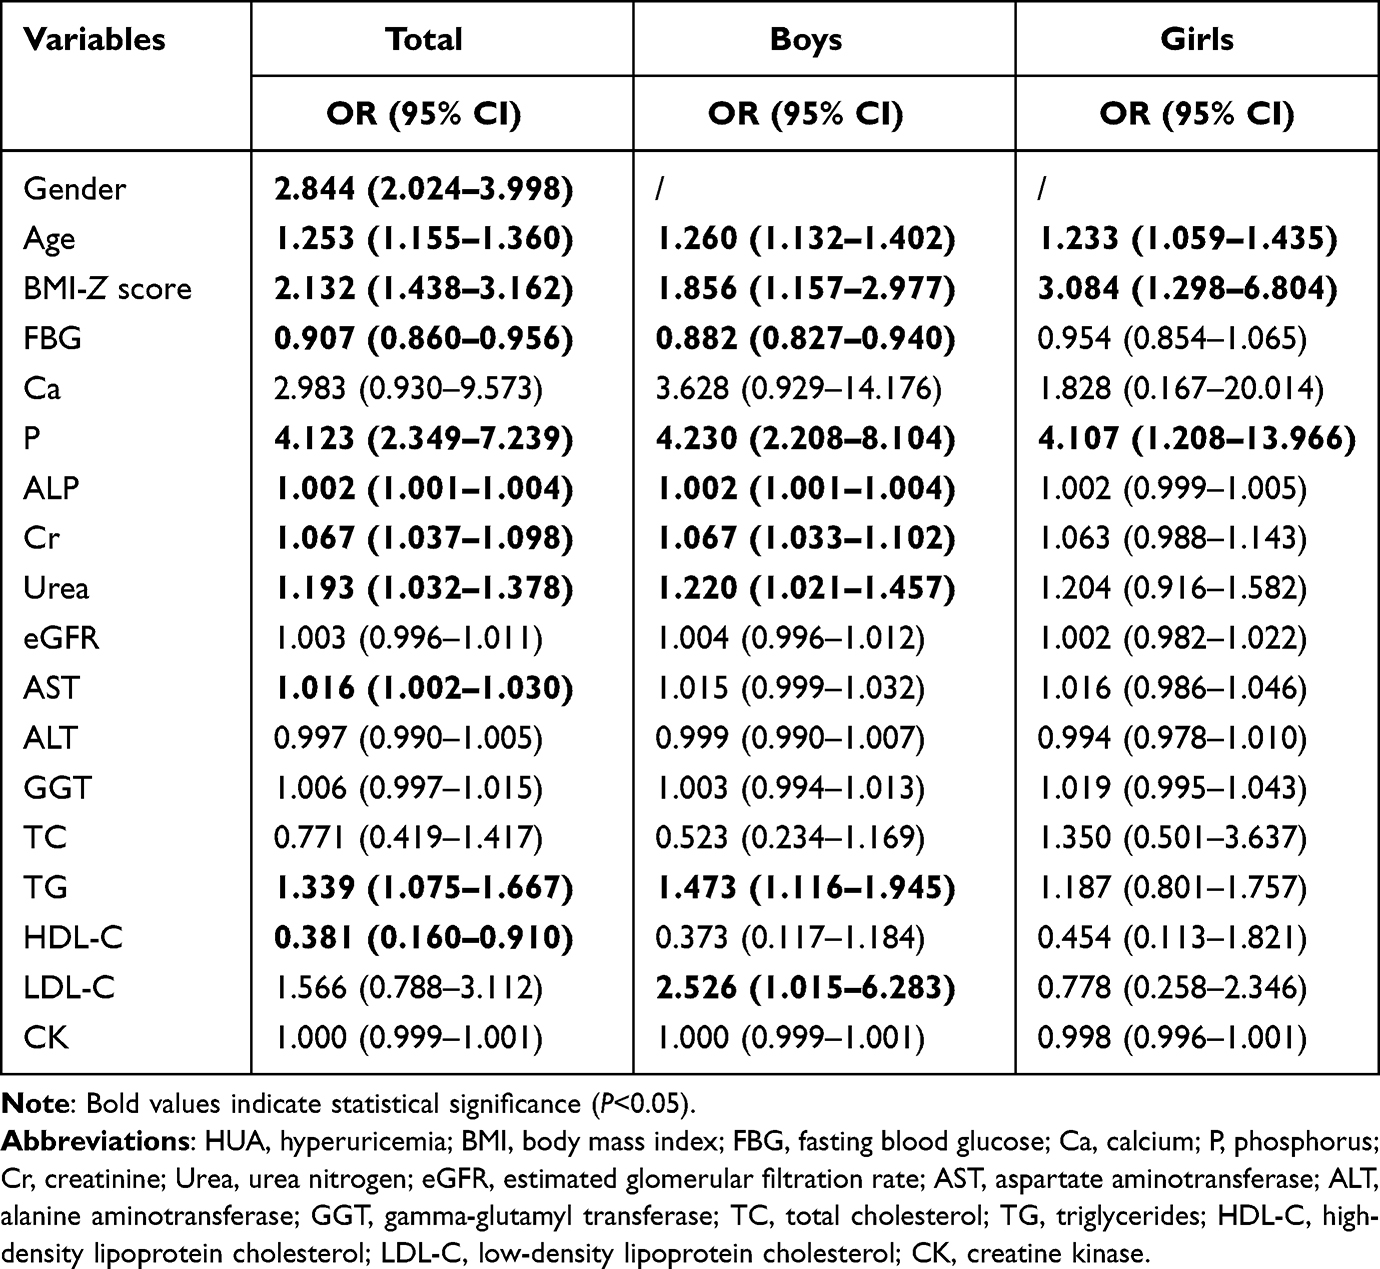 |
Table 4 Multifactorial Logistic Regression Analysis of the Risk of HUA |
Discussion
In this study in Beijing, China, we report the prevalence of HUA and its associated risk factors among Chinese children and adolescents with obesity, taking into consideration gender, age, and weight status.
According to the latest data from 11 population-based studies comprising 54,580 Chinese children aged 3–19 years, the overall prevalence of HUA was 23.3% (26.6% in boys and 19.8% in girls).7 This value was considerably higher than those described in previous studies conducted across other countries, including Korea (total 9.4%; boys, 8.4%; girls, 10.5%),27 Brazil (10.3%), and the USA (16.56%%).28 Even worth, with the recent epidemic in childhood obesity, the prevalence of HUA is projected to continually increase. A cross-sectional survey of 1027 obese children and adolescents in Japan reported that the prevalence of HUA was 20.7% among children aged 6–14 years.29 China now has the highest number of obese children in the world. A previous small sample size study (n=271) in Shanghai revealed the high prevalence of HUA in obese children aged 6–17 years (47.71% in boys, 48.31% in girls).22 Our previous studies involving 135 children showed that the prevalence of HUA in children with type 2 diabetes mellitus (T2DM) was 23.0%.30 In this large single-center cross-sectional study (n=1329), we found that the overall prevalence of HUA in obese children was 54.8% (55.6% in boys, 53.3% in girls), which was much higher than that in previous domestic and international studies. Moreover, we found that the prevalence of HUA in obese children showed a gradual increase trend over the last 7 years. Between 2016 and 2022 the prevalence of HUA in obese children grew from 43.1% to 61.2%. These data indicated that the high prevalence of HUA in children and adolescents in China has become a serious public health problem that cannot be ignored.
In addition to the high prevalence of HUA in obese children, our analysis revealed significant differences in the prevalence of HUA among children and adolescents with different degrees of obesity. The prevalence of HUA was significantly higher in children with moderate obesity and severe obesity, compared with those with mild obesity. This finding was in line with the study of Rao et al among 54,580 Chinese children aged 3–19 years, which also showed the increasing prevalence trend of HUA with increasing weight status (18.2%, 37.6%, 50.6%, and 64.5% among children with non-overweight, overweight, obesity, and extreme obesity, respectively). These results indicated a strong association between the severity of childhood obesity and the risk of HUA. In the present study, BMI-Z score was found to be an individual risk factor associated with the risk of HUA, which corroborating the findings previously described for Chinese children involved 14 provinces7 and in the study conducted in Sichuan province,20 as well as in other countries such as Brazil,31 Denmark,32 Poland,33 Germany,34 and the USA.35 It is noteworthy that literature data indicated that programs for reducing body weight effectively decreased UA levels in children with obesity.32,33,35 Taken together, the high prevalence and the close relationship between obesity and HUA observed in our results together with previous publications revealed an urgent need for scaled-up effective interventions among Chinese children.
As stated above, the link between obesity and HUA in children is well established. Recently, emerging studies started to focus on the relationship between HUA and obesity-associated complications.36–39 HUA in obese children was frequently associated with the components of metabolic syndrome and noncommunicable diseases, including insulin resistance, dyslipidemia, hypertension, and chronic kidney disease.19 Our findings were in keeping with these reports. We found that children in the HUA group have higher AST, ALT, GGT, TG, LDL-C, and VLDL-C, but lower HDL-C levels. Furthermore, TG was independently associated with the increased risk of HUA. The liver is an important organ for the de novo purine synthesis and the production of UA in vivo. Although the mechanisms that explain the association of UA and TG remain unclear, it is speculated that the synthesis of TG requires NADPH, which results in increased UA production.40 As widely known, TG accumulation is central to NAFLD development.41 A recent retrospective study performed by Zhou et al reported that HUA ranked as the most common comorbidity in childhood NAFLD (59.58%).42 The results of our previous studies in T2DM patients also showed higher UA levels in the NAFLD group than those in the non-NAFLD group.43 The increased UA levels may be used to evaluate the progression of NAFLD in children.42,43 Yet the mechanism underlying is not well understood, the induction by HUA of endothelial dysfunction, insulin resistance, oxidative stress, and systemic inflammation may involved.44 The kidney is the main excretory organ of UA. In the results of this study, Cr and Urea levels were found to be higher in the HUA group, whereas eGFR was lower than in the non-HUA group. The results of multifactorial logistic regression analysis showed that Cr and Urea were independent risk factors for the development of HUA. A recent review of the relationship between UA and the kidney suggested that UA may be an important factor in the pathogenesis of acute kidney injury and chronic kidney disease.45 Serum UA and blood Cr as well as Urea could interact with each other, and HUA could directly and indirectly cause kidney damage. Experimental HUA animal models revealed that renal tubulointerstitial fibrosis appeared before renal insufficiency, which indicated the direct toxicity of UA to renal tubules.46 Therefore, early detection and control of serum UA levels in obese children are helpful for the prevention and treatment of chronic kidney disease. Another interesting finding worthy of note was that, after stratified by gender, the relationships between TG, Cr, and Urea were observed in boys but not in girls. However, our result differs from previous studies by Krzystek-Korpacka et al in Poland, which showed that the correlation between UA and TG was only observed in girls.37 This disagreement may be attributable to sample size, geographic distribution, and racial differences. The underlying mechanisms for the sex difference remain unclear, but this physiological difference may be partially explained by the action of sex hormones, which have been shown to have a significant impact on renal UA transport.47 Given the inconsistency across the studies, more findings on the gender-specific associations between HUA and obesity-associated complications should be done in the future.
Additionally, the gender-specific analysis of the high prevalence of HUA among Chinese children and adolescents with obesity was also performed in our present study. We found that boys reached a relatively high HUA incidence level (≥60%) at age 12, which occurs about 2 years later than in girls (age 10). Our findings were in keeping with previous studies at home and abroad. In nationally representative data of 6768 children from the US Health Examination Survey, serum UA levels increased markedly from 10–12 years in girls and 12–14 in boys.48 A cross-sectional study in Zhejiang province in China based on 5439 children and adolescents aged 5–14 years showed that in the general pediatric population, the rapid increase of UA in boys occurred 1–2 years later than in girls (9–10 years in boys, 8–9 years in girls).49 The gender differences in the peaking time almost certainly reflected the different tempo of the puberty onset, as boys enter puberty approximately 2 years later than girls.50 Noteworthy, with 12 years as the cut-off point, a high prevalence of HUA (≥60%) was observed in both genders. In a retrospective study of 15,986 children in Sichuan province in China, Guo et al found that with 13 years as the cut-off point, the prevalence of HUA increased significantly in boys, but girls did not show a significant increase.20 Given the fluctuation of UA during childhood, it is of great importance to establish sex- and age-specific references for UA in Chinese children and adolescents in future study.
Our study has several limitations. First, this was a cross-sectional study, and as longitudinal data were not available, the cause-effect relationship between HUA and childhood obesity as well as its associated complications could not be determined in our study. Second, an unhealthy lifestyle, especially a diet rich in purines was an established risk factor for HUA, however, data on lifestyle were unavailable in our study. Third, our data were collected in a single center, which was not representative of the whole Chinese population.
In conclusion, in this large pooled sample in China, the prevalence of HUA was unexpectedly high in obese children and adolescents. Gender and age differences were observed in the association between childhood obesity and HUA. Several obesity-related metabolic abnormalities were associated with the risk of HUA. It is important to focus on the serum UA levels in obese children, particularly those aged ≥12 years, which has significant clinical and social implications.
Acknowledgments
All authors helped to perform the research; Meijuan Liu wrote the manuscript; Bingyan Cao contributed to the collection of clinical samples; Qipeng Luo helped with the interpretation of data and the statistical analysis; Yanning Song, Yuting Shi, Ming Cheng, Kai Liu, Di Mao, Xinmeng Wang took part in the data entry; Chunxiu Gong conceived and designed the project as well as revised the manuscript. All listed authors revised the paper critically and approved the final version of the submitted manuscript.
Funding
This study was funded by the Beijing Hospitals Authority Youth Programme (code QML20231203) and the Beijing Research Ward Construction Demonstration Unit Project (code BCRW202101).
Disclosure
The authors declare that they have no competing interests.
References
1. Pan XF, Wang L, Pan A. Epidemiology and determinants of obesity in China. Lancet Diabetes Endocrinol. 2021;9(6):373–392. doi:10.1016/S2213-8587(21)00045-0
2. Reilly JJ. Health effects of overweight and obesity in 195 countries. N Engl J Med. 2017;377:1496.
3. Okronipa H, Arimond M, Young RR, et al. Exposure to a slightly sweet lipid-based nutrient supplement during early life does not increase the preference for or consumption of sweet foods and beverages by 4–6-y-old Ghanaian preschool children: follow-up of a randomized controlled trial. J Nutr. 2019;149(3):532–541. doi:10.1093/jn/nxy293
4. Cali AM, Caprio S. Obesity in children and adolescents. J Clin Endocrinol Metab. 2008;93:S31–S36. doi:10.1210/jc.2008-1363
5. Morales CW, Molina DJ, Plata OS, Plata OJ, Morales CM, Calderón BP. Childhood obesity: aetiology, comorbidities, and treatment. Diabetes Metab Res Rev. 2019;35(8):e3203. doi:10.1002/dmrr.3203
6. Su J, Wei Y, Liu M, et al. Anti-hyperuricemic and nephroprotective effects of Rhizoma Dioscoreae septemlobae extracts and its main component dioscin via regulation of mOAT1, mURAT1 and mOCT2 in hypertensive mice. Arch Pharm Res. 2014;37(10):1336–1344. doi:10.1007/s12272-014-0413-6
7. Rao J, Ye P, Lu J, et al. Prevalence and related factors of hyperuricaemia in Chinese children and adolescents: a pooled analysis of 11 population-based studies. Ann Med. 2022;54(1):1608–1615. doi:10.1080/07853890.2022.2083670
8. Chen YC, Liu YH, Wu PY, et al. Synergetic association between anemia and hyperuricemia on new-onset chronic kidney disease in a large Taiwanese population follow-up study. Int J Environ Res Public Health. 2023;4:20.
9. Singh SK, Singh R, Singh SK, Iquebal MA, Jaiswal S, Singh A. Prevalence of hyperuricemia and the relationship between serum uric acid and hypertension in new onset diabetic patients: a cross-sectional Indian Study. Diabetes Metab Syndr Obes. 2022;15:1809–1817. doi:10.2147/DMSO.S363311
10. Molla NH, Kathak RR, Sumon AH, et al. Assessment of the relationship between serum uric acid levels and liver enzymes activity in Bangladeshi adults. Sci Rep. 2021;11(1):20114. doi:10.1038/s41598-021-99623-z
11. Ali N, Miah R, Hasan M, et al. Association between serum uric acid and metabolic syndrome: a cross-sectional study in Bangladeshi adults. Sci Rep. 2020;10(1):7841. doi:10.1038/s41598-020-64884-7
12. Haque T, Rahman S, Islam S, Molla NH, Ali N. Assessment of the relationship between serum uric acid and glucose levels in healthy, prediabetic and diabetic individuals. Diabetol Metab Syndr. 2019;11(1):49. doi:10.1186/s13098-019-0446-6
13. Ali N, Mahmood S, Islam F, et al. Relationship between serum uric acid and hypertension: a cross-sectional study in Bangladeshi adults. Sci Rep. 2019;9(1):9061. doi:10.1038/s41598-019-45680-4
14. Ali N, Rahman S, Islam S, et al. The relationship between serum uric acid and lipid profile in Bangladeshi adults. BMC Cardiovasc Disord. 2019;19(1):42. doi:10.1186/s12872-019-1026-2
15. Duan Y, Liang W, Zhu L, et al. Association between serum uric acid levels and obesity among university students (China). Nutr Hosp. 2015;31(6):2407–2411. doi:10.3305/nh.2015.31.6.8734
16. Qin L, Yang Z, Gu H, et al. Association between serum uric acid levels and cardiovascular disease in middle-aged and elderly Chinese individuals. BMC Cardiovasc Disord. 2014;14(1):26. doi:10.1186/1471-2261-14-26
17. Dehghan A, van Hoek M, Sijbrands EJ, Hofman A, Witteman JC. High serum uric acid as a novel risk factor for type 2 diabetes. Diabetes Care. 2008;31(2):361–362. doi:10.2337/dc07-1276
18. Cardoso AS, Gonzaga NC, Medeiros CC, Carvalho DF. Association of uric acid levels with components of metabolic syndrome and non-alcoholic fatty liver disease in overweight or obese children and adolescents. J Pediatr. 2013;89(4):412–418. doi:10.1016/j.jped.2012.12.008
19. Kubota M. Hyperuricemia in children and adolescents: present knowledge and future directions. J Nutr Metab. 2019;2019:3480718. doi:10.1155/2019/3480718
20. Guo X, Xiao N, Jing X, Zhu Z, Zhang H. Analysis of the prevalence and influencing factors of hyperuricemia in children and adolescents aged 6–17 years in northeastern Sichuan Province. J Pediatr. 2023;99(6):604–609. doi:10.1016/j.jped.2023.05.001
21. Kuczmarski RJ, Ogden CL, Guo SS, et al. CDC Growth Charts for the United States: Methods and Development. National Center for Health Statistics; 2000:1–190.
22. Xie L, Mo P, Tang Q, et al. Skeletal muscle mass has stronger association with the risk of hyperuricemia than body fat mass in obese children and adolescents. Front Nutr. 2022;9:792234. doi:10.3389/fnut.2022.792234
23. Skinner AC, Skelton JA. Prevalence and trends in obesity and severe obesity among children in the United States, 1999–2012. JAMA Pediatr. 2014;168(6):561–566. doi:10.1001/jamapediatrics.2014.21
24. Skinner AC, Ravanbakht SN, Skelton JA, Perrin EM, Armstrong SC. Prevalence of obesity and severe obesity in US Children, 1999–2016. Pediatrics. 2018;4:141.
25. Huang YF, Yang KH, Chen SH, et al. 高尿酸血症/痛风患者实践指南[Practice guideline for patients with hyperuricemia/gout]. Zhonghua Nei Ke Za Zhi. 2020;59(7):519–527. Chinese. doi:10.3760/cma.j.cn112138-20200505-00449
26. Qian Y, Kong YW, Wan NJ, Yan YK. Associations between body mass index in different childhood age periods and hyperuricemia in young adulthood: the China Health and Nutrition Survey cohort study. World J Pediatr. 2022;18(10):680–686. doi:10.1007/s12519-022-00573-x
27. Lee JH. Prevalence of hyperuricemia and its association with metabolic syndrome and cardiometabolic risk factors in Korean children and adolescents: analysis based on the 2016–2017 Korea National Health and Nutrition Examination Survey. Korean J Pediatr. 2019;62(8):317–323. doi:10.3345/kjp.2019.00444
28. Wei Y, Zhu J, Wetzstein SA. Plasma and water fluoride levels and hyperuricemia among adolescents: a cross-sectional study of a nationally representative sample of the United States for 2013–2016. Ecotoxicol Environ Saf. 2021;208:111670. doi:10.1016/j.ecoenv.2020.111670
29. Tang L, Kubota M, Nagai A, Mamemoto K, Tokuda M. Hyperuricemia in obese children and adolescents: the relationship with metabolic syndrome. Pediatr Rep. 2010;2(1):e12. doi:10.4081/pr.2010.e12
30. Liang XJ, Gong CX, Liu Y, Liu M, Gu Y. Association study of children type 2 diabetes mellitus with hyperuricemia and insulin resistance, lipid. Chin J Diabetes. 2015;23:726–729.
31. Moulin-Mares S, Oliosa PR, Faria ER, Zago-Gomes MP, Mill JG. Association of uric acid with cardiovascular risk in Brazilian children and adolescents. Nutr, Metab Cardiovasc Dis. 2021;31(1):314–321. doi:10.1016/j.numecd.2020.09.012
32. Jørgensen RM, Bøttger B, Vestergaard ET, et al. Uric acid is elevated in children with obesity and decreases after weight loss. Front Pediatr. 2021;9:814166. doi:10.3389/fped.2021.814166
33. Krzystek-Korpacka M, Patryn E, Kustrzeba-Wojcicka I, Chrzanowska J, Gamian A, Noczynska A. The effect of a one-year weight reduction program on serum uric acid in overweight/obese children and adolescents. Clin Chem Lab Med. 2011;49(5):915–921. doi:10.1515/CCLM.2011.130
34. Weihrauch-Blüher S, Wiegand S, Weihe P, et al. Uric acid and gamma-glutamyl-transferase in children and adolescents with obesity: association to anthropometric measures and cardiometabolic risk markers depending on pubertal stage, sex, degree of weight loss and type of patient care: evaluation of the adiposity patient follow-up registry. Pediatr Obes. 2023;18(3):e12989. doi:10.1111/ijpo.12989
35. Yun M, Zhang T, Li S, et al. Temporal relationship between body mass index and uric acid and their joint impact on blood pressure in children and adults: the Bogalusa Heart Study. Int J Obes. 2021;45(7):1457–1463. doi:10.1038/s41366-021-00810-9
36. Luciano R, Shashaj B, Spreghini M, et al. Percentiles of serum uric acid and cardiometabolic abnormalities in obese Italian children and adolescents. Ital J Pediatr. 2017;43(1):3. doi:10.1186/s13052-016-0321-0
37. Krzystek-Korpacka M, Patryn E, Kustrzeba-Wojcicka I, Chrzanowska J, Gamian A, Noczynska A. Gender-specific association of serum uric acid with metabolic syndrome and its components in juvenile obesity. Clin Chem Lab Med. 2011;49(1):129–136. doi:10.1515/CCLM.2011.011
38. Tsouli SG, Liberopoulos EN, Mikhailidis DP, Athyros VG, Elisaf MS. Elevated serum uric acid levels in metabolic syndrome: an active component or an innocent bystander? Metabolism. 2006;55(10):1293–1301. doi:10.1016/j.metabol.2006.05.013
39. Özalp KD, Şen S, Ersoy B. Associations between serum uric acid concentrations and cardiometabolic risk and renal injury in obese and overweight children. J Clin Res Pediatr Endocrinol. 2019;11(3):262–269. doi:10.4274/jcrpe.galenos.2018.2019.0241
40. Wun YT, Chan CS, Lui CS. Hyperuricaemia in Type 2 diabetes mellitus. Diabetes Nutr Metab. 1999;12(4):286–291.
41. Hou X, Guan Y, Tang Y, et al. A correlation study of the relationships between nonalcoholic fatty liver disease and serum triglyceride concentration after an oral fat tolerance test. Lipids Health Dis. 2021;20(1):54. doi:10.1186/s12944-021-01483-z
42. Zhou X, Lin X, Chen J, et al. Clinical spectrum transition and prediction model of nonalcoholic fatty liver disease in children with obesity. Front Endocrinol. 2022;13:986841. doi:10.3389/fendo.2022.986841
43. Liang XJ, Gong CX, Liu Y, et al. Characteristics and related factors of type 2 diabetes mellitus with non-alcoholic fatty liver disease in children. Chin J Diabetes Mellitus. 2018;10:482–486.
44. Afzali A, Weiss NS, Boyko EJ, Ioannou GN. Association between serum uric acid level and chronic liver disease in the United States. Hepatology. 2010;52(2):578–589. doi:10.1002/hep.23717
45. Fathallah-Shaykh SA, Cramer MT. Uric acid and the kidney. Pediatr Nephrol. 2014;29(6):999–1008. doi:10.1007/s00467-013-2549-x
46. Viazzi F, Leoncini G, Ratto E, Pontremoli R. Hyperuricemia and renal risk. High Blood Press Cardiovasc Prev. 2014;21(3):189–194. doi:10.1007/s40292-014-0042-7
47. Yahyaoui R, Esteva I, Haro-Mora JJ, et al. Effect of long-term administration of cross-sex hormone therapy on serum and urinary uric acid in transsexual persons. J Clin Endocrinol Metab. 2008;93(6):2230–2233. doi:10.1210/jc.2007-2467
48. Harlan WR, Cornoni-Huntley J, Leaverton PE. Physiologic determinants of serum urate levels in adolescence. Pediatrics. 1979;63(4):569–575. doi:10.1542/peds.63.4.569
49. Dai C, Wang C, Xia F, et al. Age and gender-specific reference intervals for uric acid level in children aged 5–14 years in southeast Zhejiang province of china: hyperuricemia in children may need redefinition. Front Pediatr. 2021;9:560720. doi:10.3389/fped.2021.560720
50. Wells JC. Sexual dimorphism of body composition. Best Pract Res Clin Endocrinol Metab. 2007;21(3):415–430. doi:10.1016/j.beem.2007.04.007
 © 2024 The Author(s). This work is published and licensed by Dove Medical Press Limited. The
full terms of this license are available at https://www.dovepress.com/terms
and incorporate the Creative Commons Attribution
- Non Commercial (unported, 3.0) License.
By accessing the work you hereby accept the Terms. Non-commercial uses of the work are permitted
without any further permission from Dove Medical Press Limited, provided the work is properly
attributed. For permission for commercial use of this work, please see paragraphs 4.2 and 5 of our Terms.
© 2024 The Author(s). This work is published and licensed by Dove Medical Press Limited. The
full terms of this license are available at https://www.dovepress.com/terms
and incorporate the Creative Commons Attribution
- Non Commercial (unported, 3.0) License.
By accessing the work you hereby accept the Terms. Non-commercial uses of the work are permitted
without any further permission from Dove Medical Press Limited, provided the work is properly
attributed. For permission for commercial use of this work, please see paragraphs 4.2 and 5 of our Terms.