Back to Journals » Nature and Science of Sleep » Volume 17

A Cross-Sectional Study on the Relationship Between Urinary Enterolactone and Sleep Quality in American Obese Adults
Authors Xu Q ![]() , Huang Y, Chen X
, Huang Y, Chen X ![]() , Lin C
, Lin C
Received 8 July 2025
Accepted for publication 30 September 2025
Published 7 October 2025 Volume 2025:17 Pages 2529—2540
DOI https://doi.org/10.2147/NSS.S551821
Checked for plagiarism Yes
Review by Single anonymous peer review
Peer reviewer comments 3
Editor who approved publication: Prof. Dr. Ahmed BaHammam
Qiaoli Xu, Yisen Huang, Xinqi Chen, Chanchan Lin
Department of Gastroenterology, First Hospital of Quanzhou Affiliated to Fujian Medical University, Quanzhou, Fujian, People’s Republic of China
Correspondence: Qiaoli Xu, Department of Gastroenterology, First Hospital of Quanzhou Affiliated to Fujian Medical University, No. 248-252 East Street, Licheng District, Quanzhou, Fujian, 362000, People’s Republic of China, Email [email protected]
Objective: This study aimed to appraise the association between urinary enterolactone and sleep quality in American obese adults.
Methods: Our study analyzed data from 913 obese adults (2005– 2008) in the National Health and Nutrition Examination Survey (NHANES) database. Enterolactone was tested in urine specimens. The Pittsburgh Sleep Quality Index (PSQI)-like measure reconstructed for NHANES based on prior literature was used to assess sleep quality. Multivariable logistic regression models were used to calculate the associations between urinary enterolactone and sleep quality in American obese adults. We also carried out linear tests utilizing restricted cubic splines to investigate the dose-response relationship between urinary enterolactone and sleep quality. Furthermore, we conducted stratified and interaction analyses to determine whether this relationship remained consistent across various subgroups.
Results: A total of 913 obese participants were included in the analyses. After adjusting for potential confounding factors, each one-unit change in log-transformed urinary enterolactone was associated with 8% lower odds of poor sleep quality (OR=0.92, 95% CI: 0.85– 0.99, p=0.027). When urinary enterolactone was presented in tertiles, this inversely correlation became more significant with increasing levels of urinary enterolactone. Moreover, in stratified analyses, the relationship between urinary enterolactone and sleep quality persisted.
Conclusion: Urinary enterolactone, an indicator of gut microbiome health, is inversely associated with poor sleep quality in American obese adults.
Keywords: enterolactone, sleep duration, sleep quality, obesity, NHANES
Introduction
Obesity has became a significant public health challenge worldwide. According to the World Health Organization (WHO), in 2022, over 1 billion people globally are living with obesity.1 In the United States, over 60% of the population is classified as overweight or obese. The prevalence of obesity in the US has increased dramatically over the past few decades though it has recently begun to level off.
Obesity has profound impacts on human health, primarily through its adverse effects on metabolism, which can trigger a cascade of health issues, including insulin resistance,2 type 2 diabetes,3 non-alcoholic fatty liver disease, cardiovascular diseases, and various cancers.4
Additionally, according to relevant studies, obese individuals are more likely to experience poor sleep quality due to factors such as narrowed airways,5 abnormal hormone secretion,6 and elevated levels of inflammatory markers. Moreover, obese patients with poor sleep quality are also at increased risk of developing cardiovascular diseases, diabetes, hypertension, and cancer, as well as experiencing higher mortality rates. Therefore, it was urgently necessary to identify modifiable factors to improve sleep quality in obese patients.
Enterolactone, a lignan metabolite produced by the gut microbiota from dietary precursors such as flaxseed, has been the subject of increasing research due to its potential health benefits and associations with various diseases. Epidemiological studies have shown that higher serum or urinary levels of enterolactone are often linked to a reduced risk of hormone-dependent cancers,7 including breast,8 prostate, and colon cancers. For example, postmenopausal women with higher enterolignan levels have been found to have better survival rates in breast cancer,9,10 and dietary intake of lignan-rich foods like flaxseed had been associated with lower serum estrogen levels and reduced breast cancer risk.
In addition to its anticancer properties, enterolactone has demonstrated significant antioxidant and anti-inflammatory effects. These properties may contribute to its protective role against cardiovascular diseases. Studies have shown that high serum enterolactone levels are associated with reduced cardiovascular mortality11 and lower levels of inflammation biomarkers such as c-reactive protein.12 Enterolactone can also modulate lipid metabolism, potentially reducing the risk of hypercholesterolemia and atherosclerosis. And higher levels of urine enterolactone can significantly reduce the risk of hypertension.13
Current research has indicated that enterolactone is associated with sleep duration and may be beneficial in preventing both prolonged and very short sleep durations.11 However, there are currently no studies examining the relationship between enterolactone and sleep quality, particularly in obese populations. Clarifying the association between urinary enterolactone and sleep quality may provide potential targets for improving sleep quality in obese populations.
Therefore, in this study, we aim to assess whether urinary enterolactone is associated with sleep quality in a relatively large and nationally representative population of obese patients in the United States.
Materials and Methods
Data Sources
The National Health and Nutrition Survey (NHANES), carried out by the National Center for Health Statistics (NCHS), was a representative national study aimed at assessing the health and nutritional status of the noninstitutionalized population in the United States. Every two years, participants undergo random household interviews, physical examinations, and laboratory tests. The design, methods, and data of the survey were publicly available, with further details provided at https://www.cdc.gov/nchs/nhanes/irba98.htm. The NCHS ethics review board protocol number was Protocol#2005-06 and Continuation of Protocol#2005-06. Since this study was based on publicly available deidentified data and informed consent was waived, ethical approval and consent were not required, so the Ethics Review Committee of First Hospital of Quanzhou Affiliated to Fujian Medical University exempted the study.
Study Design and Population
This study employed publicly available data from NHANES spanning the years 2005 to 2008, ensuring that no personally identifiable information was included and that all relevant regulations and guidelines were followed. The analysis targeted participants aged 20 and older who completed the survey and satisfied the inclusion criteria. We excluded pregnant women and those with missing data on enterolactone, sleep and other covariates. Finally, a total of 913 obese participants (449 men and 469 women) with complete interview and examination data were included in the final analysis. Figure 1 shows the flowchart of the exclusion criteria.
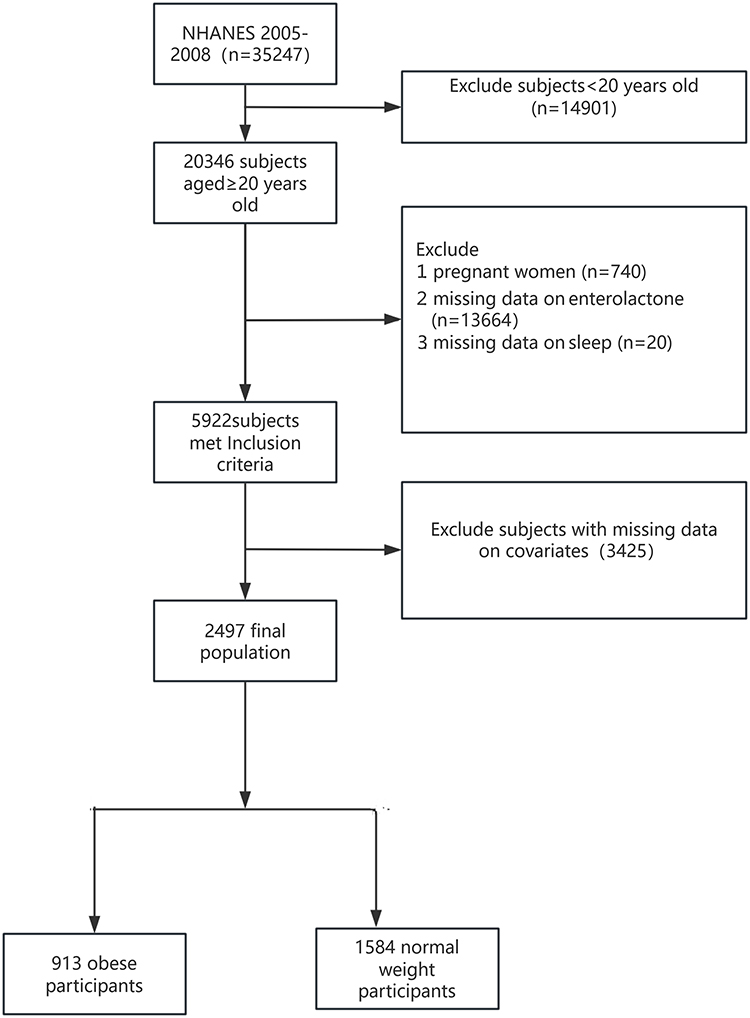 |
Figure 1 Flowchart of the study cohort. |
Measurement of Urinary Enterolactone
Urinary enterolactone levels were assessed by enzymatic deconjugation with solid-phase extraction and reverse-phase high-performance liquid chromatography Enterolactone measurements were reported in ng/mL and were transformed using the natural log for analytical purposes. Histogram of urinary enterolactone concentrations before and log-transformation can be seen in the Supplementary Material, Figures S1 and S2. Detailed information on the LOD handling, laboratory methodology, variable codes, and laboratory weights for urinary enterolactone was provided in the Supplementary Material.
Assessment of Sleep Quality
The PSQI-like measure reconstructed for NHANES based on prior literature was created to evaluate sleep quality and patterns in adolescents and adults.14 In NHANES 2005–2008, based on prior research,15 Eight self-reported items adapted from the publicly available questionnaires of the NHANES were used to construct the scoring system. By analyzing scores related to sleep latency, disturbances, and daytime dysfunction, sleep quality could be categorized as either “poor” or “good”. Sleep latency was assessed using the following two items: (a) “How long does it usually take you to fall asleep at bedtime (minutes)?” and (b) “In the past month, how often did you have trouble falling asleep?”. Daytime dysfunction was assessed using the following two items: (a) “In the past month, how often did you feel unrested during the day, no matter how many hours of sleep you had?” and (b) “In the past month, how often did you feel excessively or overly sleepy during the day?”. Sleep disturbances were measured using the following two items: (a) “In the past month, how often did you wake up during the night and have trouble getting back to sleep?” and (b) “In the past month, how often did you wake up early in the morning and was unable to get back to sleep?”. In general, the scoring system for the time required to fall asleep was divided into the following categories: ≤15 minutes (assigned a score of 0), 16–30 minutes (score of 1), 31–60 minutes (score of 2), and ≥60 minutes (score of 3). As for the other questions, the possible responses were categorized as follows: never (0 times a month, score of 0), rarely (1 time a month, score of 1), sometimes (2 to 4 times a month, score of 2), often (5 to 15 times a month, score of 3), and almost always (16 to 30 times a month, score of 4). The overall PSQI score, which ranges from 0 to 23, was calculated by adding up the scores from each individual component, including latency, disturbances, and daytime dysfunction. A score exceeding 5 was indicative of poor sleep quality, with higher values suggesting a greater degree of sleep impairment.
Obesity
Height and weight data were obtained by physical examination, from which the body mass index (BMI) was calculated. When BMI≥30 kg/m2, defined as obesity.16,17
Covariates
Referring to previous population-based studies,18,19 covariate data were collected via questionnaires, physical examinations, and laboratory tests sourced from the NHANES. These data encompassed key variables such as age, sex, family income, educational attainment, race and ethnicity, smoking status, alcohol consumption, physical activity levels, energy intake, BMI, hypertension, and diabetes. Specifically, race and ethnicity were categorized into several groups: non-Hispanic White, non-Hispanic Black, Mexican American, and other races. Educational attainment was categorized into three groups: high school or lower, some college, and college degree or above. Individuals who responded “yes” to the question “Have you had at least 12 alcoholic drinks or of any type of alcohol, in one year?” were identified as alcohol consumers. The presence of diabetes and hypertension was determined through self-reports, with binary variables used to indicate whether these conditions were present or absent. The 24-hour total energy intake was assessed via a dietary review interview. In line with the WHO analytical guidelines, physical activity (PA) was converted into metabolic equivalent (MET) minutes of moderate-to-vigorous PA per week.20 In the NHANES study, the duration of various types of physical activities was first translated into equivalent moderate-intensity exercise time. Following this, the level of physical activity (PA) was determined by applying the MET values corresponding to the type, frequency, and duration of each activity per week, using the following formula: PA (MET-min/week) = MET × times per week × duration of each PA.21 Where PA = 0 indicates no physical activity for the week.
Statistical Analysis
We used natural logarithmic transformation (ln) to create a normal distribution given that the urine enterolactone levels had an asymmetry distribution to the right. Histograms density plots for enterolactone, key percentiles, and characteristics before and after log transformation can be seen in supplementary material. The demographic characteristics of participants in this study were stratified according to tertiles of enterolactone levels. Normally distributed continuous variables were reported as mean ± standard deviation (mean ± SD) and analyzed using one-way ANOVA. Continuous variables with skewed distributions were presented as median (interquartile range) and evaluated using the Kruskal–Wallis H-test. Categorical or binary variables were displayed as absolute values (percentages) and compared using the chi-square test.
Logistic regression analysis was employed to determine the odds ratios (OR) and 95% confidence intervals (CI) in order to examine the association between urine enterolactone levels and sleep quality among American obese adults. Participants were categorized into three groups according to the tertiles of their urine enterolactone levels. Urinary enterolactone was assessed both as a continuous variable and as a categorical variable in the analysis. To account for potential confounding effects, we utilized three models to adjust for covariates. Model 1 controlled for sociodemographic factors, including sex, age, race and ethnicity, education level, and family poverty–income ratio (PIR). Model 2 additionally adjusted for lifestyle factors such as smoking status, alcohol consumption, physical activity, energy intake, and body mass index (BMI). Model 3 further accounted for underlying health conditions, specifically hypertension and diabetes. To explore the nature of the dose–response relationship between urinary enterolactone levels and sleep quality, we employed restricted cubic splines to assess linearity.
The smooth curve fitting graph was established and adjusted based on the covariables contained in model 3. Four knots (at the 5th, 35th, 65th, and 95th percentiles) of urine enterolactone levels distribution were used. Additionally, we used logistic regression models for interaction and subgroup analysis based on age, gender, race and ethnicity, education level, family income, smoking status, alcohol drinking status, physical activity, energy intake, BMI, hypertension, diabetes.
All analyses were performed using the statistical software packages R 4.2.2 and Free Statistics software version 1.9.2. A descriptive study was conducted on all participants. A P value of <0.05 indicated significance by two-tailed testing.
Sensitivity Analysis
To verify the stability of the research results, first, we used multiple imputation to analyze the missing covariates and then conducted a sensitivity analysis. We created and analyzed three datasets together.
Following the NHANES analytic guidelines, we incorporated the complex sampling design and the Mobile Examination Center (MEC) exam sample weights into our analyses, detailed weighting procedures were provided in the Supplementary Material. Specifically, logistic regression models fitted with weighted data were used to examine the relationship between urinary enterolactone and sleep quality in the obese population.
Moreover, we also provided effect sizes per doubling of exposure and per IQR increment to facilitate cross-study comparison.
Results
Participants and Demographic Characteristics
A total of 913 patients were included in the analysis. Table 1 presents the clinical and biochemical features of the study population based on urine enterolactone levels. Participants’ mean age ± SD was 50.0± 16.7 years, 449 (49.2%) were men, and most of them were self reported as non-Hispanic white 415, 45.5%). At baseline, individuals with higher levels of urinary enterolactone were more likely to be older, had higher family income, and possess better sleep quality.
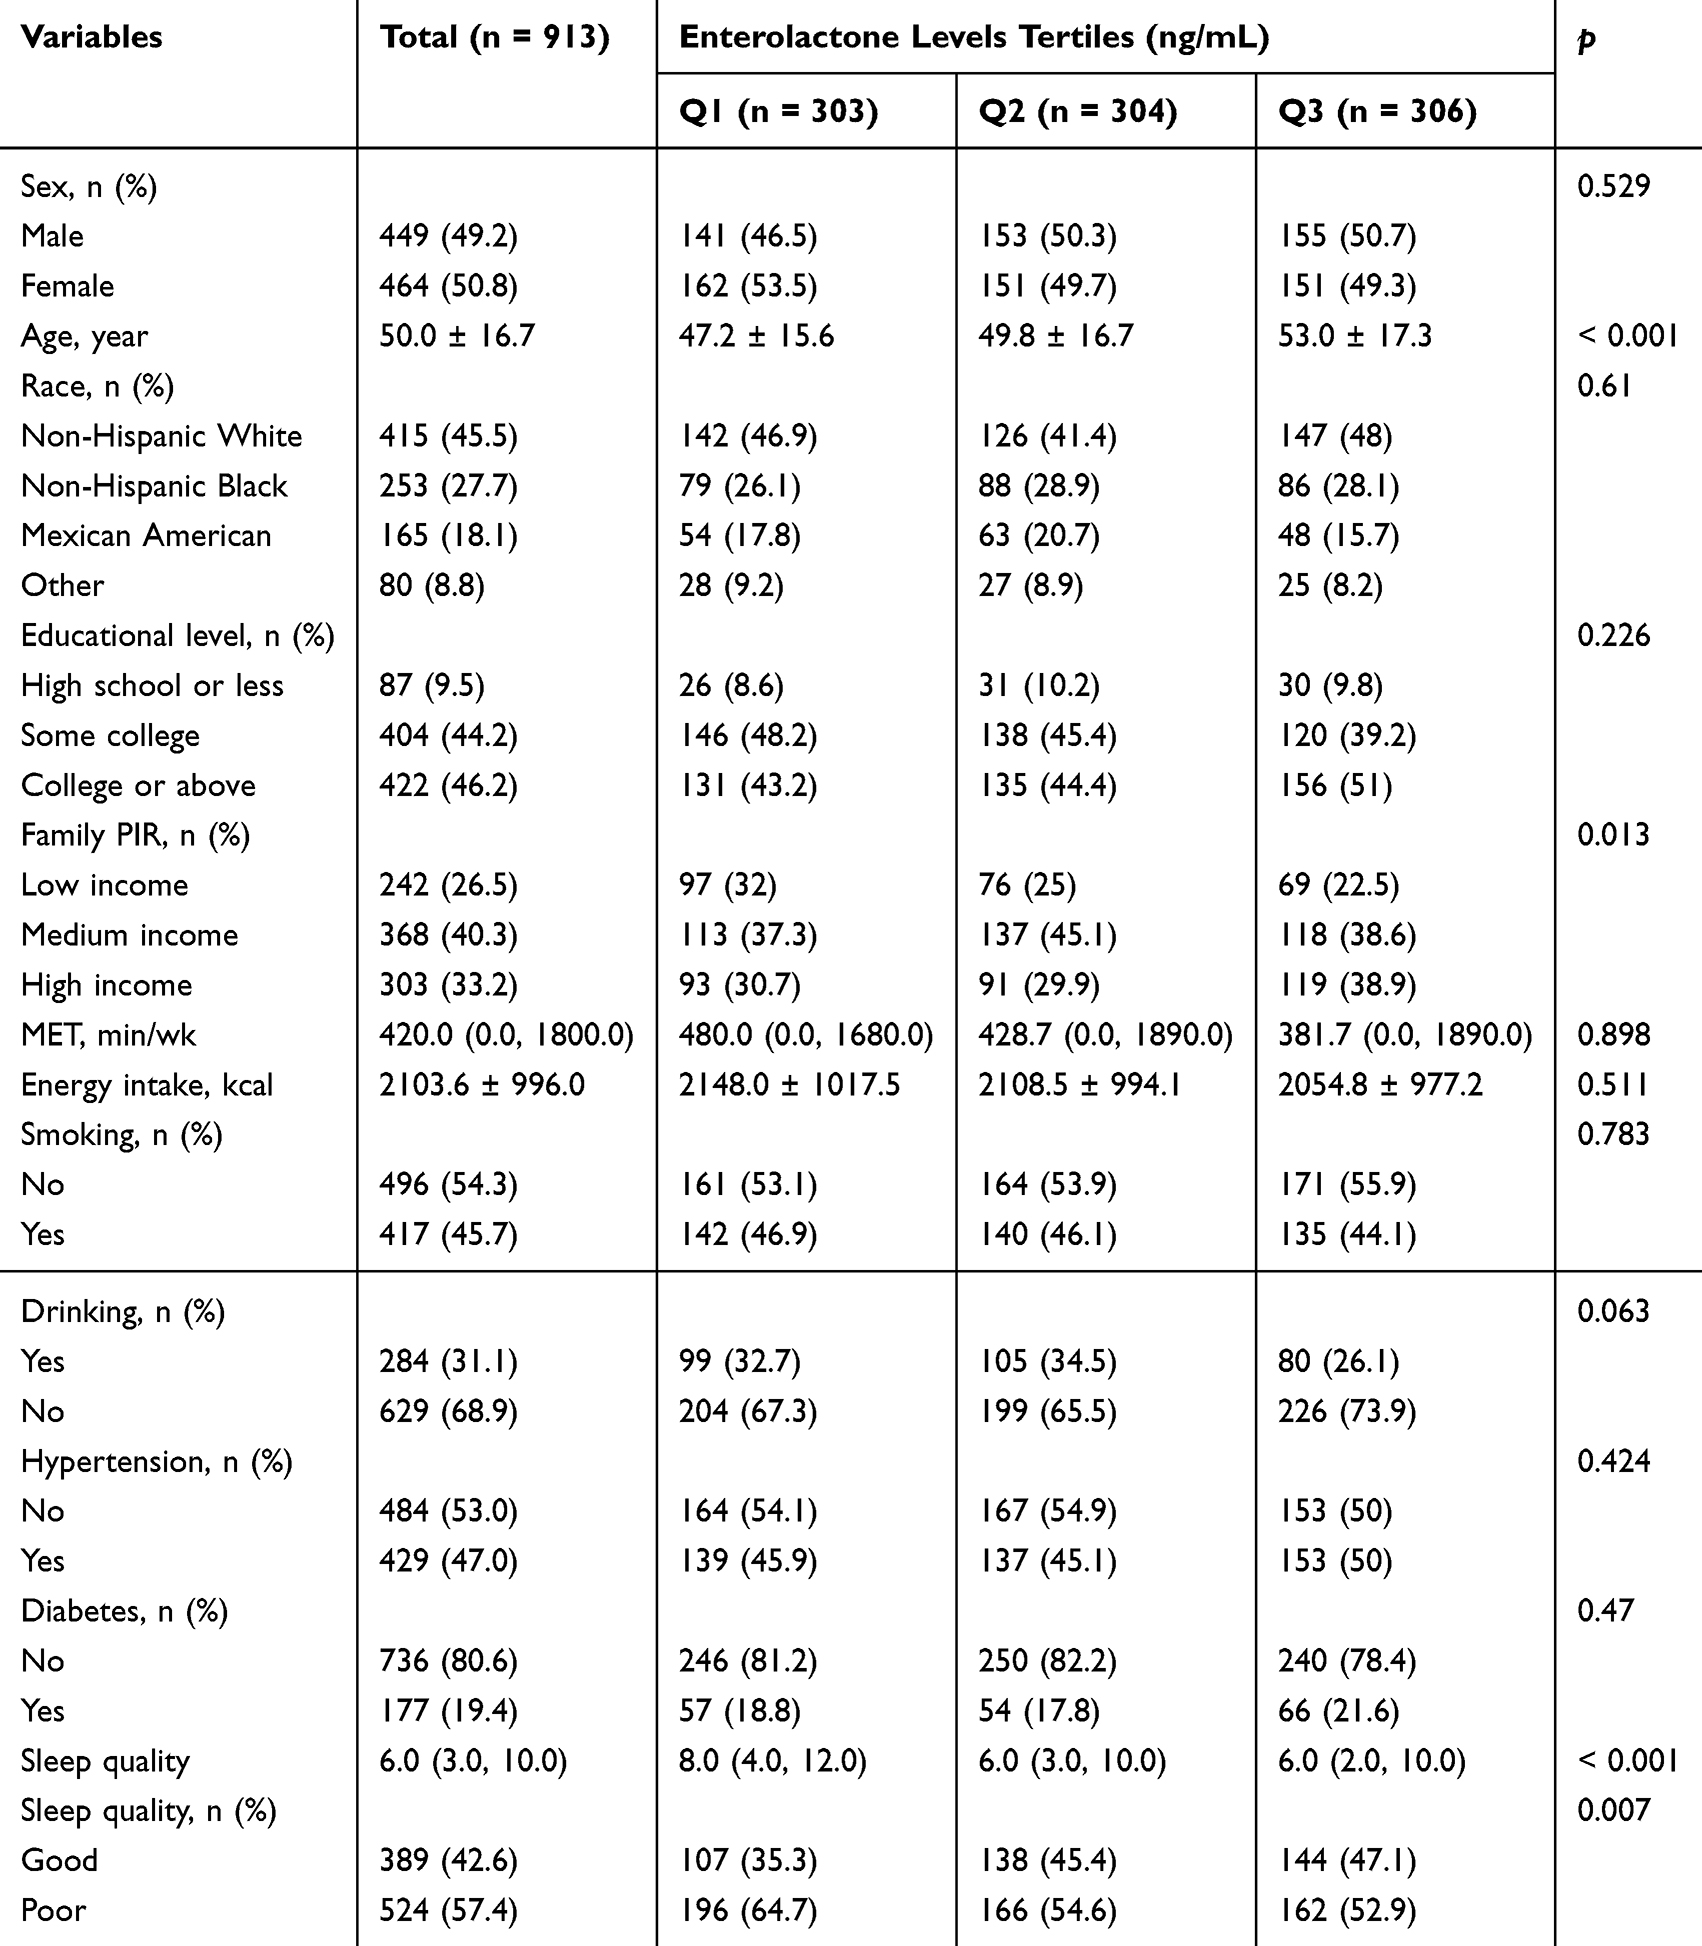 |
Table 1 Baseline Characteristics of the Study Participants |
The Association of Enterolactone with Sleep Quality
The results of the multivariable logistic regression analysis on the relationship between urinary enterolactone and sleep quality were presented in Table 2. The level of urinary enterolactone was negatively correlated with poor sleep quality. The correlation between urinary enterolactone and sleep quality was the strongest. When the urinary enterolactone was analyzed as a continuous variable, it was found that in the unadjusted crude model (OR: 0.9, 95% CI: 0.84–0.97, P=0.007), there was a significant independent negative correlation between urinary enterolactone and poor sleep quality. After adjusting for potential confounding factors, each one-unit change in log-transformed enterolactone was associated with 8% lower odds of poor sleep quality (OR=0.92, 95% CI: 0.85–0.99, P=0.027). Additionally, we performed FDR correction using the Benjamini–Hochberg method across the model comparisons at an FDR threshold of 0.05. After correction, all models exhibited q-values <0.05, the q-value represents the p-value after FDR-adjusted. When enterolactone was presented in tertiles, this inversely correlation became more significant with increasing levels of enterolactone. It was found that compared to the lowest tertile, higher levels of enterolactone were associated with a less likelihood of poor sleep quality (OR=0.61, 95% CI: 0.44–0.85, P=0.004). In the fully adjusted model 3 (adjusted for age, sex, race and ethnicity, education level, family income, smoking status, alcohol drinking status, physical activity, energy intake, BMI, hypertension, diabetes), individuals with higher levels of enterolactone had a 36% decreased risk of poor sleep quality compared to minimum level of enterolactone.
 |
Table 2 Associations Between Urinary Enterolactone and Sleep Quality in the Multiple Logistic Regression Model |
Additionally, in the supplementary materials, we have fully considered the impact of mental health status and sleep apnea on sleep, and made corresponding adjustments. The results indicate that the relationship between urinary enterolactone and sleep quality remains consistent (Table S1).
The RCS results showed that after adjusting for all potential confounding factors, we observed a linear relationship between urinary enterolactone and sleep quality (P for non-linearity=0.544, Figure 2).
 |
Figure 2 Linear dose–response relationship between urinary enterolactone and sleep quality. Adjustment factors included age, sex, race and ethnicity, education level, family income, smoking status, alcohol drinking status, physical activity, energy intake, BMI, hypertension, diabetes. The red line and pink area represent the estimated values and their corresponding 95% confidence intervals, respectively. Abbreviation: URXTEL, urinary enterolactone. |
Additionally, we conducted stratified and interaction analyses to determine whether the relationship between urinary enterolactone and the prevalence of poor sleep quality was consistent across several subgroups (Figure 3). Stratified analyses were performed by age, sex, race and ethnicity, smoking status, alcohol consumption, hypertension, and diabetes, and the results were consistent. Furthermore, there were noteworthy interplays among distinct subsets of the indicators. For instance, a more pronounced inverse association was observed between urinary enterolactone and poor sleep quality in people who suffered from hypertension.
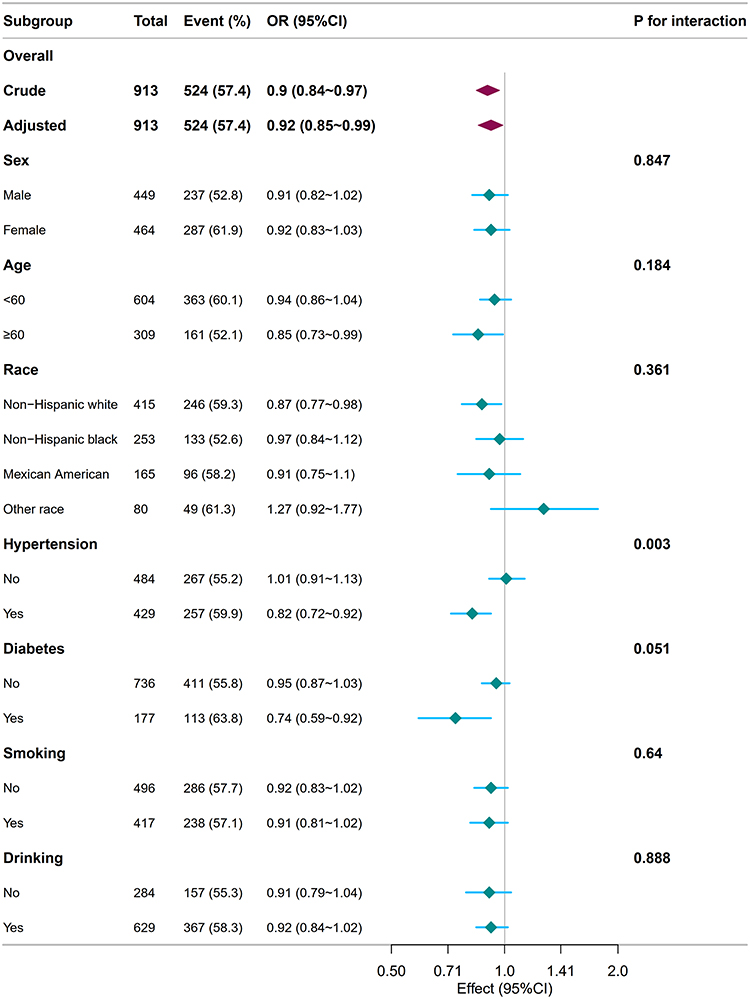 |
Figure 3 Associations between urinary enterolactone and sleep quality in different subgroups. Except for the stratification component itself, each stratification factor was adjusted for age, sex, race and ethnicity, education level, family income, smoking status, alcohol drinking status, physical activity, energy intake, BMI, hypertension, diabetes. Bold values are to emphasize the title. |
Sensitivity Analysis
Several sensitivity analyses were conducted to validate the robustness of the results. First, after analyzing the missing data using multiple imputation, we found that even after adjusting for potential covariates (in the fully adjusted model), the relationship between urinary enterolactone and sleep quality remained stable (see supplementary materials, Table S3).
In Supplementary Table S4, weighted analysis showed that urinary enterolactone was inversely associated with poor sleep quality (OR=0.91, 95% CI: 0.83–1.00, P=0.043).
As shown in Supplementary Tables S5 and S6, the association between urinary enterolactone and sleep quality remained consistent whether the exposure was modeled as a doubling or as per-IQR increment.
Discussion
Sleep quality is a fundamental aspect of human health that affects physical, mental, and emotional well-being. Recent studies have demonstrated that individuals with obesity were more likely to encounter diminished sleep quality and face a greater risk of developing health issues such as diabetes, cardiovascular disease, and cancer, which in turn could elevate the risk of death. As a result, a growing number of research endeavors are focusing on uncovering the pathways and mechanisms that influence sleep quality, with the aim of identifying ways to enhance sleep quality among obese individuals.
As far as we know, this study is the first to assess the relationship between individual urinary enterolactone concentrations and sleep quality among obese adults in the United States. Based on the data from NHANES 2005–2008, this study find that urinary enterolactone concentrations are linearly and negatively correlated with the risk of poor sleep quality. After adjusting for potential confounding factors, each one-unit change in log-transformed enterolactone is associated with 8% lower odds of poor sleep quality (OR=0.92; 95% CI: 0.85, 0.99; p=0.027). When enterolactone is presented in tertiles, this inversely correlation become more significant with increasing levels of enterolactone. Moreover, our study find that the relationship between urinary enterolactone and sleep quality was more pronounced in hypertensive individuals. Based on relevant literature, we propose the following possible conjectures and hypotheses. Part of the reason may be that hypertension selectively amplifies the pathophysiological circuits that enterolactone uniquely modulates. Chronic activation of the renin–angiotensin–aldosterone system and heightened sympathetic tone produce nocturnal micro-arousals and sleep fragmentation,22,23 enterolactone attenuates this axis by down-regulating renin release and reducing central sympathetic output. In addition, hypertension-associated endothelial dysfunction lowers cerebral nitric-oxide bioavailability, further disrupting sleep continuity, enterolactone restores eNOS activity and improves microvascular perfusion.24 Moreover, the lignan’s antioxidant and NF-κB–inhibiting properties suppress hypertension-driven oxidative stress and neuro-inflammation (elevated IL-6 and CRP).25 Mild renal impairment in hypertensive patients slows enterolactone clearance, yielding higher urinary concentrations and a steeper dose–response curve. Collectively, these hypertension-specific alterations concentrate the determinants of sleep disturbance onto pathways that enterolactone can effectively target, making the exposure–outcome relationship more evident than in normotensive populations. Of course, this modifying effect needs to be further confirmed by additional studies.
The potential mechanisms underlying the association between enterolactone and sleep were not yet clear. Based on previous relevant literature, we consider that the following possible pathways may account for this observation. First of all, enterolactone may affect the synthesis and secretion of neurotransmitters such as serotonin, gamma-aminobutyric acid (GABA), and melatonin by regulating the metabolic activities of the gut microbiota.26–28 These neurotransmitters play a vital role in regulating the sleep-wake cycle. For example, serotonin is the precursor of melatonin, which is directly involved in regulating the circadian rhythm and promoting sleep. Moreover, enterolactone have a structure similar to that of estrogen and could bind to estrogen receptors to produce both estrogenic and anti-estrogenic effects.29 This may affect the sleep-wake cycle and could also explain the differences in the relationship between individual phytoestrogens and quality.30,31 Phytoestrogens and their human metabolites show distinct agonistic and antagonistic properties on estrogen receptor alpha (ERalpha) and ERbeta in human cells. Additionally, enterolactone has antioxidant and anti-inflammatory properties that can reduce the production of inflammatory factors, thereby improving sleep quality.25,32 For example, elevated levels of inflammatory factors such as interleukin-6 (IL-6) and tumor necrosis factor-alpha (TNF-α)25 are closely associated with decreased sleep quality. Finally, the synthesis of enterolactone relies on the metabolic activities of the gut microbiota.33 A healthy gut microbiota can promote the production of enterolactone, which in turn may further affect sleep quality by modulating the composition and function of the gut microbiota. Nevertheless, further studies are needed to substantiate these mechanisms.
In our previous studies,34 we found that unhealthy sleep patterns and shorter sleep durations were positively correlated with the occurrence of obesity. Unlike previous research, this study further explores the relationship between urinary enterolactone and sleep quality in obese populations, thereby helping us gain a deeper understanding of the mechanisms underlying the relationship between sleep and obesity. To our knowledge, this research mark the initial utilization of NHANES data to delve into the correlation between urinary enterolactone and sleep quality within the obese demographic. To begin with, a comprehensive adjustment of confounding factors is conducted to bolster the credibility of the results. In addition, the substantial sample size enabled stratified analyses, which in turn enhanced the robustness of the study. Furthermore, the PSQI scale is employed in this paper to assess sleep quality, thereby rendering the conclusions more objective and precise. Though, our study find that each log-unit increase in urinary enterolactone is associated with an 8% relative reduction in poor sleep quality, a result that is statistically significant yet whose clinical value must be interpreted in context. At a population sleep-disturbance prevalence of about 6%, this correspond to an absolute risk reduction of roughly 0.5%, that is modest for an individual, but potentially of major public-health importance if dietary lignan intake can be raised easily and safely. Compared with other modifiable predictors such as pharmacotherapy, additional physical activity, or cognitive-behavioural therapy, the effect size of enterolactone is comparable or slightly smaller, however, it can be increased through simple dietary measures at virtually no cost and without adverse effects. Therefore, although the 8% estimate alone may not reach conventional minimal clinically important difference thresholds at the individual level, its safety, low implementation burden, and complementarity with more potent interventions made it a clinically reasonable adjunct for primary prevention and for incorporation into multicomponent lifestyle programmes aimed at improving sleep quality.
According to our findings, we identify a turning point at 2.336 log-unit of urinary enterolactone, above this threshold, the risk of poor sleep quality plateaus at a progressively lower level (see supplementary material Table S2). We therefore consider this concentration to be potentially beneficial for sleep health, and it can be achieved by increasing habitual intake of lignan-rich foods—flaxseed, sesame, oats, berries. Importantly, this is not an open-ended invitation to consume ever-larger quantities of these foods, individual tolerance must be carefully respected to avoid gastrointestinal or other adverse effects.
Nevertheless, this study is not without its limitations. The restricted choice of data cycle may limit the generalizability of our findings. Given that this study adopted a cross-sectional design, it is not feasible to ascertain a causal link, therefore, we cannot establish directionality in the association between enterolactone and sleep quality, especially given the potential bidirectional relationship between sleep and gut health. Subsequent longitudinal intervention studies are imperative to corroborate these preliminary observations. Additionally, even though we meticulously adjusted for numerous potential confounders, the possibility of unmeasured confounders still exists, which can potentially sway the results. Thus, there is a necessity for future multicenter cohort studies to corroborate these results by incorporating additional potential confounding variables and employing standardized and uniform measurement methods. Moreover, The modified Pittsburgh Sleep Quality Index based on NHANES items used in this article may miss some sleep indicators, and required further validation of its validity and reliability in populations with obesity. Then enterolactone is measured only once, and our paper do not adequately consider dietary intake patterns or food-frequency data, and thus cannot clearly explain the biological relevance of urinary enterolactone levels. In future research, more fundamental, mechanism-oriented investigations and studies in broader populations are warranted to further clarify the link between urinary enterolactone and sleep quality.
Conclusion
Among obese adults, we have observed an inverse association between urinary enterolactone and poor sleep quality. Prospective cohorts and intervention studies are needed for confirmation in future.
Data Sharing Statement
NHANES data used in this work are publicly available. All raw data are available on the NHANES website (https://www.cdc.gov/nchs/nhanes/). Further inquiries can be directed to the corresponding author.
Ethics Approval and Consent to Participate
Our study was granted exemption from full ethical review by the First Hospital of Quanzhou Affiliated to Fujian Medical University because it met the exemption criteria set out in the Ethical Review Methods for Life Science and Medical Research Involving Human Beings.
Acknowledgments
We thank the Free Statistics team for providing technical assistance and valuable tools for data analysis and visualization.
Author Contributions
QX: conceptualization, data curation, investigation, writing – original draft. YH: data curation, formal analysis, Writing – review & editing. XC: investigation, writing – original draft. CL: investigation, formal analysis, writing – original draft. All authors have read and approved this paper. All authors gave final approval of the version to be published; have agreed on the journal to which the article has been submitted; and agree to be accountable for all aspects of the work.
Funding
This research received no external funding.
Disclosure
The authors declare no conflicts of interest.
References
1. Apovian CM. Obesity: definition, comorbidities, causes, and burden. Am J Manag Care. 2016;22(7):s176–85.
2. Reutrakul S, Van Cauter E. Sleep influences on obesity, insulin resistance, and risk of type 2 diabetes. Metabolism. 2018;84:56–66. doi:10.1016/j.metabol.2018.02.010
3. Piché ME, Tchernof A, Després JP. Obesity phenotypes, diabetes, and cardiovascular diseases. Circ Res. 2020;126(11):1477–1500. doi:10.1161/CIRCRESAHA.120.316101
4. Avgerinos KI, Spyrou N, Mantzoros CS, Dalamaga M. Obesity and cancer risk: emerging biological mechanisms and perspectives. Metabolism. 2019;92:121–135. doi:10.1016/j.metabol.2018.11.001
5. Meurling IJ, Shea DO, Garvey JF. Obesity and sleep: a growing concern. Curr Opin Pulm Med. 2019;25(6):602–608. doi:10.1097/MCP.0000000000000627
6. St-Onge MP. Sleep–obesity relation: underlying mechanisms and consequences for treatment. Obesity Rev. 2017;18(S1):34–39. doi:10.1111/obr.12499
7. Mali AV, Padhye SB, Anant S, Hegde MV, Kadam SS. Anticancer and antimetastatic potential of enterolactone: clinical, preclinical and mechanistic perspectives. Eur J Pharmacol. 2019;852:107–124. doi:10.1016/j.ejphar.2019.02.022
8. Xiong XY, Hu XJ, Li Y, Liu CM. Inhibitory effects of enterolactone on growth and metastasis in human breast cancer. Nutr Cancer. 2015;67(8):1326–1334. doi:10.1080/01635581.2015.1082113
9. Seibold P, Vrieling A, Johnson TS, et al. Enterolactone concentrations and prognosis after postmenopausal breast cancer: assessment of effect modification and meta‐analysis. Int J Cancer. 2014;135(4):923–933. doi:10.1002/ijc.28729
10. Buck K, Vrieling A, Zaineddin AK, et al. Serum enterolactone and prognosis of postmenopausal breast cancer. JCO. 2011;29(28):3730–3738. doi:10.1200/JCO.2011.34.6478
11. Sun J, Jiang H, Wang W, Dong X, Zhang D. Associations of urinary phytoestrogen concentrations with sleep disorders and sleep duration among adults. Nutrients. 2020;12(7):2103. doi:10.3390/nu12072103
12. Reger MK, Zollinger TW, Liu Z, Jones J, Zhang J. Association between urinary phytoestrogens and C-reactive protein in the continuous national health and nutrition examination survey. J Am Coll Nutr. 2017;36(6):434–441. doi:10.1080/07315724.2017.1318722
13. Weiner CM, Khan SE, Leong C, et al. Association of enterolactone with blood pressure and hypertension risk in NHANES. PLoS One. 2024;19(5):e0302254. doi:10.1371/journal.pone.0302254
14. Buysse DJ, Reynolds CF, Monk TH, Berman SR, Kupfer DJ. The Pittsburgh sleep quality index: a new instrument for psychiatric practice and research. Psychiatry Res. 1989;28(2):193–213. doi:10.1016/0165-1781(89)90047-4
15. Wang L, Sun M, Guo Y, et al. The role of dietary inflammatory index on the association between sleep quality and long-term cardiovascular risk: a mediation analysis based on NHANES (2005–2008). NSS. 2022;14:483–492. doi:10.2147/NSS.S357848
16. Safaei M, Sundararajan EA, Driss M, Boulila W, Shapi’i A. A systematic literature review on obesity: understanding the causes & consequences of obesity and reviewing various machine learning approaches used to predict obesity. Comput Biol Med. 2021;136:104754. doi:10.1016/j.compbiomed.2021.104754
17. Mercy UC, Elenwa F, Ogunsola AS, Eniola OA, Yunusa I, Karaye IM. Sex differences in the association between short sleep duration and obesity among US adults: findings from NHANES, 2015–2020. Sleep Med. 2022;92:59–63. doi:10.1016/j.sleep.2022.03.004
18. You Y, Zheng K, Ablitip A, et al. Life’s essential 8 and depression: a national cross-sectional analysis in US emerging adults. J Adolesc Health. 2025;77(1):84–93. doi:10.1016/j.jadohealth.2025.03.023
19. You Y, Chen Y, Ding H, et al. Relationship between physical activity and DNA methylation-predicted epigenetic clocks. NPJ Aging. 2025;11(1):27. doi:10.1038/s41514-025-00217-0
20. Bull FC, Maslin TS, Armstrong T. Global Physical Activity Questionnaire (GPAQ): nine country reliability and validity study. J Phys Act Health. 2009;6(6):790–804. doi:10.1123/jpah.6.6.790
21. Liang J, Huang S, Jiang N, et al. Association between joint physical activity and dietary quality and lower risk of depression symptoms in US adults: cross-sectional NHANES Study. JMIR Public Health Surveill. 2023;9:e45776. doi:10.2196/45776
22. Gottlieb DJ, Punjabi NM. Diagnosis and management of obstructive sleep apnea: a review. JAMA. 2020;323(14):1389. doi:10.1001/jama.2020.3514
23. Loh HH, Lim QH, Chai CS, et al. Influence and implications of the renin–angiotensin–aldosterone system in obstructive sleep apnea: an updated systematic review and meta‐analysis. J Sleep Res. 2023;32(1):e13726. doi:10.1111/jsr.13726
24. Wang B, Yan B, Song D, Ye X, Liu SF. Chronic intermittent hypoxia down-regulates endothelial nitric oxide synthase expression by an NF-κB-dependent mechanism. Sleep Med. 2013;14(2):165–171. doi:10.1016/j.sleep.2012.10.020
25. Almousa AA, Meurens F, Krol ES, Alcorn J. Linoorbitides and enterolactone mitigate inflammation-induced oxidative stress and loss of intestinal epithelial barrier integrity. Int Immunopharmacol. 2018;64:42–51. doi:10.1016/j.intimp.2018.08.012
26. Senizza A, Rocchetti G, Mosele JI, et al. Lignans and gut microbiota: an interplay revealing potential health implications. Molecules. 2020;25(23):5709. doi:10.3390/molecules25235709
27. Miles FL, Navarro SL, Schwarz Y, et al. Plasma metabolite abundances are associated with urinary enterolactone excretion in healthy participants on controlled diets. Food Funct. 2017;8(9):3209–3218. doi:10.1039/C7FO00684E
28. Sejbuk M, Siebieszuk A, Witkowska AM. The role of gut microbiome in sleep quality and health: dietary strategies for microbiota support. Nutrients. 2024;16(14):2259. doi:10.3390/nu16142259
29. Wang LQ. Mammalian phytoestrogens: enterodiol and enterolactone. J Chromatogr B. 2002;777(1–2):289–309. doi:10.1016/S1570-0232(02)00281-7
30. Wiklund I, Karlberg J, Mattsson LÅ. Quality of life of postmenopausal women on a regimen of transdermal estradiol therapy: a double-blind placebo-controlled study. Am J Clin Exp Obstet Gynecol. 1993;168(3):824–830. doi:10.1016/S0002-9378(12)90828-5
31. Ensrud KE, Guthrie KA, Hohensee C, et al. Effects of estradiol and venlafaxine on insomnia symptoms and sleep quality in women with hot flashes. Sleep. 2015;38(1):97–108. doi:10.5665/sleep.4332
32. Zhang Q, Ta N, Zhang J, Liu X, Ding H, Zhang X. Nettle supplementation improves antioxidant status and modulates inflammatory response by altering lysophosphatidylcholines and enterolactone metabolism in dairy cows. Anim Nutr. 2025;21:279–291. doi:10.1016/j.aninu.2025.01.006
33. Baldi S, Tristán Asensi M, Pallecchi M, Sofi F, Bartolucci G, Amedei A. Interplay between Lignans and gut microbiota: nutritional, functional and methodological aspects. Molecules. 2023;28(1):343. doi:10.3390/molecules28010343
34. Xu Q, Lin Z, Chen Y, Huang M. Association between sleep duration and patterns and obesity: a cross-sectional study of the 2007–2018 national health and nutrition examination survey. BMC Public Health. 2025;25(1):1460. doi:10.1186/s12889-025-22433-9
 © 2025 The Author(s). This work is published and licensed by Dove Medical Press Limited. The
full terms of this license are available at https://www.dovepress.com/terms
and incorporate the Creative Commons Attribution
- Non Commercial (unported, 4.0) License.
By accessing the work you hereby accept the Terms. Non-commercial uses of the work are permitted
without any further permission from Dove Medical Press Limited, provided the work is properly
attributed. For permission for commercial use of this work, please see paragraphs 4.2 and 5 of our Terms.
© 2025 The Author(s). This work is published and licensed by Dove Medical Press Limited. The
full terms of this license are available at https://www.dovepress.com/terms
and incorporate the Creative Commons Attribution
- Non Commercial (unported, 4.0) License.
By accessing the work you hereby accept the Terms. Non-commercial uses of the work are permitted
without any further permission from Dove Medical Press Limited, provided the work is properly
attributed. For permission for commercial use of this work, please see paragraphs 4.2 and 5 of our Terms.
Recommended articles
Sleep Quality and Its Determinants Among Type 2 Diabetes Patients with Comorbid Metabolic Syndrome
Li Y, Buys N, Li L, Sun J
Diabetes, Metabolic Syndrome and Obesity 2022, 15:3469-3482
Published Date: 7 November 2022
The Association Between Short Sleep Duration and Metabolic Syndrome: A Case-Control Study
Elshoeibi AM, Akomolafe A, Al-Khulaifi A, Metwally O, Al-Khayarin R, Al Abiad AR, Al-Naemi L, Chivese T, Farooqui H
Diabetes, Metabolic Syndrome and Obesity 2023, 16:4157-4167
Published Date: 20 December 2023
Association Between Sleep Duration and Anxiety in US Adults: A Nationally Representative Cross-Sectional Study

Wang X, Zhong Y, Wang R, Zhang D, Li Y, Pan Y, Li Y
Psychology Research and Behavior Management 2025, 18:1155-1167
Published Date: 21 May 2025
Short Sleep Duration is Inversely Associated with the Prevalence of Underweight in a Young Japanese Population
Ishikawa S, Furukawa S, Miyake T, Yoshida O, Murakami Y, Kanamoto A, Miyazaki M, Shiomi A, Nakaguchi H, Saneto H, Marui K, Kokubu M, Numata Y, Koizumi M, Kato A, Kusumoto K, Kumagi T, Matsuura B, Hiasa Y
Nature and Science of Sleep 2025, 17:1459-1466
Published Date: 23 June 2025
Associations Between Sleep Duration, Sleep Quality, and Depressive Symptoms: Evidence from Medical Graduate Students in China
He H, Zeng Y, Chen Z, Wu M, Wang Y
Nature and Science of Sleep 2025, 17:1853-1862
Published Date: 16 August 2025