Back to Journals » Journal of Inflammation Research » Volume 17
A Cohort Study on the Correlation Between Serum Uric Acid Trajectory and New-Onset Hypertension Based on Longitudinal Health Examination Data in Henan Area
Authors Sheng S, Chen J ![]() , Zhang Y, Li W, Li F, Gou R, Tang L, Ding S
, Zhang Y, Li W, Li F, Gou R, Tang L, Ding S ![]()
Received 16 November 2023
Accepted for publication 16 February 2024
Published 27 February 2024 Volume 2024:17 Pages 1365—1375
DOI https://doi.org/10.2147/JIR.S446342
Checked for plagiarism Yes
Review by Single anonymous peer review
Peer reviewer comments 2
Editor who approved publication: Dr Adam Bachstetter
Shifeng Sheng,1 Jingfeng Chen,1 Yuheng Zhang,1 Weikang Li,1 Feifei Li,1 Rong Gou,2 Lin Tang,2 Suying Ding1
1Health Management Center, The First Affiliated Hospital of Zhengzhou University, Zhengzhou, People’s Republic of China; 2Department of Nephropathy, The First Affiliated Hospital of Zhengzhou University, Zhengzhou, People’s Republic of China
Correspondence: Lin Tang, Department of Nephropathy, The First Affiliated Hospital of Zhengzhou University, No. 1 Longhu Middle Ring Road, Jinshui District, Zhengzhou, 450052, People’s Republic of China, Tel +86 13783623040, Email [email protected] Suying Ding, Health Management Center, The First Affiliated Hospital of Zhengzhou University, No. 1 Longhu Middle Ring Road, Jinshui District, Zhengzhou, 450052, People’s Republic of China, Tel +86 15838023097, Email [email protected]
Objective: To explore the correlation between serum uric acid (SUA) trajectories and new-onset hypertension, to provide scientific basis for the prevention and treatment of hypertension.
Methods: The study cohort was composed of 4372 subjects who met the inclusion criteria in the cohort study of Henan physical examination population. According to the SUA values of the subjects’ physical examination from 2017 to 2019, three different SUA trajectory groups were determined by R LCTM tools, namely low stability group, medium stability group and high stability group. The incidence of hypertension during physical examination in 2020 was followed up, the cumulative incidence rate in each group was calculated by product limit method, and the correlation between different SUA trajectories and new-onset hypertension was analyzed by Cox proportional hazards regression model.
Results: The incidence rate of hypertension increased with the increase of SUA locus, which was 4.65%, 9.18% and 12.43% respectively, and the difference was statistically significant (P< 0.001). After adjusting multiple confounding factors, such as gender, waist circumference (WC), blood pressure, body mass index (BMI), fasting plasma glucose (FPG) and blood lipid by Cox proportional hazards regression model, the risk of hypertension in SUA medium stability and high stability group was still 1.476 times ( 95% CI: 1.089~2.000) and 1.692 times ( 95% CI: 1.152~2.484) of low-stable SUA group (P< 0.05).
Conclusion: The risk of hypertension increases with the increase of SUA level in the long-term normal range. It is necessary to carry out the intervention for hypertension with long-term normal high value to avoid the progress of hypertension disease, to achieve the purpose of early prevention of hypertension.
Keywords: uric acid, hypertension, trajectories, correlation, health physical examination
Introduction
Hypertension is one of the most common chronic diseases in the world. The prevalence rate of it increases with age, and it is also characterized by low awareness rate, treatment rate and control rate in China. The serious complications of hypertension mainly include cardiovascular and cerebrovascular diseases (such as stroke, coronary heart disease and heart failure), renal failure, etc., which may eventually lead to disability or death. Hypertension and its complications seriously threaten human life and health and have become a heavy burden for our families and society. A sampling survey on hypertension from 2012 to 2015 in China showed that the prevalence rate of hypertension among adults in China was about 27.9%, the number of patients was about 244.5 million, and the number of new cases was about 10 million each year.1 Therefore, prevention and control of hypertension has become one of the core strategies to prevent cardiovascular and cerebrovascular diseases in China.
Uric acid is the final product of purine catabolism in human body. With the development of our economy and the change of people’s lifestyle, the prevalence of hyperuricemia (HUA) has gradually increased to 13.3%, and gout is 1.1%.2 In the last years, the Uric Acid Right for Heart Health (URRAH) study3 found univocal prognostic cut-off values of SUA able to predict incidence of CV events,4 myocardial infarction,5 stroke6 and heart failure7 also in type-2 diabetic patients8 and in the aged.9 Studies have confirmed that uric acid can not only be used as an indicator to diagnose gout, but also as an endogenous danger signal to increase the aggregation of inflammatory factors, induce oxidative stress and apoptosis.10 Studies at home and abroad have shown that serum uric acid (SUA) level is closely related to the risk of hypertension,11–15 and the association between them is independent of genetic factors, age, and other traditional hypertension-related risk factors.13,16,17 The possible mechanism of uric acid-induced hypertension is not completely clear yet. The possible mechanism of raising blood pressure by serum uric acid may include stimulating the proliferation of vascular smooth muscle cells, causing vascular inflammation, damaging endothelial cells, causing insulin resistance, activating renin-angiotensin system, etc.18–22 However, most of the existing studies are based on single cross-sectional measurement data or animal experiments, and do not consider the long-term changes of SUA. Trajectory modeling is an analysis technology based on long-term longitudinal data, which can effectively overcome the limitations of single measurement data analysis. Therefore, based on the cohort study data of Henan physical examination population, this study used trajectory model to analyze the correlation between the long-term changes of SUA and new onset hypertension, providing a reference for the prevention and treatment of hypertension.
Materials and Methods
Study Population and Selection Criteria
A total of 7818 subjects (4975 males and 2843 females) who had undergone physical examination in the First Affiliated Hospital of Zhengzhou University for three consecutive years from January 2017 to December 2019 were selected retrospectively. Among them, 6526 subjects had no diagnosed history of hypertension, HUA and the blood pressure information was completed in previous three physical examinations. In 2020, the 6526 subjects were followed up during the fourth physical examination and signed an informed consent form. According to the diagnostic criteria of the Chinese Guidelines for the Prevention and Treatment of Hypertension (2018 Revision), hypertension was defined as without the use of antihypertensive drugs, the blood pressure in the clinic was measured three times on different days, systolic blood pressure (SBP) ≥ 140 mmHg and/or diastolic blood pressure (DBP) ≥ 90 mmHg.23 During the follow-up period, a total of 3446 cases were excluded due to various reasons, such as no physical examination or the miss of some information on the factors studied, severe cardiovascular and cerebrovascular diseases and malignant tumors, severe liver and kidney function damage, pregnancy, and those with large differences in blood pressure measured three times. Finally, 4372 cases were included in the statistical analysis, including 2502 males (57%), 1870 females (43%), age (46.27 ± 12.26) years, SUA locus grouping analysis was conducted based on the data of three consecutive physical examinations from 2017 to 2019. The flow diagram is shown in Figure 1.
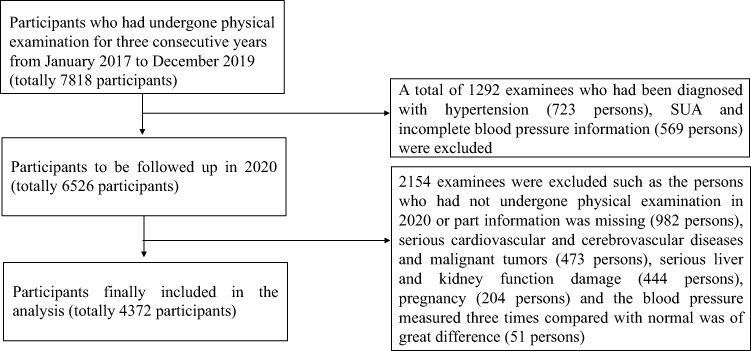 |
Figure 1 Flow of study population and selection criteria. |
Investigation Methods
(1) Epidemiological data investigation: The self-designed questionnaire on common chronic diseases and health influencing factors among physical examination population in Henan Province was used, and the face to face standardized questionnaire survey was conducted by professionals who had received unified training and assessment; (2) Data collection of physical examination and laboratory examination: the medical staff of the Health Management Center of the First Affiliated Hospital of Zhengzhou University measured the height, weight, blood pressure and other indicators of the examinees; Sampling of routine hematuria and biochemical indicators; (3) Quality control: formulate the unified guidelines for filling in epidemiological data questionnaires, uniformly train the medical staff and inspection and detection personnel in the health management center, and strictly implement the health examination procedures. Use the same type of inspection and testing equipment, instruments, and testing reagents, and unify the calibration, training, inspection and testing methods. The health examination quality control specialist will control the quality along with the batch.
Anthropometric Examinations
The participants took off his hat, barefoot, wore thin and light clothes, stood in a standing position. The height and weight were measured by a Height-Weight measuring gauge (Sonka, SK-X80, Shenzhen), and body mass index (BMI) was calculated as weight (Kg) divided by height (m) squared. When measuring the waist circumference (WC), keep the body upright, lower the arms naturally, relax abdomen and breathe steadily, circle the tape on a horizontal plane 1 cm above the navel, pay attention to the tape close to the skin, repeat the measurement for three times, and take the average value when the reading is accurate to 0.1 cm.
Blood Pressure Measurement
Before measuring the blood pressure, please empty the bladder and sit quietly for 5–10 minutes. Smoking, coffee, and tea are prohibited within 2 hours. The blood pressure was measured according to the requirements of the Chinese Guidelines for Blood Pressure Measurement.24 To ensure the examination room was of appropriate size and the environment was quiet and comfortable (room temperature was about 25 °C). The right upper arm brachial artery blood pressure was measured while sitting in a chair and placing the arm on the measuring table, and the subject was instructed to relax. The upper arm medical OMRON electronic sphygmomanometer (HBP-9021, Dalian) certified by the international standard was used. An appropriate cuff was selected and fixed it at about 2.5 cm above the elbow of the subject. The position of the air bag was at the same level of the right atrium. The air bag should wrap at least 80% of the upper arm. The tightness of the cuff should be such that one finger can be inserted. Measure 3 times continuously, with an interval of at least 1–2 min, and take the average as the final systolic blood pressure (SBP) and diastolic blood pressure (DBP).
Biochemical Indicators
Fasting venous blood was taken in the morning, and the Roche automatic biochemical analyzer cobas-8000 (Roche, Mannheim, Germany) was used to measure the following Biochemical indicators, such as fasting plasma glucose (FPG), glycated hemoglobin (HbA1c), total cholesterol (TC), Triglyceride (TG), low-density lipoprotein cholesterol (LDL-C), high-density lipoprotein cholesterol (HDL-C), serum uric acid (SUA), alanine aminotransferase (ALT), aspartate aminotransferase (AST), γ-Glutamyl transpeptidase (GGT), total bilirubin (TBIL), creatinine (Cre), estimated glomerular filtration rate (eGFR) and hemoglobin (Hb).
Statistical Method
SPSS 25.0 and R4.0.2 software was used for the statistical analysis. The R LCTM tools program (https://github.com/hlennon/LCTMtools) was applied to establish SUA potential category model of research object and conduct trajectory grouping.25 Firstly, the order of fixed effect, interaction effect and random effect was determined as 1, and the number of SUA trajectories to be selected was determined based on Bayesian Information Criterion (BIC) minimization principle; Then further determine the number of SUA track groups according to the average posterior probability assignment (APPA)>70% and the Odds of Correct Classification (OCC)>5.0; Finally, the final SUA track group number was determined on the basis of ensuring that the number of subjects in each group accounts for at least ≥5% of the total cases. Measurement data with normal distribution is expressed as mean differences ± standard deviation ( ), comparisons among groups were performed by one-way ANOVA along with pairwise comparisons, LSD test for equality of variances and Dunnett’s T3 test for unequal variances; The measurement data with skewed distribution was expressed in M (Q1, Q3), and the comparison was performed using nonparametric tests. Counting data were presented as percentage (%), and comparison of rates was performed by χ2 test. The cumulative incidence rate of new hypertension in each group was calculated by the product limit method (Kaplan Meier), and the difference of cumulative incidence rate of new hypertension in different SUA trajectories was compared by the Log rank test. Cox proportional hazard regression was used to analyze the incidence risk of new hypertension in different SUA trajectories. P<0.05 (bilateral test) was regarded as statistically significant.
Results
Determination of SUA Locus Grouping
The SUA locus grouping analysis was conducted based on the data of three consecutive physical examinations from 2017 to 2019. According to BIC, APPA, OCC and the criteria that the number of subjects in each group accounts for at least ≥5% of the total number of cases, three SUA track groups were finally determined, namely low stability group, medium stability group and high stability group. BIC is 145,404.5, APPA is 0.939 0.910 0.922 (APPA > 0.7), and OCC is 23.509 13.004 60.549 (OCC > 5). Low stability group (1743 cases, 39.87%): the average value of SUA fluctuated between 241.18 ~ 247.18 μmol/L and SUA locus remained stable; Medium stability group (1929 cases, 44.12%): the average value of SUA fluctuates between 337.89 ~ 345.73 μmol/L and SUA locus remained stable; High stability group (700 cases 16.01%): the average value of SUA fluctuated between 437.42 ~ 451.76 μmol/L and SUA locus remained stable (Figure 2).
 |
Figure 2 SUA trajectory grouping. |
Baseline Data of Different SUA Trajectory Groups
In this study, the first physical examination data in 2017 was taken as the baseline data. Totally 356 males (20%) and 1387 females (80%) were included in the low stability SUA group, 1474 males (76%) and 455 females (24%) in the medium stability SUA group, 675 males (96%) and 25 females (4%) in the high stability SUA group. Compared with the low stability group, WC, SBP, DBP, BMI, ALT, AST, GGT, Cre, TG, LDL-C and FPG in the medium stability group and the high stability group of SUA were significantly increased, eGFR and HDL-C were significantly decreased, with a statistically significant difference (P<0.001). Compared with the medium stability group of SUA, except for the same changes in the above clinical indicators, the TC in the highly stability group increased significantly and the age decreased, with a statistically significant difference (P<0.001, Table 1).
 |
Table 1 Comparison of Baseline Data of Different SUA Trajectories |
New Onset Hypertension in Different SUA Trajectory Groups
The average follow-up time in this study was (371.02 ± 34.71) days, including 158~636 days for low stability SUA group, 119~714 days for medium stability SUA group, and 168~542 days for high stability SUA group. At the end of the last follow-up, the incidence rate of new onset hypertension in the low stability group, the medium stability group and the high stability group of SUA were 4.65%, 9.18% and 12.43%, respectively, with a statistically significant difference (P < 0.001). The incidence rate of male in the three SUA trajectories group was 7.3%, 9.57% and 12.44% (P = 0.022), and female was 3.97%, 7.91% and 12% (P = 0.0001).
Single Factor Cox Proportional Risk Regression Analysis of the Risk of Hypertension
Whether hypertension occurs in the follow-up physical examination (no = 0, yes = 1) is the dependent variable, gender, age, WC and other influencing factors are the independent variables, the end date of health examination in 2019 is the follow-up starting point, and hypertension found in the follow-up physical examination in 2020 is the onset time point. The single factor Cox proportional risk regression analysis is used to analyze the risk of hypertension under each influencing factor. The results showed that sex, age, WC, BMI, Hb, ALT, AST, GGT, Cre, TG, LDL-C, FPG and HbA1c were the risk factors of hypertension, the risk ratio (HR) was >1 (P < 0.05), while HDL-C and eGFR were the protective factors of hypertension, HR < 1 (P < 0.001). TC was not a risk factor for hypertension (P > 0.05, Table 2).
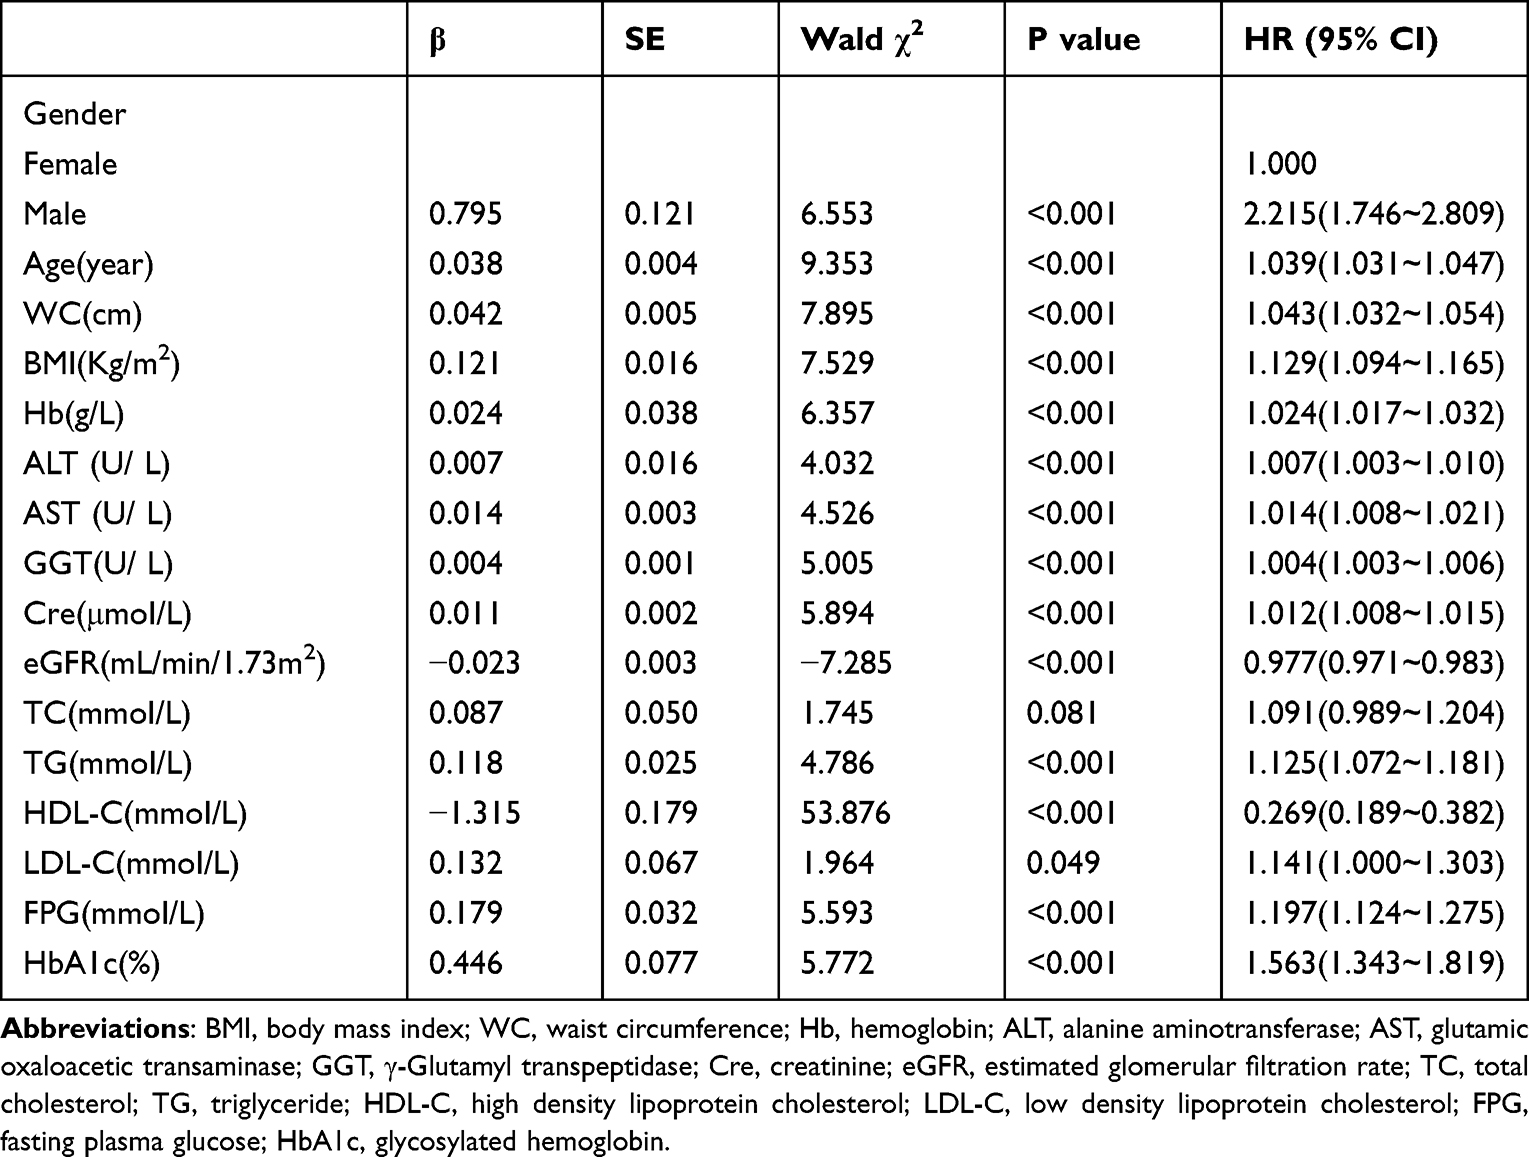 |
Table 2 Single Factor Cox Regression Results of Hypertension Risk |
Cox Proportional Risk Regression Analysis of Multiple Factors Affecting the Occurrence of Hypertension
Based on single factor Cox proportional risk regression, the multivariate Cox proportional risk regression analysis was used to analyze the incidence risk of hypertension in different SUA locus groups, taking the influential factors significantly related to the occurrence of hypertension in different SUA locus groups (low stability group as control group) as independent variables. Model l is a single factor Cox proportional risk regression analysis stratified according to the SUA locus and the risk of hypertension in the medium stability group and the high stability group is 2.196 times (95% CI: 1.688~2.858) and 2.790 times (95% CI: 2.060~3.777) of the low stability group. In model 2, after adjusting age and gender, the risk of hypertension in the medium stability group and the high stability group was 1.654 times (95% CI: 1.225–2.234) and 2.112 times (95% CI: 1.475–3.023) of the low stability group. In model 3, after adjusting age, sex, WC and BMI, the risk of hypertension in the medium stability group and the high stability group was 1.494 times (95% CI: 1.107~2.018) and 1.739 times (95% CI: 1.203~2.511) of the low stability group. In model 4, after further adjusting Hb, ALT, AST, GGT, eGFR, Cre, TG, HDL-C, LDL-C, FPG and HbA1c based on model 3, the risk of hypertension in medium stability group and high stability group is 1.476 times (95% CI: 1.089~2.000) and 1.692 times (95% CI: 1.152~2.484) compared with that of low stability group, as shown in Table 3 and Figure 3.
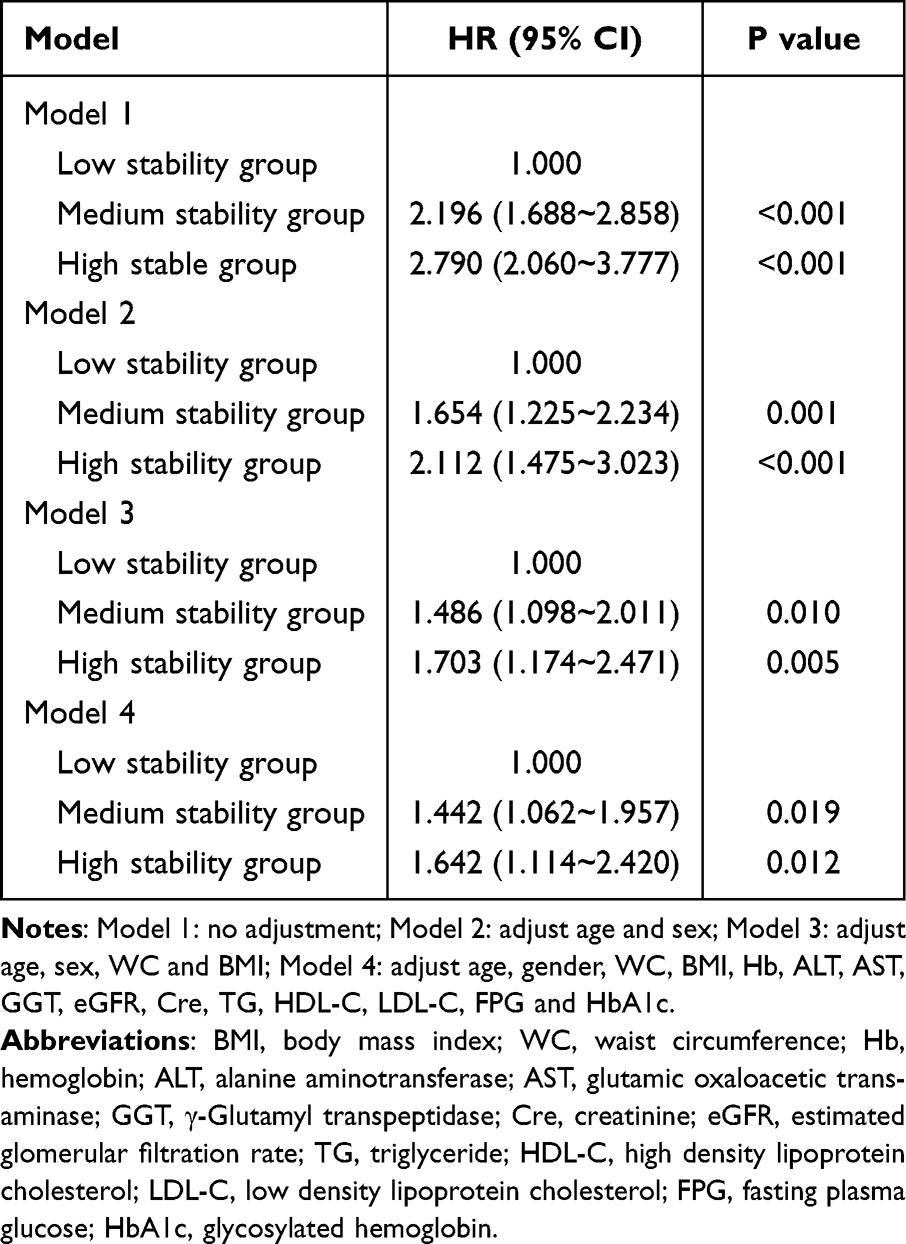 |
Table 3 Risk Model of Hypertension in Different SUA Trajectories |
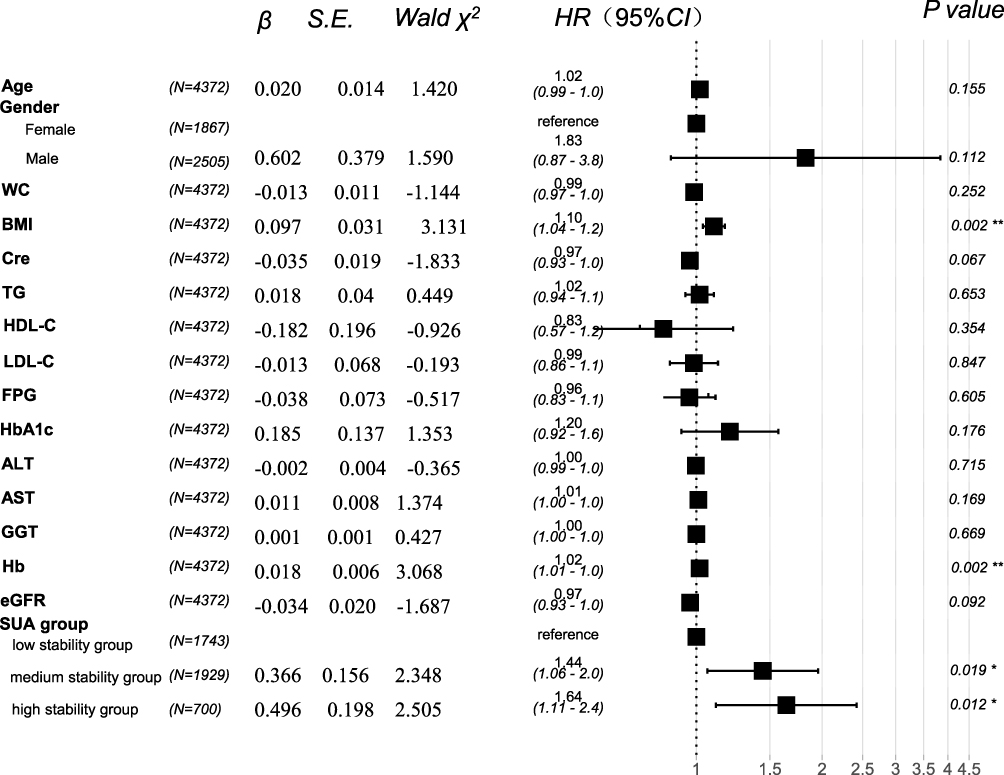 |
Figure 3 Multifactor COX proportional risk regression analysis. Abbreviations: SE, standard error; Wald χ2, Wald chi-squared value; HR, hazard ratio; CI, confidence interval; BMI, body mass index; WC, waist circumference; Hb, hemoglobin; ALT, alanine aminotransferase; AST, glutamic oxaloacetic transaminase; GGT, γ-Glutamyl transpeptidase; Cre, creatinine; eGFR, estimated glomerular filtration rate; TG, triglyceride; HDL-C, high density lipoprotein cholesterol; LDL-C, low density lipoprotein cholesterol; FPG, fasting plasma glucose; HbA1c, glycosylated hemoglobin; SUA, serum uric acid. Notes: *or**asterisk represented P value <0.05 or 0.01 respectively; β: regression coefficient. |
Discussion
Through the follow-up for (371.02 ± 34.71) days, this study found the incidence rate of hypertension increased with the level of SUA locus. The incidence rate of new hypertension in the low stability, medium stability and high stability SUA groups were 4.65%, 9.18% and 12.43% respectively (all P<0.001). The same trend existed in men and women after stratification according to gender. Wei et al11 showed that after adjusting the known risk factors of hypertension, high SUA level was still an independent risk factor of it; Grayson et al13 found in the systematic evaluation of 18 prospective cohort studies involving 55,607 participants that every 1 mg/dL increase in SUA level will increase the incidence rate of hypertension by 13%; Yokoi et al26 showed that even if there is no hypertension, cardiovascular disease, diabetes and other diseases, the incidence rate of hypertension increases with the increase of SUA level; The baseline data of this study is consistent with previous studies. In addition, the age of the subjects in the high stability group was significantly lower than that in the low and medium stability groups, indicating the incidence population of HUA showed an obvious trend of youth, which also reflected that young people may have worse and unhealthy habits. In this study, the SUA trajectory of the medium stability group fluctuated from 337.89 to 345.73 μ mol/L, which belongs to the reference range of normal SUA at present, but the author found that the incidence rate of hypertension in this group was significantly higher than that of the low stability group, indicating that a lower level of SUA could lead to the occurrence of hypertension, which has certain reference significance for reconsidering the definition of HUA or putting forward the concept of high status of SUA. Moreover, the above research only confirmed that SUA was closely related to hypertension from the measurement results of a single cross section and failed to consider the long-term changes of SUA. Based on the longitudinal physical examination data, this study used the trajectory model to analyze the risk of hypertension increased with the increase of long-term SUA level, and timely intervention should be carried out to the maintenance of high SUA level.
The comparison results of clinical indicators between the SUA trajectories of low stability group, medium stability group and high stability group showed that with the increase of SUA trajectories, WC, SBP, DBP, BMI, ALT, AST, GGT, Cre, TG, LDL-C and FPG were significantly increased, and eGFR, HDL-C were significantly reduced, indicating that with the increase of SUA levels, the renal function of the subjects would decline, which was consistent with previous studies;27 Univariate Cox risk analysis showed that gender, age, WC, BMI, Hb, ALT, AST, GGT, Cre, TG, LDL-C, FPG and HbA1c were risk factors for hypertension, while HDL-C and eGFR were protective factors. Most of the above indicators were suggested to be controllable risk/protective factors for hypertension in many domestic and foreign studies. Although in this study, the level of TC in the medium and high stability group of SUA locus was higher than that in the low stability group, but the difference was not statistically significant, and TC did not constitute a risk factor for new hypertension in the univariate Cox risk analysis. Considering that it may be related to the dyslipidemia of the study population is mainly mixed hyperlipidemia (TG and LDL-C increase, HDL-C decrease), and it needs to be confirmed by the author in subsequent studies. In addition, this study further adjusted the above multiple confounding factors through the multivariate Cox risk regression model. The analysis results showed that in Model 1, Model 2, Model 3 and Model 4, the risk of new hypertension in the medium stability group and the high stability group was significantly higher than that of the low stability group (P<0.05), suggesting that the SUA level within the range of 241.18~247.18 μmol/L, the risk of new hypertension is the lowest. With the increase of SUA level, the risk of new hypertension gradually increases. The SUA level in the medium stability group is still within the normal reference range, and the SUA level in the high stability group has reached the current diagnostic standard for HUA,2 which indicates that the current normal range of SUA may not be sufficient to reflect the diagnostic efficacy of hypertension and other health problems. In view of the close relationship between HUA and poor prognosis of blood vessels, heart, and kidney, hypouricemia is expected to become a new way to prevent and treat cardiovascular diseases, but its exact mechanism needs further exploration.
There are many related studies on SUA and hypertension, and most of the evidence suggests that SUA is related to hypertension at home and abroad.28–31 However, there is still controversy about whether SUA is an independent risk factor for hypertension. Some scholars believe that although the rise of SUA is accompanied by the occurrence of hypertension; however, the published data are mostly based on animal experiments and epidemiological investigations and lack more powerful evidence. In this study, observational cohort study was used to analyze the correlation between uric acid locus and new onset hypertension, which proved the risk of hypertension increased with the increase of long-term SUA level. Therefore, the management of SUA level should be strengthened to provide reference for the prevention and treatment of hypertension. Previous studies have suggested that uric acid is a product of metabolism, and its elevated level and crystal deposition are the main causes of gout. However, more and more evidence confirm that uric acid is also involved in a variety of other physiological and pathological processes. As an endogenous danger signal, it can increase the aggregation of inflammatory factors, induce oxidative stress and apoptosis.10 Research shows that SUA can increase the oxygen free radicals of the body by up regulating xanthine oxidase, participate in vascular endothelial damage, activate renin angiotensin system, increase sodium reabsorption, and then affect blood pressure level through various ways.32,33 Hypertension and HUA have high incidence rate and great harms, and the above two diseases often coexist, which deserves clinicians more attention. Therefore, controlling the SUA level and keep it at a low level for a long time may have some significance for the prevention and treatment of hypertension. Clinically, most patients with HUA have no other symptoms except for the increase of serum uric acid. Owing to the characteristic of this occult onset, early identification of high-risk groups has become an important measure to prevent and control HUA.
The main advantages of this study mainly include: firstly, the study was based on longitudinal data, and the sample size is large, which can improve the quality of the study; Secondly, SUA level is a common and easily measured laboratory indicator, which is conducive to simple and rapid prediction of the risk of hypertension; Thirdly, this study used the trajectory study method to evaluate the dynamic change trajectory of SUA in hypertensive patients, making up for the lack of single cross-sectional measurement data. The limitations of this study mainly include: Firstly, the follow-up time of the endpoint event of new hypertension is relatively short (only one year in 2020), which may limit the stability of the study results to some extent; Secondly, there is a lack of questionnaire information on diet habits, income, and social status. In the future, long-term and continuous follow-up and lifestyle intervention research will be carried out for this population. Therefore, a prospective longitudinal study with a larger sample, higher quality and longer follow-up time is needed in the future to clarify the causal relationship between SUA and the occurrence and development of new onset hypertension, and clearly explain whether reducing SUA level can help prevent the occurrence of hypertension. To guide the disease prevention and treatment of this part of high-risk population with high blood pressure and provide more rigorous and objective evidence based on medicine.
Ethics Approval and Consent to Participate
This study was reviewed and approved by Institutional Review Board of the First Affiliated Hospital of Zhengzhou University (ethical review number: 2018-KY-56) and all the participants signed the informed consent requirement. This study complied with the Declaration of Helsinki. The patient data was maintained with confidentiality.
Acknowledgments
The authors really wish to thank all the participants enrolled in this study.
Funding
This work was supported by the Henan Province Key Scientific Research Projects of Universities (23A320023); National Natural Science Foundation of China (72101236); China Postdoctoral Science Foundation (2022M722900); Collaborative Innovation Project of Zhengzhou City (XTCX2023006); Nursing Team Project of the First Affiliated Hospital of Zhengzhou University (HLKY2023005).
Disclosure
The authors report no conflicts of interest in this work.
References
1. Wang Z, Chen Z, Zhang L., et al. China hypertension survey investigators. status of hypertension in China: results From the China Hypertension Survey, 2012–2015. Circulation. 2018;137(22):2344–2356. doi:10.1161/CIRCULATIONAHA.117.032380
2. Endocrinology Branch of the Chinese Medical Association. Guidelines for diagnosis and treatment of hyperuricemia and gout in China (2019). Chin J Endo Metabol. 2020;36(1):1–2.
3. Desideri G, Virdis A, Casiglia E, Borghi C. Exploration into uric and cardiovascular disease: uric Acid Right for Heart Health (URRAH) project. A study protocol for a retrospective observational study. High Blood Press Cardiovasc Prev. 2018;25(2):197–202. doi:10.1007/s40292-018-0250-7
4. Virdis A, Masi S, Casiglia E, et al. Identification of the uric acid thresholds predicting an increased total and cardiovascular mortality over 20 years. Hypertension. 2020;75(2):302–308. doi:10.1161/HYPERTENSIONAHA.119.13643
5. Casiglia E, Tikhonoff V, Virdis A, et al. Serum uric acid and fatal myocardial infarction: detection of prognostic cut-off values: the URRAH (Uric Acid Right for Heart Health) study. J Hypertens. 2020;38(3):412–419. doi:10.1097/HJH.0000000000002287
6. Tikhonoff V, Casiglia E, Spinella P, et al. Identification of a plausible serum uric acid cut-off value as prognostic marker of stroke: the Uric Acid Right for Heart Health (URRAH) study. J Hum Hypertens. 2021;36(11):976–982. doi:10.1038/s41371-021-00613-5
7. Muiesan ML, Salvetti M, Virdis A, et al. Serum uric acid predicts heart failure in a large Italian cohort: search for a cut-off value the Uric Acid Right for Heart Health study. J Hypertens. 2021;39(1):62–69. doi:10.1097/HJH.0000000000002589
8. Masulli M, D’Elia L, Angeli F, et al. Serum uric acid levels threshold for mortality in diabetic individuals: the Uric Acid Right for Heart Health (URRAH) project. Nutr Metab Cardiovasc Dis. 2022;32(5):1245–1252. doi:10.1016/j.numecd.2022.01.028
9. Ungar A, Rivasi G, Di bari M, et al. The association of uric acid with mortality modifies at old age: data from the Uric Acid Right for Heart Health (URRAH) study. J Hypertens. 2022;40(4):704–711. doi:10.1097/HJH.0000000000003068
10. Sanchez-Lozada LG, Rodriguez-Iturbe B, Kelley EE. Uric Acid and Hypertension: an Update with Recommendations. Am J Hypertens. 2020;33(7):583. doi:10.1093/ajh/hpaa044
11. Wei F, Sun N, Cai C, et al. Associations between serum uric acid and the incidence of hypertension: a Chinese senior dynamic cohort study. J Transl Med. 2016;14(1):110. doi:10.1186/s12967-016-0866-0
12. Mortada I. Hyperuricemia, type 2 diabetes mellitus, and hypertension: an emerging association. Curr Hypertens Rep. 2017;19(9):69. doi:10.1007/s11906-017-0770-x
13. Grayson PC, Kim SY, LaValley M, et al. Hyperuricemia and incident hypertension: a systematic review and meta-analysis. Arthritis Care Res. 2011;63(1):102–110. doi:10.1002/acr.20344
14. Zhang Y, Zhang M, Yu X, et al. Association of hypertension and hypertriglyceridemia on incident hyperuricemia: an 8-year prospective cohort study. J Transl Med. 2020;18(1):409. doi:10.1186/s12967-020-02590-8
15. Yang Y, Zhang X, Jin Z, et al. Association of serum uric acid with mortality and cardiovascular outcomes in patients with hypertension: a meta-analysis. J Thromb Thrombolysis. 2021;52(4):1084–1093. doi:10.1007/s11239-021-02453-z
16. Bombelli M, Ronchi I, Volpe M, et al. Prognostic value of serum uric acid: new-onset in and out-of-office hypertension and long-term mortality. J Hypertens. 2014;32(6):1237–1244. doi:10.1097/HJH.0000000000000161
17. Gaubert M, Bardin T, Cohen-Solal A, et al. Hyperuricemia and hypertension, coronary artery disease, kidney disease: from concept to practice. Int J Mol Sci. 2020;21(11):4066. doi:10.3390/ijms21114066
18. Tanaka A, Kawaguchi A, Tomiyama H, et al. Cross-sectional and longitudinal associations between serum uric acid and endothelial function in subjects with treated hypertension. Int J Cardiol. 2018;272(12):308–313. doi:10.1016/j.ijcard.2018.06.017
19. Tomiyama H, Shiina K, Vlachopoulos C, et al. Involvement of arterial stiffness and inflammation in hyperuricemia-related development of hypertension. Hypertension. 2018;72(6):739–745. doi:10.1161/HYPERTENSIONAHA.118.11390
20. Rao GN, Corson MA, Berk BC. Uric acid stimulate vascular smooth muscle cell proliferation by increasing platelet derived growth factor A-chain expression. J Biol Chem. 1991;266(13):8604–8608. doi:10.1016/S0021-9258(18)93017-6
21. Khosla UM, Zharikov S, Finch JL, et al. Hyperuricemia induces endothelial dysfunction. KidneyInt. 2005;67(5):1739–1742.
22. Corry DB, Eslami P, Yamamoto K, et al. Uric acid stimulates vascular smooth muscle cell proliferation and oxidative stress via thevascularrenin-angiotensin system. JHypertens. 2008;26(2):269–275. doi:10.1097/HJH.0b013e3282f240bf
23. Liu, LS, Wu, ZS, Wang, JG et al. Chinese Hypertension Prevention and Treatment Guidelines (2018 Revision). Chinese J Cardiol. 2019;24(1):24–56.
24. Chinese Working Group on Blood Pressure Measurement. Guidelines for blood pressure measurement in China. Chin J Hypertens. 2011;19(12):1101–1113.
25. Lennon H, Kelly S, Sperrin M, et al. Framework to construct and interpret latent class trajectory modelling. BMJ Open. 2018;8(7):e020683. doi:10.1136/bmjopen-2017-020683
26. Yokoi Y, Kondo T, Okumura N, et al. Serum uric acid as a predictor of future hypertension: stratified analysis based on body mass index and age. Prev Med. 2016;90:201–206. doi:10.1016/j.ypmed.2016.07.007
27. Jung DH, Lee YJ, Lee HR, et al. Association of renal manifestations with serum uric acid in Korean adults with normal uric acid levels. J Korean Med Sci. 2010;25(12):1766–1770. doi:10.3346/jkms.2010.25.12.1766
28. Liu L, Gu Y, Li C, et al. Serum uric acid is an independent predictor for developing prehypertension: a population-based prospective cohort study. Hum Hypertens. 2017;31(2):116–120. doi:10.1038/jhh.2016.48
29. Martinez-Quintana E, Tugores A, Rodríguez-González F. Serum uric acid levels and cardiovascular disease: the Gordian knot. Thorac Dis. 2016;8(11):EI462–EI466.
30. Cicero AF, Rosticci M, Fogacci F, et al. High serum uric acid is associated to poorly controlled blood pressure and higher arterial stiffness in hypertensive subjects. Eur J Intern Med. 2017;37:38–42. doi:10.1016/j.ejim.2016.07.026
31. Kuwabara M, Hisatome I, Niwa K, et al. Uric acid is a strong risk marker for developing hypertension from prehypertension: a 5-year Japanese cohort study. Hypertension. 2018;71(1):78–86. doi:10.1161/HYPERTENSIONAHA.117.10370
32. Zhang JX, Zhang YP, Wu QN, et al. Uric acid induces oxidative stress via an activation of the renin-angiotensin system in 3T3-Ll adipocytes. Endocrine. 2015;48(1):135–142. doi:10.1007/s12020-014-0239-5
33. Sun HL, Pei D, Lue KH, et al. Uric acid levels can predict metabolic syndrome and hypertension in adolescents: a 10-year longitudinal study. PLoS One. 2015;10(11):e0143786. doi:10.1371/journal.pone.0143786
 © 2024 The Author(s). This work is published and licensed by Dove Medical Press Limited. The
full terms of this license are available at https://www.dovepress.com/terms
and incorporate the Creative Commons Attribution
- Non Commercial (unported, 3.0) License.
By accessing the work you hereby accept the Terms. Non-commercial uses of the work are permitted
without any further permission from Dove Medical Press Limited, provided the work is properly
attributed. For permission for commercial use of this work, please see paragraphs 4.2 and 5 of our Terms.
© 2024 The Author(s). This work is published and licensed by Dove Medical Press Limited. The
full terms of this license are available at https://www.dovepress.com/terms
and incorporate the Creative Commons Attribution
- Non Commercial (unported, 3.0) License.
By accessing the work you hereby accept the Terms. Non-commercial uses of the work are permitted
without any further permission from Dove Medical Press Limited, provided the work is properly
attributed. For permission for commercial use of this work, please see paragraphs 4.2 and 5 of our Terms.
Recommended articles
Prevalence of Hypertension and Its Association with Cardiovascular Risk Factors in College Students in Hunan, China
Li M, Cui X, Meng Y, Cheng M, He J, Yuan W, Ni J, Liu J
International Journal of General Medicine 2023, 16:411-423
Published Date: 3 February 2023
Exploring the Relationship Between Different Obesity Metabolism Indices and Hyperuricemia in Patients with Hypertension and Coronary Heart Disease
Li Y, Yi S, Jiang W, Gong M
Diabetes, Metabolic Syndrome and Obesity 2024, 17:3817-3832
Published Date: 18 October 2024
A Link Between the Triglyceride-Glucose Index and the Risk of Hypertension Among Employees in the Titanium Dioxide Industry
Qin F, QI G, Sooranna S, Lu J, Tian H, Lu F, Lin Y, Pang Y
Vascular Health and Risk Management 2026, 22:567638
Published Date: 13 March 2026