")
Back to Journals » OncoTargets and Therapy » Volume 10
18F-fluorodeoxyglucose uptake predicts MET expression in lung adenocarcinoma
Authors An S , Zhou X , Liu J , Huang G
Received 29 August 2017
Accepted for publication 20 October 2017
Published 27 November 2017 Volume 2017:10 Pages 5643—5651
DOI https://doi.org/10.2147/OTT.S150334
Checked for plagiarism Yes
Review by Single anonymous peer review
Peer reviewer comments 3
Editor who approved publication: Dr Samir Farghaly
Shuxian An,1,2,* Xiang Zhou,1,2,* Jianjun Liu,1,2 Gang Huang1–4
1Department of Nuclear Medicine, 2Institute of Clinical Nuclear Medicine, Ren Ji Hospital, School of Medicine, Shanghai Jiao Tong University, 3Institute of Health Sciences, Shanghai Jiao Tong University School of Medicine and Shanghai Institutes for Biological Sciences, Chinese Academy of Sciences, 4Shanghai University of Medicine and Health Sciences, Shanghai, China
*These authors have contributed equally to this work
Objective: MET is a member of the receptor tyrosine kinases. Several MET-targeting inhibitors and antagonistic antibodies have shown promising data in clinical trials of lung adenocarcinoma. Finding noninvasive diagnostic tools to estimate the status of MET is helpful in clinical practice. 18F-fluorodeoxyglucose positron emission tomography/computerized tomography (18F-FDG PET/CT) has been used routinely for the diagnosis and staging of tumors. However, the relationship between MET expression and 18F-FDG uptake has not been investigated yet. This study aimed to determine the correlation of MET expression with 18F-FDG uptake on PET-CT scan and whether or not 18F-FDG PET/CT can be used to predict the MET status of lung adenocarcinoma patients.
Patients and methods: Fifty-seven lung adenocarcinoma patients were analyzed in our study. Maximum standardized uptake value (SUVmax) was calculated in all PET/CT images. The expression levels of MET and two important glycolysis-related markers, glucose transporter 1 (GLUT1) and pyruvate kinase M2, were analyzed by immunohistochemistry of tissues. Spearman rank correlation was used to analyze the association between MET expression and SUVmax. In vitro MET knockdown in lung adenocarcinoma cells was used to examine the role of MET in tumor metabolism. The effect of MET on GLUT1 expression was investigated using Western blot assay and quantitative polymerase chain reaction.
Results: SUVmax was positively correlated with the expression levels of MET (r=0.458; P<0.001) and GLUT1 (r=0.551; P<0.001). SUVmax was significantly higher in patients with positive MET expression than in those with negative MET expression (9.92±6.62 vs 4.60±3.00; P=0.002). MET knockdown in lung adenocarcinoma cells led to a significant decrease in GLUT1 expression and 18F-FDG uptake.
Conclusion: MET could increase 18F-FDG uptake by upregulating GLUT1 expression. 18F-FDG PET/CT could be used to predict the MET status of lung adenocarcinoma patients and to supply valuable information to guide targeted therapy.
Keywords: lung adenocarcinoma, 18F-fluorodeoxyglucose, maximal standardized uptake values, MET
Introduction
Lung cancer is the leading cause of cancer-related death worldwide.1 Adenocarcinoma is a major histological subtype of lung cancer, and its incidence rate has been increasing annually.2 Early diagnosis and treatments are critical to improve the survival rate of patients with lung cancer. Chemotherapy and molecular-targeted therapeutics are two common treatment strategies for these patients. Gefitinib and erlotinib are tyrosine kinase inhibitors (TKIs) that are important targeted therapies in epidermal growth factor receptor (EGFR) mutant patients and have shown promising clinical activity.3 However, drug resistance during treatment leads to mutation, which is an important cause of tumor recurrence.4 Another important mechanism underlying gefitinib resistance is focal amplification of the MET proto-oncogene.3
MET is a proto-oncogene that encodes transmembrane tyrosine kinase receptor MET, and the tyrosine kinase activity is activated once the protein binds with its ligand, hepatocyte growth factor/scatter factor (HFG/SF), in vivo.5 A range of downstream signaling pathways, including phosphoinositide-3-kinase, Ras-mitogen-activated protein kinase (MAPK), Ras-Rac/Rho, and phospholipase C-γ pathways, will be activated.6 MET receptor signaling pathway is involved in cell growth, angiogenesis, invasion, metastasis, prognosis, and drug resistance, and can be activated by the upregulation of HGF, receptor mutation, MET amplification, and MET overexpression.7 All these alterations refer to the development and progression of lung cancer and are associated with poor clinical outcome;8 thus, MET signaling is a promising target for therapeutic intervention. Several MET targeting inhibitors including TKIs and antagonistic antibodies show potential use in clinical trials.9,10 As a nonselective MET inhibitor, crizotinib shows its antitumor role in vivo and exhibits potency against MET-driven tumor models.11–13 Cabozantinib is a TKI that acts against MET and has shown clinical activity in castration-resistant prostate cancer in a Phase II randomized trial.14 Based on their advantageous preclinical profile, noninvasive diagnostic tools are helpful to estimate the status of MET in clinical practice.
Cancer cells preferentially rely on aerobic glycolysis to generate energy; this phenomenon is called “the Warburg effect.”15 Based on the glucose metabolism characteristic of the cancer cells, 18F-fluorodeoxyglucose positron emission tomography/computerized tomography (18F-FDG PET/CT) has been used routinely for the diagnosis and staging of tumors.16 In addition to its known role in cancer, MET signaling may also regulate glucose metabolism.17–19 Perdomo et al revealed that MET signaling stimulates glucose transport and metabolism in skeletal muscle through the activation of the phosphatidylinositol 3-kinase signaling pathway.18 MET signaling induces the metabolic adaptation of colorectal cancer to angiogenesis inhibitors.20 However, the relationship between 18F-FDG uptake and MET expression is not yet fully elucidated.
We investigated the correlation between the maximum standardized uptake value (SUVmax) and the expression of MET and several selected glycolysis-related markers, glucose transporter 1 (GLUT1) and pyruvate kinase M2 (PKM2) (Figure 1). We also revealed the effect of MET on the 18F-FDG uptake in vitro. Our study aimed to investigate the ability of 18F-FDG to predict the status of MET and to show the potential of 18F-FDG as a novel biological indicator for clinical diagnosis and personalized treatment options.
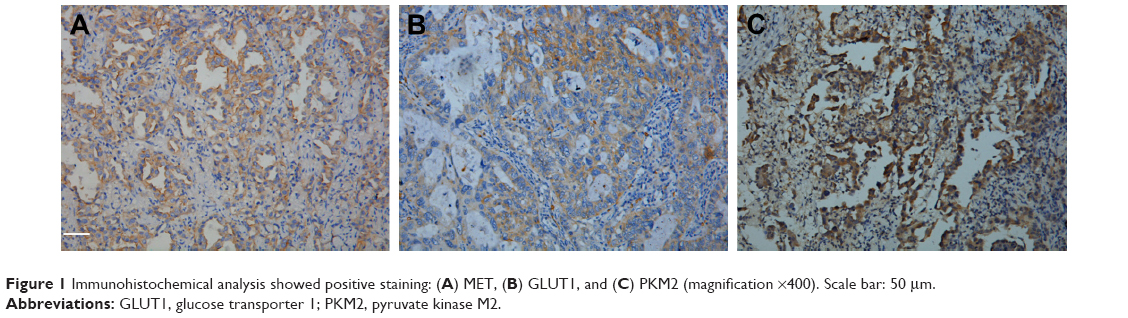 | Figure 1 Immunohistochemical analysis showed positive staining: (A) MET, (B) GLUT1, and (C) PKM2 (magnification ×400). Scale bar: 50 μm. |
Patients and methods
Study population
Fifty-seven patients who underwent tumor resection after 18F-FDG PET/CT at Shanghai Jiaotong University affiliated Renji Hospital and Shanghai Chest Hospital from December 2007 to December 2010 were enrolled in this study. Inclusion criteria were as follows: none of the patients had received treatment before PET/CT scanning; complete case records; tumor pathology of lung adenocarcinoma had been confirmed by histopathologic examination of surgical specimens; available tissue specimen for immunohistochemical (IHC) staining. This research was approved by the institutional ethics committee of Shanghai Jiao Tong University affiliated Renji Hospital and Shanghai Chest Hospital. Written informed consent was obtained from each patient according to the Declaration of Helsinki.
PET-CT examination
18F-FDG PET/CT image was obtained using a PET/CT scanner (Biograph mCT; Siemens, Erlangen, Germany). After fasting for at least 6 h (blood glucose levels were less than 140 mg/dL), all patients were intravenously injected with 3.7 MBq/kg 18F-FDG. Immediately after CT scanning, PET was acquired using three min per bed position and reconstructed iteratively with segmented correction for attenuation using the CT data. Irregular regions of interest were placed over the most intense area of 18F-FDG accumulation for semi-quantitative analysis. SUV was calculated according to the following formula: maximum pixel value with the region-of-interest activity (MBq/kg/(injected dose [MBq]/body weight [kg]).
Immunohistochemistry
Paraffin-embedded lung cancer tissues were used for the IHC analysis. Anti-MET antibody (Cell Signaling Technology, Beverly, MA, USA), anti-GLUT1 antibody (Abcam, Cambridge, UK), or anti-PKM2 antibody (Cell Signaling Technology) was applied on 4 μm sections. Intensity of staining was scored according to the following criteria: 0 (no staining), 1 (weak staining), 2 (intermediate staining), and 3 (strong staining). In addition, 0 (0%), 1 (1%–9%), 2 (10%–49%), and 3 (50%–100%) were used to score the percentage of positive cells. Intensity of staining and percentages of cells were used to score the slides (0 to 9). An IHC score <4 was considered negative, whereas an IHC score ≥4 was considered positive. The slides were evaluated by two independent observers who were blinded to the clinical data.
Cell culture
A549 and H1299 cell lines were purchased from the Cell Bank of the Type Culture Collection of the Chinese Academy of Sciences. All cells were maintained in Dulbecco’s Modified Eagle’s Medium (DMEM; Thermo Fisher Scientific, Waltham, MA, USA) with 10% fetal bovine serum (FBS; Thermo Fisher Scientific). Cells were incubated at 37°C under 5% CO2.
Transfection of siRNA
Cells were transfected with oligo small silencing RNAs using Lipofectamine 2000. The sequences of siRNA oligos used in our study were as follows: MET (sense 5′-CAGAAUGUCAUUCUACAUGAG-3′, antisense 5′-CUCAUGUAGAAUGACAUUCUG-3′), GLUT1 (sense 5′-UGAUGUCCAGAAGAAUAUU-3′, antisense 5′-AAUAUUCUUCUGGACAUCA-3′), and negative control (sense 5′-UUCUCCGAGCGUGUCACGUTT-3′, antisense 5′-ACGUGACACGUUCGGAGAATT-3′).
18F-FDG uptake measurements
A549 and H1299 cells were transfected with siRNAs in 12-well plates. Approximately 48 h after transfection, the cells were collected, washed with PBS, and incubated in 1 mL of glucose-free DMEM containing 18F-FDG (148 kBq [4 μCi/mL]) for 1 h at 37°C. Afterward, 1 mL of 0.1 M NaOH was used to produce lysates. A well γ-counter was used to detect the radioactivity of lysates. At the end of the experiments, data were normalized to total protein. Three independent experiments were performed during our study.
Quantitative real-time PCR
Approximately, 5×10⁵ cells were seeded in 12-well plates and transfected with siRNAs as indicated for 48 h. Cells were collected and washed with PBS for two times. Total RNA was isolated by using a TRIzol kit (Omega, Norcross, GA, USA). RNA concentration was measured by using NanoDrop 2000 Spectrophotometers (Thermo Fisher Scientific). Then 500 ng of total RNA was reversely transcribed into first-strand cDNA using PrimeScript RT master mix (Takara, Tokyo, Japan). SYBR Green PCR Master Mix (Takara) in a StepOnePlus Real-Time PCR System (Thermo Fisher Scientific) was used to perform quantitative real-time PCR (qRT-PCR). Primers used in our study were as follows: MET (forward primer 5′-AGCAATGGGGAGTGTAAAGAGG-3′, reverse primer 5′-CCCAGTCTTGTACTCAGCAAC-3′, GLUT1 (forward primer 5′-CAGTTCGGCTATAACACTGGTG-3′, reverse primer 5′-GCCCCCGACAGAGAAGATG-3′). The PCR cycling conditions were as follows: 95°C for 5 min, 40 cycles of 95°C for 10 s and 55°C for 20 s, 72°C for 20 s and dissociation at 95°C for 15 s, 60°C for 1 min and 95°C for 15 s. The data were analyzed using the 2−ΔΔCt method,21 where ΔCT = CT (target gene) − CT (internal control) and ΔΔCT = ΔCT (treatment groups) − ΔCT (control group). All qRT-PCR reactions were performed in triplicate.
Western blotting
Approximately, 1×10⁶ cells were seeded in six-well plates and transfected with siRNAs as indicated for 48 h. Cells were collected and washed with PBS for two times. After that, cells were lysed using RIPA lysis solution (50 mM Tris-HCl, pH 7.4, 150 mM NaCl, 1% Nonidet P 40, complete protease inhibitor cocktail) for 30 min on ice, and then centrifuged at 15,000× g for 30 min at 4°C. Sodium dodecyl sulfate (SDS [2X]) sample buffer was added to the cell extracts and boiled for 10 min at 100°C. Samples of 45 μg of protein were loaded onto SDS-polyacrylamide gel for electrophoreses as follows: 4.5% spacer gel at 80 V for the coloring matter closing to the top of separation gel and 10% separation gel at 120 V until the bromophenol blue running to the bottom of gel. The separated protein was transferred to the polyvinylidene difluoride (PVDF) membranes (EMD Millipore, Billerica, MA, USA) at 100 V for 1.5 h. Nonfat (5%) milk was used to block nonspecific background for 1 h at room temperature followed by overnight incubation at 4°C with the primary anti-MET (1:1,000) and anti-GLUT1 (1:5,000) antibodies. Anti-rabbit horseradish peroxidase-conjugated secondary antibodies were used in our study. The samples were visualized by using a chemiluminescent substrate (Pierce™ ECL Western Blotting Substrate; Thermo Fisher Scientific).
Statistical analysis
Statistical Package for the Social Sciences version 17.0 software (SPSS Inc, Chicago, IL, USA) was used for the statistical analysis. Unpaired two-tailed t-test was used to analyze the difference between groups. The data were presented as mean ± standard deviation. Chi-square test was used to analyze dichotomous variables. Spearman rank correlation analysis was used to determine the relationship between the SUVmax and protein expression levels. Receiver operating characteristic (ROC) curve was used to assess the best threshold of SUVmax that can be used to predict the MET expression. Overall survival curves were calculated using Kaplan–Meier method and were compared by log-rank test. All tests of significance were two-sided; and P-values less than 0.05 were considered significant.
Results
Patient characteristics
Our test subjects included 33 males and 24 females. The age of patient ranged from 41 to 79 years with a mean value of 61 years. The primary tumor SUVmax ranged from 0.7 to 24 with a mean value of 6.56. The tumor size ranged from 0.80 to 9.30 cm with a mean value of 2.66 cm. Lymph node metastasis was detected in 20 patients.
Correlation of patient characteristics with MET expression
IHC analysis was carried out to assess the expression of MET. MET protein was primarily localized on the cell membrane, or in the cytoplasm of tumor cells (Figure 1). To investigate the relationship between MET expression and the biological characteristics of tumor tissues, we divided the patients into the following two categories according to immunhistochemistry of MET: positive MET expression group (n=21) and negative MET expression group (n=36). The results of the univariate analysis for each factor are shown in Table 1. MET expression was not associated with age, sex, tumor size, tumor differentiation, or TNM stage. However, the SUVmax and lymph node metastasis of these two groups were significantly different. Kaplan–Meier analysis showed that the overall survival rate was significantly lower in the positive MET expression group than in the negative MET expression group (P=0.040) (Figure 2).
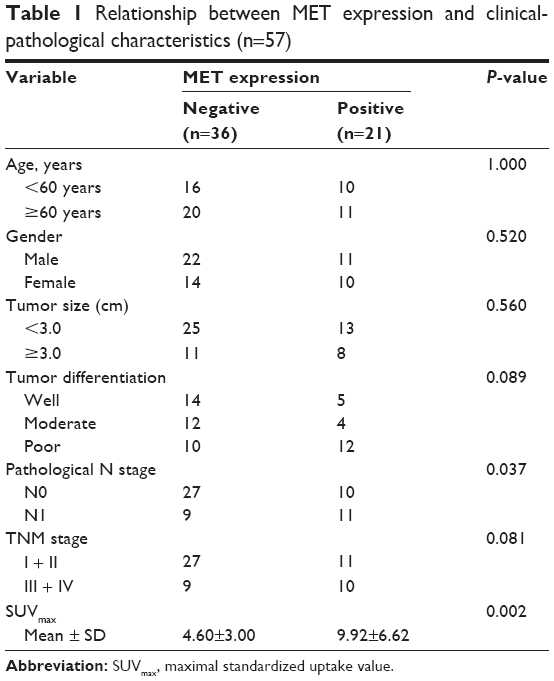 | Table 1 Relationship between MET expression and clinical-pathological characteristics (n=57) |
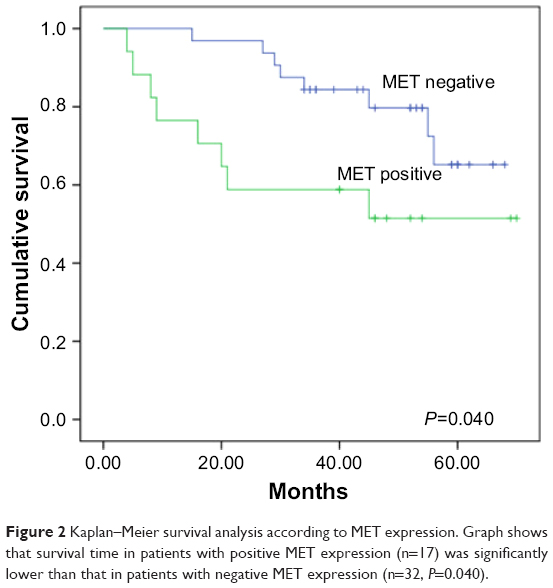 | Figure 2 Kaplan–Meier survival analysis according to MET expression. Graph shows that survival time in patients with positive MET expression (n=17) was significantly lower than that in patients with negative MET expression (n=32, P=0.040). |
Correlation of SUVmax with MET expression
To assess the correlation between 18F-FDG uptake and MET expression in lung adenocarcinomas, we performed IHC staining in 57 patients who underwent 18F-FDG PET/CT before tumor resection. We found that SUVmax was significantly higher in the MET-positive group than in the MET-negative group (9.92±6.62 vs 4.60±3.00; P=0.002). Positive correlation was observed between SUVmax and MET score (r=0.458, P<0.001) (Table 2). ROC curve analysis was used to determine the cutoff value of SUVmax that is suggestive of positive MET results. The area under the curve was 0.751. The sensitivity and specificity in suggesting MET positive expression were 66.7% and 75%, respectively, when the cutoff value of SUVmax was set at 6.2 (Figure 3). These data suggested that 18F-FDG PET/CT can be used to predict the MET expression status in lung adenocarcinoma. We also used multivariate analysis to rule out the possibility that the predictive value of SUVmax for MET status, and the results showed that SUVmax remained significantly correlated with MET expression in lung adenocarcinoma in multivariate analysis (Table 3).
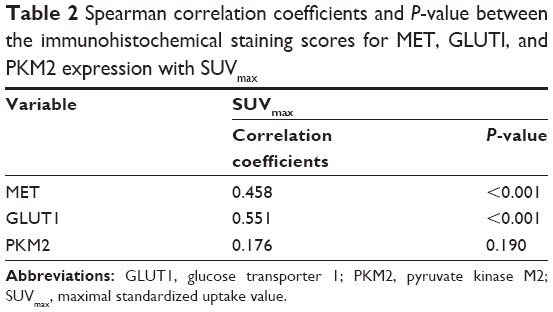 | Table 2 Spearman correlation coefficients and P-value between the immunohistochemical staining scores for MET, GLUTI, and PKM2 expression with SUVmax |
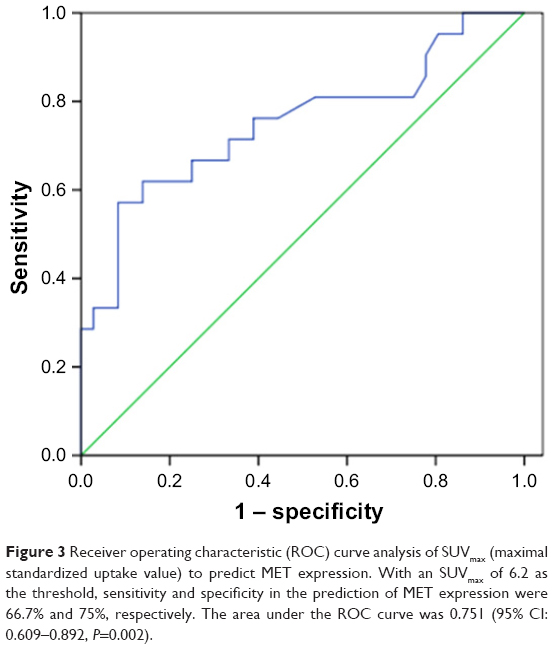 | Figure 3 Receiver operating characteristic (ROC) curve analysis of SUVmax (maximal standardized uptake value) to predict MET expression. With an SUVmax of 6.2 as the threshold, sensitivity and specificity in the prediction of MET expression were 66.7% and 75%, respectively. The area under the ROC curve was 0.751 (95% CI: 0.609–0.892, P=0.002). |
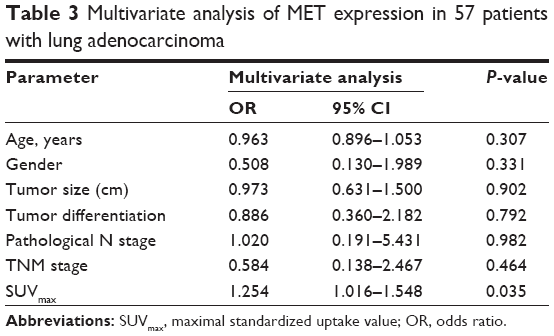 | Table 3 Multivariate analysis of MET expression in 57 patients with lung adenocarcinoma |
Relationship among 18F-FDG accumulation, MET expression, GLUT1 expression, and PKM2 expression
IHC analysis was carried out to assess the expression of GLUT1 and PKM2. Cell membrane staining for GLUT1 was considered positive staining (Figure 1). PKM2 immunoreactivity was readily detected in the cytoplasm and was occasionally detected in the nucleus (Figure 1).
We investigated the association between GLUTI, PKM2 expression according to their IHC staining scores and PET SUVmax. Spearman rank analysis showed that SUVmax was positively correlated with GLUT1 expression (r=0.551; P<0.001) but not correlated with PKM2 expression (r=0.176; P=0.190) (Table 2). SUVmax in tumor group with high GLUT1 expression (n=22, 9.71±5.96) was significantly higher than that in the group with low GLUT1 expression (n=35, 4.58±3.70; P=0.001). A positive correlation was found between MET expression and GLUT1 expression (r=0.408; P=0.002) but not between MET expression and PKM2 expression (r=0.003; P=0.980). We speculate that MET could increase 18F-FDG accumulation by upregulating GLUT1 expression but not PKM2 expression.
Effect of MET downregulation on the cellular uptake of 18F-FDG
Given the correlated expression of MET and GLUT1 in lung adenocarcinoma tissues, 18F-FDG uptake was tested to assess whether MET regulation of GLUT1 affects metabolic flux in A549 and H1129 cells. The results showed that MET knockdown by specific siRNA significantly reduced the 18F-FDG uptake in A549 and H1299 cells. GLUT1 knockdown by specific siRNA further reduced 18F-FDG uptake; however, no additive effect was observed when si-MET was combined with si-GLUT1, indicating that the effect of MET on glycolysis in A549 and H1129 cells was GLUT1 dependent (Figure 4).
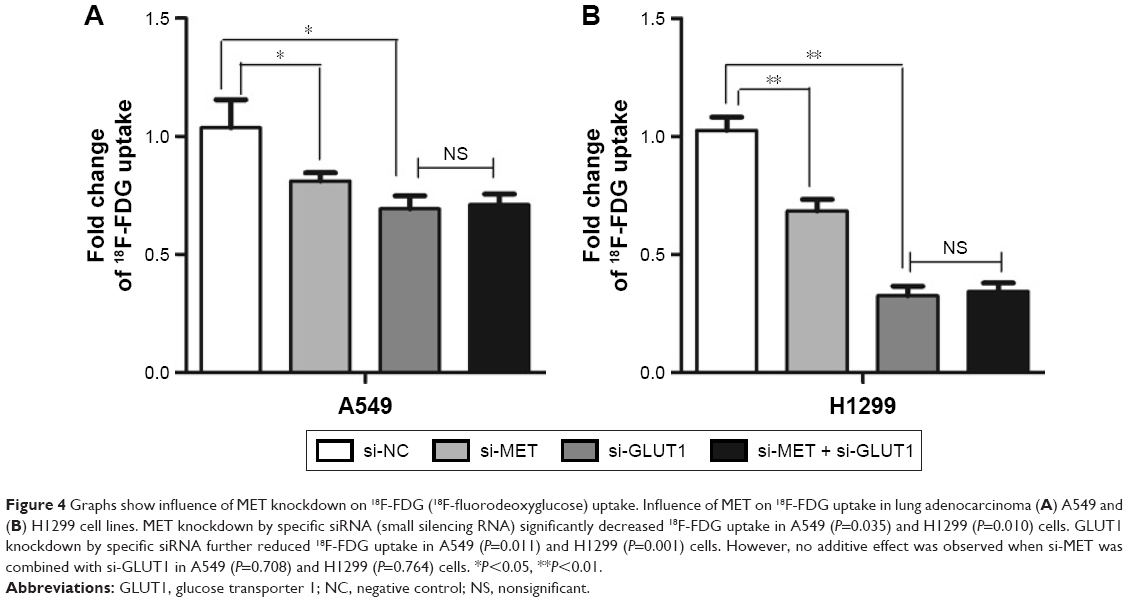 | Figure 4 Graphs show influence of MET knockdown on 18F-FDG (18F-fluorodeoxyglucose) uptake. Influence of MET on 18F-FDG uptake in lung adenocarcinoma (A) A549 and (B) H1299 cell lines. MET knockdown by specific siRNA (small silencing RNA) significantly decreased 18F-FDG uptake in A549 (P=0.035) and H1299 (P=0.010) cells. GLUT1 knockdown by specific siRNA further reduced 18F-FDG uptake in A549 (P=0.011) and H1299 (P=0.001) cells. However, no additive effect was observed when si-MET was combined with si-GLUT1 in A549 (P=0.708) and H1299 (P=0.764) cells. *P<0.05, **P<0.01. |
To further elucidate the mechanism behind these effects, we investigated the effect of MET knockdown on the expression of GLUT1. The results showed that the mRNA levels of GLUT1 were significantly decreased in A549 and H1299 cells treated with siRNA against MET (Figure 5A and B). Western blot analysis showed that MET knockdown by specific siRNA reduced the GLUT1 proteins in A549 and H1299 cells (Figure 5C and D). These results suggested that MET modulated 18F-FDG uptake via the regulation of GLUT1 mRNA and protein levels.
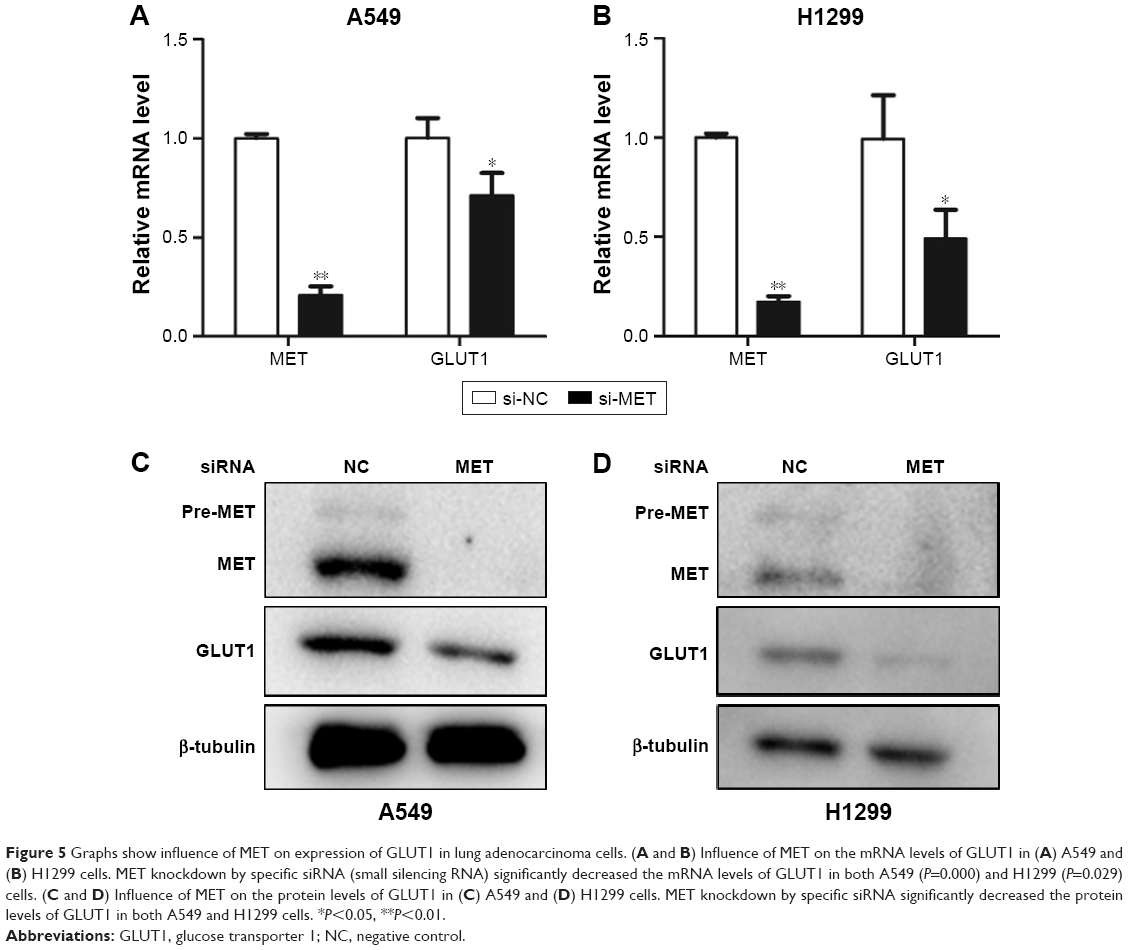 | Figure 5 Graphs show influence of MET on expression of GLUT1 in lung adenocarcinoma cells. (A and B) Influence of MET on the mRNA levels of GLUT1 in (A) A549 and (B) H1299 cells. MET knockdown by specific siRNA (small silencing RNA) significantly decreased the mRNA levels of GLUT1 in both A549 (P=0.000) and H1299 (P=0.029) cells. (C and D) Influence of MET on the protein levels of GLUT1 in (C) A549 and (D) H1299 cells. MET knockdown by specific siRNA significantly decreased the protein levels of GLUT1 in both A549 and H1299 cells. *P<0.05, **P<0.01. |
Discussion
Lung cancer is the leading cause of cancer-related death worldwide.1 Chemotherapy and molecular-targeted therapeutics are two common treatment strategies in lung adenocarcinoma patients. EGFR is a tyrosine kinase receptor, and its mutation is common in adenocarcinoma and has shown promising data in the treatment of lung adenocarcinoma.22 EGFR TKIs gefitinib and erlotinib have shown promising clinical activity.3 However, MET amplification has been reported to be an important reason which leads to acquired resistance to EGFR inhibitors.3,5,23 Approximately, one-fifth of patients resistant to EGFR inhibitors have exhibited MET amplification or expression.3,24 Several MET-targeting inhibitors have shown potential use in clinical trials.9,10 The combination of EGFR and MET dual inhibitory strategies showed a synergistic benefit in MET overexpression patients with acquired resistance to EGFR TKI.25 Based on their advantageous preclinical profile, noninvasive methods are helpful to estimate the status of MET in clinical practice and show the potential to evaluate the effect of the molecular-targeted therapeutics on advanced MET-positive lung adenocarcinoma. PET-CT is one of the currently available noninvasive imaging methods and is widely used in the diagnosis and staging of malignant tumors or monitoring of chemotherapeutic response in patients with cancer.26 Our results revealed that SUVmax was significantly higher in MET-positive expression tumors than in MET-negative expression tumors, suggesting that 18F-FDG accumulation may reflect MET expression in lung adenocarcinomas.
In 2007, Lutterbach et al first reported MET gene amplification and overexpression in non-small-cell lung cancer cell lines27 and their association with poor overall survival.28,29 In our present study, we found the MET expression rate to be 36.8% by using immunohistochemistry, which was in agreement with previous reports.29,30 We found a positive correlation between MET protein expression and primary tumor SUVmax, which was significantly higher in patients with positive expression of MET than in those with negative expression of MET. Tian et al also reported similar observation in human colorectal carcinoma.31 ROC analysis indicated that 18F-FDG PET/CT scans could predict MET expression in patients with lung adenocarcinoma. Multivariate analysis revealed that SUVmax was correlated significantly with MET expression. These data suggested that 18F-FDG uptake can predict MET status and can be used to monitor the effects of MET-targeted therapeutics in lung adenocarcinoma patients.
GLUT1 and PKM2 are two key rate-limiting enzymes for glycolysis. 18F-FDG uptake in cancer cells depends mainly on glucose transporter proteins. However, the association of 18F-FDG uptake with these glycolysis-related markers is currently being debated.16,32 Our results showed that there was a positive association between GLUT1 expression and SUVmax but not between PKM2 expression and SUVmax. We also found a significant correlation between MET expression and GLUT1 expression. In renal cell carcinoma, the hyperactivation of MET signal promoted glycolysis through the PI3K/Akt signaling pathways.33 Brauer et al reported that the altered expression of MET pathway changed the expression of GLUTI and consequently affected Warburg-like metabolism in breast cancer.19 All these data suggested that MET signal is involved in glycolysis in cancer. Our results showed that MET knockdown significantly inhibited 18F-FDG uptake by reducing the mRNA and protein levels of GLUT1 in human lung adenocarcinoma cell lines. In theory, in vitro experiments supported our finding that MET expression was correlated with GLUT expression. 18F-FDG uptake could predict MET expression in lung adenocarcinoma patients.
The prognostic value of MET expression in adenocarcinoma lung is debatable; several reports indicated that patients with MET expression or amplification show a poor prognosis in NSCLC,28–30 whereas others failed to find an association with prognosis.34,35 In our research, we found that patients with positive MET expression had reduced overall survival compared with those showing negative MET expression. We also found that MET expression was correlated with lymph node metastasis; this finding was consistent with those of previous studies.34 Our results showed a correlation between MET expression and lymph node metastasis in lung adenocarcinoma and supported the role of MET signal in driving lymph node angiogenesis in cancer cells.36,37
However, there were some shortcomings in our study. First, our study was conducted at a single center, indicating that the sample size was relatively small. Second, this research was a retrospective study with unavoidable selection bias. A multicenter prospective study that includes many clinical samples is needed to confirm our results.
Conclusion
We found that 18F-FDG accumulation was positively correlated with MET expression in lung adenocarcinoma patients. A significant correlation was found between MET expression and GLUT1 expression, and MET increased the 18F-FDG uptake by upregulating GLUT1 expression. 18F-FDG PET/CT shows the potential as a complementary image tool for predicting MET expression and for assessing the molecular profiles of lung adenocarcinoma patients. Since several MET targeting inhibitors and antagonistic antibodies have brought promising data in lung adenocarcinoma patients with high MET expression, finding new noninvasive methods (eg, molecular imaging) to predict MET status will be beneficial for guiding and monitoring of MET-targeted therapeutics.
Acknowledgments
The study was supported by research grants from Shanghai Municipal Commission of Health and Family Planning (201440606), National Natural Science Foundation of China (Grant No 81530053, 81471685, 81372195, 81471687, 81572719) and “973” Project (2012CB932600).
Disclosure
The authors report no conflicts of interest in this work.
References
Torre LA, Bray F, Siegel RL, Ferlay J, Lortet-Tieulent J, Jemal A. Global cancer statistics, 2012. CA Cancer J Clin. 2015;65(2):87–108. | ||
Didkowska J, Wojciechowska U, Manczuk M, Lobaszewski J. Lung cancer epidemiology: contemporary and future challenges worldwide. Ann Transl Med. 2016;4(8):150. | ||
Engelman J, Zejnullahu K, Mitsudomi T, et al. MET amplification leads to gefitinib resistance in lung cancer by activating ERBB3 signaling. Science. 2007;18(316):1039–1043. | ||
Maheswaran S, Sequist L, Nagrath S, et al. Detection of mutations in EGFR in circulating lung-cancer cells. N Engl J Med. 2008;359(4):366–377. | ||
Salgia R. MET in lung cancer: biomarker selection based on scientific rationale. Mol Cancer Ther. 2017;16(4):555–565. | ||
Birchmeier C, Birchmeier W, Gherardi E, Vande Woude GF. Met, metastasis, motility and more. Nat Rev Mol Cell Biol. 2003;4(12):915–925. | ||
Cullinane C, Dorow DS, Jackson S, et al. Differential (18)F-FDG and 3′-deoxy-3′-(18)F-fluorothymidine PET responses to pharmacologic inhibition of the c-MET receptor in preclinical tumor models. J Nucl Med. 2011;52(8):1261–1267. | ||
Christensen JG, Burrows J, Salgia R. c-Met as a target for human cancer and characterization of inhibitors for therapeutic intervention. Cancer Lett. 2005;225(1):1–26. | ||
Daud A, Kluger HM, Kurzrock R, et al. Phase II randomised discontinuation trial of the MET/VEGF receptor inhibitor cabozantinib in metastatic melanoma. Br J Cancer. 2017;116(4):432–440. | ||
Katayama R, Aoyama A, Yamori T, et al. Cytotoxic activity of tivantinib (ARQ 197) is not due solely to c-MET inhibition. Cancer Res. 2013;73(10):3087–3096. | ||
Zillhardt M, Christensen JG, Lengyel E. An orally available small-molecule inhibitor of c-Met, PF-2341066, reduces tumor burden and metastasis in a preclinical model of ovarian cancer metastasis. Neoplasia. 2010;12(1):1–10. | ||
Lennerz JK, Kwak EL, Ackerman A, et al. MET amplification identifies a small and aggressive subgroup of esophagogastric adenocarcinoma with evidence of responsiveness to crizotinib. J Clin Oncol. 2011;29(36):4803–4810. | ||
Suryavanshi M, Shah A, Kumar D, Panigrahi M, Metha A, Batra U. MET amplification and response to MET inhibitors in stage IV lung adenocarcinoma. Oncol Res Treat. 2017;40(4):198–202. | ||
Smith DC, Smith MR, Sweeney C, et al. Cabozantinib in patients with advanced prostate cancer: results of a phase II randomized discontinuation trial. J Clin Oncol. 2013;31(4):412–419. | ||
Vander Heiden MG, Cantley LC, Thompson CB. Understanding the Warburg effect: the metabolic requirements of cell proliferation. Science. 2009;324(5930):1029–1033. | ||
Jadvar H, Alavi A, Gambhir SS. 18F-FDG uptake in lung, breast, and colon cancers: molecular biology correlates and disease characterization. J Nucl Med. 2009;50(11):1820–1827. | ||
Bertola A, Bonnafous S, Cormont M, et al. Hepatocyte growth factor induces glucose uptake in 3T3-L1 adipocytes through A Gab1/phosphatidylinositol 3-kinase/Glut4 pathway. J Biol Chem. 2007;282(14):10325–10332. | ||
Perdomo G, Martinez-Brocca MA, Bhatt BA, Brown NF, O’Doherty RM, Garcia-Ocana A. Hepatocyte growth factor is a novel stimulator of glucose uptake and metabolism in skeletal muscle cells. J Biol Chem. 2008;283(20):13700–13706. | ||
Brauer HA, Makowski L, Hoadley KA, et al. Impact of tumor microenvironment and epithelial phenotypes on metabolism in breast cancer. Clin Cancer Res. 2013;19(3):571–585. | ||
Mira A, Morello V, Céspedes M, et al. Stroma-derived HGF drives metabolic adaptation of colorectal cancer to angiogenesis inhibitors. Oncotarget. 2017;8(24):38193–38213. | ||
Livak KJ, Schmittgen TD. Analysis of relative gene expression data using real-time quantitative PCR and the 2(-Delta Delta C(T)) Method. Methods. 2001;25(4):402–408. | ||
Ridge CA, McErlean AM, Ginsberg MS. Epidemiology of lung cancer. Semin Intervent Radiol. 2013;30(2):93–98. | ||
Sadiq AA, Salgia R. MET as a possible target for non-small-cell lung cancer. J Clin Oncol. 2013;31(8):1089–1096. | ||
Chen HJ, Mok TS, Chen ZH, et al. Clinicopathologic and molecular features of epidermal growth factor receptor T790M mutation and c-MET amplification in tyrosine kinase inhibitor-resistant Chinese non-small cell lung cancer. Pathol Oncol Res. 2009;15(4):651–658. | ||
Spigel DR, Ervin TJ, Ramlau RA, et al. Randomized phase II trial of Onartuzumab in combination with erlotinib in patients with advanced non-small-cell lung cancer. J Clin Oncol. 2013;31(32):4105–4114. | ||
Shi D, Cai G, Peng J, et al. The preoperative SUVmax for (18)F-FDG uptake predicts survival in patients with colorectal cancer. BMC Cancer. 2015;15:991. | ||
Lutterbach B, Zeng Q, Davis LJ, et al. Lung cancer cell lines harboring MET gene amplification are dependent on Met for growth and survival. Cancer Res. 2007;67(5):2081–2088. | ||
Sun W, Song L, Ai T, Zhang Y, Gao Y, Cui J. Prognostic value of MET, cyclin D1 and MET gene copy number in non-small cell lung cancer. J Biomed Res. 2013;27(3):220–230. | ||
Song Z, Wang X, Zheng Y, Su H, Zhang Y. MET gene amplification and overexpression in Chinese non-small-cell lung cancer patients without EGFR mutations. Clin Lung Cancer. 2017;18(2):213–219. | ||
Sun W, Ai T, Gao Y, Zhang Y, Cui J, Song L. Expression and prognostic relevance of MET and phospho-BAD in non-small cell lung cancer. Onco Targets Ther. 2013;6:1315–1323. | ||
Tian M, Yu L, Zhang Y, Gao X. Correlations between SUVmax and expression of GLUT1 and growth factors inducing lymphangiogenesis. Acad Radiol. 2012;19(4):420–426. | ||
Huang P, Zhao X, Xiao W, Dong Y, Hu G. 18F-fluorodeoxyglucose uptake predicts PKM2 expression in lung adenocarcinoma. Oncotarget. 2017;8(24):39618–39626. | ||
Massari F, Ciccarese C, Santoni M, et al. Metabolic alterations in renal cell carcinoma. Cancer Treat Rev. 2015;41(9):767–776. | ||
Nakamura Y, Niki T, Goto A, et al. c-Met activation in lung adenocarcinoma tissues: an immunohistochemical analysis. Cancer Sci. 2007;98(7):1006–1013. | ||
Dziadziuszko R, Wynes MW, Singh S, et al. Correlation between MET gene copy number by silver in situ hybridization and protein expression by immunohistochemistry in non-small cell lung cancer. J Thorac Oncol. 2012;7(2):340–347. | ||
Kajiya K, Hirakawa S, Ma B, Drinnenberg I, Detmar1 M. Hepatocyte growth factor promotes lymphatic vessel formation and function. EMBO J. 2005;24(16):2885–2895. | ||
Cao R, Björndahl M, Gallego M, et al. Hepatocyte growth factor is a lymphangiogenic factor with an indirect mechanism of action. Blood. 2006;107(9):3531–3536. |
 © 2017 The Author(s). This work is published and licensed by Dove Medical Press Limited. The full terms of this license are available at https://www.dovepress.com/terms.php and incorporate the Creative Commons Attribution - Non Commercial (unported, v3.0) License.
By accessing the work you hereby accept the Terms. Non-commercial uses of the work are permitted without any further permission from Dove Medical Press Limited, provided the work is properly attributed. For permission for commercial use of this work, please see paragraphs 4.2 and 5 of our Terms.
© 2017 The Author(s). This work is published and licensed by Dove Medical Press Limited. The full terms of this license are available at https://www.dovepress.com/terms.php and incorporate the Creative Commons Attribution - Non Commercial (unported, v3.0) License.
By accessing the work you hereby accept the Terms. Non-commercial uses of the work are permitted without any further permission from Dove Medical Press Limited, provided the work is properly attributed. For permission for commercial use of this work, please see paragraphs 4.2 and 5 of our Terms.