")
Back to Journals » International Journal of Nanomedicine » Volume 15
Zein/Phospholipid Composite Nanoparticles for Successful Delivery of Gallic Acid into aHSCs: Influence of Size, Surface Charge, and Vitamin A Coupling
Authors Radwan SAA , El-Maadawy WH, Yousry C , ElMeshad AN , Shoukri RA
Received 2 July 2020
Accepted for publication 12 September 2020
Published 16 October 2020 Volume 2020:15 Pages 7995—8018
DOI https://doi.org/10.2147/IJN.S270242
Checked for plagiarism Yes
Review by Single anonymous peer review
Peer reviewer comments 4
Editor who approved publication: Prof. Dr. Anderson Oliveira Lobo
Shaimaa Ali Ali Radwan,1 Walaa H El-Maadawy,2 Carol Yousry,1 Aliaa Nabil ElMeshad,1 Raguia Aly Shoukri1
1Department of Pharmaceutics and Industrial Pharmacy, Faculty of Pharmacy, Cairo University, Cairo, Egypt; 2Department of Pharmacology, Theodor Bilharz Research Institute, Giza 12411, Egypt
Correspondence: Aliaa Nabil ElMeshad
Department of Pharmaceutics and Industrial Pharmacy, Faculty of Pharmacy, Cairo University, Kasr Al Aini Street, Cairo 11562, Egypt
Tel +201000101551
Email [email protected]
Purpose: Zein/phospholipid composite nanoparticles (CNPs) were developed as a delivery platform for gallic acid (GA), a polyphenolic compound with reported preclinical antifibrotic activities. However, the therapeutic applicability of GA is hampered owing to its low bioavailability and rapid clearance. Accordingly, we developed GA-loaded CNPs. The effect of their size, surface charge and targeting strategies was investigated and optimized, with the aim of enhancing their ability to deliver GA to the activated hepatic stellate cells (aHSCs) in order to suppress hepatic fibrosis progression.
Methods: Different CNP systems were prepared and characterized with regard to their particle size, zeta potential, and GA entrapment efficiency (EE%). Also, they were statistically optimized via response surface methodology. The optimized systems were investigated with regard to their in vitro GA release, in vitro efficacy on aHSCs, and in vivo biodistribution in healthy rats.
Results: The GA-loaded cationic CNPs coupled with vitamin A (GA-CACNP/VA; 192 nm) showed high GA EE% (60% w/w), highest cellular internalization via active targeting, and more selective hepatic distribution, relative to free GA solution, GA-loaded anionic, and GA-loaded cationic systems. Furthermore, GA-CACNP/VA markedly triggered the apoptosis of aHSCs, repressed collagen deposition, and inhibited HSCs’ activation to a lesser extent.
Conclusion: The GA-CACNP/VA was shown to be a promising candidate for specific and controlled delivery of GA to aHSCs, which may provide an effective antifibrotic therapeutic approach.
Keywords: zein, phospholipids, gallic acid, hepatic fibrosis, hepatic stellate cells, vitamin A
Introduction
Hepatic fibrosis is a life-threatening condition, which results from all types of chronic hepatic disorders. It may develop into hepatic cirrhosis and hepatocellular carcinoma if not controlled, which contributes to the high global morbidity and mortality rates.1 Hepatic stellate cells (HSCs) are considered crucial in the pathogenesis of hepatic fibrosis.2 Upon liver injuries, HSCs are transformed from their quiescent state to an activated state, where they turn into highly proliferative and contractile myofibroblasts. When liver injuries persist, activated HSCs (aHSCs) produce excessive amounts of cytokines, chemokines, and extracellular matrix (ECM) proteins, especially type I collagen, which ultimately promote the progression of hepatic fibrosis.2
Although the mechanistic pathways underlying the progression of liver fibrosis are well known, no drugs are approved yet as effective antifibrotic agents.3,4 Recently, nanotechnology has emerged as a powerful and promising tool in drug delivery, which has proven to overcome the physiological absorption barriers. Nanoparticles (NPs) can protect entrapped moieties from physiological metabolic processes, thus, allowing higher bioavailability of the drugs, and can extend the formulation survival inside the body, which allows a longer duration of drug exposure.5,6 NPs have also shown to be effective carriers for the delivery of antifibrotic drugs to the liver.7,8 In recent years, HSC-targeted nanodrug-delivery systems have attracted research attention owing to their potential applications in liver fibrosis therapy.9,10 However, their applications face many challenges with regard to their potential toxicity to parenchymal cells,3 insufficient concentration at the target site, as well as the reduction of the hepatic blood flow, which can compromise the drug uptake into the liver.10 The size range of NPs (<200 nm) is considered a key factor that aids their translocation into the fibrotic liver, with the reduced fenestrae formation and diameter, and to escape their capture and elimination by reticuloendothelial system.11,12
Gallic acid (3, 4, 5-trihydroxybenzoic acid, GA), is one of the abundant natural phenolic acids in human diets,13 which possesses a broad range of biological activities, including antioxidant, anti-inflammatory, antimutagenic, and anticancer properties.14,15 Furthermore, GA has shown promising antifibrotic activity in vitro16 and in experimental animals15–17 owing to its robust antioxidant and anti-inflammatory properties,15 in addition to its ability to suppress the activation16,17 and induce apoptosis of aHSCs.16 However, its efficacy and therapeutic applicability are hindered by its low bioavailability as it is poorly absorbed and subjected to extensive metabolism with rapid clearance, which results in low plasma concentration.18 Additionally, its high hydrophilicity (high aqueous solubility of about 10 mg/mL and log P = −0.53) limits its successful encapsulation in different nanosystems.19 Various approaches have been employed to overcome the pharmacokinetics problems and enhance the bioavailability and antioxidant potential of GA.20,21 Thus, the successful formulation of nanosized GA-loaded NPs with high encapsulation efficiency could be a promising approach to enhance its bioavailability and improve its liver-targeting behavior.
Zein is a natural biodegradable hydrophobic protein obtained from corn with a molecular weight of about 40 kDa.12,22 Its relatively high hydrophobicity contributes to its conformation into spherical colloidal NPs via antisolvent precipitation techniques, thus, allowing ideal delivery for both hydrophilic and lipophilic drugs.12,23–26 To modulate the functionality, drug encapsulation efficiency, and physical stability of zein-based NPs, zein/phospholipid composite NPs were fabricated by Dai et al.27 These NPs are composed of biopolymer phospholipid shell and zein core forming a core–shell structure.
Herein, we took an objective approach to develop and investigate the potential applicability of different zein/phospholipid composite NPs (CNPs) as effective delivery platforms for GA into aHSCs. So, anionic CNPs, cationic CNPs, and vitamin A (VA) coupled cationic CNPs loaded with GA were prepared and characterized, with regard to their particle size (PS), zeta potential (ZP), and gallic acid encapsulation efficiency (GA-EE%). The GA-loaded CNPs were then evaluated and compared based on the effect of their size, surface charge, GA-release profile from each system, and targeting approach, where surface decoration of the cationic nanosystem with VA was performed to impart an active targeting ability. In addition, the safety of each system and their in vitro efficacy on aHSCs were investigated and compared by elucidating their underlying mechanisms, as well as their in vivo biodistribution in healthy rats.
Materials and Methods
Materials
GA powder, L-α-Phosphatidylcholine from egg yolk (60%, TLC), Zein, Didodecyldimethylammonium bromide (98%) (DDAB), Stearylamine (SA), Sulphorhodamine B (SRB) dye, Rhodamine B dye, retinoic acid (vitamin A; VA), Triton-X100, trypan blue, trichloroacetic acid, and dialysis membrane with 12,000–14,000 molecular weight cut-off were purchased from Sigma-Aldrich, MO, USA. Dulbecco’s Modified Eagle’s Medium (DMEM), fetal bovine serum (FBS), penicillin/streptomycin, and phosphate buffer saline (PBS) were purchased from GIBCO, NY, USA. Recombinant transforming growth factor (TGF)-β1 and 4ʹ,6-diamidino-2-phenylindole (DAPI) fluorescent dye were purchased from Cell Signaling Technology, MA, USA. Rat tail type I collagen tissue culture plates were purchased from Greiner Bio-One GmbH, Frickenhausen, Germany. Ethanol 96% was obtained from Piochem, Giza, Egypt. Dimethyl sulfoxide (DMSO) was purchased from Oxford Lab Chem, Mumbai, India. Sucrose, Potassium dihydrogen phosphate (KH2PO4), and Disodium hydrogen phosphate (Na2HPO4) were purchased from El-Nasr Pharmaceutical Chemicals, Cairo, Egypt.
Methods
Preparation of GA-Loaded Anionic Zein/Phospholipid CNPs (GA-ANCNPs)
GA-ANCNPs dispersions were prepared via the ethanol-injection technique.27 GA, zein, and phospholipid were dissolved in ethanol (90% v/v, 60°C) and injected dropwise into an aqueous phase (60°C) while stirring with a magnetic stirrer (Wisd Wisestir MSH 20-D, Witeg, Germany) at 600 rpm and 60°C. The volume ratio of the aqueous phase to the organic phase was 2:5. The ethanol was allowed to evaporate by stirring for 1 h at 60°C. Finally, the dispersion was homogenized (Silent Crusher Homogenizer; Heidolph, Germany) at 75,000 rpm for a specified time, according to the experimental design.
Three level-three factor Box–Behnken design (Table 1) was employed to study the effect of the independent formulation variables namely; drug loading (X1), homogenization time (X2), and phospholipid to zein ratio (X3) on the CNPs properties. The studied dependent responses were particle size (PS; Y1), polydispersity index (PDI; Y2), zeta potential (ZP; Y3), and entrapment efficiency percentage (EE%; Y4). The construction and investigation of the experimental design were executed using the Design Expert software (Version 7, Stat-Ease Inc., MN, USA).
 |
Table 1 Levels of the Independent Variables in Box-Behnken Statistical Design and the Optimization Criteria of the Dependent Variables |
Seventeen formulation systems were suggested by the design; 12 runs disclosed the mid-point of each edge of the 3D cube, and the center point of the cube was repeated five times, as shown in Table 2. The results of the dependent responses were analyzed and optimized to obtain a system with the highest desirability. The optimization criteria were set to produce CNPs with the highest ZP, lowest PS and PDI, and maximum EE% to ensure the good physical stability of the dispersion, high penetration of the liver sinusoidal fenestrations, and high therapeutic efficiency, respectively.
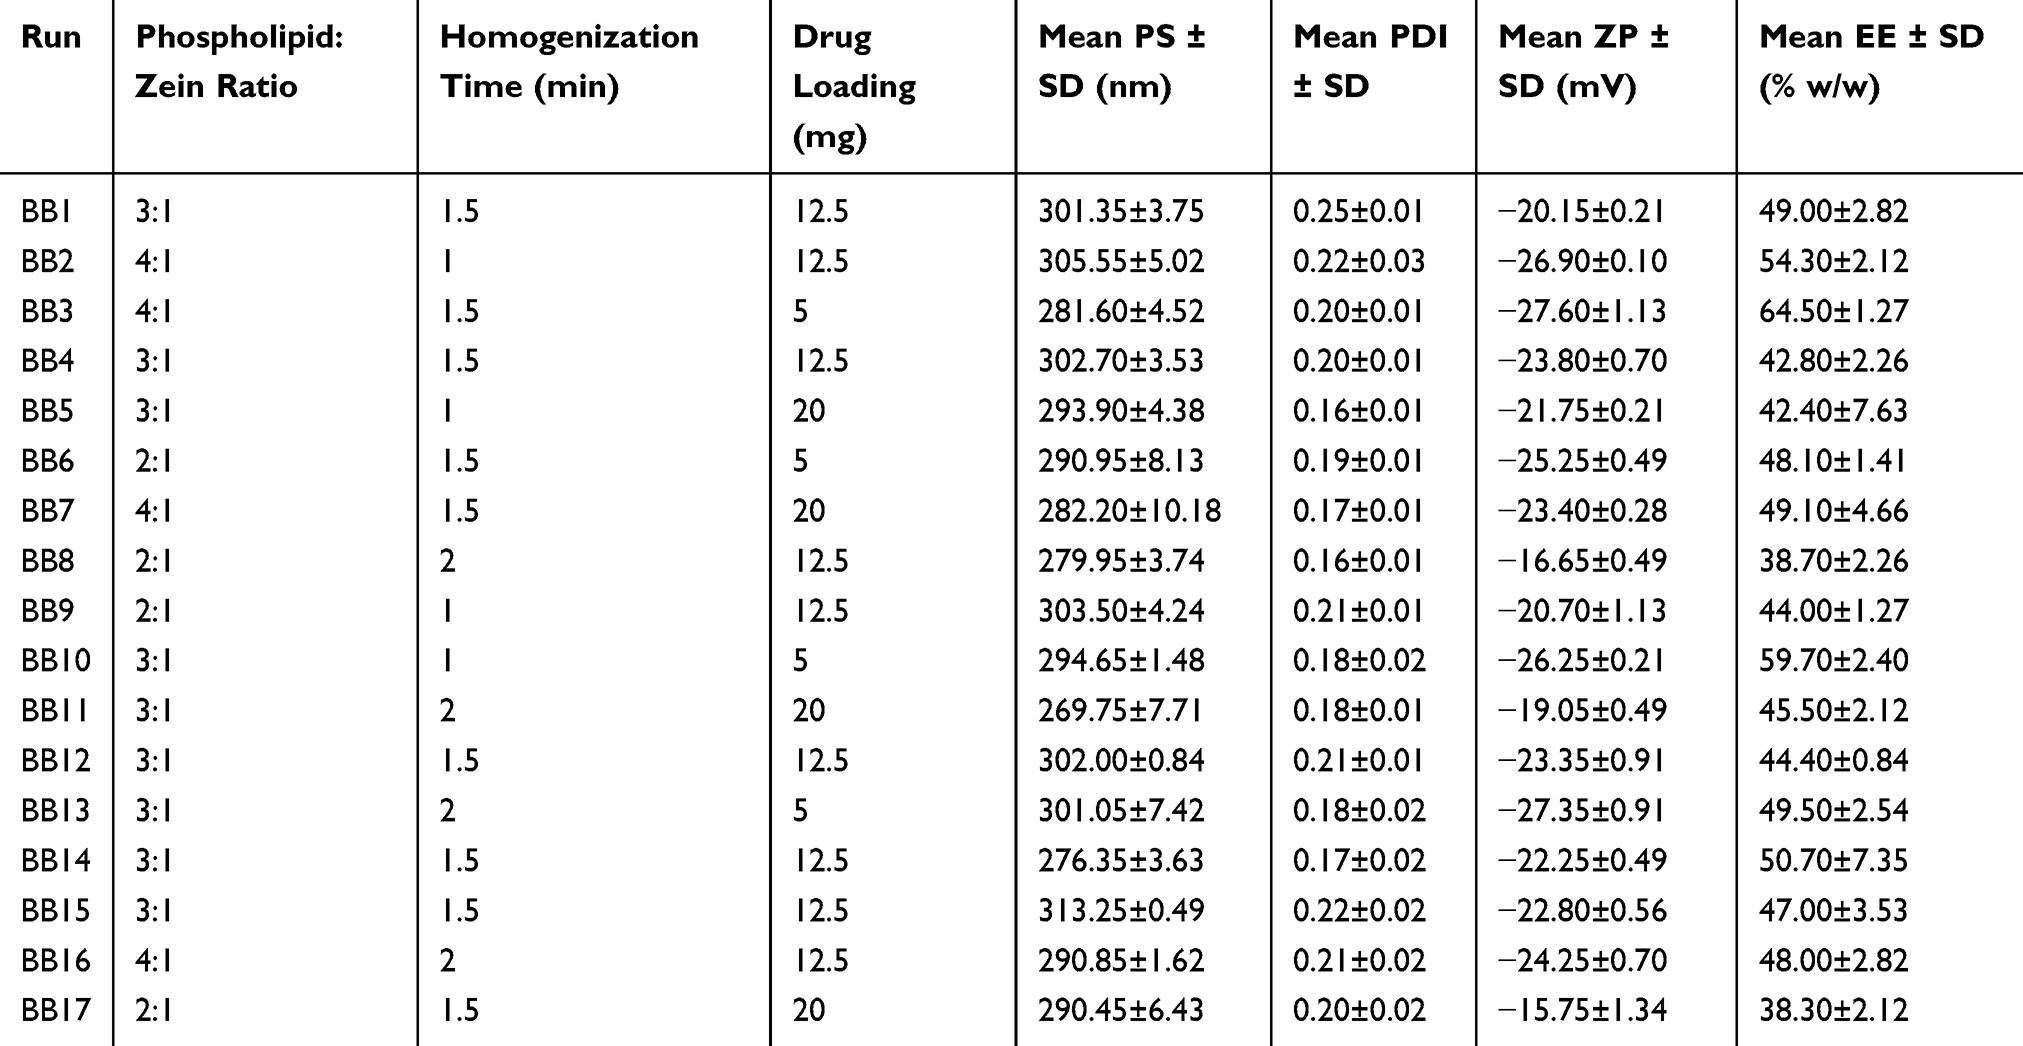 |
Table 2 Different Runs’ Composition Corresponding to Box-Behnken Design with Their Resultant Dependent Variables (n=3) |
Preparation of GA-Loaded Cationic Zein/Phospholipid CNPs (GA-CACNPs)
The most desirable system obtained from the first design was prepared, as previously mentioned with some modifications.28,29 Different amounts of positive charge inducers (SA or DDAB) were added to the ethanolic solution. The resultant turbid dispersion after injecting the ethanolic solution to water was subjected to intermittent sonication (5 s on and 5 s off) using a probe sonicator (ChromTech Model UP-500, 220V). Finally, the dispersion was left to evaporate the ethanol and then, homogenized as before.
The D-optimal statistical design was employed to investigate the influence of the independent variables (the type (X1) and amount (X2) of positive charge inducers (SA or DDAB), and sonication time (X3)) on the dependent variables (PS (Y1), PDI (Y2), ZP (Y3) and EE% (Y4)). The independent and dependent variable levels and constraints are presented in Table 3.
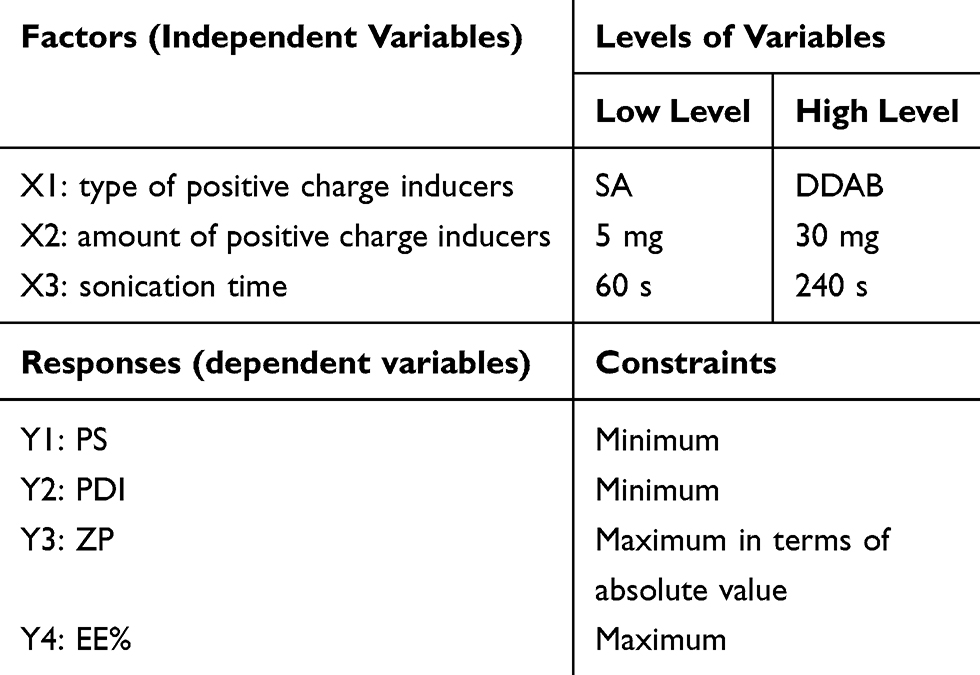 |
Table 3 Levels of the Independent Variables in D-Optimal Statistical Design and the Optimization Criteria of the Dependent Variables |
The statistical design suggested 19 different systems, as listed in Table 4. The statistical analysis of the dependent variables and the system optimization were performed using the Design Expert 7.0.0 program. The optimized CACNP system with the lowest PS and PDI and highest ZP and EE% was suggested by the software.
 |
Table 4 Different Runs’ Composition Corresponding to D-Optimal Design with Their Resultant Dependent Variables (n=3) |
Coupling of the Optimized CACNP System with VA (GA-CACNP/VA)
Herein, VA was dissolved in DMSO and added to the optimized CACNP system.11,30–33 The ratio of the amounts of the optimized positive charged inducer to the VA was 2:1. The dispersion was thoroughly mixed using a Vortex mixer (JULABO Labortechnik, Germany) for 1 min and left to equilibrate overnight. The free VA was removed using centrisart 2.5 mL concentrator 20,000 MWCO via centrifugation at 15,000 rpm for 10 min at 10°C using an ultra-cooling Centrifuge (Sigma 3–30KS, Germany). The trapped materials in the filter were reconstituted with water to get the desired dose.28
Characterization of GA-CNPs
The PS and PDI of all systems were determined at 90º scattering angle using Malvern Zetasizer (ver.6.20, Malvern Instruments Ltd., Worcestershire, England). Whereas, the ZP was measured using a laser Doppler anemometer coupled with the same instrument at a potential of ±150 mV. All measurements were performed in triplicate at room temperature (30ºC) after 100 fold dilution with double distilled water.34
To measure the total drug content of the GA-CNPs, 0.1 mL of the NPs was dissolved in ethanol (96% v/v) for complete lysis of the formulated NPs.35 The GA concentration was determined using a UV-spectrophotometer (Shimadzu, UV-1601 PC, Japan) at λmax of 272 nm.36,37 Moreover, the EE% was calculated after subjecting the dispersion to centrifugation using an ultra-cooling centrifuge at 22,000 rpm for 1 h at 4°C. The clear supernatant solution was separated and properly diluted with ethanol. The free unentrapped GA was spectrophotometrically detected at the same wavelength. The drug content and EE% were calculated using the following equations:38

where PC indicates the procedural constant and df reflects the dilution factor

The spectrophotometric assay was validated, according to a preconstructed calibration curve (concentration range = 1–16 μg/mL, coefficient R2 = 0.999, the lower limit of quantification (LOQ) = 1 µg/mL, and n=3). The recorded inter- and intra-day precision, expressed as percentage relative standard deviations (%RSD), were in the range of 1.03% to 6.48% and 1.10% to 4.29%, respectively. Meanwhile, the inter- and intra-day accuracy, expressed as recovery percentage, were in the range of 96.81% to 98.19% and 94.56% to 98.14%, respectively.
Characterization of the Optimized GA-ANCNP, GA-CACNP, and GA-CACNP/VA Systems
The optimized GA-ANCNP, GA-CACNP, and GA-CACNP/VA systems were evaluated with regard to PS, PDI, ZP, and EE%, as previously mentioned.
The GA-CACNP/VA dispersion was centrifuged (4°C) at 22,000 rpm for 1 h. The free uncoupled VA was determined via spectrophotometry at λmax of 327 nm39 after appropriate dilution of the supernatant solution. The coupling efficiency was calculated as follows:28

The spectrophotometric method was validated, according to a preconstructed calibration curve (concentration range = 1–8 μg/mL, coefficient R2 = 0.999, LOQ = 1 µg/mL, and n=3). The recorded inter- and intra-day %RSD were in the range of 2.99% to 4.04% and 1.85% to 3.77%, respectively. Meanwhile, the inter- and intra-day recovery percentage were in the range of 98.69% to 107.09% and 101.31% to 108.27%, respectively.
The morphologies of the optimized and VA coupled systems were observed using TEM (Jeol, 1200 EXII, Tokyo, Japan). A drop of the diluted dispersion was placed on a carbon-coated copper grid followed by the addition of a drop of phosphotungstic acid (2% w/v). The sample was left to dry and the excess reagent was removed using filter paper. Finally, the grid was examined using TEM at 80 kV.34
The GA-release from the optimized systems, VA-coupled system, and drug solution was evaluated using the in vitro dialyzing method in a thermostatically controlled oscillating water bath shaker (Tulabo SW-20 C, USA).
The evaluation was performed using a phosphate buffer (pH 6.8, 100 mL) at 37 ± 0.5°C and a shaking speed of 100 rpm. Three milliliter aliquots were removed at predetermined times (0.25, 0.5, 1, 2, 4, 6, 8, and 24 h) and compensated with the same volume of the release medium.40 Finally, the concentration of GA was determined via spectrophotometry at λmax of 258 nm.40,41 The cumulative percentage of GA released was calculated using Equation 3.42

where mGA is the amount of GA in the CNPs, Vo is the whole volume of the release media (Vo = 100 mL), Vt is the volume of the fresh replaced media (Vt = 3 mL), and Cn is the concentration of GA in the sample.
The spectrophotometric method was validated, according to a preconstructed calibration curve (concentration range = 2–24 μg/mL, coefficient R2 = 0.999, LOQ = 2 µg/mL, and n=3). The recorded inter- and intra-day %RSD were in the range of 0.51% to 2.97% and 0.38% to 4.19%, respectively. Meanwhile, the inter- and intra-day recovery percentage were in the range of 96.73% to 99.59% and 98.26% to 99.97%, respectively.
The in vitro drug release data were kinetically analyzed using Microsoft Excel for Office 365 MSO (Microsoft Corporation, Washington, DC, USA) to determine the mechanism and the order of drug release from various systems. Zero order, first order, Higuchi,43 and Korsmeyer–Peppas44,45 (Equation 4) models were applied for the analysis of the release kinetics.

where Mt/M∞ = the drug dissolved fraction at time t, K = kinetic constant, and n = the diffusional exponent that depends on the release mechanism and the shape of the drug delivery system. When n ≤ 0.45, this corresponds to a Fickian (case I) diffusion, 0.45 < n < 0.89 indicates an anomalous (non-Fickian) transport, n = 0.89 refers to a zero order (case II) transport, and n > 0.89 suggests a super case II transport.
The systems were prepared and lyophilized using a freeze dryer (Novalyphe-NL500, Halprook, NY, USA) at −80°C for 48 h using 5% w/v sucrose as a cryoprotectant. Their PS, PDI, ZP, and EE% were investigated after reconstitution, and the results were compared to the freshly prepared systems.46
The FTIR spectroscopy was performed to determine the anticipated interaction between retinoic acid and the optimized cationic system. One mg of the lyophilized system (GA-CACNP or GA-CACNP/VA) or VA powder was blended with 200 mg KBr to prepare KBr disc. The spectrum was recorded in the range of 4000 to 450 cm−1 using IR spectrophotometer (Mattson FTIR spectrometer, USA).47
The DSC thermograms (GA, zein, phospholipid, SA, VA, sucrose, the lyophilized GA-CACNP/VA, and its physical mixture) were examined to detect the thermotropic behavior, the level of crystallinity, and the possible interactions between different components of the NPs. Briefly, each sample (5 mg) was heated in a hermetically sealed aluminium pan at a rate of 10°C/min from 50°C to 300°C under a nitrogen purge of 30 mL/min using a DSC-60 differential scanning calorimeter (Shimadzu, Kyoto, Japan).47
Nineteen male Sprague-Dawley rats (weighing 200 ± 50 g) were obtained from the Animal House of Theodor Bilharz Research Institute, Giza, Egypt for the isolation of primary hepatocytes and in vivo bio-distribution experiments. Rats were maintained at 12-h light/dark cycles with free access to water and food ad libitum. All experimental protocols for animals and in vitro cell lines were approved by the Research Ethics Committees of Faculty of Pharmacy, Cairo University (PI2254) and Theodor Bilharz Research Institute (PT525), respectively. All studies were conducted in agreement with the Association for Assessment and Accreditation of Laboratory Animal Care international expectations for animal care and use/ethics committees.
The immortalized rat Hepatic stellate cell line (HSC-T6), was a kind gift from Prof. Scott Friedman (Mount Sinai Hospital, New York, NY, USA). Meanwhile, primary hepatocytes were isolated using two-step collagenase perfusion technique, as previously described by Shen et al.48 The viability of isolated hepatocytes was examined using trypan blue exclusion test and cells with viability greater than 90% were cultured in 96 well tissue culture plates precoated with rat tail type I collagen.
The HSC-T6 and primary hepatocytes were cultured in DMEM supplemented with 10% FBS, 50 U/mL penicillin and 50 μg/mL streptomycin, and were incubated at 37°C in an atmosphere of 5% CO2. The HSC-T6 cells were activated using 10 ng/mL TGF-β1 for 24 h at 37°C.
The HSC-T6 (1×10⁴ cells/well) and primary hepatocytes (5×10³ cells/well) were seeded in 96-well plates and incubated for 24 h in starvation media. The cells were then treated with GA, plain systems (ANCNP, CACNP, and CACNP/VA), GA-ANCNP, GA-CACNP, and GA-CACNP/VA at concentration of 1–10 µg/mL for 48 h. The SRB assay was performed to investigate the cell cytotoxicity.49 Briefly, the cells were fixed with 50% trichloroacetic acid solution for 1 h at 4°C, then rinsed with tap water and stained with 0.4% SRB dye. The unbound dye was then removed and the optical density was measured at 550 nm using a microplate ELISA reader (ELX 808-Biotek, USA). The cell viability was expressed as percentage viability from the control cells.
The in vitro cellular uptake assay was commenced by loading Rhodamine B, a fluorescence dye, into the systems (ANCNP, CACNP, and CACNP/VA), as previously reported by Boseila et al.50 The HSCs were seeded at 3×10⁵ cells/well in 6-well plates containing 12 mm coverslips and cultured for 24 h. The HSC-T6 cells were incubated with 10 µL of the systems for 4 h at 37°C. The experiment was terminated by washing the HSC-T6 cells with ice-cold PBS for three times, the cells were then fixed with 10% formaldehyde and were examined under a fluorescence microscope (IX81, Olympus, Tokyo, Japan).
Furthermore, the cellular uptake of optimized systems and free GA solution was quantitatively determined using high performance liquid chromatography (HPLC, Shimadzu HPLC, Japan). Briefly, the aHSC-T6 cells were cultured in 12 well culture plates (1×10⁵ cells/well). After 24 h, the aHSC-T6 cells were incubated with the optimized systems and free GA solution at 37°C for 4 h. After which, the NP suspension was aspirated and the cells were washed three times with 1 mL ice-cold PBS. The cells were treated with 250 µL 0.5% Triton-X 100 for 30 min and cell suspension was harvested. The mobile phase was then added to the collected cell suspension and the samples were vortexed for 3 min, sonicated for 5 min, and centrifuged for 10 min (4°C) at 15,000 rpm. The cell lysate was collected and injected into the HPLC for intracellular GA determination using the previously validated protocol.51,52 Briefly, samples were separated on a Phenomenex bondclone 10, C18, 3.9 x 300 mm, 5 µm particle size column (Torrance, CA, USA) using a mobile phase of acetonitrile (20% v/v): water (80% v/v). The flow rate of the mobile phase was adjusted to 0.8 mL/min; 20 µL samples were then injected and determined using UV detection at λmax of 272 nm. The HPLC method was validated, according to a preconstructed calibration curve (concentration range = 0.2–24 μg/mL, coefficient R2 = 0.999, LOQ = 0.2 µg/mL, and n=3). The recorded inter- and intra-day %RSD were in the range of 0.45% to 5.97% and 0.47% to 5.44%, respectively. Meanwhile, the inter- and intra-day recovery percentage were in the range of 100.38% to 111.23% and 99.88% to 112.37%, respectively.
Total RNA was extracted from the aHSC-T6 using an RNeasy Mini Kit (Qiagen, Dusseldorf, Germany) and quantified using a nanodrop (Thermo Fischer Scientific, USA). One microgram of RNA was reverse transcribed into Complementary DNA (cDNA) (Thermo Fischer Scientific, USA), which was then amplified using SYBR Green (Thermo Fischer Scientific, USA) with the primers’ sequence listed in Table 5. The obtained amplification data were analyzed using the 2−ΔΔCt method53 and normalized to Glyceraldehyde 3-phosphate dehydrogenase (GAPDH).
 |
Table 5 Primers Used for qRT-PCR |
The migration of aHSCs was investigated using the wound healing scratch assay.54 The aHSCs (1×10⁵ cells/well) were cultured in 12 well tissue culture plates for 24 h. A scratch was made using a sterile 200 μL pipette tip, the cells were then washed with PBS and incubated with starvation medium (control), plain CNPs, free GA, GA-ANCNP, GA-CACNP, and GA-CACNP/VA. The scratched area was photographed (Primovert Carl-Zeiss, Jena, Germany) immediately and 48 h after scratching (×40 magnification). The cell migration into the scratched area was calculated and expressed as percentage of the wound-healed area from the initial scratch area.
The apoptotic effects of systems on the aHSCs were evaluated using DAPI fluorescent dye.55,56 Briefly, the aHSC-T6 cells were seeded in 12 well culture plates (1 × 10⁵ cells/well) for 24 h. The cells were then exposed to medium (control), plain CNPs, free GA, GA-ANCNP, GA-CACNP, and GA-CACNP/VA for 48 h. Next, the cells were washed with PBS and stained with 0.5 μg/mL DAPI for 5 min. The apoptosis signs of nucleus condensation or chromatin fragmentation were detected under fluorescence microscope (IX81, Olympus, Tokyo, Japan).
The targeting efficiencies of ANCNP, CACNP, and CACNP/VA were evaluated in vivo using CLSM. Rats were randomly divided into 3 groups (6 rats each) and intravenously injected with the systems labeled with Rhodamine B. Four hours postadministration, the rats were sacrificed by decapitation under anesthesia. The main vital organs (liver, kidney, spleen, and lung) were excised and examined (×10 magnification) using CLSM (710, Carl Zeiss, Jena, Germany). The confocal images were taken and processed using ZEN software, version 2.3 (Carl Zeiss, Jena, Germany). The mean fluorescence intensity percentage of each organ was then determined, where Rhodamine B fluorescence was detected at λex of 488 nm and λem of 620 nm.50,56
Statistical Analyses
All experiments were conducted in triplicate and data were expressed as mean ± standard deviation (SD). The statistical analyses were performed using one-way analysis of variance (ANOVA) followed by Tukey’s multiple-comparison post hoc test (GraphPad Software version 5.03, San Diego, California, USA). The significance level was set as p < 0.05.
Results and Discussion
Preparation and Characterization of the GA-ANCNPs
PS, PDI, and ZP
NPs are characterized by low PS, as well as high stability inside the body. The high stability is attributed to the fact that they can withstand the physiological barriers; thus, their circulation time inside the body is prolonged.6 Additionally, the miniaturized size of NPs, as well as their ability to escape the reticuloendothelial system, can promote their intracellular uptake and passive translocation to the liver.12 In this study, the mean PS of all the formulated systems ranged from 269.75 ± 7.71 nm (BB11) to 313.25 ± 0.49 nm (BB15), as listed in Table 2. This small PS of the CNPs could be attributed to the fact that the combination of both phospholipid and zein in the formulation of the NPs results in the formation of small-sized compact structures due to the interaction between the alkyl chain of the phospholipid and zein via hydrogen bonding, hydrophobic effects, and electrostatic interaction.57 Additionally, the homogenization step during the NPs preparation could have played an additional role in minimizing the PS.
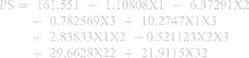
The statistical analysis of the results by ANOVA suggested the linear model to be the suitable model for the statistical analysis of the independent factors affecting the PS. The standardized effect of the coded independent variables on the PS could be explained by the following polynomial equation and Pareto chart (Figure 1A):

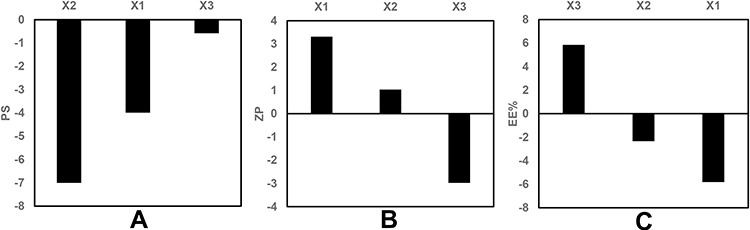 |
Figure 1 Pareto chart showing the standardized effect of independent variables on (A) PS, (B) ZP, (C) EE% of GA-ANCNPs. |
The linear model revealed that all the tested variables showed no significant effect on the PS (p > 0.05).
In the obtained results, as shown in Table 2, the PDI varied from 0.16 ± 0.01 (BB5 and BB8) to 0.25 ± 0.01 (BB1), which indicates the homogeneity of the NPs.47 The ANOVA indicated no significant correlations between the formulation variables and the PDI values (p > 0.05).
However, ZP values reflect the total surface charge on the particles, which determines the stability of the formulated nanodispersions. Higher ZP values indicate higher surface charge, which prevents the aggregation of the NPS and confirms the physical stability of the preparations.50,58 As shown in Table 2, the ZP values of all the formulated systems varied between −15.75 ± 1.34 (BB17) and −27.60 ± 1.13 mV (BB3). The negative ZP values for all the formulated NPs are attributed mainly to their phospholipid content.
In this study, the ZP is discussed based on its absolute value. The ZP evaluation was best fitted to the linear model. The standardized effect of the coded independent variables on the ZP could be explained by the following polynomial equation and Pareto chart (Figure 1B):

ANOVA tests were employed, and the results reveal that the drug loading (X1), as well as the phospholipid to zein ratio (X3), had significant effects on the ZP at p < 0.05. As shown in the 3D surface plot (Figure 2A), increasing the phospholipid to zein ratio showed a positive effect on the ZP of the formulated NPs due to the increment in the amount of the negatively charged phospholipid incorporated into the system.57
 |
Figure 2 Response surface plots for the effects of drug loading and phospholipid: zein ratio on (A) ZP and (B) EE% of GA-ANCNPs.Abbreviations: ZP, Zeta potential; EE%, Entrapment efficiency percentage; GA, Gallic acid; ANCNP, Anionic zein/phospholipid composite nanoparticles. |
However, increasing the drug load resulted in lower absolute values of ZP, as observed in Figure 2A. This could be attributed to the fact that an increase in the GA amount may reduce the pH of the medium (increase H+ concentration), which may neutralize some of the negative charges on the phospholipid, thereby decreasing its negativity; thus, the overall ZP value of the NPs is lowered.59
Entrapment Efficiency
The EE% of GA in the different preparations ranged from 38.30 ± 2.12% w/w (BB17) to 64.50 ± 1.27% w/w (BB3), as listed in Table 2. The ANOVA suggested the linear model to be the most suitable model to explain the data, and the results reveal that only drug loading (X1) and phospholipid to zein ratio (X3) had a significant effect on the EE% at p < 0.05. The standardized effect of the coded independent variables on the EE% could be explained by the following polynomial equation and Pareto chart (Figure 1C):

Figure 2B shows that an increase in the drug load resulted in a decrease in EE%. This can be related to the exact capacity of the formulated NP vesicles for drug incorporation. At a constant level of phospholipid and zein, an exact number of NPs is formulated with a certain drug incorporation capacity. Thus, increasing the number of GA molecules would fill the vesicles till maximum, and any excess molecules would not be encapsulated. This would result in a higher percentage of the free unencapsulated drug and in turn, lower EE%.60
On the contrary, increasing the phospholipid to zein ratio resulted in the formulation of NPs with higher EE% of GA, as shown in Figure 2B. This could be attributed to the synergistic mutualism between phospholipid and zein in promoting GA encapsulation. Phospholipid may endorse the encapsulation of both the free and adsorbed GA on the zein surface inside the hybrid NPs by forming shell-like structures surrounding the zein core. This improves the stability of the formulated zein NPs and prevents drug leakage to the external phase.57 In addition, the electrostatic attraction between the negatively charged carboxylate group of free GA and the positively charged choline content of phospholipid could be another reason for the augmented GA encapsulation.20
Statistical Design Optimization
After the statistical analysis, the dependent variables were optimized to determine the formulation system that would yield NPs with the smallest PS, lowest PDI, highest ZP, and highest EE%. The Design Expert® software recommended a system composed of 5 mg GA, phospholipid to zein ratio of 4:1, and subjected to homogenization for 1 min with a desirability factor of 0.95. The suggested GA-ANCNP system was prepared and characterized in triplicate, which showed a mean PS of 265.36 ± 5.22 nm with a PDI of 0.20 ± 0.06 and ZP of −30.10 ± 2.40 mV, and the EE% was 61.99 ± 3.22% w/w.
Preparation and Characterization of the GA-CACNPs
To enhance HSCs passive targeting efficiency and facilitate NPs extravasation into the space of Disse, the size of the NPs should be smaller in diameter than the liver sinusoidal fenestrations (150–200 nm).50 Moreover, the formulation of cationic NPs may be superior to that of the anionic ones in the targeting of HSCs because the cationic NPs possess the ability to bind to the negatively charged phospholipids in cell membranes and bypass the engulfment by endothelial and Kupffer cells, which favorably tend to scavenge the anionic particles.28,29 Thus, based on previous formulation designs, statistical analysis, and optimization results, the most desirable system in the first design (optimized GA-ANCNPs) was integrated into another RSM design (D-optimal design) to produce CACNPs with smaller PS capable of VA coupling.
PS, PDI, and ZP
The mean PS of the prepared CACNPs was in the range of 161.15 ± 0.77 (DO18) to 317.9 ± 7.07 nm (DO8), as shown in Table 4, with several systems in the target size range (<200 nm) for enhanced drug delivery to HSCs.
The evaluation of the response values of PS (Y1) was appropriately matched with the quadratic model. The standardized effects of the coded independent variables and their interactions on the PS could be explained by the following polynomial equation and Pareto chart (Figure 3A):
 |
Figure 3 Pareto chart showing the standardized effect of independent variables and their interactions on (A) PS, (B) ZP, (C) EE% of GA-CACNPs. |
Applying ANOVA, only the interaction between the type of the positive charge inducer (X1) and the sonication time (X3) showed a significant effect on the PS at p < 0.05, as depicted in Figure 4C. PS was found to decrease as the sonication time increased from 60 to 150 s. However, at higher sonication time (>150 s), NPs with larger PS were formulated. This finding was observed in both types of positive charge inducer (SA or DDAB) at different degrees.
 |
Figure 4 (A) Response surface plot for the effects of amount of positive charge inducer and sonication time on ZP, Line plots for (B) the main effect of type of positive charge inducer (SA and DDAB) on EE%, (C) the interaction between type of positive charge inducer and sonication time on PS and (D) the interaction between type and amount of positive charge inducer on EE% of GA-CACNPs. |
Sonication energy is known to reduce PS as it creates cavitation bubbles that generate localized energy enough for the production of miniaturized particles.38 Subjecting the system to a prolonged sonication (up to 150 s) exposes the formulated NPs to higher sonication energy, which results in a further reduction in the PS. The higher PS obtained at higher sonication time (>150 s) could be attributed to the interactive forces created between different nano-particulates, which overcome the shearing effect of the sonication energy at the high surface area of the highly reduced PS. These interactive forces may cause particle agglomeration.59 Additionally, the high shearing force of the sonicator may create surface charges that induce further agglomeration and PS increment.61,62
The PDI values for all the prepared systems varied from 0.19 ± 0.02 (DO3) to 0.35 ± 0.08 (DO14), as shown in Table 4, indicating good homogeneity of the dispersion. Only DO8 system recorded high value of PDI (0.63), which indicates a wide range of PS distribution. Data manipulation via ANOVA showed that the model with all of its independent variables had no significant on the PDI values (Y2) (p > 0.05).
The ZP values of the prepared systems indicate that all the vesicles were positively charged, with ZP values varying between 20.35 ± 0.49 (DO3) and 52.90 ± 0.28 mV (DO10), as shown in Table 4.
Via statistical analysis, the ZP (Y3) values were best evaluated according to the linear model. The standardized effect of the coded independent variables on the ZP could be explained by the following polynomial equation and Pareto chart (Figure 3B):

The ANOVA test demonstrated that the amount of positive charge inducer (X2) was the only significant factor affecting the ZP values at p < 0.05. Increasing the positive charge inducer level resulted in higher ZP values, as shown in Figure 4A, due to their cationic nature, which increases the surface charge of the formulated nanovesicles.63
Entrapment Efficiency
The mean EE% for all the prepared systems ranged from 25.00 ± 2.54% w/w (DO6) to 67.30 ± 2.40% w/w (DO11), as presented in Table 4.
ANOVA statistical analysis selected the 2FI model for the analysis of the dependent variable Y4 (EE%). The standardized effect of the coded independent variables and their interactions on the EE% could be explained by the following polynomial equation and Pareto chart (Figure 3C):

The statistical analysis, as shown in Figure 4B and D, revealed a significant effect of the type of positive charge inducer (X1), as well as the interaction between the type (X1) and the amount of the positive charge inducer (X2) on the EE% at p < 0.05. The SA-based systems showed greater EE% than the DDAB-based ones. On the contrary, the positive impact of SA on the EE% can be related to the possible multiple-point polar interactions between GA and SA, which may promote the rigidity of the NPs structure and reduce the leakage of GA.64 Moreover, the highly hydrophobic nature of SA, present in the outer corona of the vesicles, may prevent the efflux of the hydrophilic drug (GA) from the formulated vesicles.65 However, the use of DDAB had a negative influence on the EE% due to its surfactant properties (HLB = 18.1) compared to SA (HLB = 7.9).66,67 It was reported by Yousry et al38 and Guinedi et al68 that surfactants with high HLB enhance drug leakage from vesicles into the aqueous phase, thus, decrease its EE%. The observed interaction between the type and amount of the positive charge inducers could be attributed to the same principle. Therefore, increasing the amount of SA greatly enhances the EE%, whereas an increase in the amount of DDAB significantly reduces the EE%, as presented in Figure 4D.
Statistical Design Optimization
The formulation variables were optimized using the Design Expert software based on the PS, PDI, ZP, and EE% constraints, as shown in Table 3. The software proposed an optimized GA-CACNP system containing 5 mg of GA with 4:1 phospholipid to zein ratio and 24.02 mg of SA. The program also suggested a sonication time of 162.98 s for the preparation and a final homogenization step for 1 min. The desirability factor of the optimized system was 0.72. The GA-CACNP was prepared and evaluated in triplicate. The mean observed PS was 165.00 ± 5.23 nm with PDI of 0.25 ± 0.04. Additionally, the average ZP and EE% were 42.31 ± 2.74 mV and 60.00 ± 3.11% w/w, respectively.
Preparation and Characterization of GA-CACNP/VA System
To impart active targeting ability to the optimized CACNP system, VA was coupled to the system after its preparation since HSCs can store about 80% of VA.30 VA aids surface binding with retinol-binding protein (RBP) receptors on HSCs, thereby offering NPs preferential access to aHSCs.11,31–33
In this study, the optimized GA-CACNP was successfully coupled with VA (retinoic acid) with a coupling efficiency of 69.5% w/w. El-Mezayen et al28 reported that the hydrophobic interaction between the lipophilic part of the retinoic acid and the lipophilic tail of the phospholipid is the main reason for the enhanced coupling efficiency of the system. This coupling resulted in an increment in PS from 165.00 to 192.00 nm, which confirms the attachment of VA to the NPs with a low PDI value (0.24), thus, revealing the uniformity of the developed system. On the contrary, the ZP was reduced from 42.00 to 32.33 mV due to the electrical attractive forces between the negatively charged carboxylic group of the retinoic acid and the positively charged polar head of SA in the optimized GA-CACNP system. This finding is in agreement with previous studies, which recorded an electrostatic interaction between VA and the positive surface charge of NPs.69,70 Moreover, the EE% of the optimized GA-CACNP system remained unchanged upon coupling with VA.
Further Characterization of the Optimized Systems
Transmission Electron Microscopy
The micrographs of the optimized systems (Figure 5) show the presence of miniaturized, distinct, and spherical vesicles in the nano-size range, which is very close; yet smaller than that measured using Malvern zeta sizer. This could probably be attributed to the tendency of shrinkage and collapse of hydrophilic shells upon drying samples during the TEM procedure.42 In addition to the fact that zetasizer analyses the average PS of the whole nanosuspension while TEM analyses the PS of individual NPs.71
 |
Figure 5 Transmission electron micrographs of (A) optimized GA-ANCNP, (B) optimized GA-CACNP and (C) GA-CACNP/VA (bar = 100 nm, magnification power= 60000X). |
It was also observed that the VA-coupled system (GA-CACNP/VA) showed particles larger than that of the optimized GA-CACNP, indicating the possible coupling of VA to GA-CACNP.
In vitro Drug Release Study
The in vitro release profiles for GA from its solution and optimized systems are shown in Figure 6. As shown in the figure, GA was completely released from its solution after 30 min via the dialysis membrane technique. However, the GA-ANCNP, GA-CACNP, and GA-CACNP/VA showed a fast release of GA within the first 2 h due to the surface drug followed by a more extended release profile of GA, where the cumulative percentages released after 24 h were only 69.05 ± 1.61%, 49.48 ± 6.10%, and 79.07 ± 1.92%, respectively. This extended release of GA from the various systems indicates that GA was encapsulated within the vesicles. CACNP showed less GA-release than ANCNP, and this could be ascribed to the high rigidity and hydrophobicity of the CACNP structure due to the SA inclusion into the NPs and the possible electrostatic interaction between the SA and GA, which could reduce the leakage of the hydrophilic drug (GA) from GA-CACNP.64,65 The faster release profile of GA observed in GA-CACNP/VA, as compared to GA-CACNP, could be related to the electrostatic interaction between SA and VA, which results in a reduced positivity of the vesicles. This could weaken the attraction force between the negatively charged GA and the positively charged vesicles, thus, facilitating its out-diffusion.63,65
 |
Figure 6 In vitro release profiles of GA from different systems relative to GA solution in phosphate buffer (pH 6.8). Results are expressed as means ± SD, n=3. |
Kinetic Analysis of the Drug Release Data
The GA release from all systems followed the Higuchi diffusion model, which showed the highest coefficient of determination in comparison to the other models. In addition, the Korsmeyer–Peppas model showed that n values of GA-ANCNPs and GA-CACNPs are in the range of 0.45 and 0.89. This indicates anomalous (non Fickian) transport where the release was controlled by a combination of diffusion and polymer relaxation effects, whereas GA-CACNP/VA shows n ≤ 0.45, which suggests a Fickian diffusion mechanism.44,45
Physical Stability of the Lyophilized Optimized CNPs
The use of NPs is usually limited by the associated physical and chemical instability, as well as their tendency to aggregate upon storage for extended durations. Thus, the formulated systems were freeze-dried and their physical stability was evaluated with regard to PS, PDI, ZP, and EE%. The recorded PS values were 272.26 ± 6.14, 174.51 ± 4.71, and 198.21 ± 3.1 nm, the PDI levels were 0.24 ± 0.10, 0.27 ± 0.12, and 0.27 ± 0.06, ZP values were −29.70 ± 4.10, 40.32 ± 1.15 and 30.59 ± 3.20 mV, and EE% were 62.20 ± 2.15, 60.90 ± 2.24, and 60.50 ± 1.16% w/w for GA-ANCNPs, GA-CACNPs, and GA-CACNP/VA, respectively. There were no significant differences in PS, PDI, ZP, and EE% results between the freshly prepared and lyophilized systems (p > 0.05). Lyophilization enables long-term storage of NPs via protecting them from physical and chemical instability. The stability of the dry cake formed could be attributed to the cryoprotectant activity during the freeze drying process.46
Fourier Transform Infrared Spectroscopy
Figure 7 shows the IR spectra of the retinoic acid, GA-CACNP, and GA-CACNP/VA systems. The principal peaks of the VA at 1685 and 1253 cm−1 are attributed to the C=O of the carboxylic group. Also, the spectrum of the VA shows an absorption band extending from 2746 to 3047 cm−1, which corresponds to the hydroxyl functional group (OH) of the carboxylic acid, in addition to a sharp peak at 2931 cm−1 for the C-H double bonds of the retinoic acid.72 Unfortunately, the characteristic bands of VA are not reliable enough to evaluate its coupling with the optimized GA-CACNP because the characteristic peaks of the GA-CACNP components (C=O, OH, C–H double bonds) are very similar to the spectrum of retinoic acid. However, the GA-CACNP/VA spectrum showed the appearance of a new peak at 2357 cm−1 and a shift in the trans out-of-plane bend of the retinoic acid from 960 to 948 cm−1. The appearance of the new peaks and the shift in the peaks indicate the hydrophobic interactions between the lipophilic part of the retinoic acid and the lipophilic tail of the lecithin, as well as the electrostatic attraction between the negatively charged hydroxyl group of the VA and the cationic surface charge of the NPs, as previously explained by El-Mezayen et al.28
 |
Figure 7 FTIR spectra of (A) VA, (B) optimized GA-CACNP system and (C) GA-CACNP/VA system. |
Differential Scanning Calorimetry
The DSC thermograms of GA, zein, phospholipid, SA, VA, sucrose, the lyophilized GA-CACNP/VA system, and its physical mixture are illustrated as follows in Figure 8:
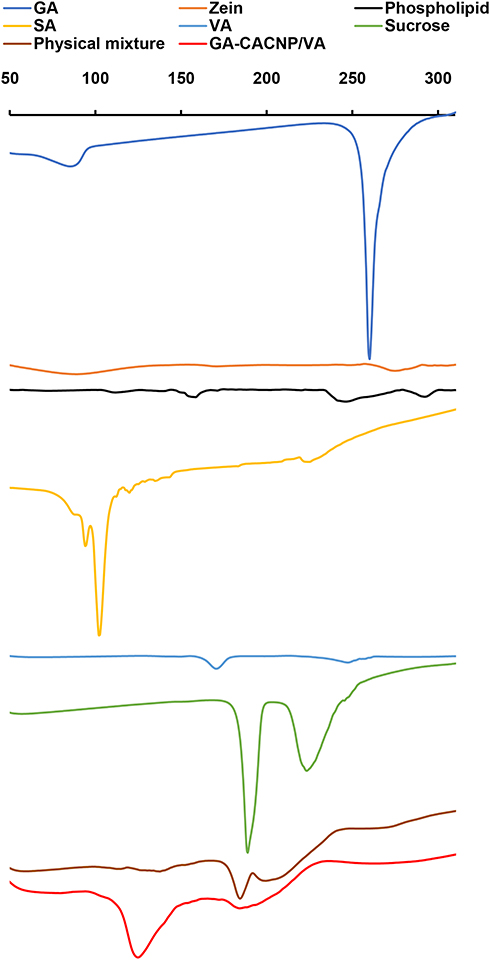 |
Figure 8 DSC thermograms of GA, zein, phospholipid, SA, VA, sucrose, physical mixture, and GA-CACNP/VA system. |
GA exhibits a sharp endothermic peak at 260°C, which refers to the melting point of the crystalline GA.73 Zein shows two broad endothermic peaks at 83°C and 280°C, which indicate its denaturation and melting temperatures, respectively.74 Phospholipid shows a mild endothermic peak at 153°C and another broad peak at 240°C. The first peak indicates hot movements of the phospholipid polar chains, whereas the other peak indicates its transition from the gel form to the liquid crystal state.75,76 SA and VA show endothermic peaks at 90°C (sharp) and 177°C (broad), respectively, which are consistent with those obtained by Lee et al77 and Berbenni et al.78 Sucrose shows two sharp endothermic peaks at 188°C and 223°C. This could be attributed to the melting of sucrose that begins at ~186–188ºC, which is then followed by decomposition between 200°C and 250°C.79
We observed the disappearance of the characteristic peak of GA in the thermograms of both the physical mixture and GA-CACNP/VA, respectively. This might be ascribed to the dilution effect of the drug in the samples.
Moreover, the characteristic peaks of zein, phospholipid, SA, and VA in both physical mixture and GA-CACNP/VA reduced with the appearance of a new peak at 125°C of lower intensity in the physical mixture, but higher and more prominent in the GA-CACNP/VA system. This new peak in the physical mixture might be attributed to the rise in temperature during the DSC procedure. Such increased temperature could have resulted in melting the phospholipid and partial formation of complex between the individual components.75,76
However, the strong prominent peak of GA-CACNP/VA could be owed to the reorganization of the components in the GA-CACNP/VA system in a state different from their original molecular structures and the possible formation of a strong complex. Such complexation could have been facilitated via the hydrophobic attractions, hydrogen bonds and electrostatic interactions between the various components of the GA-CACNP/VA. These findings are in agreement with Tadros and Al-mahallawi76 as well as Yanyu et al.75
Biological Activity Evaluations
Since aHSCs are considered as the main cells responsible for hepatic fibrosis progression, suppressing their activation and/or triggering their apoptosis represent an appealing approach for treating hepatic fibrosis.80 In this study, the HSC-T6 cell line was employed for the in vitro investigation of the antifibrotic potential of the optimized GA-loaded CNPs (namely; GA-ANCNP, GA-CACNP, and GA-CACNP/VA systems). HSC-T6 provides an acceptable model for elucidating the underlying mechanisms of HSC activation, as well as for investigating the potential therapeutic intervention.81
To validate the internalization of the NPs into aHSCs, we incubated the cells with Rhodamine B-loaded CNP for 4 h after which the cells were examined under a fluorescence microscope (Figure 9A). Rhodamine B was selected as a fluorescence marker to visualize the targeting capacity of the prepared system due to its solubility in water and ethanol, so it would mimic the encapsulation behavior of the hydrophilic compound (GA) in the system.12 We observed some red signals inside the HSC-T6 cells, indicating the internalization of the dye-loaded ANCNP and CACNP into the cells, whereas more intense signals appeared with the dye-loaded CACNP/VA.
 |
Figure 9 Effect of GA-CNPs on cellular uptake and cytotoxicity activities in aHSCs; (A) microscopic fluorescent image showing aHSCs uptake of Rhodamine-loaded-CNP, (B, C) cytotoxicity/antiproliferative activity of the free GA and GA-CNPs against (B) aHSCs and (C) primary hepatocytes after 48 h exposure. Each experiment is performed in triplicate (n=3). |
Furthermore, we quantitatively determined the intracellular GA concentrations in aHSCs using HPLC after 4 h of incubation with the different optimized GA-CNP systems or free GA solution. We showed that the intracellular GA concentrations were 15.55%, 24.45%, 46.6%, and 16.94% for GA-ANCNP, GA-CACNP, GA-CACNP/VA, and free GA solution, respectively. This demonstrates the comparable GA intracellular concentrations between GA-ANCNP and the free GA. However, the internalized GA concentrations in the cells treated with GA-CACNP and GA-CACNP/VA increased by 1.44- and 2.75-fold, respectively, relative to those treated with the free GA, which could be attributed to a positive charge impart to the system. Also, Hsu et al82 reported that cationic lipid nanoparticles are easily internalized into cells due to their ease of binding with nucleic acids or genes, as well as their interaction with the negatively charged phospholipids in the cell membrane.
Interestingly, coupling the optimized CACNP with VA showed a 1.9-fold increment in the GA uptake when compared to that of the CACNP solution. These results are consistent with those obtained by Zhang et al83 and Qiao et al,31 who reported that NPs decorated with VA are characterized by high HSC specificity, thereby showing high cellular-uptake efficiency.
The activation and proliferation of HSCs are considered the pivotal effectors in the progression of hepatic fibrosis, where TGF-β1 (the most potent fibrogenic cytokine) induces the proliferation of aHSCs, expression of α-smooth muscle actin (α-SMA), and synthesis of ECM proteins, including procollagen type I alpha 1 (COL1A1).81
So, we initially investigated the antiproliferative effects of the free GA, plain CNP systems, and optimized GA-CNPs on aHSCs using SRB assay. The cytotoxicity/anti-proliferative results were expressed as percentage viability from the control cells (Figure 9B). The cytotoxicity results reveal that the plain ANCNP had no effect on the HSC-T6 proliferation, whereas the plain CACNP, as well as the plain CACNP/VA, showed comparable concentration-dependent suppression in the HSC-T6 proliferation, as manifested by the IC50 values of 8.75 and 8.7 µg/mL, respectively.
Significant concentration-dependent mitigation in the aHSCs proliferation was recorded upon their treatment with GA-ANCNP, GA-CACNP, and GA-CACNP/VA (displaying IC50 values of 0.54, 2.65, and 1.75 µg/mL, respectively) in comparison to the free GA (IC50 = 5.17). It is noteworthy that GA-ANCNP exhibited a substantial reduction in the proliferation of aHSCs compared to the free GA, GA-CACNP, and GA-CACNP/VA.
All the formulations showed no cytotoxicity signs on the primary hepatocytes, where the reported percentage viabilities of the cells after GA, plain ANCNP, and GA-ANCNP treatments were above 90% over the selected range of the tested concentrations (1–10 μg/mL). This indicates their selective toxicity to aHSCs (Figure 9C). However, the treatment of hepatocytes with plain CACNP, plain CACNP/VA, GA-CACNP, and GA-CACNP/VA reduced their percentage viability to 72–75% over the selected range of the tested concentrations (1–10 μg/mL). This observed decrease in hepatocytes percentage viability could be attributed to the presence of SA in the CACNP system, which may have exhibited some level of toxicity on the hepatocytes.84
The plain ANCNP also showed no effect on the expression of the fibrogenic markers when compared to the untreated cells (data not shown), whereas the plain CACNP showed only a small suppression in α-SMA (13.64%) and induction in the caspase-3 (24.24%) mRNA expression levels. This could be attributed to the impact of SA, which was formerly reported to induce apoptosis in different cancer cell lines, especially breast,85 prostate86 and liver cancer cell lines.87 Besides, the VA-decorated CACNP without GA did not show any significant change in the expressions of fibrogenic markers compared to the plain CACNPs (data not shown) (Figure 10A–G).
 |
Figure 10 Antifibrogenic effects of GA-CNPs on fibrosis markers in aHSCs; (A&B) Representative graphs showing mRNA expression levels of activation [(A) TGF-β1 and (B) α-SMA] in aHSCs; (C) representative images of migration of aHSCs at 0 and 48 h treated with medium, plain CNPs,free GA, and GA-CNPs (x40 magnification); (D) representative graph showing the percentage of wound closure after 48 h; (E&F) representative graphs showing mRNA expression levels of (E) collagen synthesis (COL1A1) and (F) apoptosis (Caspase-3) markers in aHSCs; (G) representative fluorescent photomicrographs showing nuclear morphological changes of apoptotic nuclei (red arrows) in DAPI stained aHSC-T6 treated with medium, plain CNPs, free GA and GA-CNPs. Results are expressed as mean ± SD of three independent experiments, (n=3). ap < 0.05 vs control untreated aHSCs; bp < 0.05 vs GA-treated aHSCs; cp < 0.05 vs GA-ANCNP; dp < 0.05 vs GA-CACNP. |
The activation of HSCs was significantly reduced when the cells were treated with the free GA as indicated by the significant downregulation in the mRNA expressions of both activation markers, TGF-β1 and α-SMA, by 41.35% and 57.80%, respectively, as compared to the untreated activated cells. This is consistent with the previous findings.16 GA-ANCNP and GA-CACNP/VA showed significant inhibitory effects on the mRNA expressions of TGF-β1 (86.57% and 26.87%, respectively) and α-SMA (75% and 41.07%, respectively), whereas GA-CACNP exhibited a significant reduction only in the expression of TGF-β1 (28.36%) when compared to the free GA. Notably, GA-ANCNP showed a higher decrease in the expression levels of the activation markers, TGF-β1 (5.33- and 5.44-fold) and α-SMA (3.57- and 2.36-fold) when compared to GA-CACNP and GA-CACNP/VA, respectively (Figure 10A and B).
Upon activation of HSCs, they transdifferentiate into contractile myofibroblasts, where they migrate toward the injury sites, which results in the production of ECM.88 As shown in Figure 10C and D, GA-ANCNP, GA-CACNP, and GA-CACNP/VA significantly mitigated the migration of aHSCs toward the wounded area compared to GA. However, the percentage inhibition of cell migration was more pronounced in the cells treated with GA-ANCNP and GA-CACNP/VA. Furthermore, the treatment of aHSCs with GA-ANCNP, GA-CACNP, and GA-CACNP/VA showed marked regression in the mRNA COL1A1 expression levels by 45.12%, 26.83%, and 62.20%, respectively, relative to the free GA. Besides, GA-CACNP/VA considerably reduced the mRNA COL1A1 expression levels by 31.11% and 48.33% when compared to GA-ANCNP and GA-CACNP, respectively (Figure 10E).
The inhibition of the activation, proliferation, and migration of the aHSCs is reported to trigger apoptosis of myofibroblastic HSCs.32 Herein, GA showed minor induction in the mRNA expression of the apoptotic marker (Caspase-3), whereas GA-ANCNP upregulated the mRNA caspase-3 expression levels by 35.29% when compared to the free GA. Additionally, GA-CACNP and GA-CACNP/VA upregulated the mRNA caspase-3 expression levels when compared to the free GA (51.61% and 129.03%, respectively) and GA-ANCNP (27.72% and 92.93%, respectively). To confirm the induced apoptotic effects of GA-CACNP and GA-CACNP/VA on aHSCs, DAPI staining was performed. DAPI staining assay is known to form intense DNA-DAPI fluorescent complexes that result from selective DNA binding. We observed that the GA-CACNP/VA increased the typical apoptotic features in the nuclear morphology of aHSCs (including intensely stained, fragmented and condensed nuclei, and chromatin degradation), relative to GA-CACNP. Additionally, lesser apoptotic changes were depicted in the GA and GA-ANCNP treated cells (Figure 10F and G). This could be inflicted by the previously reported apoptotic inducing effects of SA,85 thus, resulting in the observed enhanced apoptotic actions of GA-CACNP and GA-CACNP/VA on aHSCs.
The results obtained herein reveal that GA-CACNP/VA exhibited a remarkable decrease in the α-SMA and COL1A1 mRNA expressions, as well as pronounced induction in the caspase-3 mRNA expressions when compared to GA-CACNP. These results are consistent with the previous studies,11,30,32 where VA-loaded NPs were reported to interact with RBPs via RBP receptors on HSCs to deliver siRNA, drugs, and compounds.
The mean fluorescence intensity percentage of each organ is shown in Figure 11A. Results obtained herein reveal that GA-ANCNP exhibited nonspecific organ biodistribution, where the reported mean fluorescence intensities were almost comparably distributed in all the tested vital organs. GA-CACNP showed the highest mean fluorescence intensity in the liver (51.65%), followed by the kidney (32.11%) and minimal fluorescence intensity in the spleen (7.17%) and lung (9.07%). The slightly high fluorescence level observed in the kidney could be attributed to its function as an eliminating organ for NPs.32 Renal failure is reported to be one of the major complications in cirrhotic patients,89 hence, the accumulation of CNPs in the kidneys might reflect an additional benefit, where GA has been demonstrated to play a protective role against renal injuries in experimental animals via its dual anti-inflammatory and antioxidant activities.90,91
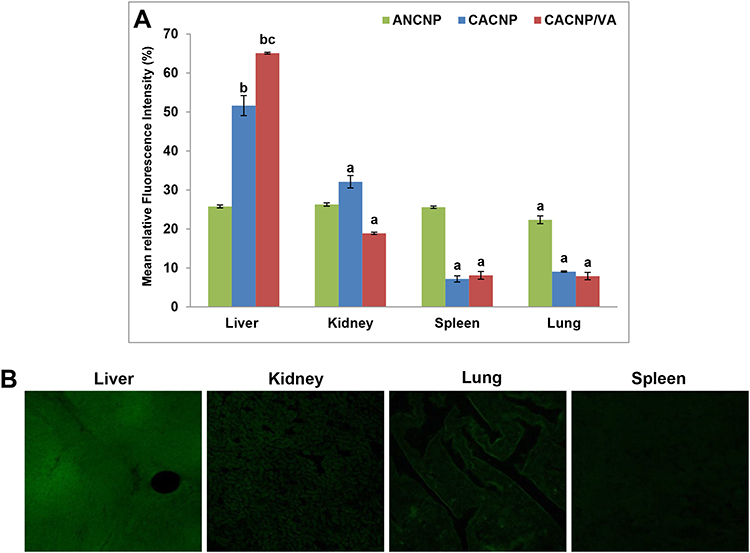 |
Figure 11 In vivo biodistribution of Rhodamine B-labelled-CNPs in vital organs; (A) representative graphs showing mean fluorescence intensity percentages of vital organs after treatment with Rhodamine B loaded-CNPs. Results are expressed as means ± SD, (n=3); (B) photomicrographs showing confocal laser scanning of vital organs treated with Rhodamine B-loaded-CACNP/VA. ap < 0.05 denotes statistically significant difference between organs vs liver within the same formula; bp < 0.05 vs Rhodamine B-loaded-ANCNP within liver; cp < 0.05 vs Rhodamine B-loaded-CACNP within liver. |
Furthermore, coupling VA to GA-CACNP spiked their hepatic accumulation, as indicated by the pronounced mean fluorescence of 65.01% with moderate renal uptake (18.89%) and trivial fluorescence in the lung and spleen. This indicates the major role of VA in the active targeting of GA-CACNP/VA to the liver (Figure 11B). Such enhanced hepatic accumulation and lower renal uptake of GA-CACNP/VA may boost the therapeutic efficacy of GA against liver fibrosis.
Conclusions and Future Studies
In the quest to find effective and safe treatments for hepatic fibrosis, zein/phospholipid composite NPs were successfully fabricated using antisolvent precipitation technique. The formulations and preparation parameters were comprehensively optimized using RSM. Nanosized (265.36 nm) anionic system “GA-ANCNP” with high GA encapsulation were fabricated. The GA-ANCNPs were integrated into another design to further reduce the PS below 200 nm and confer a positive charge to the formulation with the aim of enhancing its passive liver-targeting behavior. The optimized cationic system “GA-CACNP” was finally coupled with VA “GA-CACNP/VA” to promote an additional active liver-targeting behavior in the system. The following findings were obtained.
The GA-ANCNPs were passively uptaken by aHSCs. They also blocked the HSCs activation efficiently, mitigated collagen deposition, and induced aHSCs clearance to a moderate extent. However, they showed relatively large PS (265 nm), cellular uptake comparable to that of free GA, and low hepatic selectivity. On the contrary, both GA-CACNP and GA-CACNP/VA showed small PS (165 and 192 nm, respectively), exhibited higher cellular internalization via passive and active targeting, respectively, when compared to the free GA, as well as GA-ANCNP. Both systems acted mainly by triggering the apoptosis of aHSCs, repressing collagen deposition, and, to a lesser extent, inhibiting the activation of HSCs. They also showed higher selective distribution in the liver. Notably, GA-CACNP/VA exhibited superior effects compared to GA-CACNP as regards the reduction in α-SMA and COL1A1 expression and induction of caspase-3 mRNA.
Collating the results of the three investigated nanoparticle systems, GA-CACNP/VA was shown to be the best suitable candidate for specific and controlled delivery of GA to aHSCs, where the previously performed in vitro data are very promising. However, there is a need for further in vivo experiments to evaluate the safety and efficacy of the CACNP/VA in the treatment of hepatic fibrosis.
Abbreviations
ANOVA, Analysis of variance; ANCNPs, Anionic composite nanoparticles; aHSCs, activated Hepatic stellate cells; cDNA, Complementary DNA; COL1A1, Collagen type I; CNPs, Composite nanoparticles; CACNPs, Cationic composite nanoparticles; DAPI, 4ʹ,6-diamidino-2-phenylindole; DMEM, Dulbecco’s Modified Eagle’s Medium; DDAB, Didodecyldimethylammonium bromide; DMSO, Dimethyl sulfoxide; DSC, Differential Scanning Calorimetry; ECM, Extracellular matrix; EE%, Entrapment efficiency percentage; FBS, Fetal bovine serum; FTIR, Fourier transform infrared spectroscopy; GA, Gallic acid; GAPDH, Glyceraldehyde 3-phosphate dehydrogenase; HPLC, High performance liquid chromatography; HSC, Hepatic stellate cell; KH2PO4, Potassium dihydrogen phosphate; Na2HPO4, Disodium hydrogen phosphate; NPs, Nanoparticles; PBS, Phosphate buffer saline; PDI, Polydispersity index; PS, Particle size; qRT-PCR, Quantitative Real-Time Polymerase Chain Reaction System; RBP, Retinol binding protein; RSM, Response surface methodology; SA, Stearylamine; SEM, Standard error of the means; SRB, Sulphorhodamine B assay; TEM, Transmission electron microscopy; TGF-β1, Transforming growth factor-β1; VA, Vitamin A; ZP, Zeta potential; α-SMA, α-smooth muscle actin; %RSD, Percentage relative standard deviation.
Acknowledgment
The authors would like to appreciate the great help and efforts offered by Assistant lecturer, Mohamed Ahmed Naseef Soliman (Pharmaceutics and Industrial Pharmacy Department, Faculty of Pharmacy, Cairo University) in the formulation procedure and the in vivo evaluation.
Author Contributions
All authors made substantial contributions to conception and design, acquisition of data, or analysis and interpretation of data; took part in drafting the article or revising it critically for important intellectual content; agreed to submit to the current journal; gave final approval of the version to be published; and agree to be accountable for all aspects of the work.
Funding
This research did not receive any specific grant from funding agencies in the public, commercial, or not-for-profit sectors.
Disclosure
The authors report no conflicts of interest for this work.
References
1. Ge PS, Runyon BA, Campion EW. Treatment of patients with cirrhosis. N Engl J Med. 2016;375(8):767–777. doi:10.1056/NEJMra1504367
2. Lee UE, Friedman SL. Mechanisms of hepatic fibrogenesis. Best Pract Res Clin Gastroenterol. 2011;25(2):195–206. doi:10.1016/j.bpg.2011.02.005
3. Yoon YJ, Friedman SL, Lee YA. Antifibrotic therapies: where are we now? Semin Liver Dis. 2016;36(01):87. doi:10.1055/s-0036-1571295
4. Higashi T, Friedman SL, Hoshida Y. Hepatic stellate cells as key target in liver fibrosis. Adv Drug Deliv Rev. 2017;121:27–42. doi:10.1016/j.addr.2017.05.007
5. Vasir JK, Reddy MK, Labhasetwar VD. Nanosystems in drug targeting: opportunities and challenges. Curr Nanosci. 2005;1(1):47–64. doi:10.2174/1573413052953110
6. Nagarwal RC, Kant S, Singh PN, Maiti P, Pandit JK. Polymeric nanoparticulate system: a potential approach for ocular drug delivery. J Controlled Release. 2009;136(1):2–13. doi:10.1016/j.jconrel.2008.12.018
7. Bartneck M, Warzecha KT, Tacke F. Therapeutic targeting of liver inflammation and fibrosis by nanomedicine. Hepatobiliary Surg Nutr. 2014;3(6):364.
8. Surendran SP, Thomas RG, Moon MJ, Jeong YY. Nanoparticles for the treatment of liver fibrosis. Int J Nanomedicine. 2017;12:6997. doi:10.2147/IJN.S145951
9. Fan Q, Zhang C, Qiao J, et al. Extracellular matrix-penetrating nanodrill micelles for liver fibrosis therapy. Biomaterials. 2020;230:119616. doi:10.1016/j.biomaterials.2019.119616
10. Giannitrapani L, Soresi M, Bondì ML, Montalto G, Cervello M. Nanotechnology applications for the therapy of liver fibrosis. World J Gastroenterol. 2014;20(23):7242. doi:10.3748/wjg.v20.i23.7242
11. Hassan R, Tammam SN, El Safy S, et al. Prevention of hepatic stellate cell activation using JQ1-and atorvastatin-loaded chitosan nanoparticles as a promising approach in therapy of liver fibrosis. Eur J Pharm Biopharm. 2019;134:96–106. doi:10.1016/j.ejpb.2018.11.018
12. Lai LF, Guo HX. Preparation of new 5-fluorouracil-loaded zein nanoparticles for liver targeting. Int J Pharm. 2011;404(1–2):317–323. doi:10.1016/j.ijpharm.2010.11.025
13. Ercisli S, Orhan E. Chemical composition of white (Morus alba), red (Morus rubra) and black (Morus nigra) mulberry fruits. Food Chem. 2007;103(4):1380–1384. doi:10.1016/j.foodchem.2006.10.054
14. Kim Y. Antimelanogenic and antioxidant properties of gallic acid. Biol Pharm Bull. 2007;30(6):1052–1055. doi:10.1248/bpb.30.1052
15. Chen Y, Zhou Z, Mo Q, Zhou G, Wang Y. Gallic acid attenuates dimethylnitrosamine-induced liver fibrosis by alteration of smad phosphoisoform signaling in rats. Biomed Res Int. 2018;2018.
16. El-Lakkany NM, El-Maadawy WH, el-Din SHS, et al. Antifibrotic effects of gallic acid on hepatic stellate cells: in vitro and in vivo mechanistic study. J Tradit Complement Med. 2019;9(1):45–53. doi:10.1016/j.jtcme.2018.01.010
17. Wang J, Tang L, White J, Fang J. Inhibitory effect of gallic acid on CCl 4-mediated liver fibrosis in mice. Cell Biochem Biophys. 2014;69(1):21–26. doi:10.1007/s12013-013-9761-y
18. Kaur M, Velmurugan B, Rajamanickam S, Agarwal R, Agarwal C. Gallic acid, an active constituent of grape seed extract, exhibits anti-proliferative, pro-apoptotic and anti-tumorigenic effects against prostate carcinoma xenograft growth in nude mice. Pharm Res. 2009;26(9):2133–2140. doi:10.1007/s11095-009-9926-y
19. Alves AD, Mainardes RM, Khalil NM. Nanoencapsulation of gallic acid and evaluation of its cytotoxicity and antioxidant activity. Mater Sci Eng C. 2016;60:126–134. doi:10.1016/j.msec.2015.11.014
20. Abdou EM, Masoud MM. Gallic acid–PAMAM and gallic acid–phospholipid conjugates, physicochemical characterization and in vivo evaluation. Pharm Dev Technol. 2018;23(1):55–66. doi:10.1080/10837450.2017.1344994
21. Bhattacharyya S, Ahammed SM, Saha BP, Mukherjee PK. The gallic acid–phospholipid complex improved the antioxidant potential of gallic acid by enhancing its bioavailability. AAPS PharmSciTech. 2013;14(3):1025–1033. doi:10.1208/s12249-013-9991-8
22. Dong J, Sun Q, Wang J. Basic study of corn protein, zein, as a biomaterial in tissue engineering, surface morphology and biocompatibility. Biomaterials. 2004;25(19):4691–4697. doi:10.1016/j.biomaterials.2003.10.084
23. Yang J, Hou Y, Ji G, et al. Targeted delivery of the RGD-labeled biodegradable polymersomes loaded with the hydrophilic drug oxymatrine on cultured hepatic stellate cells and liver fibrosis in rats. Eur J Pharm Sci. 2014;52:180–190. doi:10.1016/j.ejps.2013.11.017
24. Luo Y, Zhang B, Whent M, Yu LL, Wang Q. Preparation and characterization of zein/chitosan complex for encapsulation of α-tocopherol, and its in vitro controlled release study. Colloids Surf B Biointerfaces. 2011;85(2):145–152. doi:10.1016/j.colsurfb.2011.02.020
25. Wang H, Gong S, Lin Z, et al. In vivo biocompatibility and mechanical properties of porous zein scaffolds. Biomaterials. 2007;28(27):3952–3964. doi:10.1016/j.biomaterials.2007.05.017
26. Guo Y, Liu Z, An H, Li M, Hu J. Nano-structure and properties of maize zein studied by atomic force microscopy. J Cereal Sci. 2005;41(3):277–281. doi:10.1016/j.jcs.2004.12.005
27. Dai L, Sun C, Di Wang YG. The interaction between zein and lecithin in ethanol-water solution and characterization of zein–lecithin composite colloidal nanoparticles. PLoS One. 2016;11:11.
28. El-Mezayen NS, El-Hadidy WF, El-Refaie WM, Shalaby TI, Khattab MM, El-Khatib AS. Hepatic stellate cell-targeted imatinib nanomedicine versus conventional imatinib: a novel strategy with potent efficacy in experimental liver fibrosis. J Controlled Release. 2017;266:226–237. doi:10.1016/j.jconrel.2017.09.035
29. Poelstra K, Prakash J, Beljaars L. Drug targeting to the diseased liver. J Controlled Release. 2012;161(2):188–197. doi:10.1016/j.jconrel.2012.02.011
30. Sato Y, Murase K, Kato J, et al. Resolution of liver cirrhosis using vitamin A–coupled liposomes to deliver siRNA against a collagen-specific chaperone. Nat Biotechnol. 2008;26(4):431–442. doi:10.1038/nbt1396
31. Qiao J, Fan Q, Xing L, et al. Vitamin A-decorated biocompatible micelles for chemogene therapy of liver fibrosis. J Controlled Release. 2018;283:113–125. doi:10.1016/j.jconrel.2018.05.032
32. Duong HT, Dong Z, Su L, et al. The use of nanoparticles to deliver nitric oxide to hepatic stellate cells for treating liver fibrosis and portal hypertension. Small. 2015;11(19):2291–2304. doi:10.1002/smll.201402870
33. Hayashi K, Maruhashi T, Sakamoto W, Yogo T. Organic-inorganic hybrid hollow nanoparticles suppress oxidative stress and repair damaged tissues for treatment of hepatic fibrosis. Adv Funct Mater. 2018;28(13):1706332. doi:10.1002/adfm.201706332
34. Radwan SAA, ElMeshad AN, Shoukri RA. Microemulsion loaded hydrogel as a promising vehicle for dermal delivery of the antifungal sertaconazole: design, optimization and ex vivo evaluation. Drug Dev Ind Pharm. 2017;43(8):1351–1365. doi:10.1080/03639045.2017.1318899
35. Fahmy AM, El-Setouhy DA, Ibrahim AB, Habib BA, Tayel SA, Bayoumi NA. Penetration enhancer-containing spanlastics (PECSs) for transdermal delivery of haloperidol: in vitro characterization, ex vivo permeation and in vivo biodistribution studies. Drug Deliv. 2018;25(1):12–22. doi:10.1080/10717544.2017.1410262
36. Rashidi L, Vasheghani-Farahani E, Soleimani M, et al. A cellular uptake and cytotoxicity properties study of gallic acid-loaded mesoporous silica nanoparticles on Caco-2 cells. J Nanopart Res. 2014;16(3):2285. doi:10.1007/s11051-014-2285-6
37. Fernandes FHA, Salgado HRN. Gallic acid: review of the methods of determination and quantification. Crit Rev Anal Chem. 2016;46(3):257–265. doi:10.1080/10408347.2015.1095064
38. Yousry C, Fahmy RH, Essam T, El-Laithy HM, Elkheshen SA. Nanoparticles as tool for enhanced ophthalmic delivery of vancomycin: a multidistrict-based microbiological study, solid lipid nanoparticles formulation and evaluation. Drug Dev Ind Pharm. 2016;42(11):1752–1762. doi:10.3109/03639045.2016.1171335
39. Resende D, Lima SAC, Reis S. Nanoencapsulation approaches for oral delivery of vitamin A. Colloids Surf B Biointerfaces. 2020;193:111121. doi:10.1016/j.colsurfb.2020.111121
40. Patil AG, Jobanputra AH. Formulation, characterization and evaluation of a thermoresponsive in situ gel containing gallic acid-loaded chitosan nanoparticles for the treatment of periodontal disease. J Bionanoscience. 2015;9(5):401–408. doi:10.1166/jbns.2015.1324
41. Pathan IK, Patel RK, Bhandari A. Standardization development and validation of spectrophotometric method for simultaneous estimation of embelin and gallic acid as individual and in combination in ayurvedic churna formulation. Asian J Pharm Clin Res. 2013;6(5):170–175.
42. Wang Y, Tan Y. Enhanced drug loading capacity of 10-hydroxycamptothecin-loaded nanoparticles prepared by two-step nanoprecipitation method. J Drug Deliv Sci Technol. 2016;36:183–191. doi:10.1016/j.jddst.2016.09.012
43. Higuchi T. Mechanism of sustained‐action medication. Theoretical analysis of rate of release of solid drugs dispersed in solid matrices. J Pharm Sci. 1963;52(12):1145–1149. doi:10.1002/jps.2600521210
44. Korsmeyer RW, Gurny R, Doelker E, Buri P, Peppas NA. Mechanisms of solute release from porous hydrophilic polymers. Int J Pharm. 1983;15(1):25–35. doi:10.1016/0378-5173(83)90064-9
45. Peppas NA, Sahlin JJ. A simple equation for the description of solute release. III. Coupling of diffusion and relaxation. Int J Pharm. 1989;57(2):169–172. doi:10.1016/0378-5173(89)90306-2
46. Shaikh MV, Kala M, Nivsarkar M. Formulation and optimization of doxorubicin loaded polymeric nanoparticles using Box-Behnken design: ex-vivo stability and in-vitro activity. Eur J Pharm Sci. 2017;100:262–272. doi:10.1016/j.ejps.2017.01.026
47. Naseef MA, Ibrahim HK, Nour SAE. Solid form of lipid-based self-nanoemulsifying drug delivery systems for minimization of diacerein adverse effects: development and bioequivalence evaluation in albino rabbits. AAPS PharmSciTech. 2018;19(7):3097–3109. doi:10.1208/s12249-018-1138-5
48. Shen L, Hillebrand A, Wang DQ, Liu M. Isolation and primary culture of rat hepatic cells. J Vis Exp. 2012;64:e3917.
49. Vichai V, Kirtikara K. Sulforhodamine B colorimetric assay for cytotoxicity screening. Nat Protoc. 2006;1(3):1112. doi:10.1038/nprot.2006.179
50. Boseila AA, Abdel-Reheem AY, Basalious EB. Design of bile-based vesicles (BBVs) for hepatocytes specific delivery of Daclatasvir: comparison of ex-vivo transenterocytic transport, in-vitro protein adsorption resistance and HepG2 cellular uptake of charged and β-sitosterol decorated vesicles. PLoS One. 2019;14:7. doi:10.1371/journal.pone.0219752
51. Derakhshandeh K, Hochhaus G, Dadashzadeh S. In-vitro cellular uptake and transport study of 9-nitrocamptothecin PLGA nanoparticles across Caco-2 cell monolayer model. Iran J Pharm Res. 2011;10(3):425.
52. Kardani K, Gurav N, Solanki B, Patel P, Patel B. RP-HPLC method development and validation of gallic acid in polyherbal tablet formulation. J Appl Pharm. 2013;3(5):37.
53. Livak KJ, Schmittgen TD. Analysis of relative gene expression data using real-time quantitative PCR and the 2-ΔΔCt method. Methods. 2001;25(4):402–408. doi:10.1006/meth.2001.1262
54. Martinotti S, Ranzato E. Scratch wound healing assay. 2019.
55. Siddiqui S, Ahmad E, Gupta M, et al. Cissus quadrangularis Linn exerts dose‐dependent biphasic effects: osteogenic and anti‐proliferative, through modulating ROS, cell cycle and Runx2 gene expression in primary rat osteoblasts. Cell Prolif. 2015;48(4):443–454. doi:10.1111/cpr.12195
56. Radwan SAA, El-Maadawy WH, ElMeshad AN, Shoukri RA, Yousry C. Impact of reverse micelle loaded lipid nanocapsules on the delivery of gallic acid into activated hepatic stellate cells: a promising therapeutic approach for hepatic fibrosis. Pharm Res. 2020. doi:10.1007/s11095-020-02891-z
57. Dai L, Sun C, Li R, Mao L, Liu F, Gao Y. Structural characterization, formation mechanism and stability of curcumin in zein-lecithin composite nanoparticles fabricated by antisolvent co-precipitation. Food Chem. 2017;237:1163–1171. doi:10.1016/j.foodchem.2017.05.134
58. Abdelbary AA, AbouGhaly MH. Design and optimization of topical methotrexate loaded niosomes for enhanced management of psoriasis: application of Box–Behnken design, in-vitro evaluation and in-vivo skin deposition study. Int J Pharm. 2015;485(1–2):235–243. doi:10.1016/j.ijpharm.2015.03.020
59. Aulton ME. Pharmaceutics: The Science of Dosage Form Design. Churchill livingstone; 2002.
60. Zhang W, Li X, Ye T, et al. Design, characterization, and in vitro cellular inhibition and uptake of optimized genistein-loaded NLC for the prevention of posterior capsular opacification using response surface methodology. Int J Pharm. 2013;454(1):354–366. doi:10.1016/j.ijpharm.2013.07.032
61. Dangi R, Shakya S. Preparation, optimization and characterization of PLGA nanoparticle. Int J Pharm Life Sci. 2013;4(7):2810–2818.
62. Tripathi A, Gupta R, Saraf SA. PLGA nanoparticles of anti tubercular drug: drug loading and release studies of a water in-soluble drug. Int J Pharm Tech Res. 2010;2(3):2116–2123.
63. Pardeshi CV, Belgamwar VS, Tekade AR, Surana SJ. Novel surface modified polymer–lipid hybrid nanoparticles as intranasal carriers for ropinirole hydrochloride: in vitro, ex vivo and in vivo pharmacodynamic evaluation. J Mater Sci Mater Med. 2013;24(9):2101–2115. doi:10.1007/s10856-013-4965-7
64. Cockbain EG, Schulman JH. Molecular interaction in monolayers. Association between amines and organic acids. Trans Faraday Soc. 1939;35:716–727. doi:10.1039/tf9393500716
65. Manjunath K, Venkateswarlu V. Pharmacokinetics, tissue distribution and bioavailability of clozapine solid lipid nanoparticles after intravenous and intraduodenal administration. J Controlled Release. 2005;107(2):215–228. doi:10.1016/j.jconrel.2005.06.006
66. Silva AL, Marcelino HR, Veríssimo LM, Araujo IB, Agnez-Lima LF, Do Egito ES. Stearylamine-containing cationic nanoemulsion as a promising carrier for gene delivery. J Nanosci Nanotechnol. 2016;16(2):1339–1345. doi:10.1166/jnn.2016.11671
67. Proverbio ZE, Bardavid SM, Arancibia EL, Schulz PC. Hydrophile–lipophile balance and solubility parameter of cationic surfactants. Colloids Surf a Physicochem Eng Asp. 2003;214(1–3):167–171. doi:10.1016/S0927-7757(02)00404-1
68. Guinedi AS, Mortada ND, Mansour S, Hathout RM. Preparation and evaluation of reverse-phase evaporation and multilamellar niosomes as ophthalmic carriers of acetazolamide. Int J Pharm. 2005;306(1–2):71–82. doi:10.1016/j.ijpharm.2005.09.023
69. Kim D, Jeong Y, Choi C, et al. Retinol-encapsulated low molecular water-soluble chitosan nanoparticles. Int J Pharm. 2006;319(1–2):130–138. doi:10.1016/j.ijpharm.2006.03.040
70. Wang JJ, Zeng ZW, Xiao RZ, et al. Recent advances of chitosan nanoparticles as drug carriers. Int J Nanomedicine. 2011;6:765.
71. Dahiya S, Rani R, Dhingra D, Kumar S, Dilbaghi N. Conjugation of epigallocatechin gallate and piperine into a zein nanocarrier: implication on antioxidant and anticancer potential. Adv Nat Sci. 2018;9(3):035011.
72. Shakiba E, Khazaei S, Hajialyani M, Astinchap B, Fattahi A. Preparation and in vitro characterization of retinoic acid-loaded poly (ε-caprolactone)-poly (ethylene glycol)-poly (ε-caprolactone) micelles. Res Pharm Sci. 2017;12(6):465. doi:10.4103/1735-5362.217427
73. Neo YP, Ray S, Jin J, et al. Encapsulation of food grade antioxidant in natural biopolymer by electrospinning technique: a physicochemical study based on zein–gallic acid system. Food Chem. 2013;136(2):1013–1021. doi:10.1016/j.foodchem.2012.09.010
74. Sun C, Dai L, Liu F, Gao Y. Dynamic high pressure microfluidization treatment of zein in aqueous ethanol solution. Food Chem. 2016;210:388–395. doi:10.1016/j.foodchem.2016.04.138
75. Yanyu X, Yunmei S, Zhipeng C, Qineng P. The preparation of silybin–phospholipid complex and the study on its pharmacokinetics in rats. Int J Pharm. 2006;307(1):77–82. doi:10.1016/j.ijpharm.2005.10.001
76. Tadros MI, Al-mahallawi AM. Long-circulating lipoprotein-mimic nanoparticles for smart intravenous delivery of a practically-insoluble antineoplastic drug: development, preliminary safety evaluations and preclinical pharmacokinetic studies. Int J Pharm. 2015;493(1–2):439–450. doi:10.1016/j.ijpharm.2015.08.011
77. Lee S, Lee J, Jang W, et al. Enhancement of stability and controlled drug release of lipid nanoparticles by modified solvent-evaporation method. Colloids Surf a Physicochem Eng Asp. 2016;508:294–300. doi:10.1016/j.colsurfa.2016.08.043
78. Berbenni V, Marini A, Bruni G, Cardini A. Thermoanalytical and spectroscopic characterisation of solid-state retinoic acid. Int J Pharm. 2001;221(1–2):123–141. doi:10.1016/S0378-5173(01)00677-9
79. Jawad R, Elleman C, Martin GP, Royall PG. Crystallisation of freeze-dried sucrose in model mixtures that represent the amorphous sugar matrices present in confectionery. Food Funct. 2018;9(9):4621–4634. doi:10.1039/C8FO00729B
80. Trautwein C, Friedman SL, Schuppan D, Pinzani M. Hepatic fibrosis: concept to treatment. J Hepatol. 2015;62(1):S15–S24. doi:10.1016/j.jhep.2015.02.039
81. Tacke F, Weiskirchen R. Update on hepatic stellate cells: pathogenic role in liver fibrosis and novel isolation techniques. Expert Rev Gastroenterol Hepatol. 2012;6(1):67–80. doi:10.1586/egh.11.92
82. Hsu S, Yu B, Wang X, et al. Cationic lipid nanoparticles for therapeutic delivery of siRNA and miRNA to murine liver tumor. Nanomedicine. 2013;9(8):1169–1180. doi:10.1016/j.nano.2013.05.007
83. Zhang Z, Wang C, Zha Y, et al. Corona-directed nucleic acid delivery into hepatic stellate cells for liver fibrosis therapy. ACS Nano. 2015;9(3):2405–2419. doi:10.1021/nn505166x
84. Lv H, Zhang S, Wang B, Cui S, Yan J. Toxicity of cationic lipids and cationic polymers in gene delivery. J Controlled Release. 2006;114(1):100–109. doi:10.1016/j.jconrel.2006.04.014
85. Badawi NM, Teaima MH, El-Say KM, Attia DA, El-Nabarawi MA, Elmazar MM. Pomegranate extract-loaded solid lipid nanoparticles: design, optimization, and in vitro cytotoxicity study. Int J Nanomedicine. 2018;13:1313. doi:10.2147/IJN.S154033
86. Hagen RM, Rhodes A, Ladomery MR. Conjugated linoleate reduces prostate cancer viability whereas the effects of oleate and stearate are cell line-dependent. Anticancer Res. 2013;33(10):4395–4400.
87. Tang PM, Zhang LD, Chan JY, et al. Apoptotic effects of stearic acid, an active compound isolated from Oldenandia diffusa, on human hepatoma cells. Res J Med Sci. 2007;1:30–38.
88. Greuter T, Shah VH. Hepatic sinusoids in liver injury, inflammation, and fibrosis: new pathophysiological insights. J Gastroenterol. 2016;51(6):511–519. doi:10.1007/s00535-016-1190-4
89. Cárdenas A. Hepatorenal syndrome: a dreaded complication of end-stage liver disease. Am J Gastroenterol. 2005;100(2):460–467. doi:10.1111/j.1572-0241.2005.40952.x
90. Ghaznavi H, Fatemi I, Kalantari H, et al. Ameliorative effects of gallic acid on gentamicin-induced nephrotoxicity in rats. J Asian Nat Prod Res. 2018;20(12):1182–1193. doi:10.1080/10286020.2017.1384819
91. Asci H, Ozmen O, Ellidag HY, Aydin B, Bas E, Yilmaz N. The impact of gallic acid on the methotrexate-induced kidney damage in rats. J Food Drug Anal. 2017;25(4):890–897. doi:10.1016/j.jfda.2017.05.001
 © 2020 The Author(s). This work is published and licensed by Dove Medical Press Limited. The full terms of this license are available at https://www.dovepress.com/terms.php and incorporate the Creative Commons Attribution - Non Commercial (unported, v3.0) License.
By accessing the work you hereby accept the Terms. Non-commercial uses of the work are permitted without any further permission from Dove Medical Press Limited, provided the work is properly attributed. For permission for commercial use of this work, please see paragraphs 4.2 and 5 of our Terms.
© 2020 The Author(s). This work is published and licensed by Dove Medical Press Limited. The full terms of this license are available at https://www.dovepress.com/terms.php and incorporate the Creative Commons Attribution - Non Commercial (unported, v3.0) License.
By accessing the work you hereby accept the Terms. Non-commercial uses of the work are permitted without any further permission from Dove Medical Press Limited, provided the work is properly attributed. For permission for commercial use of this work, please see paragraphs 4.2 and 5 of our Terms.