
Back to Journals » Journal of Hepatocellular Carcinoma » Volume 12
ZBED4: A Prognostic Biomarker and Therapeutic Target in Hepatocellular Carcinoma
Authors Ding J, Zou X, Huang X, Yu L, Hong H  , Lin T
Received 12 June 2025
Accepted for publication 12 August 2025
Published 21 August 2025 Volume 2025:12 Pages 1873—1892
DOI https://doi.org/10.2147/JHC.S546808
Checked for plagiarism Yes
Review by Single anonymous peer review
Peer reviewer comments 3
Editor who approved publication: Dr David Gerber
Jing Ding,1,* Xia Zou,1,* Xuefeng Huang,1,2 Le Yu,1 Huangming Hong,1 Tongyu Lin1
1Department of Medical Oncology, Sichuan Clinical Research Center for Cancer, Sichuan Cancer Hospital and Institute, Sichuan Cancer Center, University of Electronic Science and Technology of China, Chengdu, Sichuan, People’s Republic of China; 2Affiliated Hospital of North Sichuan Medical College, Nanchong, Sichuan, People’s Republic of China
*These authors contributed equally to this work
Correspondence: Tongyu Lin, Department of Medical Oncology, Sichuan Cancer Hospital and Institute, Sichuan Cancer Center, School of Medicine, University of Electronic Science and Technology of China, Chengdu, Sichuan, People’s Republic of China, Tel +86-28-85420656, Email [email protected]
Background: Hepatocellular carcinoma (HCC) is a prevalent lethal cancer that remains challenging to treat. Therefore, investigation of novel targets and therapeutic strategies is essential. The role of ZBED4 in cancer remains unclear.
Methods: Data were sourced from The Cancer Genome Atlas (TCGA), Gene Expression Omnibus (GEO), International Cancer Genome Consortium (ICGC), and Genomics of Drug Sensitivity in Cancer (GDSC) databases. Various web platforms and R software, have been utilized. Multiplex immunofluorescence was performed on a human HCC tissue microarray.
Results: High ZBED4 expression correlates with poor prognosis and immune cell infiltration in multiple cancers. ZBED4 is potentially involved in the regulation of the tumor environment by T cells, with a focus on CD8⁺ T cells. In HCC, tissues with elevated ZBED4 expression exhibit a higher prevalence of Tregs and neutrophils, whereas those with reduced ZBED4 expression show an increased abundance of CD8⁺ T cells, activated CD4⁺ T cells, gamma/delta T cells, and activated natural killer (NK) cells. Elevated ZBED4 expression in HCC patients is associated with a reduced response to immune checkpoint blockade but an improved response to chemotherapy and most targeted therapies. A multi-gene prognostic signature has been developed and confirmed across various HCC cohorts. Multiplex immunofluorescence study demonstrated that ZBED4 was linked to poor prognosis and negatively correlated with CD8⁺ T cell infiltration.
Conclusion: Our research elucidates the role of ZBED4, its strong link to immune infiltration, and its potential as a prognostic and therapeutic biomarker for HCC.
Plain Language Summary: Why was this study done?
Hepatocellular carcinoma (HCC) is a common and aggressive liver cancer with limited treatment options. The ZBED gene family plays roles in cancer progression, but the function of one member, ZBED4, was unknown. This study explored whether ZBED4 could serve as a biomarker to predict patient outcomes or guide therapies for HCC.
What did the researchers do?
We analyzed data from public cancer databases and patient tissue samples to investigate ZBED4’s role in HCC. We examined:How ZBED4 levels vary in tumors compared to normal tissues.Whether ZBED4 affects immune cells in the tumor environment.Its link to patient survival and response to treatments like chemotherapy and immunotherapy.
What did we find?High ZBED4 levels were linked to worse survival and advanced cancer stages.Tumors with more ZBED4 had fewer cancer-fighting immune cells (like CD8⁺ T cells) and more immunosuppressive cells (like Tregs).ZBED4 may predict drug sensitivity: patients with high ZBED4 responded better to chemotherapy but poorly to immunotherapy.A 10-gene signature based on ZBED4-related genes helped identify high-risk HCC patients.
What do these results mean?
ZBED4 could be a useful biomarker to guide treatment decisions in HCC. Targeting ZBED4 might improve outcomes, though further research is needed to confirm this. Future basic and clinical studies should explore whether combining ZBED4-targeted therapies with immune-boosting treatments could enhance their effectiveness.
Key terms explained:Biomarker: A measurable indicator of disease or treatment response.Immunotherapy: Treatments that help the immune system fight cancer.Tumor microenvironment (TME): The surrounding cells and molecules that influence tumor growth.
This work opens new avenues of ZBED4 for personalized HCC therapy and highlights its importance in the tumor microenvironment and cancer progression.
Keywords: ZBED4, pan-cancer, hepatocellular carcinoma, immune infiltration, therapy, prognosis
Introduction
Hepatocellular carcinoma (HCC) accounts for approximately 75–85% of primary liver cancers1 and remains the third leading cause of cancer-related death globally, with an estimated 906,000 new cases and 830,000 deaths in 2020.2 The prognosis remains poor, especially in advanced stages, with 5-year survival rates below 20% in most regions.1 The treatment options for patients with HCC include surgical resection, radiofrequency ablation, and transarterial chemoembolization. Additionally, systemic therapy is available for unresectable HCC.3 While these interventions can provide some benefits, a significant proportion of individuals still experience poor survival. Recent advances in targeted therapy and immune checkpoint inhibitor (ICI) therapy have improved HCC treatment.4 Despite promising outcomes, further optimization is needed. We must continue to explore new targets and therapeutic approaches to manage this challenging disease better.
The ZBED gene family, expressed across various vertebrate tissues, encodes regulatory proteins with diverse biological functions. This gene family is divided into two subfamilies, Ac and Buster, both of which share a unique BED domain.5,6 Recent studies have indicated a correlation between the ZBED genes and cancer development and progression. For example, ZBED1, a transcription factor, promotes the proliferation of gastric cancer cells and reduces their sensitivity to chemotherapy.7 Elevated ZBED2 expression in pancreatic ductal adenocarcinoma (PDA) inhibits the interferon (IFN) response, increases cell motility, and facilitates cell invasion in PDA cells.8 ZBED2 significantly enhances the IFN signaling pathway, potentially improving outcomes in patients with ER-negative breast cancer.9 ZBED3, a novel axin-binding protein, plays a typical role in Wnt/β-catenin signaling and is involved in carcinogenesis and embryogenesis.10 Previous studies haves shown that ZBED3 enhances lung cancer cell proliferation by modulating PCNA expression.11 ZBED6 represses IGF2 expression, which affects development, cell proliferation, and muscle growth.12 ZBED6 influences the cell cycle and proliferation of human colorectal cancer cells.6 ZBED5 and ZBED7-9 are members of the Buster family, with ZBED5 overexpression enhancing the proliferation and progression of lung adenocarcinoma (LUAD) cells.13 The ZBED4 protein is uniquely expressed in glial Müller cells and human retinal cone photoreceptors, as reported previously.14,15 However, the detailed roles of ZBED4 in cancers remains unknown.
This study aimed to explore the association between ZBED4 and cancer, particularly HCC. The Research has revealed that ZBED4 plays an important role in the diagnosis, prognosis, and therapy of HCC. ZBED4 has contributes significantly to the regulation of cancer progression by affecting the immune microenvironment. Our study offers a comprehensive analysis of ZBED4 and, highlights its clinical relevance and immune profile in HCC.
Materials and Methods
Genomic Data and Clinical Information
Transcriptomic data and clinical annotations for 33 solid tumors (Table 1) were obtained from The Cancer Genome Atlas (TCGA; https://portal.gdc.cancer.gov/). R and “ggplot2” were used to visualize ZBED4 gene expression across cancers. Wilcoxon rank-sum and paired t-tests were used to assess ZBEDs expression in the tissues. Differential expression between tumor and normal tissues was analyzed using Gene Expression Profiling Interactive Analysis 2 (GEPIA2.0; http://gepia2.cancer-pku.cn/#index). Microarray datasets GSE64041 and GSE62232 for LIHC were sourced from the Gene Expression Omnibus (GEO) database, and ZBEDs expression was visualized using box plots. Single-cell sequencing data sets GSE99254, GSE150766, GSE139555, GSE134520, GSE111672, GSE98638, GSE125449, and GSE140228 were downloaded from Tumor Immune Single-cell Hub 2 (TISCH2).16 ZBED4 expression in various cancer tumor microenvironments (TME) was analyzed using R software with the MAESTRO and Seurat packages, and cells were re-clustered using the t-SNE method.
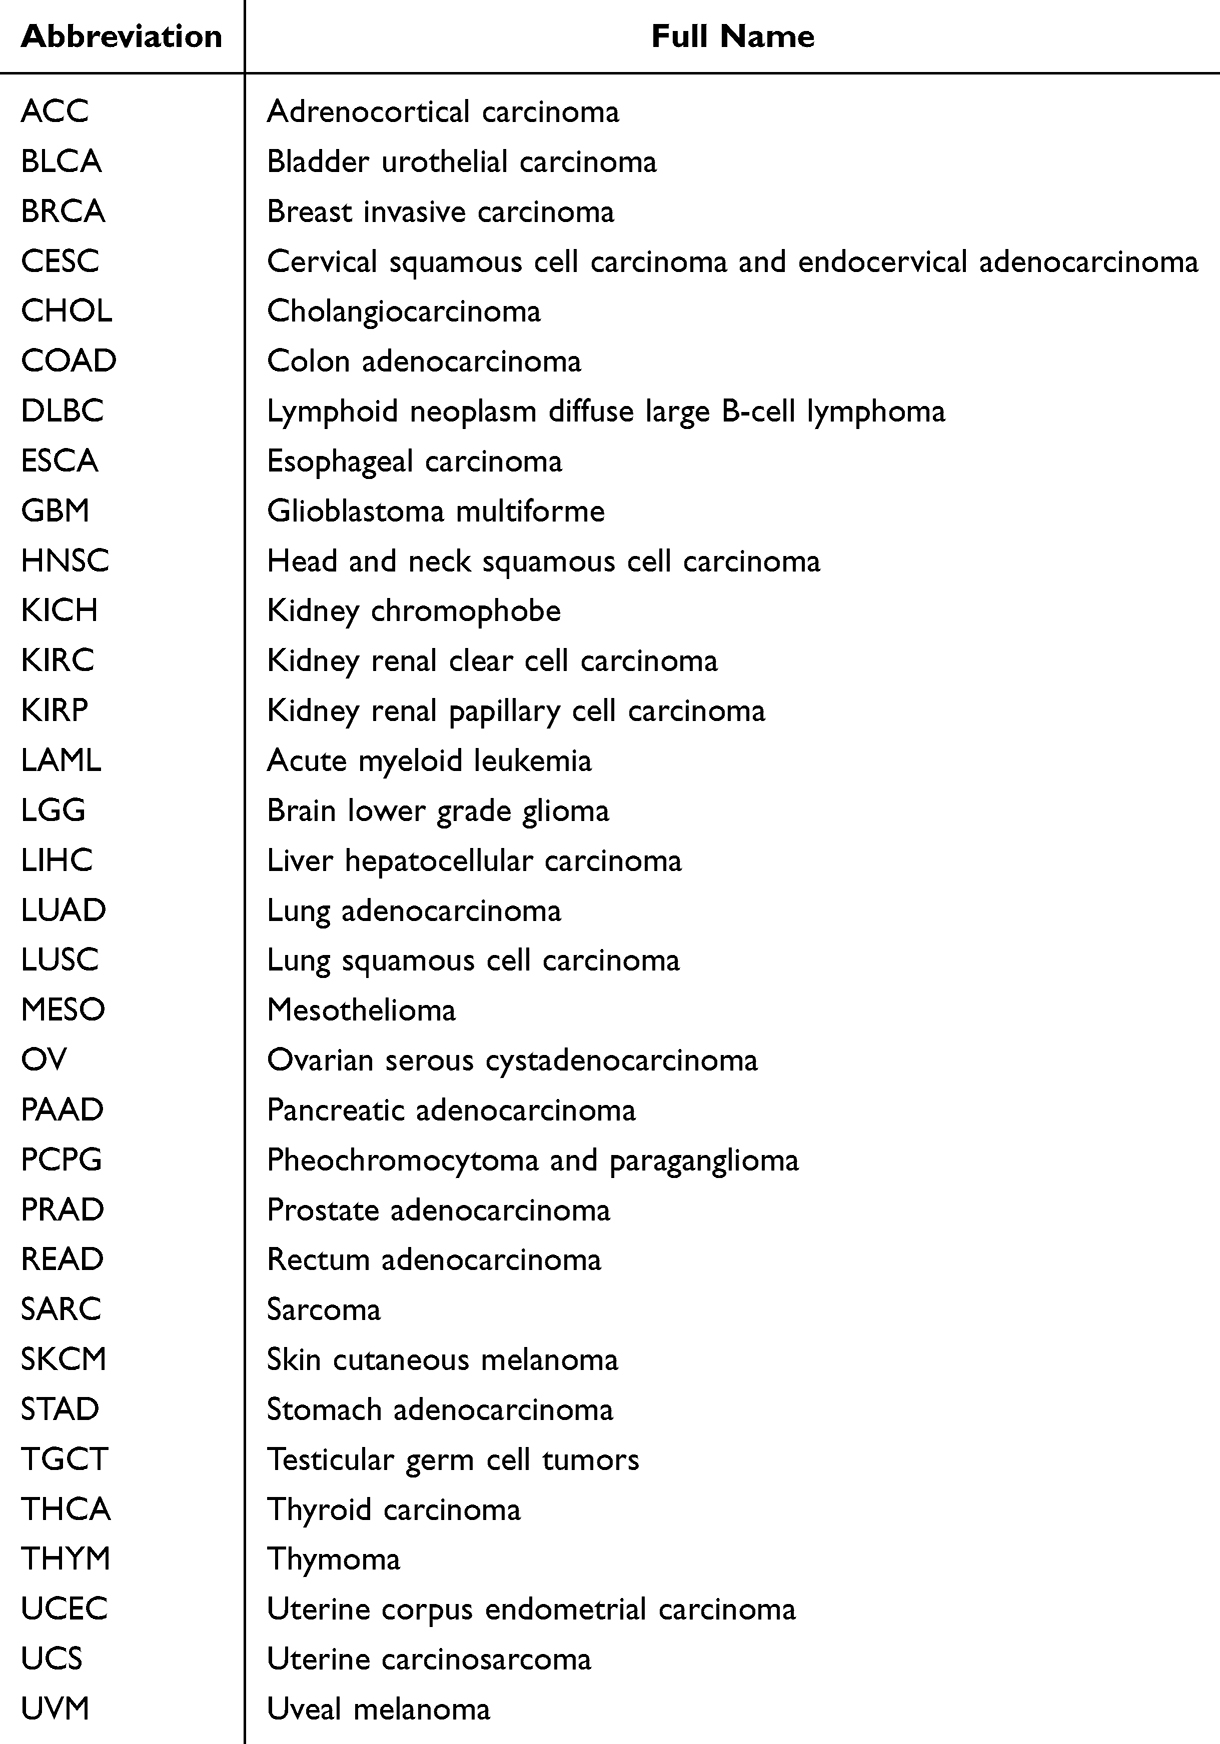 |
Table 1 The Abbreviation and the Full Name of 33 Types of Cancers Involved in Our Study |
Diagnostic Receiver Operator Characteristic (ROC) Curve and Survival Analysis
ROC curves were generated using the “pROC” and “ggplot2” packages in R to evaluate ZBED4’s diagnostic potential in HCC. Survival maps for ZBED4 across 33 cancers were created using GEPIA2.0, assessing overall survival (OS), disease-specific survival (DSS), and progression-free interval (PFI) between high- and low-expression groups. Hazard ratios (HR) and 95% confidence intervals (CI) were calculated using the “forestplot” package. Survival analyses were conducted with the “survival” package and visualized via “survminer” and “ggplot2”.
Immune-Related Factors Estimation
Immune scores were calculated using TCGA data and the R package ‘immuneeconv. The CIBERSORT algorithm analyzed 22 immune cell types across pan-cancer, comparing their expression between the high and low ZBED4 expression groups in HCC. Using the R package “circlize(v0.4.1)”, we analyzed the correlation between ZBED4 and immune checkpoint genes, including CD274, CTLA4, HAVCR2, LAG3, PDCD1, PDCD1LG2, TIGIT, and SIGLEC15. We examined the expression of these genes in relation to ZBED4 levels in HCC. We also investigated the association between ZBED4 expression and tumor mutation burden (TMB)17 and microsatellite instability (MSI)18 across various cancers. The analyses utilized the R packages “ggplot2” and “pheatmap”.
ICB Response
The Tumor Immune Dysfunction and Exclusion (TIDE) algorithm19 predicts potential immune checkpoint blockade (ICB) responses by evaluating gene expression markers related to two tumor immune escape mechanisms: cytotoxic T lymphocyte (CTL) dysfunction and CTL rejection due to immunosuppressive factors. These analyses were conducted in R with “ggplot2” and “ggpubr(0.4.0)”.
Genetic Alteration Analysis
RNA-sequencing expression profiles, genetic mutations, and clinical data for HCC were obtained from TCGA dataset. The “maftools” package in R was used to visualize mutation data, with frequently mutated genes in HCC patients displayed in a histogram.
Drug Sensitivity Estimation
The Genomics of Drug Sensitivity in Cancer (GDSC, https://www.cancerrxgene.org/) was implied to predict the chemotherapeutic response for each sample utilizing the R package “pRRophetic”.20,21 The IC50 values were determined using ridge regression with default parameters. Averaging was applied to account for batch effects, tissue types, and duplicate gene expression. We used Spearman correlation to analyze IC50 distributions of ten drugs in high- and low-ZBED4 groups, visualizing the data with “ggplot2” and “pheatmap” in R.
Gene Ontology (GO) Term and Kyoto Encyclopedia of Genes and Genomes (KEGG) Pathway Enrichment Analysis Using KEGG and Gene Set Enrichment Analysis (GSEA)
The study employed the “limma” package to detect differentially expressed genes (DEGs) between high- and low-ZBED HCC groups, applying criteria of Adjusted P< 0.05 and Log2 (Fold Change) >1 or <−1. A volcano plot displays upregulated (red), downregulated (blue), and non-significant (grey) genes. The “ClusterProfiler” package was utilized to analyze the GO functions and KEGG pathways of DEGs. A boxplot shows differential enrichment, with colors indicating significance and circles size representing the gene count. GSEA identified potential signaling pathways between groups, and the nine most significant immune-related Gene Ontology biological processes (GOBP) were visualized as mountain maps. “ggplot2” was used to visualize GSEA results, considering pathways with p <0.05 or FDR <0.05 as meaningful.
Establishment and Validation of a Multi-Gene Prognostic Signature
Prognosis-related genes were identified from DEGs in the high- and low-ZBED4 HCC groups using univariate Cox regression analysis, with a hazard ratio not equal to 1 and p-value less than 0.05. The top 200 genes were selected for further analyses. A multi-gene signature for HCC prognosis prediction was developed using LASSO Cox regression with ten-fold cross-validation, implemented via the “glmnet” R package. A prognostic risk score was developed using ten genes that maintained their coefficients following the LASSO analysis.

Patients were categorized into high- and low-risk groups based on the median risk score, and Kaplan-Meier survival analysis was conducted to evaluate survival differences. The timeROC package evaluated the predictive accuracy of the risk score accuracy. The multi-gene prognostic signature was validated using an independent LIHC cohort from the International Cancer Genome Consortium (ICGC, https://dcc.icgc.org/releases/current/Projects). A butterfly diagram depicts the correlation between the model risk score and immune score, assessed using the Tumor Immunophenotype (TIP) system and correlation analysis. The cancer-immunity cycle framework was utilized to comprehend the anti-cancer immune response, employing the TIP system with “ssGSEA” and “CIBERSORT” for evaluating immune cell infiltration. The correlation between the risk and immune scores was analyzed using the MCP-counter algorithm and the “ggstatsplot” package.
Multiplex Immunofluorescence
Tissue microarray (TMA) with clinical data was provided by the Outdo Biotech Company in Shanghai with ethical approval (No. ZJBB-FM-071), and informed consent was obtained from all the patients. TMA was subjected to multiplex immunofluorescence by baking at 63°C for 1 h, followed by deparaffinization using an automated LEICAST5020 machine and processing with the Opal 7-color Manual IHC Kit (NEL801001KT, PerkinElmer). Following deparaffinization and antigen retrieval, endogenous peroxidase activity was inhibited using hydrogen peroxide for 10 min. The TMA was then blocked and incubated with ZBED4 (1:200, bs-13554R, Bioss Antibodies) or CD8 antibodies (IR623, DAKO) for 1 h, followed by a secondary antibody for 10 min. Opal dye was applied, and the antibody complex was removed by microwave treatment, repeating the process for all markers. Slides were counterstained with DAPI for 10 min and mounted using VECTASHIELD HardSet Antifade Medium (H-1400, Vector Laboratories). Two patients were excluded because of core detachment, and eighty-eight tumor samples and paired normal tissues were included in analysis. The cohort included patients aged 32–78 years (77 male, 11 female), with TNM stage distribution of 14 Stage I, 19 Stage II, and 55 Stage III cases.
Fluorescence Signal Quantification
Fluorescent images were acquired using the TissueFAXS Spectra system (TissueGnostics) at 20× magnification. Image acquisition parameters were kept uniform across all samples, with exposure times set at 200 ms for ZBED4 (Opal 690), 150 ms for CD8 (Opal 520), and 50 ms for DAPI. Quantitative analysis was performed using StrataQuest software to determine key parameters: ZBED4⁺ tumor cell percentage; CD8⁺ T cell percentage; Four distinct subpopulations: ZBED4⁺CD8- tumor cells, ZBED4-CD8⁺ T cells, ZBED4⁺CD8⁺ double-positive cells; ZBED4-CD8- double-negative cells. The spectral library of the software enables the isolation of specific fluorescence signals by separating them from each channel. The DAPI channel, which stains the DNA, identifies the nucleus. Using the nucleus as a reference, we determined the distance radius based on protein staining patterns. A threshold for staining intensity was set to differentiate between the positive and negative cells.
Statistical Analysis
Statistical analyses were conducted using R (version 4.2.1, or 4.0.3). Gene expression cutoffs were determined using the median method. The Wilcoxon rank-sum test and paired t-test were used to evaluate the significance between the two groups, and survival analysis was performed using the Kaplan-Meier method with a Log rank test. The effects of clinical variables on the outcomes were assessed using both univariate and multivariate Cox regression analyses. Spearman correlation was used to evaluate gene expression correlations. Two-sided tests were conducted, with p-values below 0.05 considered significant.
Result
Expression Landscape and Survival Analysis of ZBED Family in Pan-Cancer
A comprehensive heatmap was created to examine the genomic characteristics of the ZBED family genes across the 17 cancer types, highlighting the differences in expression between primary tumors and adjacent normal tissues (Figure 1a). ZBED4 was significantly upregulated across 16 cancer types including BLCA, BRCA, CESC, CHOL, COAD, ESCA, GBM, HNSC, LIHC, LUAD, LUSC, PRAD, READ, STAD, THCA, and UCEC. However, it was downregulated in only one cancer type, KICH.A paired sample analysis of 23 cancer and adjacent non-cancerous tissue samples revealed a significant increase in ZBED4 mRNA expression in 13 cancer types, namely BLCA, BRCA, CHOL, COAD, ESCA, HNSC, KIRP, LIHC, LUAD, LUSC, PRAD, STAD, and THCA, while a decrease was observed in KICH (Figure 1b).
 |
Figure 1 Expression Landscape and Survival Analysis of ZBED Family in Pan-cancer. (a) Heatmap comparing ZBED family gene expression between tumor and adjacent normal tissues across 17 cancer types. (b) Paired sample analysis of ZBED4 expression in 23 cancers and paracancerous samples. (c) A survival map of ZBEDs in the 33 cancers. (d–f) To evaluate the prognosis value of ZBED4, univariate cox regression analysis of the 33 cancers was carried out presented by the forest plots in (d) OS, (e) DSS, and (f) PFI. *p < 0.05, **p < 0.01,***p < 0.001. Abbreviations: OS, overall survival; DSS, disease-specific survival; PFI, progress-free interval. |
The GEPIA2.0 database was used to assess the impact of ZBEDs on patient prognosis by generating survival maps across 33 cancer types. And, we found that different ZBED genes were significantly associated with OS in different tumors (Figure 1c). To assess the prognostic significance of ZBED4, we conducted univariate Cox regression analysis across 33 cancers to evaluate OS, DSS, and PFI, as illustrated in the forest plots. The analysis indicated a significant association between ZBED4 expression and OS in ACC, LIHC, MESO, SARC, SKCM, and READ (Figure 1d). DSS analysis identified ZBED4 as a risk factor for ACC, HCC, MESO, and SKCM (Figure 1e). In the PFI analysis, ZBED4 was identified as a risk factor for ACC, LIHC, PAAD, and PCPG, while serving as a protective factor for CHOL, GBM, KIRC, and UCEC (Figure 1f).
Correlation of ZBED4 and Immune-Related Factors in Pan-Cancer
Figure 2a illustrates the application of the CIBERSORT algorithm to investigate the relationship between ZBED4 expression and immune cell infiltration across various cancer types. Our analysis revealed a negative correlation between Treg infiltration and ZBED4 expression in BLCA, CESC, COAD, HNSC, KIRC, PRAD, SKCM, STAD, and UCEC (P<0.05), whereas a positive correlation was identified in HCC and THYM (P<0.05). A negative correlation between CD8⁺ T cell infiltration and ZBED4 expression was observed in various cancers, including ACC, BLCA, BRCA, CESC, CHOL, ESCA, HNSC, KIRC, LIHC, LUAD, LUSC, PCPG, PRAD, SARC, SKCM, STAD, TGCT, THCA, UCEC, and UCS (P<0.05), while a positive correlation was found in KICH and LAML (P<0.05). ZBED4 expression negatively correlated with CD4⁺ T cell infiltration in LUSC and THYM while a positive correlation was identified in BRCA, KICH, KIRC and PRAD (P<0.05). The study identified a negative correlation between activated NK cell infiltration and ZBED4 expression across various cancers, including BRCA, HNSC, KIRC, LIHC, LUAD, MESO, OV, PAAD, PRAD, SKCM, STAD, THCA, THYM, and UCEC (P<0.05). ZBED4 exhibited a positive correlation with M2 macrophages in KIRC, LGG, SKCM, and TGCT, whereas a negative correlation was noted in ACC, BLCA, KIRP, LAML, and THYM (P<0.05).
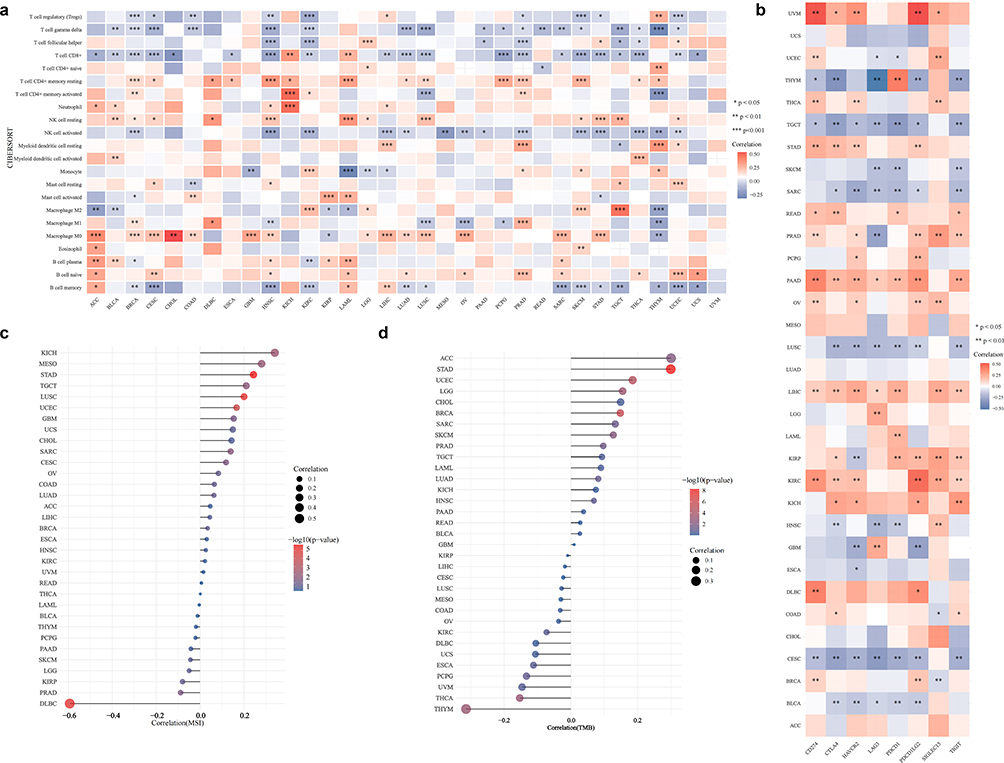 |
Figure 2 Correlation of ZBED4 and Immune-Related Factors in Pan-cancer. (a) CIBERSORT algorithms was applied to explore the correlation between ZBED4 expression and and immune cell infiltration in pan-cancer. (b) The correlation of ZBED4 and immune checkpoints in pan-cancer. (c) The correlation between ZBED4 and TMB in pan-cancer. (d) The correlation between ZBED4 MSI in pan-cancer. Abbreviations: TMB, tumor mutation burden; MSI, microsatellite instability; NK cell, natural killer cell. |
Figure 2b summarizes the correlations between ZBED4 and immune checkpoints across various cancer types. ZBED4 expression showed a significant positive correlation with various immune checkpoint genes across multiple cancer types (P<0.01). These associations include DLBC (CD274), KICH (TIGIT), KIRC (CD274, CTLA4, HAVCR2, PDCD1LG2, SIGLEC15, TIGIT), LIHC (CD274, CTLA4, HAVCR2, PDCD1, SIGLEC15, TIGIT), PAAD (CD274, CTLA4, HAVCR2, PDCD1, PDCD1LG2, TIGIT), and UVM (CD274, HAVCR2, PDCD1LG2). Moreover, the study explored the correlation between ZBED4 and two novel immune-related biomarkers, TMB and MSI. Figure 2c illustrates that ZBED4 expression positively correlated with TMB in ACC, STAD, UCEC, LGG, BRCA, SARC, SKCM, and PRAD, while showing a negative correlation in THCA and THYM (P<0.05). MSI showed a positive correlation with KICH, MESO, STAD, TGCT, LUSC, UCEC, SARC, and CESC, and a negative correlation with PRAD and DLBC (P<0.05) (Figure 2d). These findings indicate that ZBED4 may serve as a new immune-related biomarker for cancer progression.
The Expression of ZBED4 in the TME
Through ZBED4 expression analyses across various single-cell sequencing datasets from the GEO database, it was observed that ZBED4 predominantly exhibits expression in T cells across all types of immune cells within the TME of different cancers. Specifically, ZBED4 expression was concentrated in T proliferating cells within the TME of non-small cell lung cancer (NSCLC) and colorectal cancer (CRC) (Figure 3a and b), CD8⁺ exhausted T (Tex) cells in small cell lung cancer (SCLC) TME (Figure 3c), and CD8⁺ T cells in STAD and PAAD (Figure 3d and e). In HCC, expression profiling through high-throughput sequencing (GSE125449) indicated that ZBED4 was more highly expressed in CD8⁺ Tex cells, than in malignant cells, hepatic progenitors, monocytes/macrophages, endothelial cells, fibroblasts, plasma cells, and B cells (Figure 3f). Further analysis of single immune cell sequencing from HCC datasets (GSE140228) revealed that ZBED4 was primarily expressed in mast cells, T proliferation cells, and CD8⁺ Tex cells, followed by dendritic cells (DC), NK cells, and CD4⁺ conventional T (CD4Tconv) cells (Figure 3g). Additionally, single T cell sequencing from HCC datasets (GSE98638) demonstrated that ZBED4 expression was concentrated in CD4Tconv cells, CD8⁺ T cells, Treg cells (Figure 3h). Our study implies that ZBED4 may participate in the regulation of the TME by T cells, especially CD8⁺ T cells.
 |
Figure 3 ZBED4 expression in the tumor microenvironment at single-cell levels. ZBED4 expression analysis of different single-cell sequencing datasets from the GEO database including (a) GSE99254 (NSCLC), (b) GSE150766 (SCLC), (c) GSE139555 (CRC), (d) GSE134520 (STAD), (e) GSE111672 (PAAD), (f) GSE125449 (LIHC), (g) GSE140228 (LIHC), (h) GSE98638 (LIHC). Each dashed box presents the t-SNE plot of single-cell clustering, the t-SNE plot of the expression distribution of ZBED4 in different cells, and the bar chart of the expression abundance of ZBED4 in different cells. Abbreviations: NSCLC, non-small cell lung cancer; SCLC, small cell lung cancer; CRC, colorectal cancer; STAD, stomach adenocarcinoma; PAAD, pancreatic adenocarcinoma; LIHC, liver hepatocellular carcinoma. |
ZBED4’s Expression Characteristics, Along with Its Diagnostic and Prognostic Significance in HCC
ZBED4 exhibited a mutation rate of 0.56% in HCC (Supplementary Figure 1a–c). ZBED4 expression was markedly elevated in HCC samples compared to normal tissues (p < 0.001), as confirmed by two independent LIHC cohorts (GSE64041 and GSE62232) (Figure 4a and b). Analysis of the TCGA database revealed a significant association between high ZBED4 expression and advanced pathological stages (III–IV compared to I–II, P<0.001) (Figure 4c). The ROC curve demonstrated that ZBED4 expression is a reliable diagnostic marker for HCC, with an AUC of 0.881 (95% CI: 0.845–0.918) (Figure 4d). Cox regression analysis was performed on HCC patients to assess the prognostic significance of ZBED4. Univariate analysis showed that high ZBED4 expression, high pathological T-stage, and high pathological TNM-stage were associated with worse OS (p<0.01) (Figure 4e). Multivariate analysis revealed that elevated ZBED4 expression independently correlated with poorer overall survival (OS) (p=0.003, hazard ratio [HR] =1.44, 95% CI=1.11–1.73). Additionally, high pathological T-stage was also an independent unfavorable prognostic factor (P<0.000, HR=1.90, 95% CI=1.49–2.44) (Figure 4f). Kaplan-Meier analysis revealed that patients with high ZBED4 expression exhibited significantly poorer OS, DSS, and PFI compared to those with low ZBED4 expression (p<0.01, Figure 4g–i).
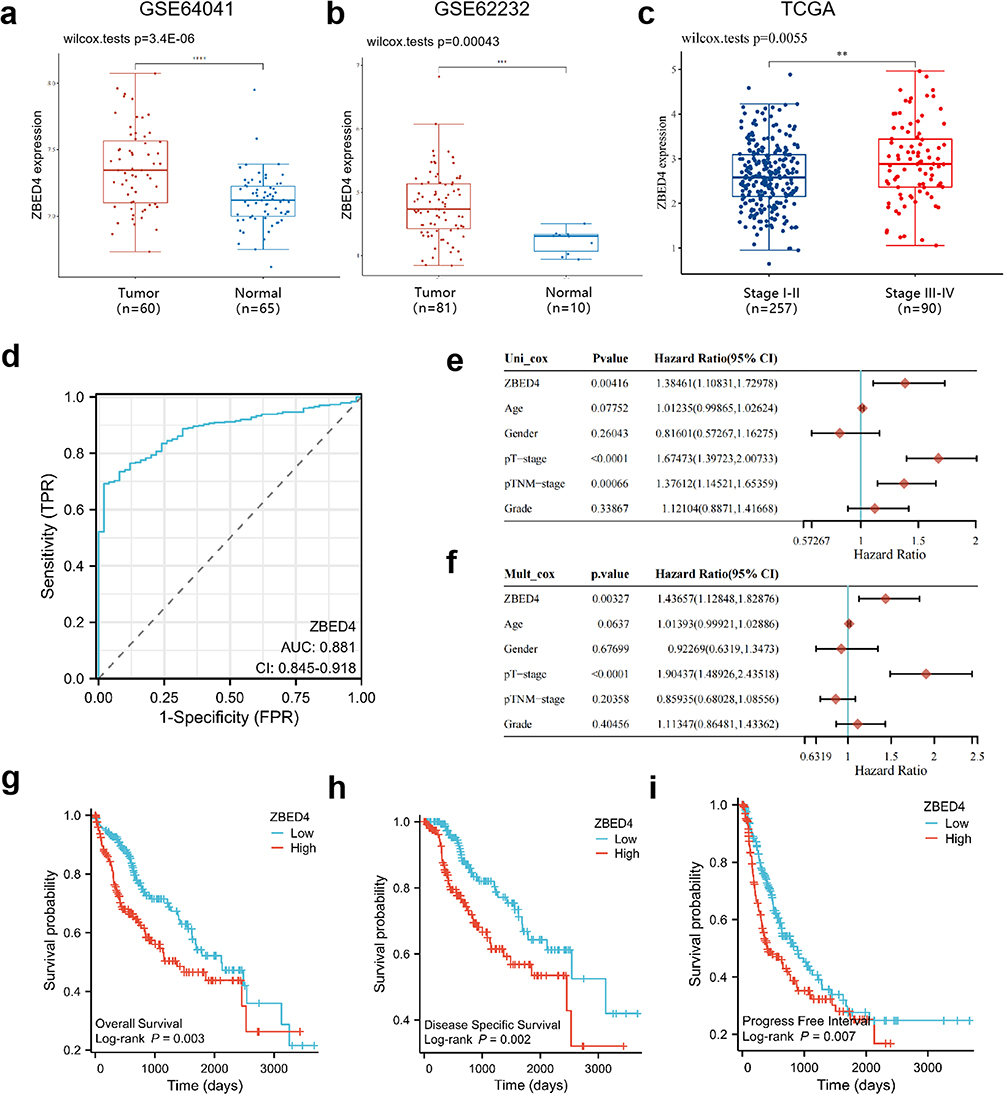 |
Figure 4 Expression Feature, Diagnostic Value and Prognostic Value of ZBED4 in LIHC. (a and b) The different expression of ZBED4 between normal tissues and tumor tissues (a) in cohorts from GSE64041 and (b) in cohorts from GSE62232. (c) The different expression of ZBED4 in patients with high and low pathological TNM-stage from TCGA database. (d) ROC curve analysis for diagnostic value of ZBED4. (e and f) The association of ZBED4, clinicpathological factors and OS by (e) univariate and (f) multivariate cox regression analysis. (g–i) Survival curves between high- and low-ZBED4 groups in (g) OS, (h) DSS, and (i) PFI. **p < 0.01,***p < 0.001,****p < 0.0001. Abbreviations: LIHC, liver hepatocellular carcinoma; ROC, receiver operator characteristic; OS, overall survival; DSS, disease-specific survival; PFI, progress-free interval. |
The Roles of ZBED4 in Immune Infiltration and ICB Response in HCC
Using the CIBERSORT algorithm, we compared the high- and low-ZBED4 groups, finding increased infiltration of B cell memory, Tregs, macrophage M0, and neutrophils in the high-ZBED4 group, whereas the low-ZBED4 group exhibited higher levels of CD8⁺ T cells, activated CD4⁺ T memory cells, gamma/delta (γδ) T cells, and activated NK cells (Figure 5a and b). The heatmap illustrated the differential gene expression of immune profiles between high- and low-ZBED4 groups in HCC (Figure 5c). Figure 5d illustrates the percentage abundance of 22 tumor-infiltrating immune cells per sample. ZBED4 demonstrated a positive correlation with six immune checkpoint genes: CD274, CTLA4, HAVCR2, LAG3, PDCD1, and TIGIT, while showing no positive correlation with SIGLEC15 and PDCD1LG2 (Figure 5e). Gene expression of CD274, CTLA4, HAVCR2, LAG3, PDCD1, TIGIT, and PDCD1LG2 was concentrated in the high-ZBED4 group (Figure 5f). Moreover, the TIDE algorithm predicted that the higher the ZBED4 expression, the higher the TIDE score would be, indicating poorer therapeutic outcomes of ICB (Figure 5g).
 |
Figure 5 The Roles of ZBED4 in Immune Cell Infiltration and ICB Response in LIHC. (a and b) The comparison of the gene expression difference of immune profiles by CIBERSORT algorithm between the high- and low-ZBED4 group of LIHC. (c) Heatmap of immune profile gene expression scores stratified by ZBED4 expression levels. (d) A percentage abundance of twenty-two types of tumor-infltrating immune cells. (e) The interacted correlations of ZBED4 and eight immune checkpoint genes in LIHC. (f) The expression distribution of immune checkpoints gene in high- and low ZBED4 expression groups of LIHC. (g) Statistical table of immune response of samples and the distribution of immune response scores in high- and low-ZBED4 expression groups of LIHC. *p < 0.05, **p < 0.01, ***p < 0.001. Abbreviations: LIHC, liver hepatocellular carcinoma; NK cell, natural killer cell. |
Drug Sensitivity Analysis for HCC Patients with Different ZBED4 Expression
To examine the clinical significance of ZBED4 in predicting drug sensitivity in HCC treatment, we analyzed ten drugs, including five chemotherapy drugs (paclitaxel, gemcitabine, docetaxel, doxorubicin and 5-flurouracil) and five targeted drugs (sorafenib, sunitinib, erlotinib, temsirolimus and foretinib). Except for erlotinib, high ZBED4 expression was associated with lower IC50 values (Figure 6a–j). The correlation analysis identified a significant negative correlation between ZBED4 expression and IC50 values for nine drugs, suggesting that increased ZBED4 expression may enhance the therapeutic response to chemotherapy and targeted therapy in HCC patients (Figure 6k). These findings suggest that ZBED4 could be a biomarker for predicting drug sensitivity and therapeutic response in HCC patients.
 |
Figure 6 Drug Sensitivities Prediction Based on Different ZBED4 Expression Cohorts in LIHC. (a–j) Between the high- and low-ZBED4 expression groups. (a) The IC50 for paclitaxel was compared. (b) The IC50 for gemcitabine was compared. (c) The IC50 for docetaxel was compared; (d) The IC50 for doxorubicin was compared. (e) The IC50 for 5-flurouracil was compared. (f) The IC50 for sorafenib was compared. (g) The IC50 for sunitinib was compared. (h) The IC50 for erlotinib was compared. (i) The IC50 for temsirolimus was compared. (j) The IC50 for foretinib was compared. (k) The correlation between ZBED4 expression and IC50 values for those drugs. ****p < 0.0001. Abbreviations: LIHC, liver hepatocellular carcinoma; IC50, half-maximal inhibitory concentration. |
DEGs Analysis and Functional Enrichment Between High- and Low-ZBED4 Groups of HCC
We identified 603 DEGs between groups with high and low ZBED4 expression levels, with 528 (87.6%) being upregulated and 75 (12.4%) downregulated (Figure 7a). Upregulated DEGs were primarily associated with GO terms related to organelle fission, nuclear and mitotic nuclear division, chromosome and sister chromatid segregation, nuclear chromosome segregation, and cell cycle phase transition regulation (Figure 7b). In contrast, downregulated DEGs were enriched in processes involving fatty acid and steroid metabolism, organic and carboxylic acid biosynthesis, and alcohol metabolism (Figure 7c). KEGG pathway analysis revealed that pathways enriched with significantly upregulated DEGs included cell cycle, microRNAs in cancer, focal adhesion, cellular senescence, and ECM-receptor interaction (Figure 7d). In contrast, pathways enriched with downregulated DEGs involved metabolism of xenobiotics by cytochrome P450, retinol metabolism, drug metabolism-cytochrome P450, chemical carcinogenesis-DNA adducts, and complement and coagulation cascades (Figure 7e). GSEA analysis revealed a markedly enhanced immune phenotype in the high-ZBED4 group within HCC, with significant enrichment of nine immune-related biological processes (Figure 7f). These findings indicate that ZBED4 is integral to the regulation of multiple biological processes and pathways, with its elevated expression potentially enhancing the immune phenotype in HCC.
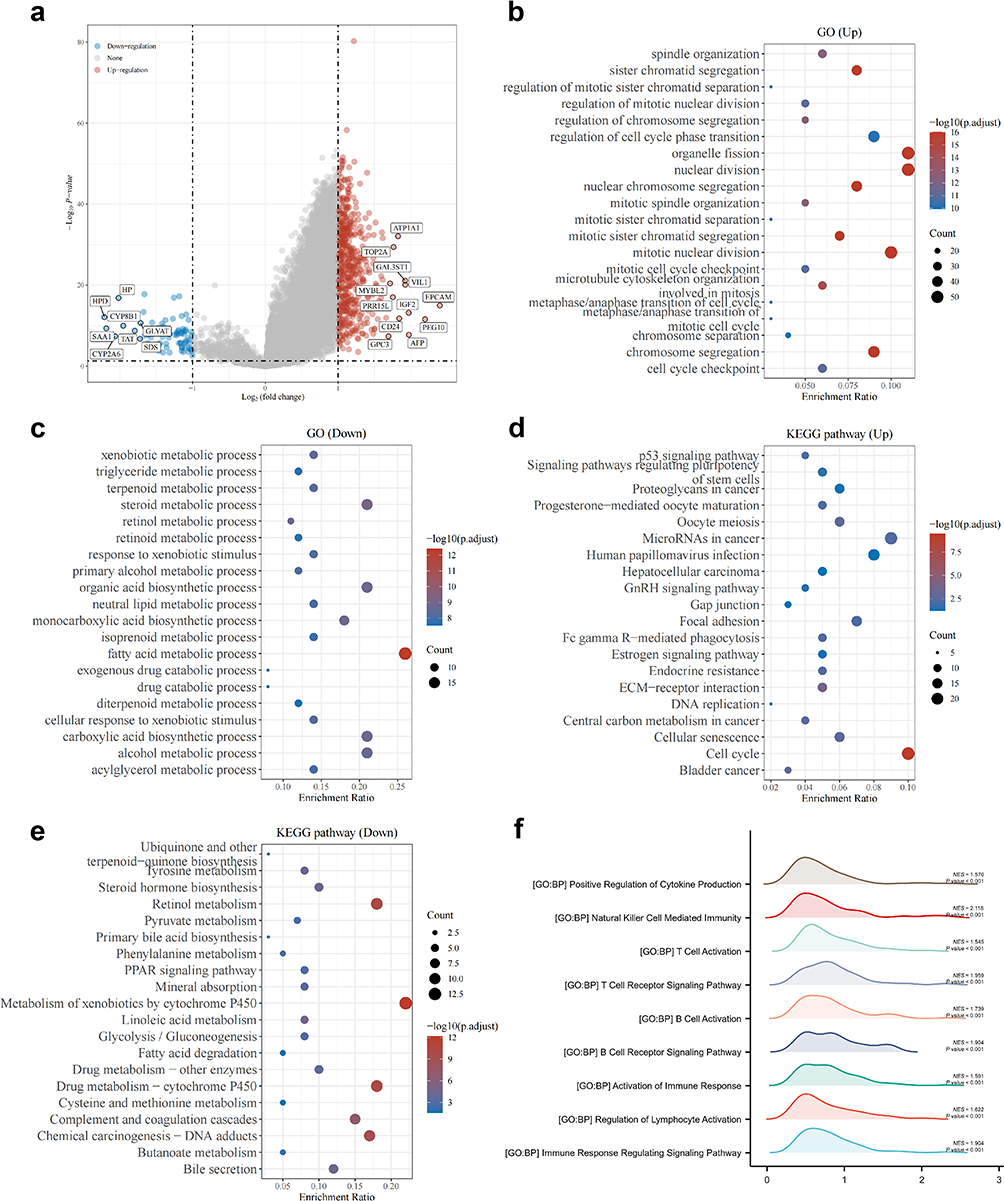 |
Figure 7 DEGs Analysis and Functional Enrichment between High- and Low-ZBED4 Groups of LIHC. (a) Volcano plot of DEGs. (b) GO analysis of upregulated DEGs. (c) GO analysis of downregulated DEGs. (d) KEGG analysis of upregulated DEGs. (e) KEGG analysis of downregulated DEGs. (f) GSEA analysis of the GOBP. Abbreviations: DEGs, differentially expressed genes; LIHC, liver hepatocellular carcinoma; GO, Gene Ontology; GOBP, biological processes of Gene Ontology; KEGG, Kyoto Encyclopedia of Genes and Genomes. |
Prognostic Multi-Gene Signature for HCC and Its Association with Immune Infiltration
We identified the top 200 DEGs associated with ZBED4 expression which showed a significant correlation with the prognosis of patients with HCC. After LASSO regularization (10-fold cross-validation, λmin=0.047; Figure 8a and b), 10 genes retained their Cox coefficients, namely CDCA8, SPP1, SLC1A5, CFHR3, ADH4, PLOD2, ANXA10, G6PD, PON1, and FAM83D. The ten-gene risk score was developed using Cox coefficients as follows: The ten-gene risk score was developed using Cox coefficients as follows: risk score = (0.1069) × Exp(CDCA8) ⁺ (0.0329) × Exp(SPP1) ⁺ (0.0126) × Exp(SLC1A5) - (0.0257) × Exp(CFHR3) - (0.0204) × Exp(ADH4) ⁺ (0.1101) × Exp(PLOD2) - (0.0202) × Exp(ANXA10) ⁺ (0.0722) × Exp(G6PD) - (0.0062) × Exp(PON1) ⁺ (0.0259) × Exp(FAM83D). Patients were categorized into high-risk (n=185) and low-risk (n=185) groups according to their risk scores, as depicted in Figure 8c, which also illustrates patient survival status and a heatmap of 10 prognostic genes. KM survival curves indicated that patients in the high-risk group had significantly poorer OS (HR = 2.557, 95% CI = 1.782–3.668, p < 0.0001; Figure 8d). Moreover, the multi-gene prognostic signature showed AUC values more than 70% by the tROC analysis (Figure 8e), which showed good predictive effectiveness in 1-year, 2-year and 3-year OS. The prognostic value of the multi-gene model was validated for OS in an independent HCC cohorts from ICGC dataset (n=240) (HR = 3.995, 95% CI = 2.191–7.282, p < 0.0001; Figure 8f). tROC analysis indicated that the AUC values for 1-year, 2-year, and 3-year overall survival in the external validation set were 0.793, 0.768, and 0.782, respectively (Figure 8g). The multi-gene prognostic signature demonstrated potential in predicting overall survival for HCC patients and may assist in guiding treatment decisions.
 |
Figure 8 Establishment and Validation of Multi-gene Prognostic Signature. (a) LASSO coefficients profiles of 200 DEGs significantly correlated with ZBED4 expression and the prognosis of LIHC patients. (b) LASSO regression with tenfold cross-validation obtained 10 prognostic genes using minimum lambda value. (c) The patients were divided into low- and high-risk group by median risk score. The curve of risk score, the survival status of the patients, and the heatmap of the expression profiles of the ten prognostic genes in the high- and low-risk group were presented. (d) Kaplan–Meier survival analysis of the multi-gene prognostic signature. (e) tROC analysis of the multi-gene prognostic signature. (f) Validation of the multi-gene prognostic signature. An independent LIHC cohort from ICGC dataset (n=240) was regarded as the external validation set. Kaplan-Meier survival analysis of the multi-gene signature in external validation set. (g) tROC analysis of the multi-gene signature in external validation set. Abbreviations: LASSO, least absolute shrinkage and selection operator; DEGs, differentially expressed genes; LIHC, liver hepatocellular carcinoma; tROC, time-dependent receiver operating characteristic. |
Furthermore, we performed an analysis to investigate the correlation between risk scores and the proportions of tumor-infiltrating immune cells across the various stages of the cancer-immunity cycle by the TIP system. Our findings demonstrated notable positive correlations between risk scores and both step1 (cancer cell antigen release) and step4 (recruitment of MDSC, neutrophils, Treg cells, NK cells, CD8⁺ T cells, CD4⁺T cells, Th1 cells, Th22 cells, and Th17 cells). The findings demonstrated negative correlations between risk scores and step5 (immune cell infiltration into tumors), step6 (T cell recognition of cancer cells), and step7 (cancer cell destruction) (Supplementary Figure 2a). We also analyzed the correlation between risk score and immune infiltration by MCP-counter algorithm. The findings indicated a positive correlation between the risk score and the infiltration of T cells, CD8⁺ T cells, B cells, monocytes, myeloid dendritic cells, macrophage/monocyte expression rate, and cytotoxicity score, while a negative correlation was observed with neutrophil infiltration (Supplementary Figure 2b–i).
Analysis of ZBED4 Protein Expression, CD8⁺ T Cell Infiltration, and Prognosis in HCC Tissue Microarrays Using Multiplex Immunofluorescence
Multiplex immunofluorescence analysis revealed the expression patterns of ZBED4 and its co-localization with CD8 in both tumor and adjacent normal liver tissues. ZBED4 was predominantly localized in the cytoplasm (Figure 9a), with a higher proportion of ZBED4⁺ cells in tumors than in adjacent tissues. Normal paracancerous tissues exhibited greater abundance of CD8⁺ T cells, CD8⁺ZBED4−, and CD8⁺ZBED4⁺ cells, whereas tumor tissues showed increased levels of CD8−ZBED4⁺ and CD8−ZBED4− cells (Figure 9b). A negative correlation was observed between ZBED4 positivity and CD8⁺ T cell abundance in both tissue types (Figure 9c). Interestingly, tumors with higher ZBED4⁺ cell proportions also showed increased CD8⁺ T cell infiltration (Figure 9d). Clinicopathological comparison indicated that the high-ZBED4 group had older patients and a greater proportion with AFP ≥ 400 μg/L, while other features were comparable between groups (Supplementary Table 1).
 |
Figure 9 The correlation between ZBED4 protein Expression, CD8⁺T Cell Infiltration and Prognosis in HCC TMA by Multiplex Immunofluorescence. (a) Multiplex immunofluorescence images showed expression features of ZBED4 and CD8 in tumor and paracancerous normal tissues. (b) The comparison of positive rates of ZBED4⁺ cells, CD8⁺T cells, CD8⁺ZBED4- cells, CD8-ZBED4⁺ cells, CD8⁺ZBED4⁺ cells and CD8-ZBED4- cells between tumor and paracancerous normal tissues. (c) The correlation between ZBED4 expression and CD8⁺T cell percent in tumor and paracancerous normal tissues. (d) The comparison of CD8⁺T cell percent between the high-ZBED4 and low-ZBED4 group. (e–h) Survival curves between high and low expression of ZBED4, high and low positive rate of ZBED4⁺ cells, CD8⁺ZBED4- cells, CD8-ZBED4⁺ cells in HCC patients. (i) The association of ZBED4, clinicpathological factors and OS in HCC patients by multivariate Cox regression analysis. (j) Survival curves between high and low positive rate of ZBED4⁺ cells in the HBsAg-positive subgroup. (k) The association of ZBED4, clinicpathological factors and OS in the HBsAg-positive subgroup by multivariate Cox regression analysis. *p < 0.05, ***p < 0.001. Abbreviations: HCC, hepatocellular carcinoma; TMA, tissue microarray; OS, overall survival. |
Kaplan-Meier analysis demonstrated that high ZBED4 expression, as well as increased percentages of ZBED4⁺ or CD8−ZBED4⁺ cells, were associated with worse OS (P=0.039, HR=1.65; P=0.036, HR=1.66; P=0.009, HR=1.88), whereas higher proportions of CD8⁺ZBED4− cells predicted better OS (P=0.021, HR=0.56) (Figure 9e–h). No significant association with OS was observed for total CD8⁺ T cells, CD8⁺ZBED4⁺, or CD8−ZBED4− subsets (Supplementary Figure 3a–c). Univariate Cox analysis identified high ZBED4⁺ cell percentage, advanced age, pathological grade G3, higher T stage, TNM stage, HBcAg positivity, and vascular carcinoma embolus as adverse prognostic factors (p < 0.05) (Supplementary Figure 3d). Multivariate analysis confirmed that ZBED4⁺ cell percentage, age, and grade remained independent predictors of poor OS (Figure 9i).
Logistic regression revealed that HBsAg positivity was independently associated with high ZBED4 expression. Age was positively correlated, while cirrhosis and AFP ≥ 400μg/L were negatively correlated with ZBED4 expression (Supplementary Table 2). In the HBsAg-positive subgroup, baseline clinical features were balanced between ZBED4-high and -low groups (Supplementary Table 3). Kaplan-Meier analysis showed that high ZBED4⁺ percentage was significantly associated with reduced OS (P=0.023, HR=2.02) (Figure 9j). Univariate and multivariate Cox analyses confirmed that high ZBED4⁺ percentage was an independent negative prognostic factor, with a stronger effect than in the overall HCC cohort. Pathological grade G3 and the presence of vascular carcinoma embolus also remained significant in this subgroup (Supplementary Figure 3e and Figure 9k).
Discussion
The ZBED family comprises transcription factors essential for biological processes, such as cell differentiation and proliferation. Some ZBED members are linked to tumor development, affecting prognosis and chemotherapy response,6–13 while ZBED4’s role in cancer remains uncharacterized. This study highlights ZBED4’s role in the immune microenvironment and its relevance to HCC diagnosis, prognosis and therapy.
We analyzed ZBED4 mRNA expression in tumor and normal tissues, observing upregulation in most tumors except KICH. Overexpression of ZBED4 was linked to poorer prognosis in ACC, LIHC, MESO, SARC, and SKCM, while READ patients showed better outcomes. ZBED4 positively correlated with immunosuppressive cells (M2 macrophages, neutrophils, Tregs) across cancers. Conversely, it showed negative correlations with cytotoxic immune cells (CD8⁺ T cells, CD4⁺ T cells, NK cells). Research indicates that the TME significantly influences cancer progression, treatment response, and clinical outcomes, with specific immune cell infiltration, such as CD8⁺ and CD4⁺ T cells, as well as cancer-associated macrophages, neutrophil and Tregs, being key indicators.22–29 For example, higher CD8⁺ T cell levels are linked to better urothelial cancer outcomes,30 while more macrophages in the TME indicate worse gastric cancer prognoses.31 The study found ZBED4 correlates with immune checkpoint gene expression across cancers and is associated with TMB and MSI, suggesting it may influence immunotherapy responses. These findings suggest that ZBED4 could be a potential immunotherapy target in specific cancers.
HCC, a prevalent and lethal form of liver cancer, has few effective treatment options.32 Although medical advancements have been made, the five-year survival rate for HCC remains low.33 This study examined ZBED4’s role in HCC by evaluating expression, clinical relevance, immune significance, and drug sensitivity. ZBED4 demonstrated elevated mRNA expression in tumors compared to normal tissues, indicating its potential as a diagnostic and prognostic marker. Multiplex immunofluorescence analysis of HCC samples demonstrated that elevated ZBED4 expression correlates with reduced overall survival in HCC patients.
The immune cell composition in the TME significantly influences liver cancer biology, affecting tumor growth, progression, and treatment response.34 The study found that elevated ZBED4 expression in HCC tissues is linked to higher levels of Tregs and neutrophils, whereas reduced ZBED4 expression is associated with an increase in CD8⁺ T cells, activated memory CD4⁺ T cells, gamma/delta T cells, and activated NiK cells. Tregs are more numerous in HCC patients, due to lncRNA and proinflammatory signals that aid their differentiation and cancer progression.35,36 Neutrophils also contribute to HCC progression by recruiting macrophages and Tregs.37 Multiplex immunofluorescence demonstrated an inverse correlation between ZBED4 expression and CD8⁺ T cell infiltration in HCC tissues. CD8⁺ T cells and CD57⁺ NK cells are key cytotoxic cells against HCC,38 while gamma/delta T cells help reduce postoperative recurrence and are crucial for early tumor surveillance.39 The elevated expression of immune checkpoint genes in the high-ZBED4 group indicates inhibited T cell activation, resulting in T cell exhaustion as noted in previous studies.40 Thus, ZBED4 fosters an immunosuppressive microenvironment, impairing the anti-tumor immune response in HCC. In conjunction with single-cell sequencing analysis, it was observed that ZBED4 exhibits elevated expression levels in T cells within the TME, particularly in CD8⁺ T cells or CD8⁺ Tex cells. Unlike CD4⁺ T cells or CD4⁺ Tex cells, the presence of CD8⁺ T cells or CD8⁺ Tex cells in HCC was strongly linked to OS and recurrence-free survival.41 Notably, both CD8⁺ZBED4− and CD8⁺ZBED4⁺ cells were more abundant in paracancerous tissues, and a higher proportion of CD8⁺ZBED4− cells in tumors was positively correlated with patient survival. These findings support a model in which ZBED4 contributes to CD8⁺ T cell dysfunction and immunosuppression in the HCC microenvironment. Furthermore, subgroup analysis revealed that ZBED4 expression was independently associated with worse prognosis specifically in HBsAg-positive patients, suggesting its potential as a stratified biomarker in hepatitis B-related HCC.
Many targeted therapies are approved or under trial for various cancers. However, their effectiveness in HCC is limited by drug resistance.42,43 Identifying responsive patients is essential. We found that higher ZBED4 expression in HCC may enhance responses to chemotherapy and targeted therapies, suggesting ZBED4 as a potential drug sensitivity biomarker. However, high ZBED4 levels correlate with poorer outcomes in ICB therapy. Immune-based therapies have shown promise as treatments for cancers such as HCC. Early trials led to FDA approval of nivolumab and pembrolizumab;44–46 however, later large-scale studies failed to confirm these results.47,48 The liver’s immunosuppressive environment likely contributed to these failures, suggesting combination therapies might be more effective. The Phase 3 IMBRAVE150 trial established atezolizumab combined with bevacizumab as a novel first-line therapy for advanced HCC globally.49 Our pan-cancer and HCC-specific analyses provide a foundation for future lab studies. For example, ZBED4’s role in T-cell exhaustion could be tested in co-culture systems with PD-1 blockade. Additionally, combining ZBED4-targeted therapy with immunotherapy might be a promising strategy for further research.
In summary, our integrated bioinformatics and clinical analyses establish ZBED4 as a novel prognostic biomarker in HCC, demonstrating its significant association with: (1) immunosuppressive tumor microenvironment, (2) adverse prognosis, and (3) differential responses to therapies. However, several limitations should be noted: Despite the strengths of our multi-omics approach, the retrospective nature and dependence on public datasets necessitate validation in prospective cohorts. Although we identified strong correlations between ZBED4 expression and immune evasion mechanisms, particularly valuable would be experiments combining ZBED4 siRNA or neutralizing antibodies with anti-PD-1 treatment in immunocompetent HCC mouse models, which could simultaneously evaluate tumor growth control, immune cell profiling, and transcriptomic changes. The clinical applicability of ZBED4 detection in liquid biopsies (eg, circulating tumor DNA) remains unexplored and represents an important area for future translation research. These limitations highlight crucial next steps for translating our findings into clinical practice, while the current results provide a strong foundation for both mechanistic studies and therapeutic development targeting ZBED4 in HCC. Future work should focus on combining functional validation with clinical biomarker development to fully realize ZBED4’s potential in improving HCC management.
Conclusion
Our study highlights ZBED4 as a promising biomarker for survival prediction and treatment response in HCC, closely linked to immune infiltration. It suggests ZBED4 shows promise as a therapeutic target, warranting further study.
Consent for Publication
All authors have approved the manuscript for publication. Data and materials are accessible upon request. The study’s original contributions are incorporated within the article. For additional questions, please contact the corresponding author.
Declarations
This retrospective study was conducted in accordance with the ethical standards of the institutional and national research committees and the Declaration of Helsinki (revised in 2013). The Ethics Committee of Sichuan Cancer Hospital approved the study and waived the requirement for informed consent due to its retrospective nature (Approval No.: SCCHEC-02-2021-070). Patient privacy was rigorously protected, as all data were anonymized prior to analysis.
Acknowledgments
We acknowledge financial support from the National Natural Science Foundation of China (Grant No. 82002580, 82003196, 82270198), Postdoctoral Project of Sichuan Provincial Human Resources and Social Security Department (Grant No. TB2023018) and Outstanding Young Scientific and Technological Talents Fund of Sichuan Province (Grant No. 2022JDJQ0059).
Author Contributions
All authors made a significant contribution to the work reported, whether in conception, study design, execution, data acquisition, analysis, interpretation, or all these areas; took part in drafting, revising, or critically reviewing the article; gave final approval of the version to be published; agreed on the journal for submission; and agree to be accountable for all aspects of the work.
Funding
This research was funded by the National Natural Science Foundation of China (Grant No. 82002580, 82003196, and 82270198), Postdoctoral Project of Sichuan Provincial Human Resources and Social Security Department (Grant No. TB2023018) and the Outstanding Young Scientific and Technological Talents Fund of Sichuan Province (Grant No. 2022JDJQ0059).
Disclosure
The authors report no conflicts of interest in this work.
References
1. Llovet JM, Kelley RK, Villanueva A, et al. Hepatocellular carcinoma. Nat Rev Dis Primers. 2021;7(1):6. doi:10.1038/s41572-020-00240-3
2. Sung H, Ferlay J, Siegel RL, et al. Global cancer statistics 2020: GLOBOCAN estimates of incidence and mortality worldwide for 36 cancers in 185 countries. CA Cancer J Clin. 2021;71(3):209–249. doi:10.3322/caac.21660
3. Llovet JM, De Baere T, Kulik L, et al. Locoregional therapies in the era of molecular and immune treatments for hepatocellular carcinoma. Nat Rev Gastroenterol Hepatol. 2021;18(5):293–313. doi:10.1038/s41575-020-00395-0
4. Greten TF, Lai CW, Li G, Staveley-O’Carroll KF. Targeted and immune-based therapies for hepatocellular carcinoma. Gastroenterology. 2019;156(2):510–524. doi:10.1053/j.gastro.2018.09.051
5. Zeng CW, Sheu JC, Tsai HJ. Genomic structure, protein character, phylogenic implication, and embryonic expression pattern of a zebrafish new member of zinc finger BED-type gene family. Genes. 2023;14(1):179. doi:10.3390/genes14010179
6. Hayward A, Ghazal A, Andersson G, Andersson L, Jern P. ZBED evolution: repeated utilization of DNA transposons as regulators of diverse host functions. PLoS One. 2013;8(3):e59940. doi:10.1371/journal.pone.0059940
7. Jiang S, Wang Y, Xiong Y, Feng Y, Tang J, Song R. High expression of ZBED1 affects proliferation and apoptosis in gastric cancer. Int J Clin Exp Pathol. 2018;11(8):4019–4025.
8. Somerville TDD, Xu Y, Wu XS, et al. ZBED2 is an antagonist of interferon regulatory factor 1 and modifies cell identity in pancreatic cancer. Proc Natl Acad Sci U S A. 2020;117(21):11471–11482. doi:10.1073/pnas.1921484117
9. Liu D, Hao Q, Li J, et al. ZBED2 expression enhances interferon signaling and predicts better survival of estrogen receptor-negative breast cancer patients. Cancer Commun. 2022;42(7):663–667. doi:10.1002/cac2.12296
10. Chen T, Li M, Ding Y, et al. Identification of zinc-finger BED domain-containing 3 (Zbed3) as a novel Axin-interacting protein that activates Wnt/beta-catenin signaling. J Biol Chem. 2009;284(11):6683–6689. doi:10.1074/jbc.M807753200
11. Liu H, Shi X, Fan X, et al. The function of BED finger domain of Zbed3 in regulating lung cancer cell proliferation. J Cell Biochem. 2019;120(8):12340–12347. doi:10.1002/jcb.28498
12. Akhtar Ali M, Younis S, Wallerman O, Gupta R, Andersson L, Sjöblom T. Transcriptional modulator ZBED6 affects cell cycle and growth of human colorectal cancer cells. Proc Natl Acad Sci U S A. 2015;112(25):7743–7748. doi:10.1073/pnas.1509193112
13. Huang X, Zhou H, Yang X, et al. Construction and analysis of expression profile of exosomal lncRNAs in pleural effusion in lung adenocarcinoma. J Clin Lab Anal. 2022;36(12):e24777. doi:10.1002/jcla.24777
14. Saghizadeh M, Akhmedov NB, Yamashita CK, et al. ZBED4, a BED-type zinc-finger protein in the cones of the human retina. Invest Ophthalmol Vis Sci. 2009;50(8):3580–3588. doi:10.1167/iovs.08-2751
15. Farber DB, Theendakara VP, Akhmedov NB, Saghizadeh M. ZBED4, a novel retinal protein expressed in cones and Müller cells. Adv Exp Med Biol. 2010;664:79–87. doi:10.1007/978-1-4419-1399-9_10
16. Han Y, Wang Y, Dong X, et al. TISCH2: expanded datasets and new tools for single-cell transcriptome analyses of the tumor microenvironment. Nucleic Acids Res. 2023;51(D1):D1425–D1431. doi:10.1093/nar/gkac959
17. Thorsson V, Gibbs DL, Brown SD, et al. The immune landscape of cancer. Immunity. 2018;48(4):812–830.e14. doi:10.1016/j.immuni.2018.03.023
18. Bonneville R, Krook MA, Kautto EA, et al. Landscape of microsatellite instability across 39 cancer types. JCO Precis Oncol. 2017;2017:
19. Jiang P, Gu S, Pan D, et al. Signatures of T cell dysfunction and exclusion predict cancer immunotherapy response. Nat Med. 2018;24(10):1550–1558. doi:10.1038/s41591-018-0136-1
20. Lian H, Han YP, Zhang YC, et al. Integrative analysis of gene expression and DNA methylation through one-class logistic regression machine learning identifies stemness features in medulloblastoma. Mol Oncol. 2019;13(10):2227–2245. doi:10.1002/1878-0261.12557
21. Cancer Genome Atlas Research Network; Malta TM, Sokolov A, Gentles AJ, et al. Machine learning identifies stemness features associated with oncogenic dedifferentiation. Cell. 2018;173(2):338–354.e15. doi:10.1016/j.cell.2018.03.034
22. Turley SJ, Cremasco V, Astarita JL. Immunological hallmarks of stromal cells in the tumour microenvironment. Nat Rev Immunol. 2015;15(11):669–682. doi:10.1038/nri3902
23. Pitt JM, Marabelle A, Eggermont A, Soria JC, Kroemer G, Zitvogel L. Targeting the tumor microenvironment: removing obstruction to anticancer immune responses and immunotherapy. Ann Oncol. 2016;27(8):1482–1492. doi:10.1093/annonc/mdw168
24. Xiao Y, Yu D. Tumor microenvironment as a therapeutic target in cancer. Pharmacol Ther. 2021;221:107753. doi:10.1016/j.pharmthera.2020.107753
25. Deepak KGK, Vempati R, Nagaraju GP, et al. Tumor microenvironment: challenges and opportunities in targeting metastasis of triple negative breast cancer. Pharmacol Res. 2020;153:104683. doi:10.1016/j.phrs.2020.104683
26. Jin MZ, Jin WL. The updated landscape of tumor microenvironment and drug repurposing. Signal Transduct Target Ther. 2020;5(1):166. doi:10.1038/s41392-020-00280-x
27. Kim J, Bae JS. Tumor-associated macrophages and neutrophils in tumor microenvironment. Mediators Inflamm. 2016;2016:6058147. doi:10.1155/2016/6058147
28. Nakamura K, Smyth MJ. Myeloid immunosuppression and immune checkpoints in the tumor microenvironment. Cell Mol Immunol. 2020;17(1):1–12. doi:10.1038/s41423-019-0306-1
29. Lim AR, Rathmell WK, Rathmell JC. The tumor microenvironment as a metabolic barrier to effector T cells and immunotherapy. Elife. 2020;9:e55185. doi:10.7554/eLife.55185
30. Faraj SF, Munari E, Guner G, et al. Assessment of tumoral PD-L1 expression and intratumoral CD8⁺ T cells in urothelial carcinoma. Urology. 2015;85(3):703.e1–6. doi:10.1016/j.urology.2014.10.020
31. Gambardella V, Castillo J, Tarazona N, et al. The role of tumor-associated macrophages in gastric cancer development and their potential as a therapeutic target. Cancer Treat Rev. 2020;86:102015. doi:10.1016/j.ctrv.2020.102015
32. Anwanwan D, Singh SK, Singh S, Saikam V, Singh R. Challenges in liver cancer and possible treatment approaches. Biochim Biophys Acta Rev Cancer. 2020;1873(1):188314. doi:10.1016/j.bbcan.2019.188314
33. Zheng Y, Wang S, Cai J, Ke A, Fan J. The progress of immune checkpoint therapy in primary liver cancer. Biochim Biophys Acta Rev Cancer. 2021;1876(2):188638. doi:10.1016/j.bbcan.2021.188638
34. Binnewies M, Roberts EW, Kersten K, et al. Understanding the tumor immune microenvironment (TIME) for effective therapy. Nat Med. 2018;24(5):541–550. doi:10.1038/s41591-018-0014-x
35. Yang XH, Yamagiwa S, Ichida T, et al. Increase of CD4⁺ CD25⁺ regulatory T-cells in the liver of patients with hepatocellular carcinoma. J Hepatol. 2006;45(2):254–262. doi:10.1016/j.jhep.2006.01.036
36. Ormandy LA, Hillemann T, Wedemeyer H, Manns MP, Greten TF, Korangy F. Increased populations of regulatory T cells in peripheral blood of patients with hepatocellular carcinoma. Cancer Res. 2005;65(6):2457–2464. doi:10.1158/0008-5472.CAN-04-3232
37. Zhou SL, Zhou ZJ, Hu ZQ, et al. Tumor-associated neutrophils recruit macrophages and T-regulatory cells to promote progression of hepatocellular carcinoma and resistance to sorafenib. Gastroenterology. 2016;150(7):1646–1658.e17. doi:10.1053/j.gastro.2016.02.040
38. Ruf B, Heinrich B, Greten TF. Immunobiology and immunotherapy of HCC: spotlight on innate and innate-like immune cells. Cell Mol Immunol. 2021;18(1):112–127. doi:10.1038/s41423-020-00572-w
39. Cai XY, Wang JX, Yi Y, et al. Low counts of γδ T cells in peritumoral liver tissue are related to more frequent recurrence in patients with hepatocellular carcinoma after curative resection. Asian Pac J Cancer Prev. 2014;15(2):775–780. doi:10.7314/APJCP.2014.15.2.775
40. Oura K, Morishita A, Tani J, Masaki T. Tumor immune microenvironment and immunosuppressive therapy in hepatocellular carcinoma: a review. Int J Mol Sci. 2021;22(11):5801. doi:10.3390/ijms22115801
41. Fangming L, Weiren L, David ES, et al. Heterogeneity of exhausted T cells in the tumor microenvironment is linked to patient survival following resection in hepatocellular carcinoma. Oncoimmunology. 2020;9(1):1746573. doi:10.1080/2162402X.2020.1746573
42. Harsha C, Banik K, Ang HL, et al. Targeting AKT/mTOR in oral cancer: mechanisms and advances in clinical trials. Int J Mol Sci. 2020;21(9):3285. doi:10.3390/ijms21093285
43. Jiaojiao Z, Siying W, Lei X, et al. Hepatocellular carcinoma: signaling pathways and therapeutic advances. Signal Transduct Target Ther. 2025;10(1):35. doi:10.1038/s41392-024-02075-w
44. Sangro B, Gomez-Martin C, de la Mata M, et al. A clinical trial of CTLA-4 blockade with tremelimumab in patients with hepatocellular carcinoma and chronic hepatitis C. J Hepatol. 2013;59(1):81–88. doi:10.1016/j.jhep.2013.02.022
45. El-Khoueiry AB, Sangro B, Yau T, et al. Nivolumab in patients with advanced hepatocellular carcinoma (CheckMate 040): an open-label, non-comparative, Phase 1/2 dose escalation and expansion trial. Lancet. 2017;389(10088):2492–2502. doi:10.1016/S0140-6736(17)31046-2
46. Zhu AX, Finn RS, Edeline J, et al. Pembrolizumab in patients with advanced hepatocellular carcinoma previously treated with sorafenib (KEYNOTE-224): a non-randomised, open-label Phase 2 trial. Lancet Oncol. 2018;19(7):940–952. doi:10.1016/S1470-2045(18)30351-6
47. Yau T, Park JW, Finn RS, et al. Nivolumab versus sorafenib in advanced hepatocellular carcinoma (CheckMate 459): a randomised, multicentre, open-label, phase 3 trial. Lancet Oncol. 2022;23(1):77–90. doi:10.1016/S1470-2045(21)00604-5
48. Finn RS, Ryoo BY, Merle P, et al. Pembrolizumab as second-line therapy in patients with advanced hepatocellular carcinoma in KEYNOTE-240: a randomized, double-blind, Phase III trial. J Clin Oncol. 2020;38(3):193–202. doi:10.1200/JCO.19.01307
49. Finn RS, Qin S, Ikeda M, et al. Atezolizumab plus bevacizumab in unresectable hepatocellular carcinoma. N Engl J Med. 2020;382(20):1894–1905. doi:10.1056/NEJMoa1915745
 © 2025 The Author(s). This work is published and licensed by Dove Medical Press Limited. The
full terms of this license are available at https://www.dovepress.com/terms
and incorporate the Creative Commons Attribution
- Non Commercial (unported, 4.0) License.
By accessing the work you hereby accept the Terms. Non-commercial uses of the work are permitted
without any further permission from Dove Medical Press Limited, provided the work is properly
attributed. For permission for commercial use of this work, please see paragraphs 4.2 and 5 of our Terms.
© 2025 The Author(s). This work is published and licensed by Dove Medical Press Limited. The
full terms of this license are available at https://www.dovepress.com/terms
and incorporate the Creative Commons Attribution
- Non Commercial (unported, 4.0) License.
By accessing the work you hereby accept the Terms. Non-commercial uses of the work are permitted
without any further permission from Dove Medical Press Limited, provided the work is properly
attributed. For permission for commercial use of this work, please see paragraphs 4.2 and 5 of our Terms.