Back to Journals » International Journal of Nanomedicine » Volume 16
Wheat Germ Agglutinin-Conjugated Disulfide Cross-Linked Alginate Nanoparticles as a Docetaxel Carrier for Colon Cancer Therapy
Received 18 January 2021
Accepted for publication 18 March 2021
Published 22 April 2021 Volume 2021:16 Pages 2995—3020
DOI https://doi.org/10.2147/IJN.S302238
Checked for plagiarism Yes
Review by Single anonymous peer review
Peer reviewer comments 2
Editor who approved publication: Professor Israel Rubinstein
Hock Ing Chiu, Vuanghao Lim
Integrative Medicine Cluster, Advanced Medical and Dental Institute, Universiti Sains Malaysia, Kepala Batas, Penang, Malaysia
Correspondence: Vuanghao Lim
Integrative Medicine Cluster, Advanced Medical and Dental Institute, Universiti Sains Malaysia, Bertam, Kepala Batas, 13200, Penang, Malaysia
Tel +604-5622427
Fax +604-5622468
Email [email protected]
Purpose: In chemotherapy, oral administration of drug is limited due to lack of drug specificity for localized colon cancer cells. The inability of drugs to differentiate cancer cells from normal cells induces side effects. Colonic targeting with polymeric nanoparticulate drug delivery offers high potential strategies for delivering hydrophobic drugs and fewer side effects to the target site. Disulfide cross-linked polymers have recently acquired high significance due to their potential to degrade in reducing colon conditions while resisting the upper gastrointestinal tract’s hostile environment. The goal of this project is, therefore, to develop pH-sensitive and redox-responsive fluorescein-labeled wheat germ agglutinin (fWGA)-mounted disulfide cross-linked alginate nanoparticles (fDTP2) directly targeting docetaxel (DTX) in colon cancer cells.
Methods: fDTP2 was prepared by mounting fWGA on DTX-loaded nanoparticles (DTP2) using the two-step carbodiimide method. Morphology of fDTP2 was examined using scanning electron microscopy (SEM) and transmission electron microscopy (TEM). Dynamic light scattering (DLS) study was carried out to determine the mean diameter, polydispersity index (PDI) and zeta potential of fDTP2. Cellular uptake efficiency was examined using fluorescence microplate reader. Biocompatibility and active internalization of fDTP2 were conducted on HT-29.
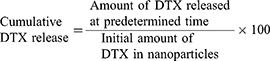
Results: fDTP2 was found to exhibit a DTX loading efficiency of 19.3%. SEM and TEM tests revealed spherical nanoparticles. The in vitro DTX release test showed a cumulative release of 54.7%. From the DLS study, fDTP2 reported a 277.7 nm mean diameter with PDI below 0.35 and − 1.0 mV zeta potential. HT-29 which was fDTP2-treated demonstrated lower viability than L929 with a half maximal inhibitory concentration (IC50) of 34.7 μg/mL. HT-29 (33.4%) internalized fDTP2 efficiently at 2 h incubation. The study on HT-29 active internalization of nanoparticles through fluorescence and confocal imaging indicated such.
Conclusion: In short, fDTP2 demonstrated promise as a colonic drug delivery DTX transporter.
Keywords: polymeric nanocarrier, targeting ligand, HT-29, anticancer drug
Introduction
Conventional chemotherapy is observed to be less successful in treating colorectal cancer owing to its unspecific means of drug delivery.1 Oral administration of anticancer drugs involves loss of effectiveness in targeting the drugs to the specific gastrointestinal tract (GIT) site since drugs are absorbed or deteriorated in the upper GIT.2 This non-specific drug delivery mechanism also causes elevated toxicity from the drug administered to normal tissues, resulting in extreme side effects such as liver toxicity, vomiting, nausea, mucositis, diarrhea, hand-foot syndrome, anemia and neutropenia.3 Nanoparticle-based drug delivery technologies seem promising to enhance drug pharmacokinetics and improve the effectiveness of cancer treatment. This is because nanoparticles are easily accumulated at the tumor site through passive targeting via permeability and retention (EPR) effect due to a deficient vasculature and tumor tissue drainage system.4 Nanoparticles developed from natural polymers are especially advantageous due to their biodegradability and biocompatibility. Nanoparticle-based drug delivery systems provide various benefits, including longer half-life drug circulation, increased drug bioavailability, elevated solubility and better stability, controlled drug release and efficient targeting.5–8 Therefore, nanoparticle-based drug delivery systems represent a promising vehicle for transporting anticancer drugs to cancer cells.
Nanoparticles developed from disulfide polymers have attracted significant attention in colon-targeted drug delivery systems. This is attributable to their peculiar redox-responsive characteristic, where disulfide bonds are only cleaved by the colon’s low-redox potential reductive environment. Specifically, encapsulated drugs are released at the colon as the target site.9 Thiol groups of thiolated polymers are air-oxidized and self-assembled in an aqueous solution for disulfide cross-linking, offering high stability for nanoparticles.10 This scenario will prevent premature release during transit via the GIT.11 High glutathione (GSH) concentration (low redox potential) is the gateway for this colonic drug delivery mechanism. The GSH concentration is 7 times higher in cancer cells than in normal cells.12 Due to the colon’s lower redox potential (−415 mV) relative to the normal reduction potential of disulfide bonds (−250 mV), disulfide bond cleavage is desirable in the colon.10 Thus, the redox responsive condition in conjunction with pH-sensitive polymeric nanoparticles could also be used as a trigger for selective release of anticancer agents in colon cancer cells.
Alginate is a linear hydrophilic polysaccharide consisting of β-D-mannuronic acid (M-block) and α-L-guluronic acid (G-block) monomers.13 High binding affinity of the guluronic residues with divalent ions such as calcium ion (Ca2+) results in a three-dimensional network of ionic interactions14 This network facilitates the generation of alginate pellets, films, gel, beads, microparticles and nanoparticles15 In a hydrated condition, intermolecular hydrogen bonds stabilize the alginate structure.16 At low pH, alginate shrinks and becomes porous, insoluble alginic acid while at high pH, it can be converted into soluble viscous alginate.17 As stated earlier in the literature, alginate hydrophobicity and hydrophilicity can be modified by carboxy group protonation (acidic condition) and deprotonation (basic condition) in the backbone chain.18 Therefore, alginate’s pH-dependent actions may be manipulated as a “smart” drug carrier utilizing a controlled release mechanism19 Furthermore, alginate is recognized as a strong mucoadhesive agent due to its anionic existence at the carboxyl end, allowing adherence to mucosal tissues.20 Such adherence slows the drug transit period and increases the duration at the absorption site.21 Alginate thus greatly improves drug bioavailability and is commonly used in pharmaceutical, cosmetic and food industries.22
DTX is an antimicrotubule anticancer agent in the taxane family.23 It is a semi-synthetic compound originating from 10-deacetylbacattin III, a precursor isolated from the European yew tree needle, Taxus baccata.24 DTX is an 807.9 g/mol white powder with the following empirical formula: C43H53NO14.25 To date, DTX has displayed antitumor efficacy against numerous human tumors, including cervical cancer, prostate cancer, non-small cell lung cancer, stomach cancer, breast cancer, leukemia and colon cancer.26 It interferes with mitosis in cells, where DTX-tubulin binding promotes tubulin polymerization into microtubules and prevents microtubule disassembly.25 This results in G2/M cell cycle arrest and latterly cell death.27 Currently, the commercially usable dose of DTX in the intravenous application form are Taxotere® and Docefrez®.28 Taxotere consists of 40 mg/mL DTX and 1040 mg/mL Tween 80 and 13% ethanol before administration.29 Tween 80 is used to dissolve the DTX owing to its low water solubility, 3 μg/mL.30 Taxotere-related side effects include acute hypersensitivity, hypotension, fluid accumulation, myelosuppression, neutropenia, peripheral neurotoxicity, epithelial necrosis, vomiting and diarrhea.23 Tween 80 in both Taxotere and Docefrez can cause peripheral neuropathy and acute hypersensitivity reactions as well as severe hemolytic activity. Further this, Tween 80 also acts as an inhibitor to albumin based drug transport by restraining the binding of DTX to albumin.28 Therefore, a more rigorous dose is needed to optimize the negative effects induced by the inclusion of Tween 80 in the Taxotere and Docefrez formulations.
Most cell membranes are glycosylated, acting as lectin-binding sites, such as wheat germ agglutinin (WGA).31 WGA is a Triticum vulgare-isolated plant lectin, primarily binding to N-acetylglucosamine and glycoconjugate membrane sialic acid, glycocalyx.32 WGA displays toxicity thresholds in epithelial cells varying from 0.14 to 1.4 μM and is moderately stable in acidic environments and prone to proteolytic degradation.33 WGA has outstanding mucoadhesive properties since it is strongly binding to mucus layer glycoproteins.34 Cellular uptake is triggered when WGA attaches to its cell surface receptor, accompanied by clathrin and caveolae-mediated endocytosis.35 WGA was commonly used in oral drug delivery owing to its susceptibility to proteolysis and facilitation in specific receptor-mediated endocytosis.34 A histochemical analysis found that WGA is strongly bound to human colorectal cell lines such as HT-29, HCT-8 and Caco-2.31 Studies have shown that positive WGA is strongly attracted to negatively charged sialic acid in colon cancer cells.36 Therefore, WGA may be a strong ligand for colonic delivery.
In this study, pH-sensitive and reduction-responsive fluorescein-labeled wheat germ agglutinin (fWGA)-mounted nanoparticles prepared from thiolated alginate were synthesized to enhance site-specific DTX distribution to colon cancer cells. Work began with attaching thiol groups to sodium alginate. Nanoparticles were prepared using self-assembly techniques in which thiol groups are oxidized to form disulfide bonds in the polymer matrix. Nanoparticle surface functionalization was done with fWGA and characterized by electron microscopy (TEM), electron microscopy scanning (SEM) and dynamic light scattering (DLS). Stability, reduction-response, pH-sensitivity, in vitro DTX release, cell viability and cell absorption of nanoparticles were also examined.
Materials and Methods
Materials
Thioglycolic acid ≥ 98%, sodium alginate, glycine, 1-(3-dimethylaminopropyl)-3-ethylcarbodiimide hydrochloride (EDAC) ≥ 99%, N-hydroxysuccinimide (NHS), sodium nitroprusside, 5,5ʹ-dithiobis(2-nitrobenzoic acid) (Ellman’s reagent), dodecyl sulfate sodium salt (SDS) and potassium bromide were obtained from Sigma Aldrich (Saint Louis, MO, USA). Glutathione reduced, free acid (GSH) was purchased from Calbiochem (Tokyo, Japan). Ammonium hydrogen bicarbonate, sodium hydroxide (NaOH), potassium dihydrogen phosphate (KH2PO4), and di-sodium hydrogen phosphate (Na2HPO4·2H2O) were obtained from R&M chemicals (Essex, UK). DTX was obtained from Tokyo Chemical Industry (TCI) (Tokyo, Japan). Fluorescein-labelled wheat germ agglutinin (fWGA) was purchased from Vector Laboratories (Burlingame, CA, USA). A Micro BCA protein assay kit was purchased from Thermo Fisher (San Diego, CA, USA). 3-(4,5-dimethylthiazol-2-yl)-2,5-diphenyltetrazolium bromide (MTT), Tween 20, and dimethyl sulfoxide (DMSO) ≥ 99.5% were purchased from Sigma Aldrich (Saint Louis, MO, USA). Roswell Park Memorial Institute 1640 (RPMI), penicillin-streptomycin, and paraformaldehyde (PFA) were acquired from Nacalai Tesque (Kyoto, Japan). Dulbecco’s modified eagle medium (DMEM), trypan blue and trypsin-EDTA were obtained from Gibco (Grand Island, NY, USA). Bovine serum albumin (BSA), Triton X-100 and phosphate buffer saline (PBS) were obtained from Invitrogen (Carlsbad, NY, USA). ProLong diamond antifade mountant with 4ʹ,6-diamidino-2-phenylindole (DAPI) was purchased from Thermo Fisher (Waltham, MA, USA). Primary antibody, Anti-Clathrin antibody and secondary antibody Goat Anti-Rabbit IgG H&L (Alexa Fluor® 647) were acquired from Abcam (Cambridge, MA, USA).
Methods
Synthesis of Thiolated Alginate
Thiolated alginate was synthesized referring to37 with some modifications (Figure 1).
 |
Figure 1 Thioglycolic acid esterification of sodium alginate. |
Briefly, 1 mole of sodium alginate (2.16 g) was solubilized in hot water (50 mL) and stirred at 1000 rpm at 80 °C. Then, 1 mole of thioglycolic acid (1.22 mL) and hydrochloric acid (2.00 mL, 7 N) were added into the solution. This mixture was left to react at 80 °C for 150 min under reflux conditions. The mixture was then poured into 100 mL of absolute ethanol. White precipitate of thiolated polymer (TGA1) obtained from the reaction was washed several times with absolute ethanol. The thiolated polymer was stored at −80 °C for 4 h and lyophilized overnight using the Alpha 1–4 LSC freeze dryer (Martin Christ, Germany).
Thiolated polymers with different feed molar ratios of sodium alginate with thioglycolic acid (1:2, 1:3 and 1:5) were synthesized according to the procedures stated above and labelled as TGA2, TGA3 and TGA4.
Characterizations of TGA
Sodium nitroprusside reagent (Na2Fe(CN)5NO) was used to detect the thiol groups in TGA.38 The sample was dissolved in 0.25 N aqueous sodium hydroxide. 35% w/v ammonium hydrogen carbonate was used to adjust the pH of the polymer solution to 9.0. Then, 5% w/v sodium nitroprusside solution was added to the resulting solution and any color changes of the solution was observed.
Ellman’s method was utilized to determine the thiol substitution degree on the thiolated sodium alginate samples.39 2.5 mL of 0.25 N sodium hydroxide aqueous was added to dissolve 5 mg of samples or the control. 5 mL of 0.5 M KH2PO4 was mixed with 95 mL of 0.5 M Na2HPO4·2H2O to prepare 100 mL of pH 8.0, 0.5 M phosphate buffer. The resulting pH was further adjusted using KH2PO4 (acidic) or Na2HPO4·2H2O (basic). Then, the polymer solution was diluted with 250 µL 0.5 M pH 8.0 phosphate buffer. 500 µL of Ellman’s reagent (0.03% w/v 5,5ʹ-dithiobis (2-nitrobenzoic acid) in 0.5 M pH 8.0 phosphate buffer) was incubated with the diluted solution for 15 min at 25 °C. Using the PowerWave XS UV/Vis absorbance microplate reader (Biotek, Vermont, USA) at 450 nm, the absorbance of the mixture was assessed. To quantify the amount of thiol groups in the polymers, the standard curve was prepared by reacting standard thioglycolic acid solutions with Ellman ‘s reagent.
The KBr discs of sodium alginate (control) and thiolated sodium alginate samples were analyzed using Nexus 670 FTIR spectroscopy (Thermo Nicolet, USA) within 4000–400 cm−1. 1H sodium alginate (control) and thiolated sodium alginate samples were examined in D2O/NaOD using 400 MHz Bruker AC 400 NMR spectroscopy (Bruker, Germany).
Preparation of Blank Disulfide Cross-Linked Nanoparticles
Thiolated alginate was developed into blank disulfide cross-linked nanoparticles by referring to10 with few alterations. Briefly, 10 mg thiolated alginate was dissolved in 0.25 N sodium hydroxide solution (10 mL) and stirred in an ice bath for 1 h at 1000 rpm. Afterwards, the solution was left to react in the dark at 25 °C for 24 h. The solution was ultrasonicated for 15 min and cooled down to room temperature. The resulting solution was then stored at −80 °C for 4 h and lyophilized overnight using the freeze dryer. The nanoparticles prepared using TGA1, TGA2, TGA3 and TGA4 were labelled as TP1, TP2, TP3 and TP4, respectively.
Preparation of DTX-Loaded Nanoparticles
Under stirring, thiolated alginate (TGA1, 10 mg) was dissolved in 0.25 N sodium hydroxide aqueous solution (10 mL). Then, the polymer solution was reacted with 0.01% w/v of ethanolic DTX solution and stirred at 4 °C for 1 h. Next, the solution was left to react in the dark at 25 °C for 24 h and ultrasonicated for 15 min. The DTX-loaded nanoparticles were recovered by 30 min centrifugation at 18,514 × g. The pellet was washed thrice with ethanol to get rid of the free DTX. Then, the nanoparticles were lyophilized to yield DTX-loaded nanoparticles.10 This procedure was repeated with TGA2, TGA3, and TGA4 polymers. The DTX-loaded sodium alginate nanoparticles were named as DTP1, DTP2, DTP3, and DTP4, respectively.
Preparation of fWGA-Conjugated Nanoparticles
From the characterization studies of DTX-loaded nanoparticles, DTP2 was chosen for further study. The carboxyl group of DTP2 disulfide cross-linked alginate nanoparticles were conjugated with the amine group of fluorescein-labelled wheat germ agglutinin (fWGA)40 as shown in Figure 2.
 |
Figure 2 The two-stage carbodiimide reaction and resulting fWGA conjugation. |
The nanoparticles sample (13 mg) was dissolved in PBS (1 mL). 1 mL of 3.5% w/v EDAC and 1 mL of 0.15% w/v NHS were added to the suspension. After 2 h of incubation at 25 °C, the suspension was centrifuged to discard the supernatant. The obtained nanoparticles were washed thrice with ethanol. 1 mL of the resuspended nanoparticles in PBS was reacted with 200 µL of 0.1% w/v fWGA. The mixture was left to react at room temperature for 18 h. 200 µL of 20% w/v glycine in PBS was then pipetted into the solution and further left to react for 1 h. The nanoparticles were washed thrice with ethanol. The nanoparticles were lyophilized using the freeze dryer. The products obtained were labelled as fDTP2.
Characterization of Blank, DTX-Loaded and fWGA-Conjugated Nanoparticles
The zeta potential and mean diameter of the nanoparticles were examined by DLS using the Nano ZS Zetasizer (Malvern Instruments, Worcestershire, USA). The scattered light was measured at a 90° angle at room temperature. Deionized water was used to dilute the samples and filtrated with a 0.45 µm syringe filter before measurements.
LEO Stereoscan 4201 SEM (Leica Electron Optics, Cambridge Instruments Ltd, Cambridge, UK) and Libra 120 TEM (Carl Zeiss, Oberkochen, Germany) were applied to examine the surface morphology of the nanoparticles. For SEM analysis, the samples were coated with gold utilizing the Polaron [Fisons] SC 515 sputter coater (Quorum Technologies Ltd, UK). Micrographs were taken using SEM at 10 kV (up to 30,000× magnifications). For TEM analysis, samples were added onto carbon films supported by a copper grid. 1% w/v phosphotungstic acid (PTA) solution staining was applied on the copper grid for 1 min at room temperature. Samples were then blotted with filter paper and air-dried. Micrographs were taken using TEM at 5 kV (up to 20,000× magnifications). The average sizes of the nanoparticles from SEM and TEM micrographs were measured using image J 1.51j8 analyzer software (National Institutes of Health, USA).
Stability Studies
The nanoparticles were stored in buffer solution (pH 7.4) at 25 °C for a month. The zeta potential and mean diameter of the nanoparticles were analyzed to determine the stability of the nanoparticles.12
pH-Sensitivity Studies
The aqueous nanoparticle suspensions were separated into seven parts. Adjustment of pH ranging from 2–8 was performed utilizing 0.1 M HCl and 0.1 M NaOH. The suspensions were then left to react for 24 h. The mean diameter of the nanoparticles for each pH suspension was measured at 25 °C.10
Reduction-Response Studies
The nanoparticles were placed in buffer solution (pH 7.4). The solution was then separated into three portions consisting of control, 10 µM and 10 mM of GSH. The zeta potential and mean diameter of the nanoparticles were determined utilizing zetasizer after 24 h.41
DTX Loading Efficiency and fWGA Conjugation Efficiency
The concentrations of DTX in supernatant and washing solutions from preparing the DTX-loaded nanoparticles were determined from the absorbance measurement at 230 nm using the Varian Cary 50 UV-Vis spectrophotometer (Varian Australia Pty Ltd, Australia).42 The loading efficiency % (LE) for the triplicate samples was calculated, and the results were averaged using the formula below:

The efficiency of fWGA conjugation of the nanoparticles was determined using Micro BCA Protein Assay Kit according to43 with some modifications. Briefly, 5 mg of fWGA-conjugated nanoparticles were dissolved in 500 µL PBS and incubated for 4 h in 2.5 mL of 0.05 N NaOH/0.5% w/v SDS at 37 °C. Micro BCA working solution (150 µL) was mixed with the sample solution (150 µL) in a microplate well and mixed thoroughly for 30 sec. The microplate was then left to react for 2 h at 37 °C. After being cooled down to room temperature, the samples’ absorbance at 562 nm was determined utilizing the UV/Vis microplate reader. A calibration curve within 1.3 to 40.0 µg/mL was constructed using standard solutions of fWGA in PBS. Solutions of fWGA-free nanoparticles were served as blank.
In vitro DTX Release Studies
To perform in vitro DTX release, nanoparticles were incubated at 37 °C in a shaker incubator at 50 rpm. Hydrochloric acid solution (pH 1.0) and phosphate buffer solution (pH 7.4) without GSH were prepared to mimic the stomach and small intestine conditions. While, phosphate buffer solution (pH 6.0) with and without GSH (colon) were used to simulate the pH and reducing environment of the GIT.10
DTX-loaded samples (20 mg) were divided and placed into two dialysis bags and suspended in conical flasks containing 10 mL of simulated stomach solution for 2.0 h. Then the samples were placed into the simulated small intestine solution for 3.0 h. The designated time is based on the average transit time in stomach (1.3 to 2.8 h) and small intestine (2.9 to 4.2 h).44 Regularly, about 5 h is needed for the administration of drug to reach the colon.45 Next, the samples were divided into two, first in a control consisting of pH 6.0 phosphate buffer solution, and second in 25 mM GSH pH 6.0 phosphate buffer solution. Release media (250 µL) was removed and replaced with 250 µL of fresh media at designated time intervals. The concentration of DTX was evaluated at 230 nm utilizing the UV-Vis spectrophotometer.46 The cumulative DTX release for the triplicate samples was determined and the results were averaged using the formula below:
Cell Culture
In cell culture experiments, HT-29 (colon cancer) and L929 (mice fibroblast) cell lines were purchased from American Type Culture Collection (Manassas, VA, USA). DMEM and RPMI containing 10% fetal bovine serum and 1% penicillin-streptomycin were used to culture L929 and HT-29, respectively.47 A 5% CO2 humidified incubator Haraeus BB15 (Thermo Fisher Scientific, Singapore) with the temperature set at 37 °C was used to incubate the cells. First, thawing of frozen cells was performed using a 37 °C water bath. The cells were withdrawn from the cryovial and centrifuged at 1000 rpm for 5 min. The supernatant was withdrawn and replaced with fresh growth media. The cell pellets were gently resuspended in the media and transferred into a new flask for cell culturing. After the cells reached 90% confluency, detachment of cells from the flask was conducted using 0.25% Trypsin-EDTA solution. 5 min centrifugation at 1000 rpm was performed to recover the cells. Then, the recovered cells were resuspended in growth media. The total number of cells in the suspension was counted using the trypan blue assay. A mixture of 10 µL of the cell suspension and 10 µL of the trypan blue was applied to the cell counting slide and counted using the TC10 automated cell counter (BIO-RAD, Philadelphia, USA). The cell suspension was then cultured for further experiments.
Cyto-Compatibility Studies – MTT Assay
Each well of a 96 well plate was seeded with 1×10⁴ cells. A 5% CO2 humidified incubator with the temperature set at 37 °C was used to incubate the cells. Nanoparticles were dissolved in growth media and serial diluted to prepare different treatment concentrations. The cells were incubated for 24 h. Afterwards, the media in each well was withdrawn and replenished with 100 µL of the nanoparticle suspensions. The untreated cells in the media served as the negative control. After being incubated for 24 h, the media were withdrawn from the wells and replenished with fresh media (100 µL). MTT solution (10 µL, 5 mg/mL) was pipetted into the wells for 4 h incubation. Afterwards, the MTT solution in each well was withdrawn and replenished with 100 µL of DMSO.48 The plate was shaken prior to measurement. The solution’s optical density was evaluated utilizing the 570 nm UV/Vis absorbance microplate reader. Cell viability for every triplicate sample was calculated (below) and the results were averaged.

Cellular Uptake Studies
Cellular Uptake Efficiency
1 ×10⁴ HT-29 cells were seeded in each well of a 96-well plate to measure cellular uptake quantitatively. The cells were incubated for 24 h at 37 °C under 5% CO2 condition. Afterwards, the medium was withdrawn. PBS was used to wash the cells thrice and 100 µL of the fWGA-conjugated DTX-loaded nanoparticles in PBS (concentration of 3.9–125.0 µg/mL) was pipetted into the sample wells (Isample) and positive wells (Ipositive). Meanwhile, the cells in the negative wells (Inegative) were treated with nanoparticles without fWGA conjugation. The cells were incubated for 0.5–4 hours at 37 °C. At predetermined times, the nanoparticle solution was removed from the sample wells and the cells were washed thrice with PBS. As this was going on, the nanoparticle solutions in the positive and negative wells remained in the wells.49 After that, 100 µL of Triton X-100 (0.5% in 0.2 N NaOH) was added to all the wells to solubilize the cells. A microplate fluorescence reader, FLUOstar (Omega, Germany), set at 485 nm excitations and 520 nm emission wavelength was applied to measure the fluorescence intensities. The uptake efficiency formula was calculated as below:

Fluorescent Imaging
Fluorescent imaging of the cellular uptake of the nanoparticles was carried out according to50 with some alterations. Briefly, the cover slips were put into the wells of a 6-well plate. HT-29 cells were seeded onto the cover slips at 1 × 10⁵ cells per well. The cells were incubated at 37 °C for 24 h under 5% CO2 conditions. After that, the media was withdrawn and PBS was used to wash the wells. Then, each well was incubated for 2 h with 2 mL of 50 µg/mL nanoparticles in PBS. The solution was then withdrawn and PBS was used to wash the wells. Mounting DAPI was used to mount the cover slips onto the glass slides and viewed under the IX71 Inverted Microscope fluorescence microscope (Olympus, New York, USA).
Confocal Laser Imaging
The cover slips were put into the wells of a 6-well plate. Each well containing the cover slip was seeded with 1 × 10⁵ HT-29. The cells were incubated at 37 °C under 5% CO2 conditions. After 24 h of incubation, the medium was withdrawn and PBS was used to wash the wells. Then, 2 h incubation involving 2 mL of 50 µg/mL of the nanoparticles in PBS per well was conducted. The solution was then withdrawn and ice-cold PBS was used to wash the wells twice. Cells were fixed for 15 min using 2 mL of 4% PFA. Ice-cold PBS was used to wash the cells twice. The cells were treated for 15 min on ice with 2 mL of Triton X-100 (0.1% in PBS). PBS was used to wash the cells thrice. A blocking buffer was prepared from 1% BSA and 0.2% Tween-20 in PBS. Next, 2 mL of blocking buffer was applied to the cells and followed by 1 h of incubation. A 1:200 dilution factor of primary and secondary antibodies in the blocking buffer were prepared and pipetted into the wells. Using a dark humidified chamber, the cells were incubated overnight at 4 °C. PBS was used to wash the cells five times. Subsequently, the diluted secondary antibody was pipetted into the wells and followed by 1 h incubation in the dark at 4 °C. PBS was used to wash the cells five times. Mounting DAPI was used to mount the cover slips onto the glass slide for 10 min and these were viewed under the Zeiss CLSM 710 confocal microscope (Zeiss, Jena, Germany) using 63 × magnification of the oil-immersion objective.38
Statistical Analysis
Mean ± standard deviation was applied to express the data. Standard deviation from the mean was indicated using error bars (n=3). Analyses of the data of thiol contents and stability studies of the nanoparticles were conducted using paired-sample t-test. Dunnett’s (two-sided) post hoc test was applied to analyze data for the reduction-response and in vitro DTX release studies. Analysis of the data of in vitro cytotoxicity studies of nanoparticles for paired comparisons of mean values was performed using one-way ANOVA with Tukey’s HSD (Honestly Significant Difference) post hoc test. p value ≤ 0.05 was regarded as statistical significance.
Results and Discussion
Characterization of TGA1–TGA4
Thioglycolic acid moieties were conjugated to the sodium alginate backbone via ester bonding between the hydroxyl and carboxyl groups of alginate and thioglycolic acid, respectively.38 Hydrochloric acid was used as a catalyst for the reaction. White precipitate of thiolated sodium alginate (TGA) was formed after pouring the reaction mixture into the ethanol. TGA was found to be insoluble in water because sodium alginate was converted into insoluble alginic acid in acidic conditions. However, this insoluble alginic acid can be made soluble in alkaline water. Similar results were reported in previous studies, where gellan conjugated with thioglycolic acid dissolved in water when made alkaline.37 The average yields of the products were 65.9%. Since thioglycolic acid is miscible with ethanol, the excess thioglycolic acid bound on the surface of the polymers was washed using ethanol.
A preliminary test using sodium nitroprusside reagent was applied to the polymer to identify the presence of thiol group in the polymer. TGA showed positive results as the color of the reaction mixture changed from yellow to reddish purple. This color change was due to the thiolate anion of TGA which induced nucleophilic attack on the nitric oxide (NO) ligand of the nitroprusside, yielding colored nitrosothiol complexes, [Fe(CN)5N(O)SR](n+2)-(Equation 1).51

Ellman’s method was applied to determine the polymers’ thiol contents. This Ellman’s test involved reaction between the Ellman’s reagent, 5,5ʹ-dithiobis(2-nitrobenzoic acid) (DTNB2-) and the thiolate anion (R-S−) (Figure 3). From the reaction, a yellow colored 2-nitro-5-thiobenzoate anion (TNB2-) and a mixed disulfide (R-S-TNB−) were formed with one mole of TNB2- formed per mole of thiol group.52 The reaction was favored at pH > 7.3 and the yellowish solution was examined at 412 nm to evaluate the thiol concentration.53
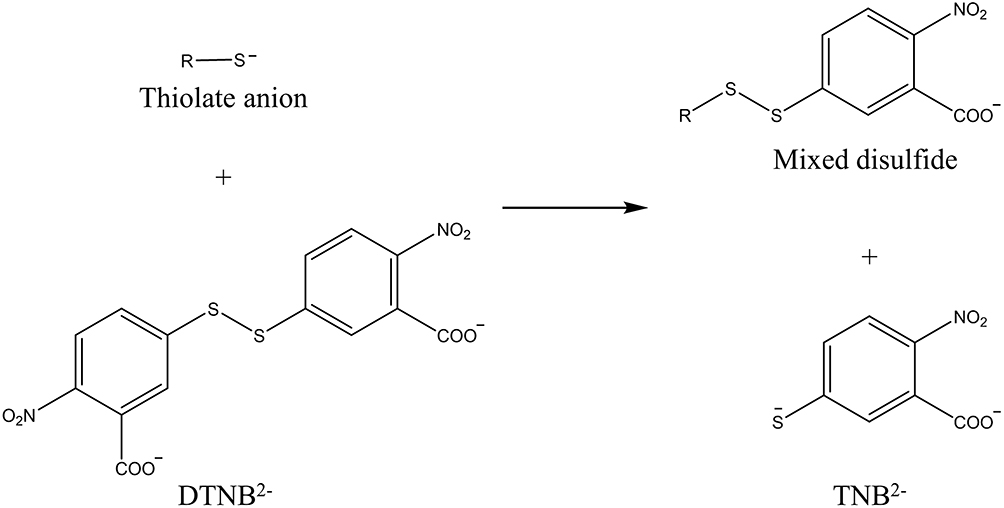 |
Figure 3 One mole of TNB2- formed per mole of thiol group in Ellman’s reaction. |
The concentrations of thiols per gram of the thiolated polymers and disulfide cross-linked nanoparticles were determined utilizing calibration curves constructed by reacting standard solutions of thioglycolic acid (R2=0.9994) with Ellman’s reagent. The number of thiols in TGA1, TGA2, TGA3, and TGA4 were 1.19, 2.19, 2.21, and 3.13 mM/g polymer, respectively. Since TGA4 was formed using the highest number of moles of thioglycolic acid, it contained the highest number of thiols among all the polymers formed. This result agrees with previous findings, where the rate of thiol conjugation of sodium alginate was directly proportional to the number of moles of 4-aminothiophenol involved in the reactions.10
FTIR Analysis
Identification of functional groups for sodium alginate and TGA was carried out by interpreting their FTIR spectra (Figure 4). For sodium alginate spectrum, OH stretching was assigned a broad absorption band found at 3418 cm−1. Meanwhile, the peak at 2920 cm−1 reflected CH stretching.37 At 1618cm−1 and 1417cm−1, respectively, peaks of symmetric and asymmetric stretching vibrations of carboxylate anions were observed.54 The adsorption bands of cyclic CH bending and COC cyclic ether stretching were observed at 820 cm−1 and 1031 cm−1, respectively.55 Compared to the alginate spectrum, a new characteristic peak at 2642 cm−1 was detected in the spectrum of TGA, assigned to the SH stretching of the thiol group.56 Meanwhile, an additional peak of ester carbonyl group stretching was found at 1733 cm−1.37
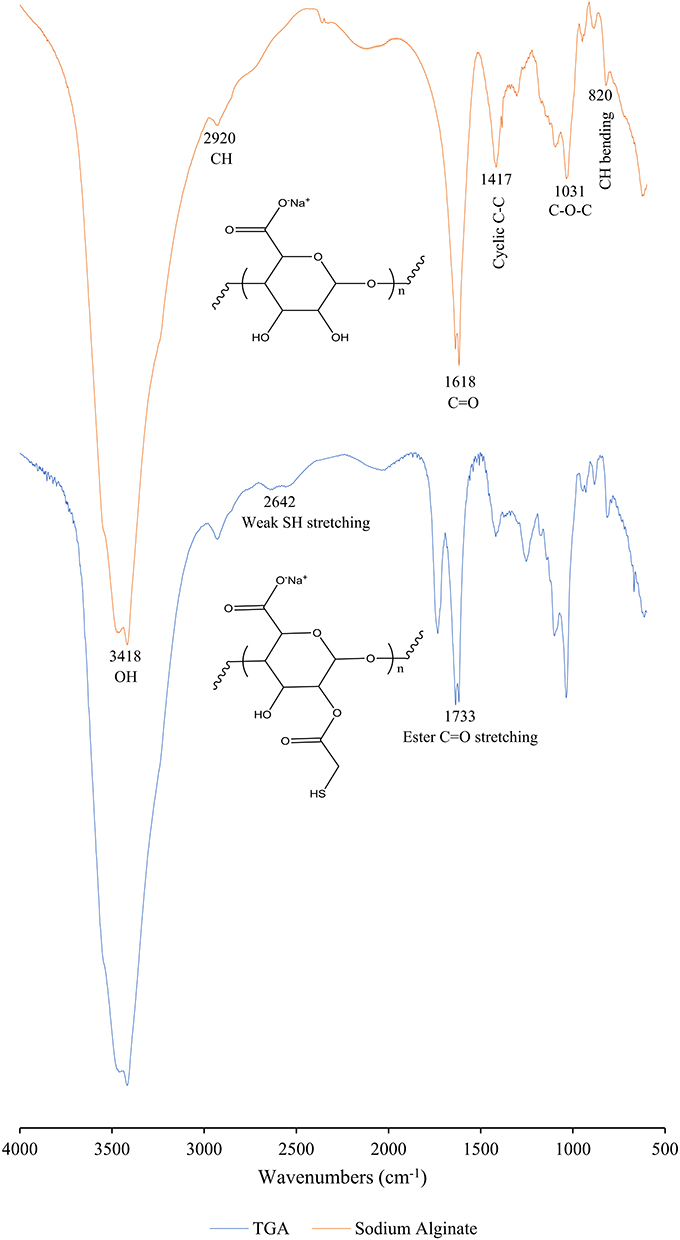 |
Figure 4 FTIR spectra of alginate and TGA. |
1H NMR Analysis
The conjugation of thiol to sodium alginate was further confirmed using 1H NMR analysis (Figure 5). The multiplet peaks found in the range between 3.7 and 5.0 ppm were attributed to the protons of methine groups of sodium alginate hexuronic acid moieties.57 Meanwhile, in comparison to the sodium alginate spectrum, the TGA spectrum showed new characteristic peaks and increased peaks due to the new functional groups attached to the alginate backbone. In the TGA spectrum, there was an additional singlet peak (1H, -O-C(O)-H2-SH) at 3.3 ppm which was assigned to the protons in thioglycolic acid. This result was in agreement with the previous findings, where the peak appearing at 3.15 ppm was due to the proton of the thioglycolic ester fragment, -O-C(O)-CH2-SH.58 Also, a chemical shift of SH was observed in the TGA spectrum with the emergence of additional peaks found at 1.1 ppm.41
 |
Figure 5 1H NMR spectra of (A) alginate and (B) TGA. |
Characterization of TP1–TP4
Disulfide cross-linked nanoparticles were developed via the self-assembly of thiolated alginate in deionized water, which was assisted by air oxidation and ultrasonication (Figure 6). TGA is an amphiphilic polymer which consists of a hydrophilic alginate chain and hydrophobic thiol group.12 The hydrophobic thiol groups were self-assembled into the core and further wrapped by the tightly packed hydrophilic backbones via inter- and intra-molecular hydrogen bonding. Consequently, the adjacent thiol groups in the core of the nanoparticles were cross-linked by ultrasonic air oxidation.10
 |
Figure 6 Self-assembly of thiolated alginate into disulfide cross-linked nanoparticle. |
No color change was observed for the reaction of sodium nitroprusside with the TP1–4 polymers. This negative result indicates that the thiols of the polymers were air oxidized to form disulfide bonds.38 The oxidation of thiols to form disulfide cross-linked nanoparticles reduced the thiol content of TGA polymers (Figure 7). Compared to all the polymers synthesized, only the TGA4 polymer showed no significant decrease in thiol contents after being developed into nanoparticles. TP2 (78.5%) recorded the highest rate of decrease in thiol contents, followed by TP1 (73.3%) > TP3 (49.3%) > TP4 (23.6%). Since TP2 showed the highest decrease rate in thiol contents (p < 0.01) compared to the other nanoparticle formulations, therefore it was chosen for further characterizations. Only 21.5% of the thiol contents of TGA2 were left after forming TP2 nanoparticles, indicating that disulfide bonds were formed from the air oxidation of thiol groups.10
 |
Figure 7 Thiol concentration profiles for TGA and TP (mean ± SD, n=3). *(p < 0.05) and **(p < 0.01) show a significant difference between the polymers and nanoparticles. |
Characterization of DTP1–DTP4
The concentrations of DTX in DTX-loaded disulfide cross-linked nanoparticles were evaluated utilizing calibration curves constructed from DTX standard solutions in ethanol (R2=0.9995). The loading efficiency of DTX in DTP1–4 was 11.3 ± 5.5 (DTP1), 19.3 ± 7.3 (DTP2), 12.9 ± 6.4 (DTP3), 12.8 ± 4.0 (DTP4) (mean ± SD, n=3). Since DTP2 exhibited the highest loading efficiency, DTP2 was chosen for further experiments.
DTX was successfully loaded into the nanoparticles during the self-assembly process by mixing the ethanolic DTX solution with the aqueous thiolated sodium alginate solution. During the mixing process, precipitates of DTX-loaded nanoparticles were formed due to the interfacial turbulences formed between the two immiscible liquid phases.59 The DTX was loaded into the nanoparticles via hydrophobic interactions formed between disulfide bonds and DTX within the nanoparticles and this enhanced the stability.60 Further to this, the solubility of a hydrophobic drug may be improved by loading the drug in the nanoparticles. A former finding supported this statement, where the solubility of a hydrophobic drug, methotrexate (1 mg/100 g H2O) increased up to 59.1 mg/100 g H2O after loading into the disulfide cross-linked carboxymethyl chitosan nanoparticles.41
Characterization of fTP2 and fDTP2
In the two-step carbodiimide process, an amide bond was formed by the conjugation of the fWGA primary amino groups to the sodium alginate carboxyl groups.61 Micro BCA protein assay was used to determine the amount of fWGA conjugated on the nanoparticles. This colorimetric assay was based on the chelation process involving two moles of bicinchoninic acid (BCA) with one mole of cuprous ion (Cu+).62 The cuprous ion was produced from the reduction of alkaline Cu2+ ion by the protein (fWGA) (biuret reaction) (Figure 8).
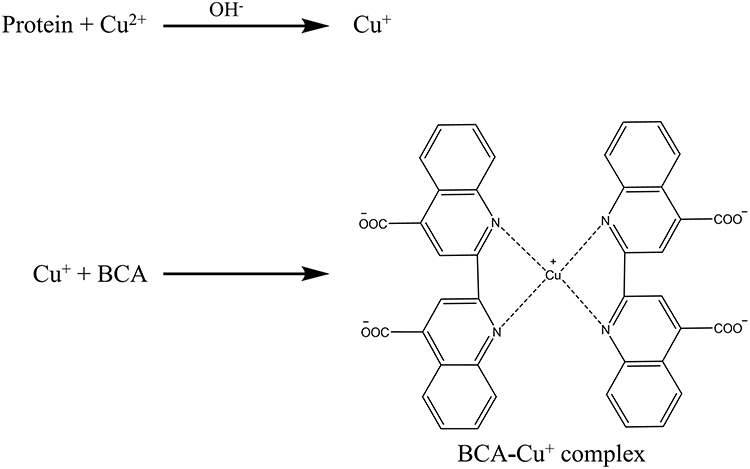 |
Figure 8 Biuret reaction induces purple complex formation by reacting a Cu+ ion with BCA. |
The existence of amino acids (tryptophan, cysteine, tyrosine, and cystine) and peptide bonds in the fWGA were responsible for the reduction of the Cu2+ ion in the BCA.63 Purple fluorescence exhibited from the BCA-Cu+ complex was then determined at 562 nm. The calibration curve of the Micro BCA protein assay (R2=0.9967) was determined using fWGA standard solutions. The standard curve was applied to evaluate the amount of fWGA conjugated to the nanoparticles.
fWGA was conjugated to DTP2 to form fDTP2 and found to contain 15.1 ± 2.0 µg fWGA/mg nanoparticles (n=3). fDTP2 had higher conjugation efficiency because fWGA conjugation was governed by the particle size where small DTP2 nanoparticles possessed a higher specific surface area for fWGA conjugating.61
DLS Analysis
The zeta potential, mean diameter (MD) and polydispersity index (PDI) of blank TP1–4 and DTX-loaded DTP1–4 nanoparticles were analyzed using the dynamic light scattering (DLS) method (Table 1). The MD of the nanoparticles ranged from 173.0 to 232.0 nm with PDI values less than 0.2, indicating its narrow size distributions. This is because PDI measures the size distributions of the nanoparticles, in which the smaller the PDI values, the narrower the size distributions of the nanoparticles.64 Meanwhile, zeta potential measures the particle charge; as such the greater the zeta potential absolute value, the better the nanoparticle stability.65 Therefore, TP2 nanoparticles with high zeta potentials of −45.6 mV exhibited high stability. This is due to strong repulsive forces between the highly negatively charged nanoparticles from the anionic sodium alginate moieties that formed the nanoparticles.66 Negatively charged nanoparticles have been previously reported to have electrostatic interactions with the membrane of inflamed cells and thus resulted in higher cellular uptake efficacy.10
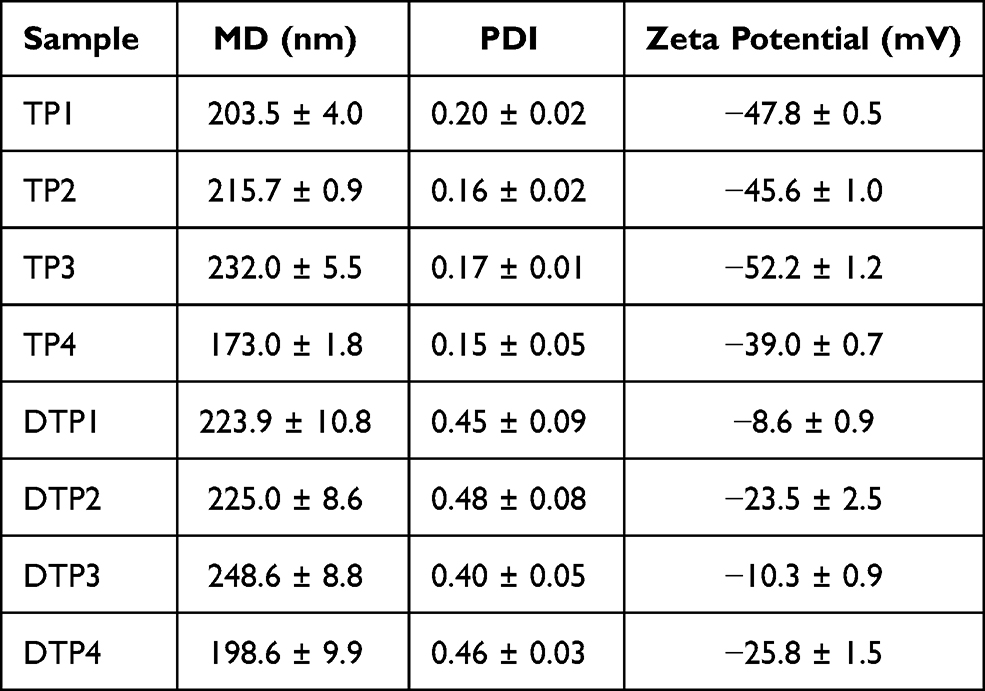 |
Table 1 MD, PDI, and Zeta Potential Values for TP1–4 and DTP1–4 (Mean ± SD, n = 3) |
Increased MD and PDI values were observed after loading DTX in both nanoparticle types showing a successful loading process. For DTP2, the MD rose from 216.0 nm to 225.0 nm. DTP nanoparticles showed a reduction in zeta potential values compared to TP. Loading hydrophobic DTX into nanoparticle cores (hydrophobic disulfide linkages) increases hydrophobic interactions between nanoparticles. Nanoparticles’ repulsive forces decreased, resulting in lower zeta potential.67
DLS measurements were performed to analyze variations in nanoparticle particle sizes, size distribution, and zeta potential after fWGA conjugation (Table 2). Compared to TP2’s MD, fTP2’s MD increased in increments by 52.0 nm to 268.0 nm. The PDI values for both fTP2 were below 0.3, suggesting uniform and small distributions of fTP2. The presence of positively charged fWGA on the nanoparticles reduced the zeta potential of fTP2.43 fDTP2’s MD was elevated from fTP2 by 10.0 nm to 277.7 nm. fDTP2 had narrow PDI distributions below 0.4, suggesting a reasonably homogeneous group. Due to the promoted hydrophobic interactions between the hydrophobic DTX and the disulfide interactions in the cores of nanoparticles, the zeta potential of fDTP2 decreased.67 The drop in zeta potential was also due to the attachment of positive charged fWGA with polymer chain segments.43 Zeta potential is not an absolute measurement for the stability of nanoparticles. The zeta potential of −1.0 mV will still provide adequate stabilization to fDTP2 due to the steric effects of the polymer chain and conjugation of fWGA to the nanoparticles.65
 |
Table 2 MD, PDI, and Zeta Potential of fWGA-Conjugated Nanoparticles Before and After Conjugation of fWGA (Mean ± SD, n = 3) |
SEM and TEM Analyses
SEM and TEM were analyzed for TP2 surface morphology. The SEM micrograph of TP2 displayed smooth, porous-free surface spherical nanoparticles averaging 50.0 nm (Figure 9A). The SEM and TEM exhibited that nanoparticles’ MD values are 1.3 and 1.6-fold, respectively lower than for the DLS method. DLS measures the nanoparticles in an aqueous solution, while SEM and TEM measure them in a solid state.12 Nanoparticle aggregates were developed in aqueous solution, resulting in increased particle MD values during DLS measurements.66 This suggests that TP2 nanoparticles will swell and hold water in an aqueous solution.68 The spherical core shell structures showed in the TEM micrograph of TP2 were 81.0 nm on average (Figure 9B). The nanoparticles had a uniform size and no agglomerations were observed. This resulted in a stable, well-dispersed solution of TP2 nanoparticles.
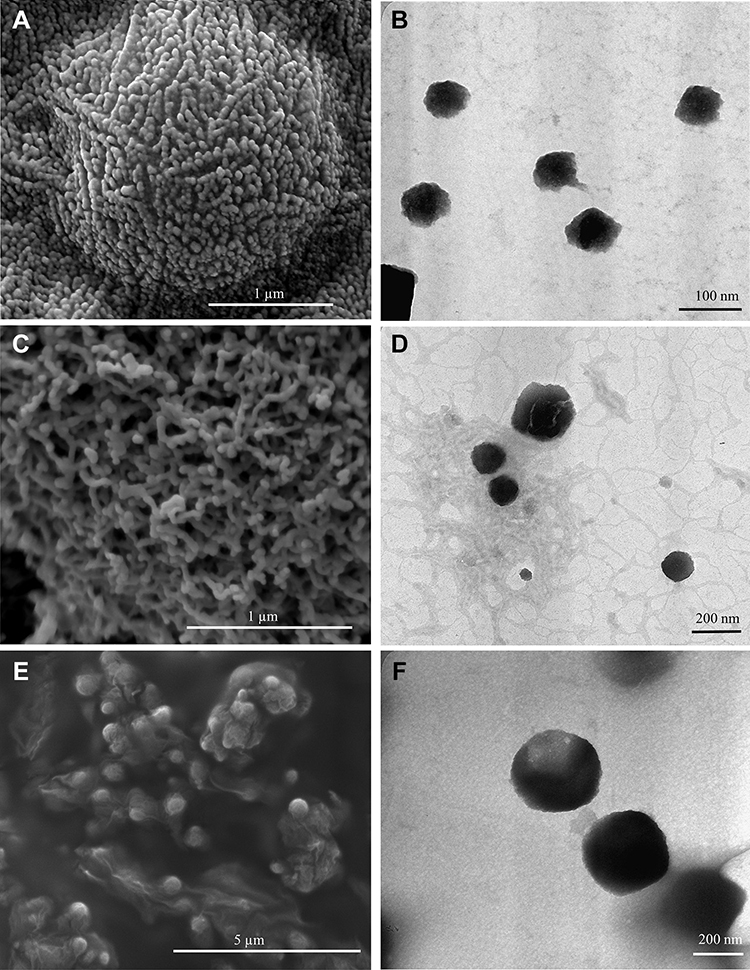 |
Figure 9 SEM micrographs of (A) TP2, (C) DTP2, (E) fDTP2. TEM micrographs of (B) TP2, (D) DTP2, (F) fDTP2. |
The SEM micrograph of DTP2 showed spherical nanoparticles with some tendencies to agglomerations (Figure 9C). The presence of agglomerated nanoparticles is linked to nanoparticles’ declining zeta potential values. The hydrophobic interactions intensified with the loading of hydrophobic DTX into the hydrophobic core of nanoparticles which resulted in increased attractive forces between nanoparticles forming an agglomeration.69 Based on the SEM micrographs, average particle sizes increased from 50.0 nm (TP2) to 109.0 nm (DTP2). DTP2 nanoparticles were spherical and well-dispersed in aqueous solution as seen in the TEM micrographs (Figure 9D). Observed DTX-loaded nanoparticles were of various sizes. They were aligned with the MD’s growing principles. This finding further supports DTX’s efficient loading into the nanoparticles. Compared to TP2, DTP2’s average particle sizes showed increments from 81.0 nm to 158.0 nm. SEM (Figure 9E) and TEM (Figure 9F) fDTP2 micrographs showed spherical-shaped nanoparticles. Due to low zeta potential of −1.0 mV, agglomerations of nanoparticles were identified in fDTP2. Compared to DTP2’s SEM micrographs, fDTP2’s average particle sizes increased from 237.0 nm to 346.0 nm. The TEM micrographs demonstrate that fDTP2 nanoparticles were relatively dispersed in the aqueous solution. Comparatively, from the TEM micrographs, average particle sizes of fDTP2 were greater than DTP2, increased from 158.0 nm to 360.0 nm. These findings indicate the fWGA effectively attached to the nanoparticles.
Stability Studies
Stability analysis was performed to analyze the 30-day stability of TP (Table 3A) nanoparticles in a buffer solution. From the result, the paired t-test displayed no significant difference (p > 0.05) in MD after a month of buffer solution storage. Most nanoparticles shifted mildly in MD and PDI. TP2 nanoparticles increased by 6.0 nm, but PDI decreased by 0.03 after a month’s storage. After 30 days of storage, fTP2 and fDTP2’s MD grew by 21.0 and 9.0 nm, respectively (Table 3B). However, PDI values of fTP2 displayed a slight decrease by 0.02 while there was a slight increase by 0.17 in fDTP2. The results indicate the analyzed nanoparticles are extremely stable for at least 1 month.
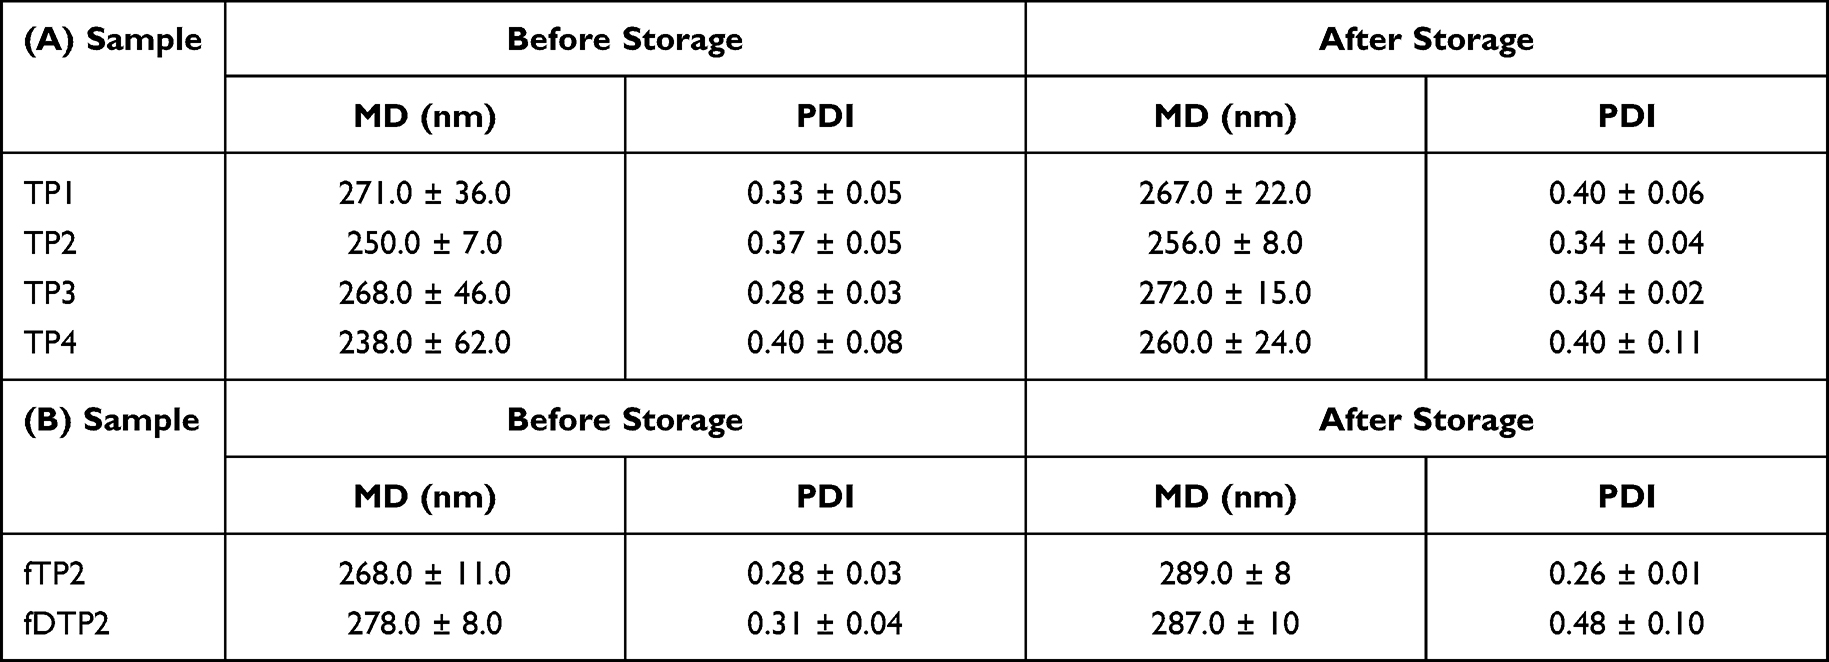 |
Table 3 MD and PDI of (A) TP1–4, (B) fTP2 and fDTP2 After Storage for 30 d at pH 7.4 (Mean ± SD, n = 3) |
Inter- and intra-molecular disulfide bonds formed during storage in the solution play a crucial role in stabilizing nanoparticles.10 Previous results backed this statement, where the cohesiveness of the polymer matrix system was enhanced by the formation of inter- and intra-chain disulfide bonds resulting in improved swelling and dissolution behavior of the intended drug release polymer matrix system.70 Therefore, strong nanoparticle stability was needed to prevent releasing the drug before reaching the target site.
pH-Sensitivity Studies
pH sensitivity experiments were performed to observe changes in TP particle size (Figure 10A) for nanoparticles in aqueous media with pH values from 2 to 8. TP2 showed a better profile over other nanoparticles. TP2 nanoparticles’ MD grew slowly with rising pH. TP2’s MD grew by a factor of 1.9 in the range of pH 2–7. This finding indicates promising TP2 pH-sensitivity or swelling-dependent properties. Meanwhile, maximum particle sizes of fTP2 were observed at pH 7 (Figure 10B). Furthermore, the fTP2 MD displayed steady increments at pH 2–7. In the pH scale from 2 to 7, the fTP2 MD improved by a factor of 2.6.
 |
Figure 10 Profiles of pH sensitivity of (A) TP1–4 and (B) fTP2 (mean ± SD, n = 3). |
The smaller particle size observed at low pH (2–4) was induced by protonation of fWGA carboxyl groups forming closely packed hydrogen bonding in the hydrophilic shell of nanoparticles. Particle sizes increased with higher pH (4–7) of the nanoparticles. This was clarified by fWGA carboxy groups ionized with rising pH values resulting in the breakdown of hydrogen bonds.10,41 This contributed to the development of electrostatic repulsion among the polymer chains, triggering particle size increases. Nanoparticle MD subsequently decreased at pH 8 due to the counter-ion shielding effect.50
Reduction-Response Studies
TP reduction-responsive activity (Table 4A) in nanoparticles is assessed by determining their particle sizes and size distributions in 24 h GSH buffer solutions (10 μM and 10 mM). GSH-free buffer solution was used as a control. Nanoparticles increased with various GSH concentrations (10 μM and 10 mM). These findings indicate that after 24 h, the nanoparticles reacted well to reduction conditions.
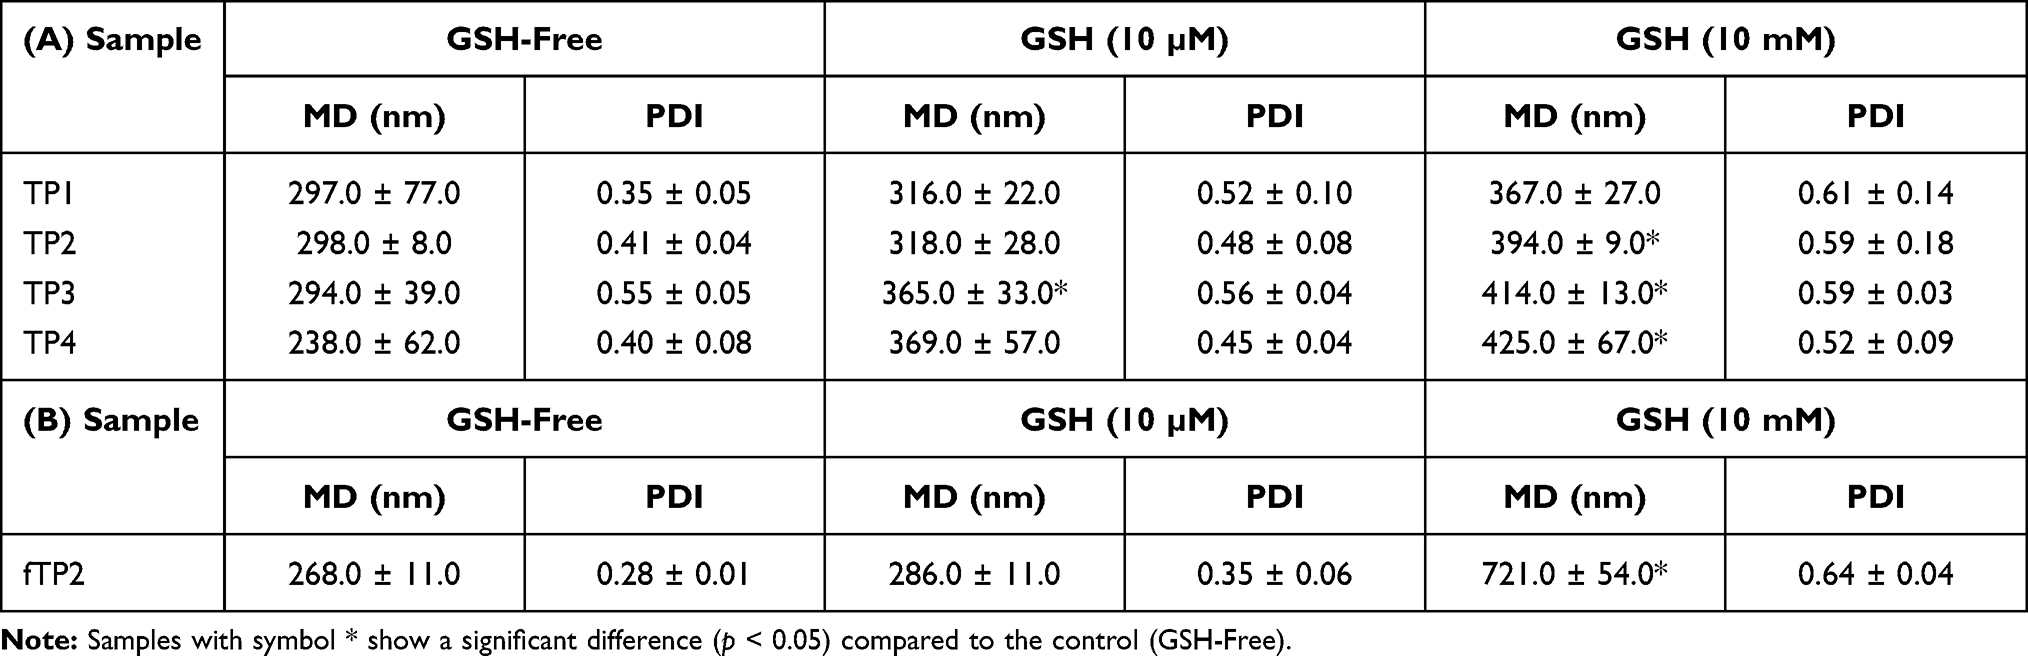 |
Table 4 Reduction Response Profiles of (A) TP1–4 and (B) fTP2 (Mean ± SD, n = 3) |
While all TP nanoparticles showed good GSH reduction-responsiveness, only TP2 showed better pH-sensitivity profiles. In this scenario, TP2 was picked for further characterization. TP2 showed strong reduction-responsiveness towards GSH (reducing agent) in the generated reduction condition. The particle sizes of TP2 nanoparticles in 10 μM GSH media were not statistically different compared to the control. TP2 nanoparticles’ MD improved just 6.8%. A significant increase in MD (32.3%) was observed for TP nanoparticles in 10 mM GSH relative to the control. A similar trend was observed in fTP2’s MD showing a small incremental increase in the 10 μM GSH medium relative to the control (Table 4B). Subsequently, when put in a 10 mM GSH medium, the fTP2 MD elevated dramatically (p < 0.01) by a factor of 1.69.
These findings show that TP2 and fTP2 nanoparticles were stable at 10 μM GSH simulating the extracellular environment, preventing DTX release before approaching the designated target.12 Significant increases in MD and PDI were observed for both nanoparticles in 10 mM GSH (simulating the intracellular environment of cancer cells) relative to the control. Such findings showed that disulfide bonds of TP2 and fTP2 nanoparticles were readily cleaved by GSH, releasing the DTX to targeted cancer cells.
In vitro DTX Release Studies
DTX is an anti-cancer agent commonly used in multiple malignancies, including colon cancer.26 This analysis selected it as the drug model. Calibration curves in buffer media pH 1.0 stomach (R2=0.9966), 7.4 small intestine (R2=0.9969) and 6.0 colon (R2=0.9977) were built using standard DTX solutions to measure the percentage of DTX released at a predetermined pH and time.
The release profile of DTP2 in simulated gastrointestinal media indicates that 0.89% of DTX was released in pH 1.0 GSH-free medium (stomach) and 14.8% in pH 7.4 GSH-free medium (small intestine) during the first 5 h (Figure 11A). The DTX release increased markedly when DTP2 was exposed to pH 6.0 medium with GSH (colon) reported as the maximum total 85.3% release. While the pH 6.0 medium without GSH (control) released 31.6% of the DTX. Cumulative release hit a plateau at 12 h. Slow release at the initial stage of DTP2 can be triggered by restriction (impeded) of the DTX due to contractions of the hydrophilic shell of nanoparticles exposed to an acid buffer medium. The hydrophilic shell then begins to swell with growing pH and boosts DTX release. However, the release is comparatively poor since DTX cannot penetrate the compact network structure of nanoparticles with high disulfide cross-linking. The release was further improved by inserting nanoparticles into the GSH reduction medium. This allows disulfide bonds to break, releasing DTX easily until almost complete.10,12,41
 |
Figure 11 Profiles of in vitro DTX release of (A) DTP2 and (B) fDTP2 in simulated gastrointestinal and control media at designated times and pHs (mean ± SD, n = 3); symbol * shows significant differences (p < 0.05) between the two designated time points. |
For fDTP2, DTX (3.6%) was released in pH 1.0 GSH-free (stomach) and 1.7% was released in pH 7.4 GSH-free (small intestine) within the first 2 hours (Figure 11B). The highest cumulative percentage of DTX release in the colon was 54.7% with GSH, while it was 5% without GSH. Dunnett’s (two-sided) post hoc test was conducted, revealing significant variations in the DTX release rate between the colon and control. The variations in the volume of DTX released are due to the reduction environment’s disulfide bonds’ cleavage, thereby improving DTX release in the colon medium. DTX release hit a peak at 11 h. The highest cumulative percentage release of DTX for fDTP2 (54.7%) decreased relative to DTP2 (85.3%). However, there was no burst release within the first 5 h. Similar findings have been recorded in previous studies; the release rate of salmeterol xinafoate from wheat germ agglutinin integrated nanoparticles-in-microparticles within 24 h reduced by around 34% compared to unmodified samples.71 This is because fWGA conjugation may give the polymer chain rigidity by modifying the sodium alginate carboxyl groups.72 This is associated with the lower chain flexibility that influences polymer swelling rates and thresholds, resulting in lower drug release rates.73 Although fWGA conjugation to nanoparticles can function as a protective layer for nanoparticles, it also acts as a diffusion barrier in releasing the DTX from the nanoparticles. Therefore, it is assumed that the decrease in DTX accumulated release is attributed to the increased obstacles generated by the fWGA conjugation. Overall, the release concept for DTX is based on DTP2 and fDTP2’s pH-sensitivity and reduction-responsiveness.
Cytocompatibility Studies – MTT
MTT assay was used to examine the cytocompatibility of fTP2, fDTP2 and DTX with HT-29 (human colon carcinoma) and L929 (mice fibroblast) cell lines. This colorimetric examination tests the reduction using mitochondrial succinate dehydrogenase 3-(4,5-dimethythiazol-2-yl)-2,5-diphenyl tetrazolium bromide (MTT) (Figure 12). The yellow MTT was reduced to insoluble dark purple formazan. Because MTT reduction happens only in metabolic active cells, the percentage of cell viability could be calculated.74 DMSO solubilized the formazan-containing cells and was calculated spectrophotometrically at 570 nm.
 |
Figure 12 Mitochondrial reductase enzyme induced MTT reduction. |
The cell viability profile indicates a dose-dependent effect on HT-29 cells with fTP2, fDTP2, and DTX (Figure 13A). The cell viability decreased as fTP2, fDTP2, and DTX concentration increased. At the lowest concentration of 3.9 μg/mL, fTP2 demonstrated no substantial deviation from untreated cells. The viability of HT-29 cells decreased marginally in fTP2 at concentrations above 62.5 μg/mL (76%), and a significant difference (p < 0.05) was observed relative to untreated cells. Viability consequently declined dramatically (p < 0.01) as concentrations approached 62.5 μg/mL. The lowest cell viability was the maximum concentration for fTP2 (65.3%), fDTP2 (31.9%), and DTX (15%) treatments. Unlike fTP2, as concentrations exceeded 3.9 μg/mL, cell viability decreased dramatically (p < 0.01) in fDTP2. This indicates that the nanoparticles released more DTX, thereby reducing cell viability. Furthermore, fDTP2 cell viability was slightly higher than for DTX. This indicates that loading DTX into nanoparticles decreased DTX’s cytotoxic effect. The IC50 values for fDTP2 and DTX against HT-29 cells were 34.7 and 4.8 μg/mL, respectively. This also verified that fDTP2 decreased free DTX cytotoxicity. Although, free DTX had a higher cytotoxic impact than fDTP2, DTX could only dissolve in an organic solvent such as DMSO. Meanwhile, loading DTX into nanoparticles improved DTX’s solubility since fDTP2 nanoparticles are readily soluble in aqueous culture media. Such findings indicated that due to high loading efficiency and cumulative DTX release, fDTP2 was effective in suppressing HT-29 cells.
 |
Figure 13 Cell viability profiles of (A) HT-29 and (B) L929 cells treated with fTP2, fDTP2, and DTX (mean ± SD, n = 3); significant differences (p < 0.05) were observed between the samples with different alphabets (a, b, c, d) at the same concentration. |
L929 cells were selected as the standard cell line model because it they are used for a proven and robust cytotoxicity test model recommended by ISO 10993–5.75 Cell viability profile reveals dose-dependent activity on L929 cells for fTP2, fDTP2, and DTX (Figure 13B). At the same concentration (125 μg/mL), the cell viabilities treated with fTP2 (70.5%), fDTP2 (54.1%) and DTX (15.7%) were higher than HT-29 as stated previously. This indicates that DTX decreases the viability of HT-29 cells more relative to L929 cells. Chemotherapeutic drugs are known for their lethal impact on cancer rather than normal cells. Cells treated with fTP2 concentrations over 15.6 μg/mL demonstrated significant variations compared to untreated cells. This indicates that fTP2 marginally decreased L929 cell viability in concentrations above 15.6 μg/mL. However, it implies, from overall findings, that fTP2 had strong biocompatibility owing to its high viability (> 70%). Furthermore, the major variations between fDTP2 and DTX demonstrated the drug’s failure to discriminate between normal and cancer cells.
The viability profile of contrast between fDTP2 and L929 cells indicates that the viability of L929 cells decreased when the fDTP2 concentration increased from 3.9 to 125 μg/mL (dose-dependent effect).76 IC50 values of fDTP2-treated L929 cells were 175 μg/mL. Comparing fDTP2 IC50 values in HT-29 and L929 cells, IC50 values decreased dramatically in HT-29 cells (34.7 μg/mL in fDTP2) relative to L929 cells (175 μg/mL in fDTP2). Such findings demonstrated drug selectivity against HT-29 over L929 cells. This will be helpful if nanoparticles are used to provide anticancer treatment to colon cancer cells.
Cellular Uptake Studies for fDTP2
fDTP2 cellular uptake was demonstrated in the HT-29 cell line. Green fluorescent fWGA was coupled with nanoparticles to visualize the internalization of nanoparticles in cells. Both quantitative and qualitative nanoparticles studies on cellular uptake were performed.
fDTP2 cell uptake performance in HT-29 cells was evaluated after 0.5, 1, 2 and 4 h of incubation with their respective IC50 concentrations (Figure 14A). Due to fDTP2’s tiny particle size, cellular uptake efficiency was high. Former results back this argument, where smaller nanoparticles produced from polycaprolactone-poly(ethylene glycol)-polycaprolactone tri-block copolymer had higher efficiency in terms of cell uptake towards HepG2 cells.49 The uptake efficiency for both samples displayed time-dependent effect, directly proportional to the time of incubation. Maximum cell uptake efficiencies of fDTP2 (35.8%) accounted for 4 h of incubation, as both displayed a marked improvement from 1 h to 2 h, with a factor of 1.23. It was stated that wheat germ agglutinin-conjugated nanoparticles had a time-dependent effect for which a longer incubation time was required to reach therapeutic extent in intracellular drug concentration. This prolonged period was necessary to release nanoparticles into the cytoplasm.31 Therefore, the optimal time for cellular uptake was 2 h.
 |
Figure 14 Profiles of HT-29 cellular uptake of fDTP2 arising from varying (A) incubation times and (B) concentrations (mean ± SD, n = 3); two samples with symbol ** show significant differences (p < 0.01) between them. |
The cellular uptake profile of fDTP2-treated HT-29 cells was performed from 3.9 to 125 µg/mL (Figure 14B). Cellular uptake performance improves with rising fDTP2 concentrations. This finding indicates that fDTP2 concentrations are dose-dependent on cellular uptake ability. The Tukey HSD post hoc test displayed a significant increase (p < 0.01) from 3.9 to 15.6 µg/mL with no substantial change in concentrations above 15.6 µg/mL. This reflects that fDTP2 with 34.7 µg/mL IC50 was ideal for efficient cellular uptake activities.
Cellular internalization was analyzed using fluorescent microscopy (Figure 15). fDTP2 cellular uptake was verified when the incubated cells displayed green fluorescent images. fDTP2-incubated cells showed high fluorescence intensity attributed to high cellular uptake efficiency of fDTP2.
 |
Figure 15 Fluorescence photographs of HT-29 cells after 2 h incubation with fDTP2 under 40,000× magnifications. |
Confocal microscopy experiments were performed to study HT-29 cellular uptake of fDTP2 (Figure 16). fDTP2 nanoparticles (green color), clathrin antibodies (red color), and DAPI (blue color) were incubated into the HT-29. The red is the acidic lysosomal compartments (endosomes), while the blue is the nucleus. The nanoparticles are in green, mostly in cytosol with some perinuclear distributions. From the merged image, the colocation of nanoparticles and clathrin appears yellow after overlapping with the green fWGA-conjugated nanoparticles and clathrin stain-red. This finding indicates strongly colocalized nanoparticles with clathrin (cell membrane). This finding further suggests that the nanoparticles’ cellular uptake mechanism was clathrin-mediated endocytosis, which was compatible with previous findings where the same localization trend was observed for the uptake of PLGA nanoparticles by the wheat germ agglutinin in Caco-2 cells. Cellular uptake of fDTP2 took place via binding of wheat germ agglutinin to N-acetylglucosamine and sialic acid present in clathrin antibodies in treated cell membrane of HT-29. Attributed to the cytoadhesive and cytoinvasive properties of WGA, fDTP2 nanoparticles were bound to the receptor and subsequently internalized by HT-29 cells by means of clathrin-mediated endocytosis.31
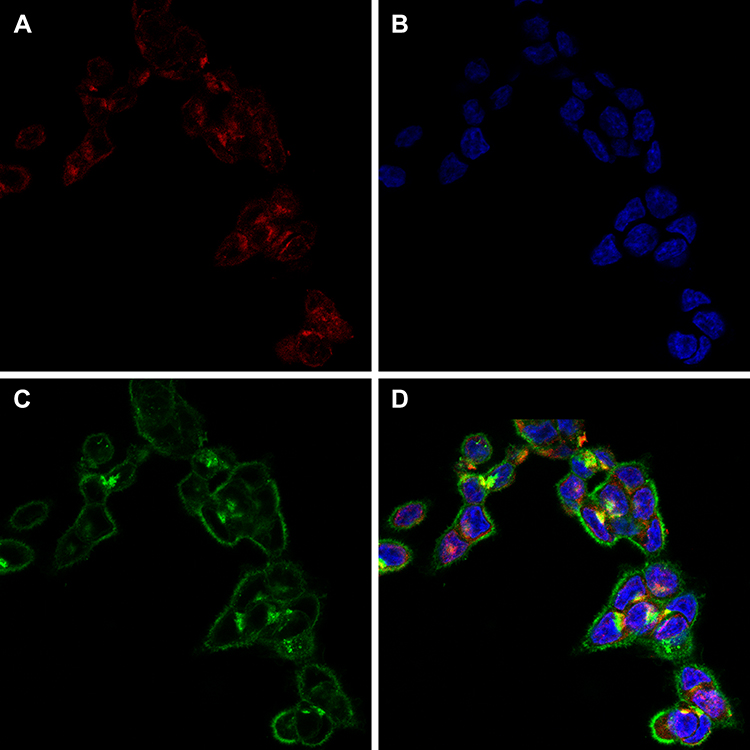 |
Figure 16 Colocalization of (A) clathrin, (B) nucleus, (C) nanoparticles, and (D) merged photographs in HT-29 cells. |
Cellular uptake of nanoparticles may include micropinocytosis, clathrin-mediated endocytosis, phagocytosis and caveolae-mediated endocytosis. A previous study reported that WGA-LPNs were internalized by Caco-2 cells and HT-29-MTX cells via both receptor-mediated and clathrin-mediated endocytosis. fDTP2 with a size of 278.0 nm were preferentially internalized by clathrin mediated endocytosis. Meanwhile, caveolae mediated endocytosis is less likely to occur since it prefers nanoparticles with a size of less than 100.0 nm.77 Therefore, particle size and WGA binding receptor were two crucial factors in determining the uptake behavior of fDTP2.
Conclusion
In a nutshell, DTP2 was the most successful formulation with the highest DTX loading efficiency of 19.3%. It was selected for fWGA surface conjugation with 13.2% efficiencies (fDTP2). Cumulative DTX release of 54.7% (fDTP2) in simulated gastrointestinal conditions was reported in vitro. In the DLS study, fDTP2’s MD was reported to be 277.7 nm with PDI values below 0.35 and zeta potential of −1.0 mV. An in vitro cytotoxicity test on HT-29 and L929 cell lines revealed IC50 values of 34.7 µg/mL in HT-29 and 175 µg/mL in L929. These findings demonstrated selectivity against HT-29 over L929 cells, which is promising in terms of administering anticancer agent to colon cancer cells. fDTP2 (33.4%) had good cellular uptake after 2 h incubation due to high DTX loading performance, low MD and high cumulative DTX release. Furthermore, fluorescence and confocal imaging of fDTP2 revealed good internalization of HT-29 nanoparticles. Nevertheless, further experimental assessments such as in vivo experiments are needed to justify this postulation. Thus, fDTP2 is a promising carrier with fewer cytotoxic effects for controlled and sustained release of anticancer medication to the colon-targeted region.
Acknowledgments
This research was funded by the Fundamental Research Grant Scheme (FRGS, Reference code: FRGS/1/2018/STG07/USM/02/9, Account code: 203.CIPPT.6711684) from the Ministry of Higher Education, Malaysia. Hock Ing Chiu would like to express his appreciation to USM for providing him with the USM Fellowship Scheme.
Disclosure
There are no conflicts of interest reported by the authors in this study.
References
1. Hua S, Marks E, Schneider JJ, Keely S. Advances in oral nano-delivery systems for colon targeted drug delivery in inflammatory bowel disease: selective targeting to diseased versus healthy tissue. Nanomed Nanotechnol Biol Med. 2015;11(5):1117–1132. doi:10.1016/j.nano.2015.02.018
2. Neha S, Harikumar SL. Polymers for colon targeted drug delivery: a review. Int J Drug Dev Res. 2013;5(1):21–31. doi:10.4103/0250-474X.84576
3. Son HS, Lee WY, Lee WS, Yun SH, Chun HK. Compliance and effective management of the hand-foot syndrome in colon cancer patients receiving capecitabine as adjuvant chemotherapy. Yonsei Med J. 2009;50(6):796–802. doi:10.3349/ymj.2009.50.6.796
4. Kamaly N, Xiao Z, Valencia PM, Radovic-Moreno AF, Farokhzad OC. Targeted polymeric therapeutic nanoparticles: design, development and clinical translation. Chem Soc Rev. 2012;41(7):2971. doi:10.1039/c2cs15344k
5. Li B, Li Q, Mo J, Dai H. Drug-loaded polymeric nanoparticles for cancer stem cell targeting. Front Pharmacol. 2017;8:51. doi:10.3389/fphar.2017.00051
6. Martin B, Seguin J, Annereau M, et al. Preparation of parenteral nanocrystal suspensions of etoposide from the excipient free dry state of the drug to enhance in vivo antitumoral properties. Sci Rep. 2020;10(1):1–13. doi:10.1038/s41598-020-74809-z
7. Khan I, Joshi G, Sarkar B, et al. Doxorubicin and crocin co-delivery by polymeric nanoparticles for enhanced anticancer potential in vitro and in vivo. ACS Appl Bio Mater. 2020;3(11):7789–7799. doi:10.1021/acsabm.0c00974
8. Brigger I, Dubernet C, Couvreur P. Nanoparticles in cancer therapy and diagnosis. Adv Drug Deliv Rev. 2002;54(5):631–651. doi:10.1016/S0169-409X(02)00044-3
9. Ng YM, Mat Yusuf SNA, Chiu HI, Lim V. Redox-sensitive linear and cross-linked cystamine- based polymers for colon-targeted drug delivery: design, synthesis, and characterisation. Pharmaceutics. 2020;12(5):1–20. doi:10.3390/pharmaceutics12050461
10. Chang D, Lei J, Cui H, et al. Disulfide cross-linked nanospheres from sodium alginate derivative for inflammatory bowel disease: preparation, characterization, and in vitro drug release behavior. Carbohydr Polym. 2012;88(2):663–669. doi:10.1016/j.carbpol.2012.01.020
11. Lai TC, Cho H, Kwon GS. Reversibly core cross-linked polymeric micelles with pH- and reduction-sensitivities: effects of cross-linking degree on particle stability, drug release kinetics, and anti-tumor efficacy. Polym Chem. 2013;5(5):1650–1661. doi:10.1039/C3PY01112G
12. Gao C, Tang F, Zhang J, Lee SMY, Wang R. Glutathione-responsive nanoparticles based on a sodium alginate derivative for selective release of doxorubicin in tumor cells. J Mater Chem B. 2017;5(12):2337–2346. doi:10.1039/C6TB03032G
13. Fertah M, Belfkira A, Taourirte M, Brouillette F. Extraction and characterization of sodium alginate from Moroccan Laminaria digitata brown seaweed. Arab J Chem. 2017;10:S3707–S3714. doi:10.1016/j.arabjc.2014.05.003
14. Borgogna M, Skjåk-Bræk G, Paoletti S, Donati I. On the initial binding of alginate by calcium ions. The tilted egg-box hypothesis. J Phys Chem B. 2013;117(24):7277–7282. doi:10.1021/jp4030766
15. Jain D, Bar-Shalom D. Alginate drug delivery systems: application in context of pharmaceutical and biomedical research. Drug Dev Ind Pharm. 2014;9045:1–9. doi:10.3109/03639045.2014.917657
16. Yang JS, Xie YJ, He W. Research progress on chemical modification of alginate: a review. Carbohydr Polym. 2011;84(1):33–39. doi:10.1016/j.carbpol.2010.11.048
17. Tsai F, Chiang P, Kitamura Y, Kokawa M, Islam MZ. Producing liquid-core hydrogel beads by reverse spherification: effect of secondary gelation on physical properties and release characteristics. Food Hydrocoll. 2017;62:140–148. doi:10.1016/j.foodhyd.2016.07.002
18. Chen H, Yang W, Chen H, et al. Surface modification of mitoxantrone-loaded PLGA nanospheres with chitosan. Colloids Surf B Biointerfaces. 2009;73(2):212–218. doi:10.1016/j.colsurfb.2009.05.020
19. Elsayed M, Huang J, Edirisinghe M. Bioinspired preparation of alginate nanoparticles using microbubble bursting. Mater Sci Eng C. 2015;46:132–139. doi:10.1016/j.msec.2014.09.036
20. Bhattacharyya A, Mukherjee D, Mishra R, Kundu PP. Development of pH sensitive polyurethane–alginate nanoparticles for safe and efficient oral insulin delivery in animal models. RSC Adv. 2016;6(48):41835–41846. doi:10.1039/C6RA06749B
21. Lopes CM, Bettencourt C, Rossi A, Buttini F, Barata P. Overview on gastroretentive drug delivery systems for improving drug bioavailability. Int J Pharm. 2016;510(1):144–158. doi:10.1016/j.ijpharm.2016.05.016
22. Ching SH, Bansal N, Bhandari B. Rheology of emulsion-filled alginate microgel suspensions. Food Res Int. 2016;80:50–60. doi:10.1016/j.foodres.2015.12.016
23. Pereira S, Egbu R, Jannati G, Al-Jamal WT. Docetaxel-loaded liposomes: the effect of lipid composition and purification on drug encapsulation and in vitro toxicity. Int J Pharm. 2016;514(1):150–159. doi:10.1016/j.ijpharm.2016.06.057
24. Nateghian N, Goodarzi N, Amini M, Atyabi F, Khorramizadeh MR, Dinarvand R. Biotin/folate-decorated human serum albumin nanoparticles of docetaxel: comparison of chemically conjugated nanostructures and physically loaded nanoparticles for targeting of breast cancer. Chem Biol Drug Des. 2016;87(1):69–82. doi:10.1111/cbdd.12624
25. Shen Y, Ma Z, Chen F, et al. Effective photothermal chemotherapy with docetaxel-loaded gold nanospheres in advanced prostate cancer. J Drug Target. 2015;23(6):568–576. doi:10.3109/1061186X.2015.1018910
26. Kim SM, Lee SY, Yuk DY, et al. Inhibition of NF-κB by ginsenoside Rg3 enhances the susceptibility of colon cancer cells to docetaxel. Arch Pharm Res. 2009;32(5):755–765. doi:10.1007/s12272-009-1515-4
27. Han TD, Shang DH, Tian Y. Docetaxel enhances apoptosis and G2/M cell cycle arrest by suppressing mitogen-activated protein kinase signaling in human renal clear cell carcinoma. Genet Mol Res. 2016;15(1):1–10. doi:10.4238/gmr.15017321
28. Tang X, Wang G, Shi R, et al. Enhanced tolerance and antitumor efficacy by docetaxel-loaded albumin nanoparticles. Drug Deliv. 2016;23(8):2686–2696. doi:10.3109/10717544.2015.1049720
29. Zhang L, Zhang N. How nanotechnology can enhance docetaxel therapy. Int J Nanomedicine. 2013;8:2927–2941. doi:10.2147/IJN.S46921
30. Lee S, Yun M, Jeong SW, et al. Development of docetaxel-loaded intravenous formulation, Nanoxel-PMTM using polymer-based delivery system. J Control Release. 2011;155(2):262–271. doi:10.1016/j.jconrel.2011.06.012
31. Wang C, Ho PC, Lim LY. Wheat germ agglutinin-conjugated PLGA nanoparticles for enhanced intracellular delivery of paclitaxel to colon cancer cells. Int J Pharm. 2010;400(1–2):201–210. doi:10.1016/j.ijpharm.2010.08.023
32. Glavas-Dodov M, Calis S, Crcarevska MS, Geskovski N, Petrovska V, Goracinova K. Wheat germ agglutinin-conjugated chitosan-Ca-alginate microparticles for local colon delivery of 5-FU: development and in vitro characterization. Int J Pharm. 2009;381(2):166–175. doi:10.1016/j.ijpharm.2009.06.037
33. Liu Y, Wang P, Sun C, et al. Wheat germ agglutinin-grafted lipid nanoparticles: preparation and in vitro evaluation of the association with Caco-2 monolayers. Int J Pharm. 2010;397(1–2):155–163. doi:10.1016/j.ijpharm.2010.06.030
34. Prados J, Melguizo C, Ortiz R, et al. Colon cancer therapy: recent developments in nanomedicine to improve the efficacy of conventional chemotherapeutic drugs. Anticancer Agents Med Chem. 2013;13(8):1204–1216. doi:10.2174/18715206113139990325
35. Song Q, Yao L, Huang M, et al. Mechanisms of transcellular transport of wheat germ agglutinin-functionalized polymeric nanoparticles in Caco-2 cells. Biomaterials. 2012;33(28):6769–6782. doi:10.1016/j.biomaterials.2012.05.066
36. Glavas-Dodov M, Steffansen B, Crcarevska MS, et al. Wheat germ agglutinin-functionalised crosslinked polyelectrolyte microparticles for local colon delivery of 5-FU: in vitro efficacy and in vivo gastrointestinal distribution. J Microencapsul. 2013;30(7):643–656. doi:10.3109/02652048.2013.770099
37. Yadav S, Ahuja M, Kumar A, Kaur H. Gellan-thioglycolic acid conjugate: synthesis, characterization and evaluation as mucoadhesive polymer. Carbohydr Polym. 2014;99:601–607. doi:10.1016/j.carbpol.2013.08.068
38. Chiu HI, Ayub AD, Mat Yusuf SNA, Yahaya N, Abd Kadir E, Lim V. Docetaxel-loaded disulfide cross-linked nanoparticles derived from thiolated sodium alginate for colon cancer drug delivery. Pharmaceutics. 2020;12(1):38. doi:10.3390/pharmaceutics12010038
39. Bernkop-Schnürch A, Hornof M, Zoidl T. Thiolated polymers—thiomers: synthesis and in vitro evaluation of chitosan-2-iminothiolane conjugates. Int J Pharm. 2003;260(2):229–237. doi:10.1016/S0378-5173(03)00271-0
40. Weissenboeck A, Bogner E, Wirth M, Gabor F. Binding and uptake of wheat germ agglutinin-grafted PLGA-nanospheres by Caco-2 monolayers. Pharm Res. 2004;21(10):1917–1923. doi:10.1023/B:PHAM.0000045247.09724.26
41. Gao C, Liu T, Dang Y, et al. pH/redox responsive core cross-linked nanoparticles from thiolated carboxymethyl chitosan for in vitro release study of methotrexate. Carbohydr Polym. 2014;111:964–970. doi:10.1016/j.carbpol.2014.05.012
42. Hammadi NI, Abba Y, Hezmee MNM, et al. Formulation of a sustained release docetaxel loaded cockle shell-derived calcium carbonate nanoparticles against breast cancer. Pharm Res. 2017;34(6):1193–1203. doi:10.1007/s11095-017-2135-1
43. Mo Y, Lim LY. Preparation and in vitro anticancer activity of wheat germ agglutinin (WGA)-conjugated PLGA nanoparticles loaded with paclitaxel and isopropyl myristate. J Control Release. 2005;107(1):30–42. doi:10.1016/j.jconrel.2004.06.024
44. Davis SS, Khosia R, Wilson CG, Washington N. Gastrointestinal transit of a controlled-release pellet formulation of tiaprofenic acid and the effect of food. Int J Pharm. 1987;35(3):253–258. doi:10.1016/0378-5173(87)90137-2
45. Hardy JG, Wilson CG, Wood E. Drug delivery to the proximal colon. J Pharm Pharmacol. 1985;37(12):874–877. doi:10.1111/j.2042-7158.1985.tb04992.x
46. Li LL, Zhang YQ, Hao NJ, Chen D, Tang FQ. Fabrication of PLGA coated silica nanorattle for controlling the drug release behavior. Chinese Sci Bull. 2012;57(27):3631–3638. doi:10.1007/s11434-012-5246-4
47. Smitha KT, Anitha A, Furuike T, Tamura H, Nair SV, Jayakumar R. In vitro evaluation of paclitaxel loaded amorphous chitin nanoparticles for colon cancer drug delivery. Colloids Surf B Biointerfaces. 2013;104:245–253. doi:10.1016/j.colsurfb.2012.11.031
48. Saremi S, Atyabi F, Akhlaghi SP, Ostad SN, Dinarvand R. Thiolated chitosan nanoparticles for enhancing oral absorption of docetaxel: preparation, in vitro and ex vivo evaluation. Int J Nanomedicine. 2011;6(1):119–128. doi:10.2147/IJN.S15500
49. Hu Y, Xie J, Tong YW, Wang CH. Effect of PEG conformation and particle size on the cellular uptake efficiency of nanoparticles with the HepG2 cells. J Control Release. 2007;118(1):7–17. doi:10.1016/j.jconrel.2006.11.028
50. Ayub AD, Chiu HI, Mat Yusuf SNA, Abd Kadir E, Ngalim SH, Lim V. Biocompatible disulphide cross-linked sodium alginate derivative nanoparticles for oral colon- targeted drug delivery. Artif Cells Nanomed Biotechnol. 2019;47(1):353–369. doi:10.1080/21691401.2018.1557672
51. Szaciłowski K, Wanat A, Barbieri A, et al. Reactions of the [Fe(CN)5NO]2− complex with biologically relevant thiols. New J Chem. 2002;26(10):1495–1502. doi:10.1039/B204719P
52. Ellman GL. Tissue sulfhydryl groups. Arch Biochem Biophys. 1959;82(1):70–77. doi:10.1016/0003-9861(59)90090-6
53. Riener CK, Kada G, Gruber HJ. Quick measurement of protein sulfhydryls with Ellman’s reagent and with 4,4′-dithiodipyridine. Anal Bioanal Chem. 2002;373(4–5):266–276. doi:10.1007/s00216-002-1347-2
54. Sarmento B, Ferreira D, Veiga F, Ribeiro A. Characterization of insulin-loaded alginate nanoparticles produced by ionotropic pre-gelation through DSC and FTIR studies. Carbohydr Polym. 2006;66(1):1–7. doi:10.1016/j.carbpol.2006.02.008
55. Bhatia M, Ahuja M, Mehta H. Thiol derivatization of Xanthan gum and its evaluation as a mucoadhesive polymer. Carbohydr Polym. 2015;131:119–124. doi:10.1016/j.carbpol.2015.05.049
56. Kassem AA, Farid RM, Issa DAE, et al. Development of mucoadhesive microbeads using thiolated sodium alginate for intrapocket delivery of resveratrol. Int J Pharm. 2015;487(1–2):305–313. doi:10.1016/j.ijpharm.2015.04.010
57. Zheng S, Xie Y, Li Y, et al. Development of high drug-loading nanomicelles targeting steroids to the brain. Int J Nanomedicine. 2013;9(1):55–66. doi:10.2147/IJN.S52576
58. Mahajan HS, Tyagi VK, Patil RR, Dusunge SB. Thiolated xyloglucan: synthesis, characterization and evaluation as mucoadhesive in situ gelling agent. Carbohydr Polym. 2013;91(2):618–625. doi:10.1016/j.carbpol.2012.08.077
59. Beck-Broichsitter M, Rytting E, Lebhardt T, Wang X, Kissel T. Preparation of nanoparticles by solvent displacement for drug delivery: a shift in the “ouzo region” upon drug loading. Eur J Pharm Sci. 2010;41(2):244–253. doi:10.1016/j.ejps.2010.06.007
60. Torchilin VP. Targeted polymeric micelles for delivery of poorly soluble drugs. Cell Mol Life Sci. 2004;61(19–20):2549–2559. doi:10.1007/s00018-004-4153-5
61. Mo Y, Lim LY. Mechanistic study of the uptake of wheat germ agglutinin-conjugated PLGA nanoparticles by A549 cells. J Pharm Sci. 2004;93(1):20–28. doi:10.1002/jps.10507
62. Smith PK, Krohn RI, Hermanson GT, et al. Measurement of protein using bicinchoninic acid. Anal Biochem. 1985;150(1):76–85. doi:10.1016/0003-2697(85)90442-7
63. Wiechelman KJ, Braun RD, Fitzpatrick JD. Investigation of the bicinchoninic acid protein assay: identification of the groups responsible for color formation. Anal Biochem. 1988;175(1):231–237. doi:10.1016/0003-2697(88)90383-1
64. Mohd Narawi M, Chiu HI, Yong YK, et al. Biocompatible nutmeg oil-loaded nanoemulsion as phyto-repellent. Front Pharmacol. 2020;11:1–15. doi:10.3389/fphar.2020.00214
65. Honary S, Zahir F. Effect of zeta potential on the properties of nano-drug delivery systems - A review (Part 2). Trop J Pharm Res. 2013;12(2):265–273. doi:10.4314/tjpr.v12i2.20
66. Martínez A, Olmo R, Iglesias I, Teijón JM, Blanco MD. Folate-targeted nanoparticles based on albumin and albumin/alginate mixtures as controlled release systems of tamoxifen: synthesis and in vitro characterization. Pharm Res. 2014;31(1):182–193. doi:10.1007/s11095-013-1151-z
67. Lin W, Nie S, Xiong D, Guo X, Wang J, Zhang L. pH-responsive micelles based on (PCL)2(PDEA-b-PPEGMA)2 miktoarm polymer: controlled synthesis, characterization, and application as anticancer drug carrier. Nanoscale Res Lett. 2014;9(1):243. doi:10.1186/1556-276X-9-243
68. Li P, Luo Z, Liu P, et al. Bioreducible alginate-poly(ethylenimine) nanogels as an antigen-delivery system robustly enhance vaccine-elicited humoral and cellular immune responses. J Control Release. 2013;168(3):271–279. doi:10.1016/j.jconrel.2013.03.025
69. Zare Y. Study of nanoparticles aggregation/agglomeration in polymer particulate nanocomposites by mechanical properties. Compos Part a Appl Sci Manuf. 2016;84:158–164. doi:10.1016/j.compositesa.2016.01.020
70. Bernkop-Schnürch A, Kast CE, Richter MF. Improvement in the mucoadhesive properties of alginate by the covalent attachment of cysteine. J Control Release. 2001;71(3):277–285. doi:10.1016/S0168-3659(01)00227-9
71. Li H, Dong WF, Zhou JY, Xu XM, Li FQ. Triggering effect of N-acetylglucosamine on retarded drug release from a lectin-anchored chitosan nanoparticles-in-microparticles system. Int J Pharm. 2013;449(1–2):37–43. doi:10.1016/j.ijpharm.2013.04.008
72. Wong TW. Alginate graft copolymers and alginate-co-excipient physical mixture in oral drug delivery. J Pharm Pharmacol. 2011;63(12):1497–1512. doi:10.1111/j.2042-7158.2011.01347.x
73. Wu N, Wang LS, Tan DCW, Moochhala SM, Yang YY. Mathematical modeling and in vitro study of controlled drug release via a highly swellable and dissoluble polymer matrix: polyethylene oxide with high molecular weights. J Control Release. 2005;102(3):569–581. doi:10.1016/j.jconrel.2004.11.002
74. Mosmann T. Rapid colorimetric assay for cellular growth and survival: application to proliferation and cytotoxicity assays. J Immunol Methods. 1983;65(1–2):55–63. doi:10.1016/0022-1759(83)90303-4
75. Sidambe AT, Todd I, Hatton PV. Effects of build orientation induced surface modifications on the in vitro biocompatibility of electron beam melted Ti6Al4V. Powder Metall. 2016;59(1):57–65. doi:10.1080/00325899.2016.1153278
76. Hanan NA, Chiu HI, Ramachandran MR, et al. Cytotoxicity of plant-mediated synthesis of metallic nanoparticles: a systematic review. Int J Mol Sci. 2018;19(6):1725. doi:10.3390/ijms19061725
77. Liu Y, Zhao Y, Liu J, Zhang M, Yu M, Feng N. Wheat germ agglutinin modification of lipid-polymer hybrid nanoparticles: enhanced cellular uptake and bioadhesion. RSC Adv. 2016;6(42):36125–36135. doi:10.1039/c6ra04023c
 © 2021 The Author(s). This work is published and licensed by Dove Medical Press Limited. The
full terms of this license are available at https://www.dovepress.com/terms
and incorporate the Creative Commons Attribution
- Non Commercial (unported, 3.0) License.
By accessing the work you hereby accept the Terms. Non-commercial uses of the work are permitted
without any further permission from Dove Medical Press Limited, provided the work is properly
attributed. For permission for commercial use of this work, please see paragraphs 4.2 and 5 of our Terms.
© 2021 The Author(s). This work is published and licensed by Dove Medical Press Limited. The
full terms of this license are available at https://www.dovepress.com/terms
and incorporate the Creative Commons Attribution
- Non Commercial (unported, 3.0) License.
By accessing the work you hereby accept the Terms. Non-commercial uses of the work are permitted
without any further permission from Dove Medical Press Limited, provided the work is properly
attributed. For permission for commercial use of this work, please see paragraphs 4.2 and 5 of our Terms.