Back to Journals » Cancer Management and Research » Volume 11
Voltage-dependent calcium channel α2δ1 subunit is a specific candidate marker for identifying gastric cancer stem cells
Authors Zhang Z, Zhao W ![]() , Lin X, Gao J, Zhang Z, Shen L
, Lin X, Gao J, Zhang Z, Shen L ![]()
Received 23 December 2018
Accepted for publication 3 April 2019
Published 23 May 2019 Volume 2019:11 Pages 4707—4718
DOI https://doi.org/10.2147/CMAR.S199329
Checked for plagiarism Yes
Review by Single anonymous peer review
Peer reviewer comments 2
Editor who approved publication: Dr Beicheng Sun
Ziran Zhang,1 Wei Zhao,2 Xiaoting Lin,1 Jing Gao,1 Zhiqian Zhang,2 Lin Shen1
1Key Laboratory of Carcinogenesis and Translational Research (Ministry of Education/Beijing), Department of Gastrointestinal Oncology, Peking University Cancer Hospital and Institute, Beijing, People’s Republic of China; 2Key Laboratory of Carcinogenesis and Translational Research (Ministry of Education), Department of Cell Biology, Peking University Cancer Hospital and Institute, Beijing, People’s Republic of China
Purpose: Cancer stem cells (CSCs) are a subpopulation of cancer cells with self-renewal property and responsible for tumor malignancy, progression and drug resistance. Researches on CSC-specific markers in gastric cancer remain limited. Our current study explored the expression of voltage-dependent calcium channel α2δ1 subunit and the potential of using α2δ1 as a CSC marker in gastric cancer. We also compared the specificity of α2δ1 and CD44 in identifying gastric cancer stem cells (GCSCs).
Materials and methods: Expression of α2δ1 was analyzed in gastric cancer cell lines, patient-derived xenograft (PDX) models and clinical samples of malignant ascites of gastric cancer patients. α2δ1+, gastric cancer cells were isolated from gastric cancer cell lines. CSC properties of α2δ1+, gastric cancer cells were then verified by subsequent tests both in vitro and in vivo.
Results: The expression level of α2δ1 was found to differ drastically among gastric cancer cell lines, PDX models and clinical samples of malignant ascites. α2δ1+, gastric cancer cells sorted from HGC-27 and SGC-7901 cell lines demonstrated significant self-renewal properties, including tumorigenic capacity, sphere-formation capacity and asymmetric differentiation potential. Knockdown of α2δ1 in α2δ1+, HGC-27 significantly inhibited CSC properties and rendered HGC-27 more sensitive to chemotherapy. Flow cytometry showed that α2δ1+, gastric cancer cells accounted for a small fraction of CD44+, gastric cancer cells. Isolated CD44+,α2δ1+, HGC-27 cells displayed more significant tumorigenic capacity and sphere-forming capacity compared with their CD44+,α2δ1−, counterparts.
Conclusion: α2δ1+, gastric cancer cells possessed CSC properties. α2δ1 could be a proper marker in identifying GCSCs with superior specificity than CD44. The combination of α2δ1 and CD44 could be used to identify GCSCs with improved accuracy. Knockdown of α2δ1 combined with chemotherapy displayed higher therapeutic efficacy on gastric cancer cells, suggesting that α2δ1 could be a potential target for anticancer treatment.
Keywords: α2δ1, gastric cancer, cancer stem cell, HGC-27
Introduction
Gastric cancer is the fourth most common malignant tumor and the third leading cause of cancer-related mortality worldwide, with an estimated 1.3 million new cases in 2015.1 Approximately 75% of all patients diagnosed with gastric cancer are at advanced stages. Up to now, conventional cytotoxic chemotherapy has been the major treatment for advanced gastric cancer. Unfortunately, the prognosis for patients with advanced gastric cancer remains gloomy, with median survival time of <1 year, mainly due to tumor metastatic, relapse and drug resistance.1–3 The cancer stem cell (CSC) theory has brought new hope to this situation.
CSC is defined as a small subset of cancer cells with self-renewal property and could differentiate asymmetrically into daughter CSC to maintain its population as well as into non-CSC to form the bulk of the tumor.4 CSCs are highly invasive and are responsible for metastasis, drug resistance and relapse. Therefore, novel treatment targeting CSCs has the potential to revolutionize cancer treatment. Numerous studies have succeeded in identifying gastric cancer stem cell (GCSC) with various molecular markers including CD44, aldehyde dehydrogenase (ALDH), CD90, Sca-1, EpCAM, ABCG-2, Lgr5, Villin and MIST-1.5–15 However, there are still limitations due to poor specificity of these markers. For example, ALDH, Lgr5 and EpCAM were also found to be expressed in normal gastric stem cells, while CD44 was reported sometimes to be expressed in cancer cells without significant CSC properties.16,17 Thus, it is necessary to seek for more specific GCSC markers in order to develop treatment safely targeting GCSC.
α2δ1 is a subunit of the voltage-dependent calcium channel complexes expressed on cell membrane. Zhao et al have reported the expression of α2δ1 in a population of primary hepatocellular carcinoma (HCC) cells with CSC properties. They generated a new monoclonal antibody 1B50-1mAb that could specifically bind to α2δ1 and suppress tumor growth by blocking the MAPK pathway through the inhibition of ERK functions. The target of 1B50-1mAb is the isoform 5 of α2δ1, which is found to be expressed exclusively in HCC stem cells, whereas none was expressed in normal hepatic stem cells. Moreover, combined treatment using 1B50-1mAb and chemotherapy led to more significant tumor decrease in HCC patient-derived xenograft (PDX) models than using chemotherapy alone.18 In another more recent study, Yu et al identified small cell lung cancer (SCLC) cells with CSC properties using α2δ1 as the marker and further confirmed that α2δ1+ SCLC cells are closely related to chemoresistance. Also, combination of 1B50-1mAb and chemotherapy demonstrated significant therapeutic effect in originally chemoresistant SCLC PDX model.19 These previous studies provide evidence that α2δ1 may be a suitable biomarker for identifying CSCs in various solid tumors and a potential target for anticancer treatment. There have been no reports about α2δ1 expression in gastric cancer.
We hypothesized that α2δ1 might play a similar role in gastric cancer. To test our hypothesis, we analyzed the expression of α2δ1 in different gastric cancer cell lines, cancer PDX models and clinical samples of malignant ascites collected directly from gastric cancer patients. We further tested the CSC properties of α2δ1+ gastric cancer cells using a series of assays both in vitro and vivo. Also, we conducted initial tests about the potential therapeutic effect of α2δ1 inhibition.
Materials and methods
Cell lines, animals and clinical samples
The expression of α2δ1 and CD44 was analyzed in human gastric cancer cell lines HGC-27, SGC-7901, BGC-823, MGC-803, MKN-45, MKN-74, MKN-28, AGS and NCI-N87. HGC-27, SGC-7901, BGC-823, MGC-803, MKN-45, MKN-74, MKN-28 and AGS were purchased from Peking Union Medical College, Beijing, China. NCI-N87 was provided by You-yong Lv, PhD (Peking University Cancer Hospital and Institute). HGC-27, SGC-7901, BGC-823, MGC-803, MKN-45, MKN-74, MKN-28 and AGS cells were cultured in the RPMI-1640 medium supplemented with 10% FBS (Gibco-BRL, Gaithersburg, MD, USA) and 100 U/mL penicillin (Gibco-BRL) and 100 mg/mL streptomycin (Gibco-BRL). NCI-N87 were cultured in the DMEM (Gibco-BRL) supplemented with 10% FBS (Gibco-BRL), 100 U/mL penicillin (Gibco-BRL) and 100 mg/mL streptomycin (Gibco-BRL). Cells were incubated in a humidified incubator (37°C) supplemented with 5% CO2.
The gastric PDX models were previously established in our laboratory through inoculation of fresh fragments of gastroscopy biopsies in NOD/SCID mice.21 The NOD/SCID female mice (aged 4–6 weeks, weighing 18–21 g) involved in our current research were purchased from Beijing HFK Bio-Technology Co. Ltd. (Beijing, China). All mice were raised in the specific pathogen free animal laboratory of Peking University Clinical Cancer Hospital Animal Center. All animal experiments were performed under sterile conditions and in accordance with the National Institutes of Health Guide for the Care and Use of Laboratory Animals with protocols approved by the Animal Care and Use Committee of Peking University Cancer Hospital.
The ascites samples were collected directly from gastric cancer patients receiving treatment at our department. All patients had been pathologically diagnosed with malignant ascites due to gastric cancer. Fresh ascites were collected in sterile test tubes and centrifuged within 2 hrs at 1,000 rpm for 10 mins at 4°C. The cell pellet was resuspended in 4 mL PBS and carefully transferred to a 15 mL test tube containing 3 mL Ficoll–PaqueTM PLUS isolation media (Amersham Biosciences, Piscataway, NJ, USA). After centrifugation at 1,500 rpm for 30 mins at 18–20°C, the upper layer was removed and the second layer containing tumor cells was transferred to another test tube. The tumor cells were washed through the addition of 6 mL PBS and centrifuged at 800 rpm for 10 mins at 18–20°C. Finally, the upper layer was removed and the tumor cell pellet was used in further experiments. All patients had signed written informed consent form before we collected the clinical samples. Acquisition and use of these samples were approved by the Ethics Committee of Beijing Cancer Hospital.
Antibody labeling, flow cytometry analysis and flow cytometry sorting
The cells were collected and suspended at 1×10⁶ cells/mL in PBS. Fluorescent-labeled monoclonal antibodies were added to the samples at the concentrations recommended by the manufacturers. After washed using PBS, the labeled cells were analyzed using flow cytometry BD AccuriTM C6(BD Biosciences, Bedford, MA, USA) and sorted using fluorescence-activated cell sorting (FACS) BD AriaⅡ (BD Biosciences). The antibodies included allophycocyanin-conjugated mouse anti-human CD44 (Miltenyi Biotec, Bergisch Gladbach, Germany), phycoerythrin-conjugated mouse anti-human CD326 (EpCAM) (Miltenyi Biotec) and their corresponding IgG isotypes (Miltenyi Biotec). Detailed information of antibodies is listed in Table 1. The 1B50-1 monoclonal antibody and the corresponding IgG isotype were provided by Zhiqian Zhang, PhD (Laboratory of Carcinogenesis and Translational Research, Department of Cell Biology, Peking University Cancer Hospital and Institute). Both of the 1B50-1 monoclonal antibody and the corresponding IgG isotype were labeled with fluorescein using Lightning Conjugation Kits (Innova Biosciences Ltd, Cambridge, UK) following the manufacturer's protocol.
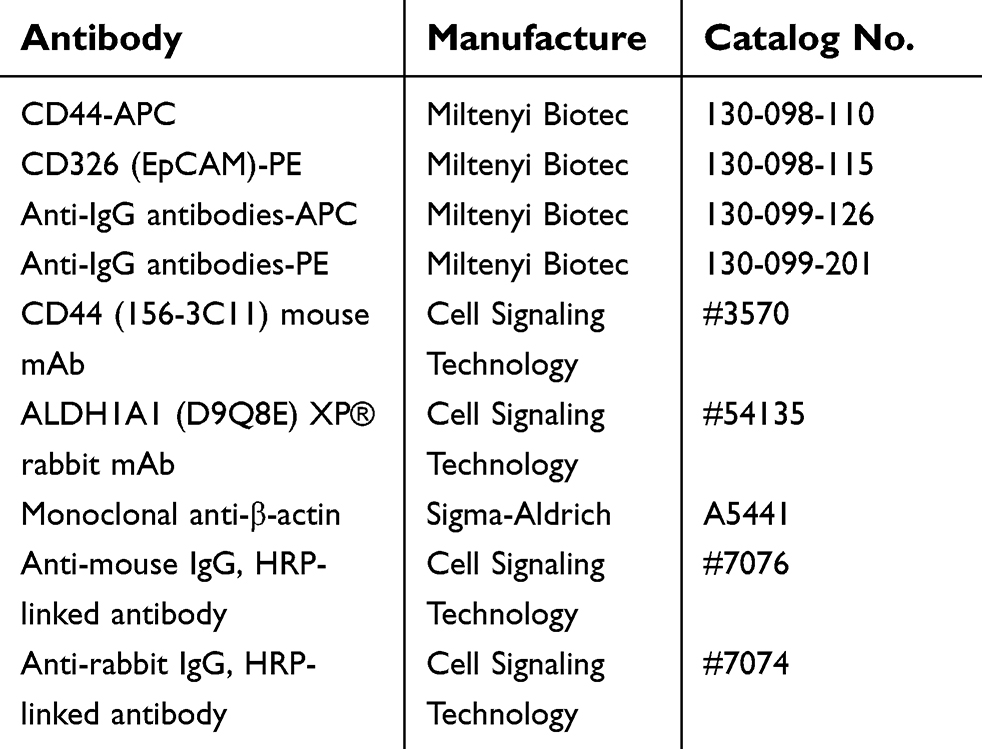 | Table 1 Antibody information used in this study is summarized |
Sphere-formation assays
The sorted cells from HGC-27 and SGC-7901 cell lines were counted and mixed with the DMEM/F12 (Invitrogen, Grand Island, NY, USA) supplemented with B27 (Invitrogen), 20 ng/mL epidermal growth factor, 20 ng/mL basic fibroblast growth factor (Peprotech, Rocky Hill, NY, USA), 10 ng/mL hepatocyte growth factor (Peprotech) and 1% methylcellulose (Sigma-Aldrich, St. Louis, MO, USA). Then, the mixture was seeded in semisuspension and was cultured in Ultra Low Attachment 96-well plates (Corning Incorporated Life Sciences, Acton, MA, USA) with 100 cells/well. After incubation of 2–3 weeks, the number of spheres was counted and recorded under a stereomicroscope (Olympus, Tokyo, Japan). The frequency of sphere formation was calculated.
Tumorigenicity assay
The sorted cells from HGC-27 and SGC-7901 cell lines were suspended in PBS and mixed with Matrigel (BD Biosciences, Bedford, MA, USA) at a ratio of 1:1. The mixture was transplanted subcutaneously into the back of NOD/SCID mice (aged 4–6 weeks, weighing 18–21 g) bilaterally, with α2δ1+ and α2δ1− cells at each side. Tumor formation was observed weekly, and the frequency of tumor formation was calculated.
Differentiation assays
The sorted cells from HGC-27 and SGC-7901 cell lines were reanalyzed by flow cytometry BD AccuriTM C6 (BD Biosciences) to reassure the accurate measurement of the frequency of α2δ1 expression. Then, the sorted cells were counted and cultured separately in RPMI-1640 supplemented with 10% FBS and 1% penicillin/streptomycin at 37°C under 5% CO2. After 2 weeks, the cells were collected and the frequency of α2δ1 expression was reanalyzed by flow cytometry.
Transwell assays
The transwell assays were conducted using BD BioCoat™ Matrigel™ Invasion Chamber (BD Biosciences). The sorted α2δ1+ and α2δ1− HGC-27 cells were suspended in serum-free RPMI-1640 and placed separately on the upper layer of the inserts with permeable membrane. The lower chambers contained RPMI-1640 supplemented with 10% FBS. The cells were then incubated at 37°C under 5% CO2 for 24 hrs. After the incubation period, the cells that had migrated through the membrane were fixed and stained and then counted under a stereomicroscope (Olympus).
Western blot analysis
Gastric cancer cells were collected and lysed using cell lysis buffer (Cell Signaling Technology, Danvers, MA, USA) and quantified using a bicinchoninic acid assay (Applygen, Beijing, China). Lysates were resolved on 12% SDS-PAGE gels and electroblotted onto nitrocellulose membranes. Primary antibodies including 1B50-1 mAb, CD44 mAb (Cell Signaling Technology), ALDH1A1 mAb (Cell Signaling Technology) and anti-β-actin (Sigma-Aldrich, St. Louis, MO, USA) were added and incubated overnight at 4°C. Then, secondary antibodies (Cell Signaling Technology) including horseradish peroxidase-labeled anti-rabbit IgG or anti-mouse IgG were added and incubated for 2 hrs at room temperature. The bands were visualized using enhanced chemoluminescence and photographed with a Fujifilm Dark Box.
The 1B50-1 mAb was provided by Zhiqian Zhang, PhD (Laboratory of Carcinogenesis and Translational Research, Department of Cell Biology, Peking University Cancer Hospital and Institute).
Antibodies used in this study are summarized in Table 1.
Statistical analysis
Statistical analysis was performed with SPSS 21.0 software(IBM, Armonk, NY, USA). The significance of differences was determined with Student’s t test or a χ2 test. The tumorigenic frequency and the comparison between different groups were calculated based on extreme limiting dilution analysis using the web tool at
Results
Expression levels of α2δ1 in gastric cancer cell lines, PDX models and clinical samples of malignant ascites from gastric cancer patients
We first analyzed the expression of α2δ1 in nine gastric cancer cell lines (HGC-27, SGC-7901, MKN-45, MKN-74, MKN-28, AGS, BGC-823, MGC-803 and NCI-N87) using flow cytometry. As shown in Figure 1A, B and Table 2, α2δ1 was found to be expressed at different levels in the tested gastric cancer cell lines. Of the tested cell lines, expression level of α2δ1 was found to be very low or undetectable in six of the cell lines, whereas it was found to be very high in cell line HGC-27, which is the only undifferentiated cell line among all the nine tested cell lines.20 We also investigate the expression of α2δ1 in the nine gastric cancer cell lines by Western blotting. As shown in Figure 1C, α2δ1 was found to be highly expressed in HGC-27 cell line and very lowly expressed or not expressed in the other tested gastric cancer cell lines.
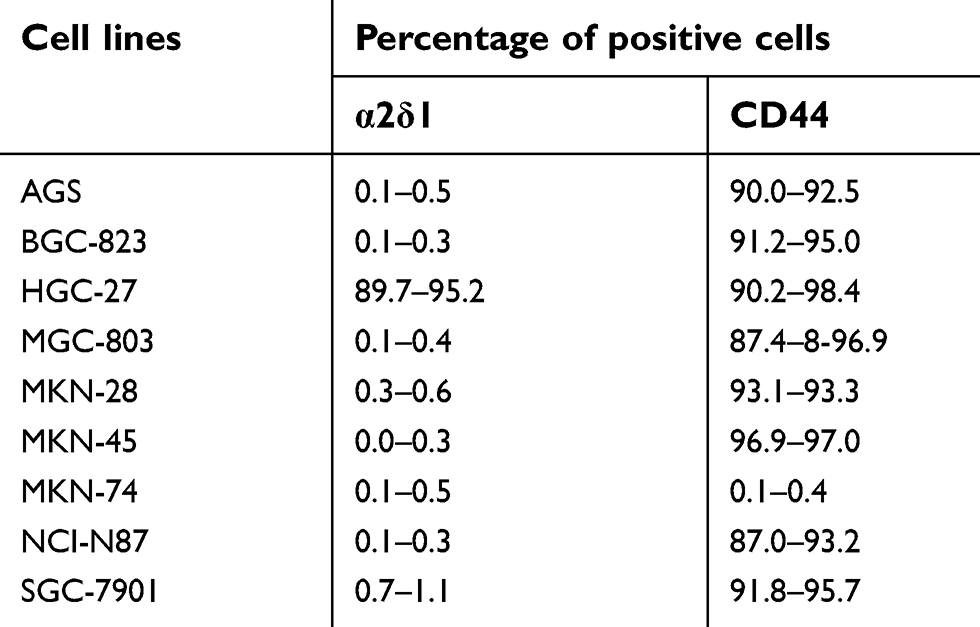 | Table 2 Expression levels of α2δ1 and CD44 are analyzed in gastric cancer cell lines |
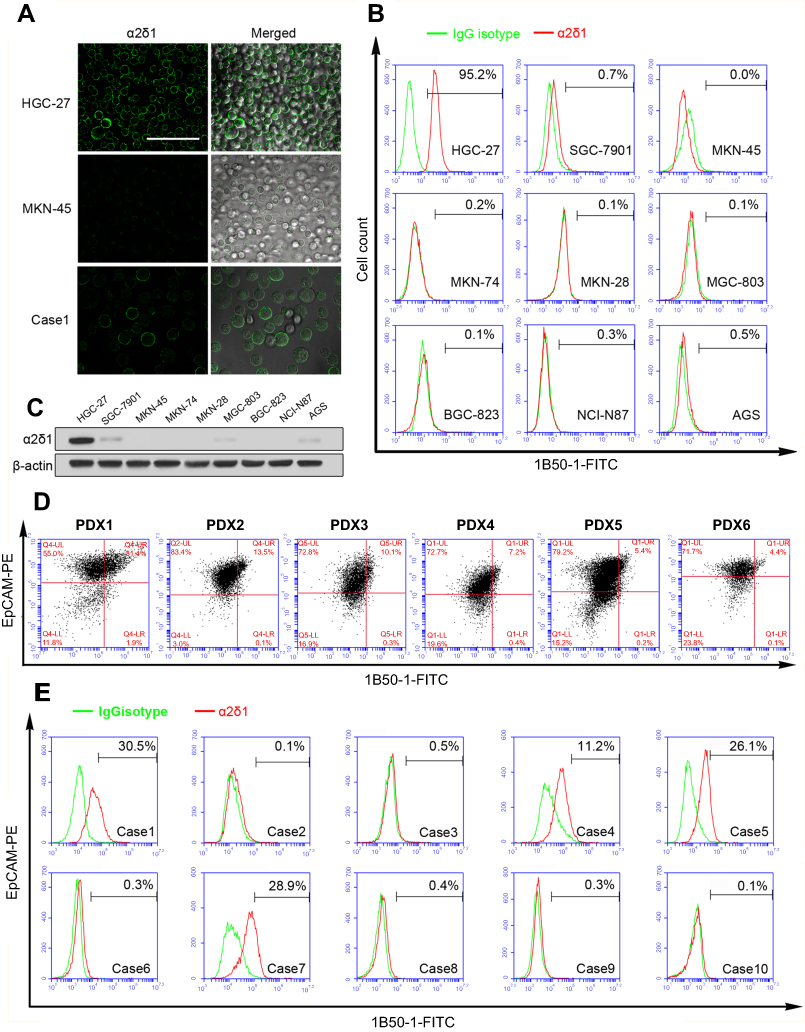 | Figure 1 Expression levels of α2δ1 were different in gastric cancer cell lines, PDX models and ascites samples. (A) Representative images illustrating the expression of α2δ1 in HGC-27 cell line, MKN45 cell line and ascites sample (Case 1) detected using confocal microscope. Merged images showed α2δ1 expressed on the cell membranes of cells. (B) Flow cytometry analysis showed α2δ1 expressed differently in nine gastric cancer cell lines. (C) Western blotting analysis was conducted to investigate the expression of α2δ1 in gastric cancer cell lines. Results showed α2δ1 expressed at different levels in the nine tested cell lines. (D) Flow cytometry analysis showed α2δ1 expressed differently in six gastric cancer cell PDX models. (E) Flow cytometry analysis showed α2δ1 expressed differently in 10 clinical samples of ascites of gastric cancer patients (Cases 1–10). Scale bar: 100 µm.Abbreviations: PDX, patient-derived xenograft; FITC, fluorescein isothiocyanate; PE, phycoerythrin. |
To investigate the expression of α2δ1 in gastric cancer tumors, we then analyzed the tumor samples of six different gastric cancer PDX models previously established in our laboratory by flow cytometry.21 Similarly, α2δ1 were found to be expressed at different levels ranging from 4.4% to 31.4% in the tested PDX models, as shown in Figure 1D.
To further investigate the expression of α2δ1 in clinical sample of gastric cancer patients, we collected samples of malignant ascites from ten different gastric cancer patients with widespread metastasis and isolated the tumor cells from each clinical sample following the procedure described above, and then we analyzed the expression of α2δ1 in the isolated tumor cells by flow cytometry. The results showed α2δ1 expressed at different levels in clinical samples ranging from 0.1% to 30% among the ten ascites samples, as shown in Figure 1E and Table 3.
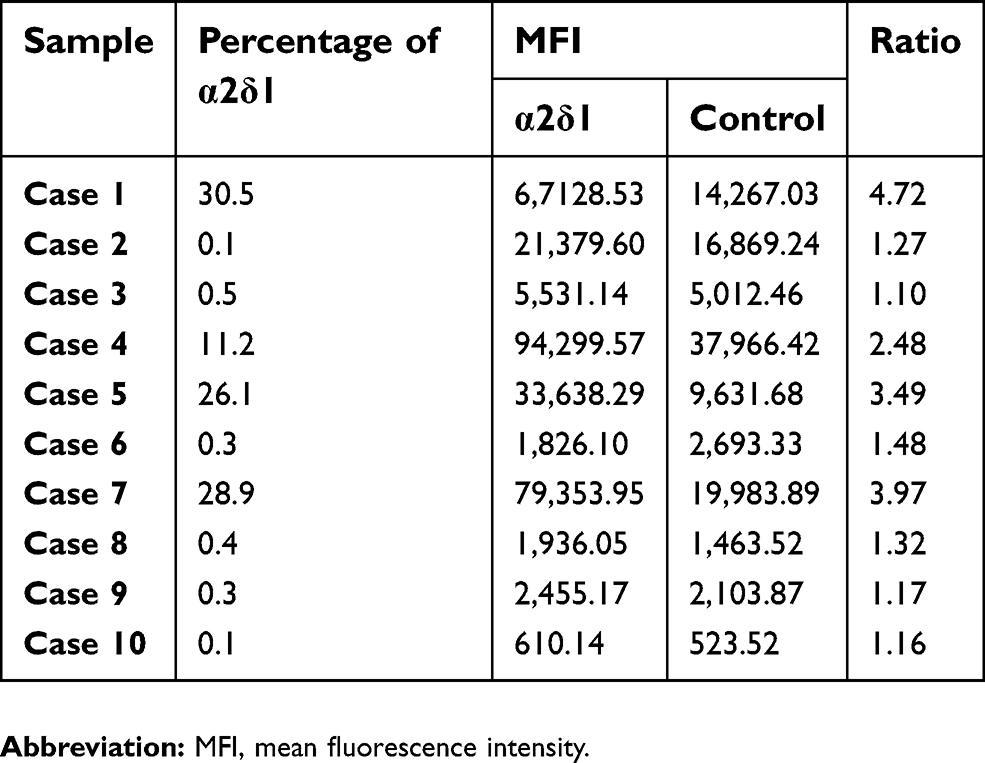 | Table 3 Ratio of MFI between α2δ1 versus control in ascites samples of gastric cancer patients |
α2δ1+ gastric cancer cells possess highly self-renewal property
GCSC is known closely related to various malignant characteristics including poor differentiation, metastasis and chemoresistance.12,22 The results that α2δ1 was especially highly expressed in the undifferentiated cell line HGC-27 and was present in clinical samples of patients with metastatic and chemoresisted gastric cancer led us to speculate whether α2δ1 is associated with GCSC. Therefore, we performed a series of assays to evaluate the correlation between α2δ1 expression and the self-renewal property in gastric cancer cells.
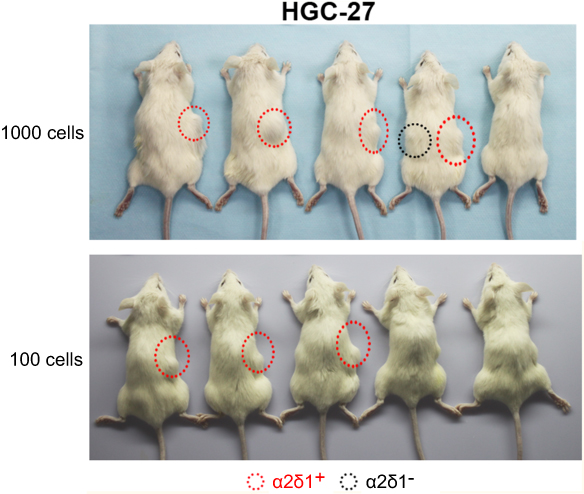
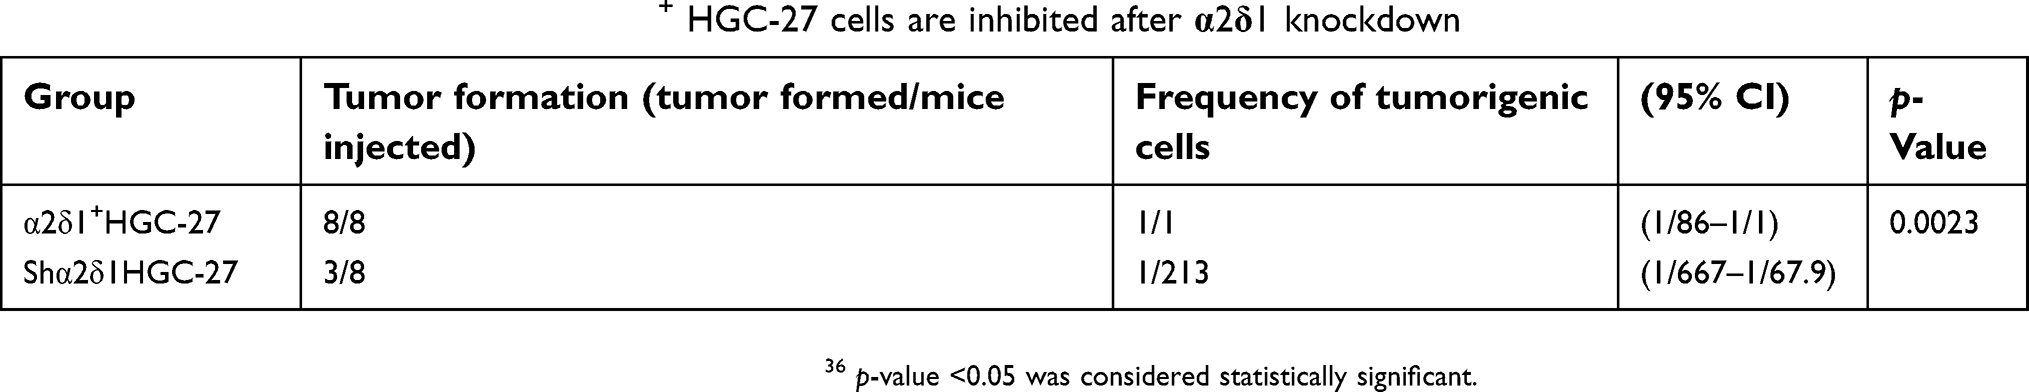
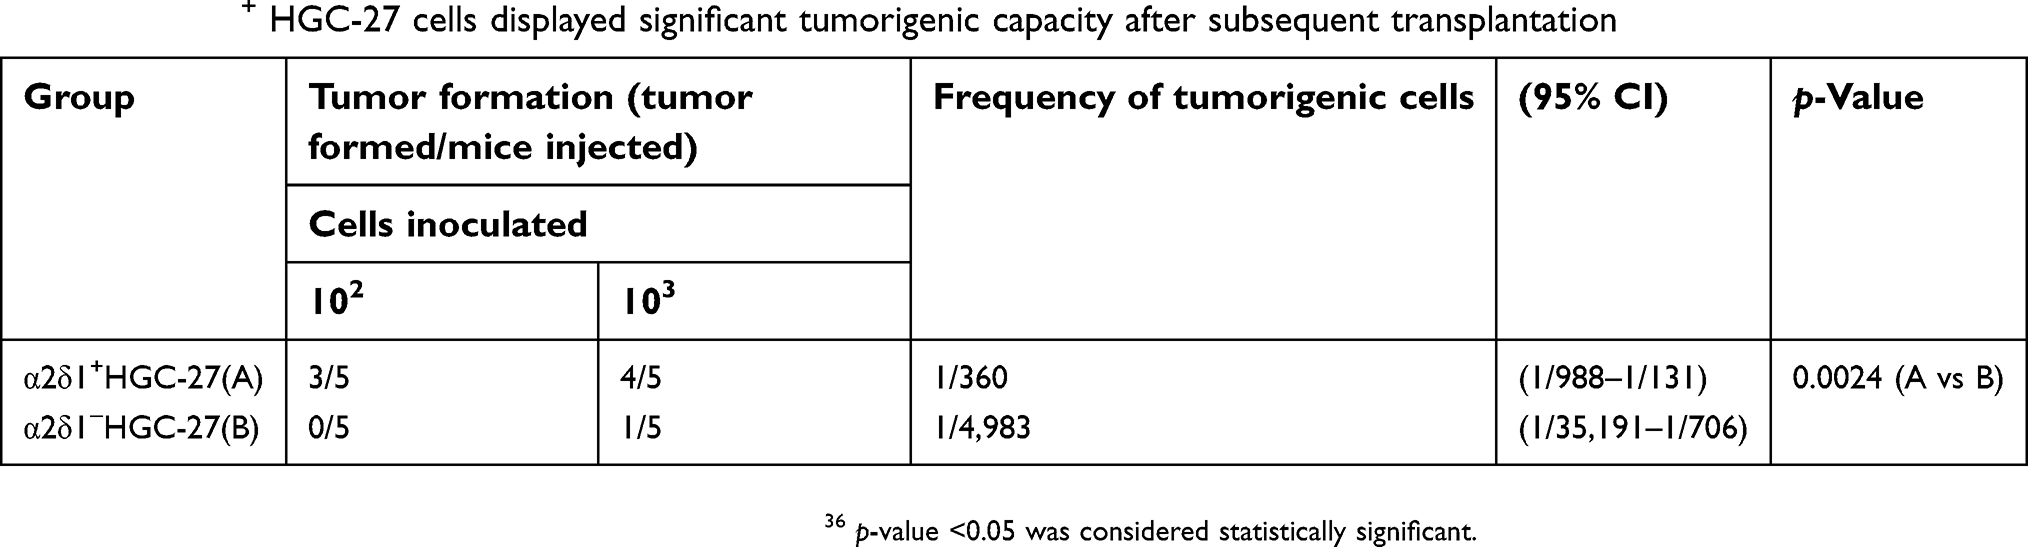
We first tested the tumorigenic capacity of α2δ1+ gastric cancer cells in vivo. The purified α2δ1+ and α2δ1− cells from HGC-27 and SGC-7901 cell lines were inoculated subcutaneously into NOD/SCID mice with limiting dilution (Figure 2A, Table 4). Results showed that as few as 100 α2δ1+ HGC-27 cells could trigger tumor formation in five out of eight of the inoculated mice, whereas the α2δ1− HGC-27 cells formed tumor only occasionally (two of eight) within the same observation period. When inoculated with 1,000 cells, α2δ1+ cells triggered tumor formation in seven of eight inoculated mice for HGC-27 and in six out of nine inoculated mice for SGC-7901, whereas their α2δ1− counterparts only triggered tumor formation in two of eight mice for HGC-27 and two of nine mice for SGC-7901. These observations suggested that α2δ1 defined a subpopulation of gastric cancer cells with highly tumorigenic capacity in vivo. We then sorted α2δ1+ and α2δ1− cells from the tumors formed previously by the α2δ1+ cells in the first generation and performed subsequent transplantation assays. The results showed that the α2δ1+ cells successfully initiated tumor formation in the subsequently transplanted mice with high frequency, whereas the α2δ1− cells remained extremely lowly tumorigenic (Figure S1, Table S1). These results indicated that α2δ1+ cells possessed self-renewal property in vivo.
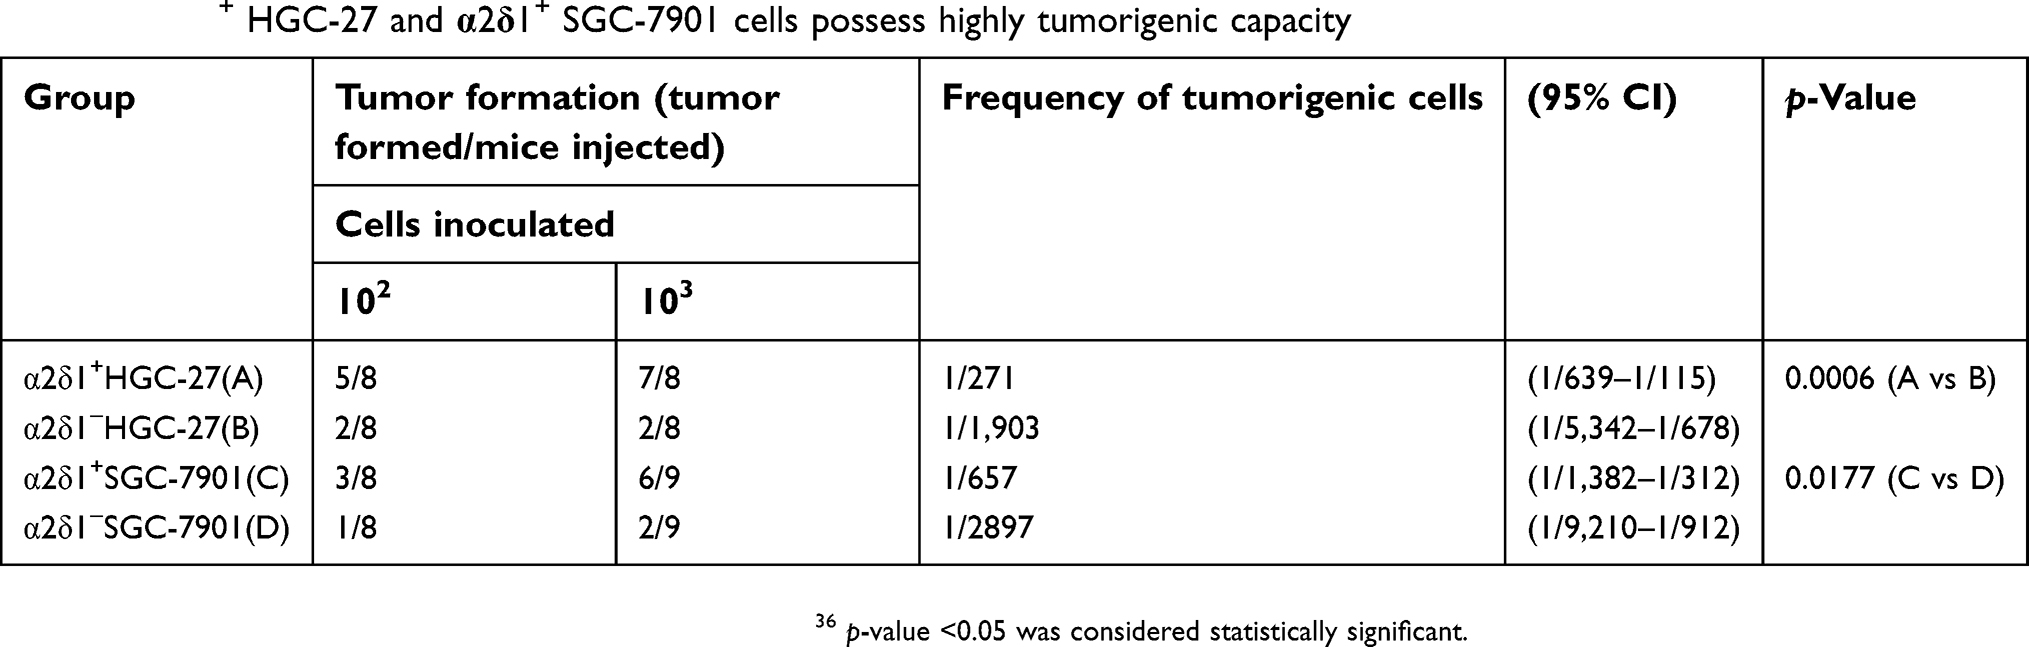 | Table 4 α2δ1+ HGC-27 and α2δ1+ SGC-7901 cells possess highly tumorigenic capacity |
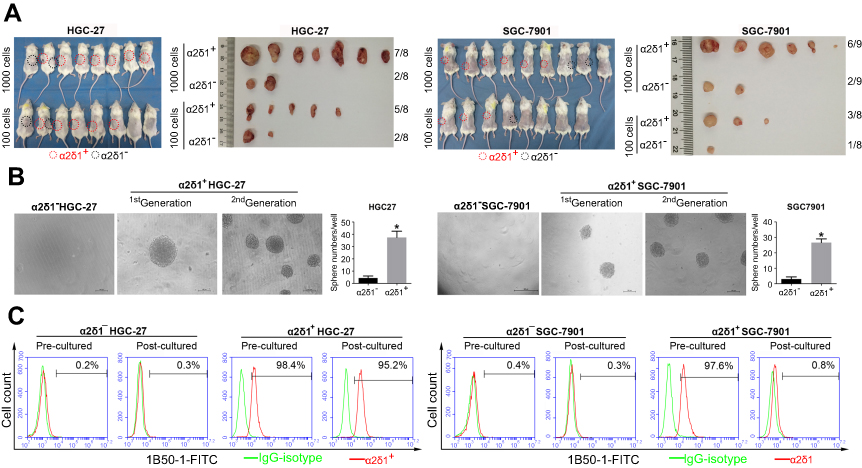 | Figure 2 α2δ1+ HGC-27 and α2δ1+ SGC-7901 cells displayed cancer stem cell properties. (A) Comparison of tumor formation frequency of purified α2δ1+ and α2δ1− cells in NOD/SCID mice. α2δ1+ cells displayed significant tumorigenic capacity. (B) Comparison of sphere-formation frequency of purified α2δ1+ and α2δ1− cells in vitro. α2δ1+ cells displayed significant sphere-forming capacity. α2δ1+ cells sorted from the sphere formed previously continued to display high sphere-forming capacity after subsequent propagation. (C) Comparison of differentiation potential of α2δ1+ and α2δ1− cells in vitro. Purified α2δ1+ cells were cultured in vitro for 2 weeks, and the percentage of α2δ1+ cells decreased to the value similar to that of the unsorted parental cells. Purified α2δ1− cells were cultured in vitro under the same condition for the same period, and the percentage of α2δ1+ cells remained extremely low in the post-cultured α2δ1− cells. *p<0.05. Scale bar: 100 µm.Abbreviation: FITC, fluorescein isothiocyanate. |
 | Figure S1 α2δ1+ HGC-27 cells displayed significant tumorigenic capacity after subsequent transplantation. α2δ1+ and α2δ1− HGC-27 cells were isolated from the tumors formed previously by the α2δ1+ cells in the first generation and inoculated subcutaneously into NOD/SCID mice with limiting dilution. As few as 100 α2δ1+ HGC-27 cells successfully initiated tumor formation in NOD/SCID mice, whereas their α2δ1− cell counterparts remained extremely lowly tumorigenic within the same observation period.Abbreviation: NOD/SCID, nonobese diabetic-severe combined immune deficient. |
We also performed the sphere-formation assays in vitro with the purified α2δ1+ cells from HGC-27 and SGC-7901 cell lines. As shown in Figure 2B, α2δ1+ cells displayed significant sphere-forming capacity, whereas their corresponding α2δ1− counterparts displayed extremely low sphere-forming capacity. It was important to note that the α2δ1+ cells sorted from the sphere formed previously continued to display similarly high sphere-forming capacity after subsequent propagation, demonstrating self-renewal capacity in vitro. Again, their sorted α2δ1− counterparts formed spheres at extremely low frequency after subsequent propagation.
These results suggested that α2δ1+ subpopulations displayed self-renewal capacity both in vitro and in vivo.
α2δ1+ gastric cancer cells possess differentiation potential and invasiveness
Another important characteristic of CSC is the differentiation potential. We purified α2δ1+ cells from HGC-27 and SGC-7901 cell lines. After cultured in vitro for 2 weeks, the percentage of α2δ1+ cells decreased to 95.2% for HGC-27 and 0.8% for SGC-7901, similar to that of the unsorted parental cells. We also purified α2δ1− cells from HGC-27 and SGC-7901 cell lines and cultured the sorted cells under the same condition for 2 weeks. It is notable that the percentage of α2δ1+ remained extremely low in the postcultured α2δ1− cells for both cell lines. These results are shown in Figure 2C. This indicated that the α2δ1+ gastric cancer cells could differentiate into α2δ1− cells but not vice versa.
We also compared the invasive capacity of purified α2δ1+ cells and α2δ1− cells with the transwell assay. The isolated α2δ1+ and α2δ1− cells from HGC-27 were cultured separately in the transwell chambers for 24 hrs. After incubation, the cells that had migrated through the membrane were stained and counted. As shown in Figure 3, the isolated α2δ1+ HGC-27 cells presented more significant invasiveness than their α2δ1− counterparts.
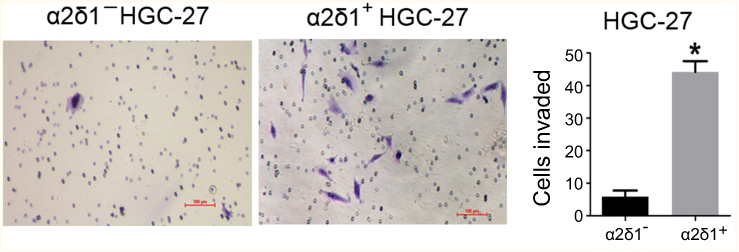 | Figure 3 α2δ1+ HGC-27 cells presented more significant invasiveness than α2δ1− HGC-27 cells. Comparison of invasiveness of α2δ1+ and α2δ1− HGC-27 cells using the transwell assays. The purified α2δ1+ and α2δ1− HGC-27 cells were cultured separately in the transwell chambers for 24 hrs. The cells that had migrated through the membrane were stained and counted. α2δ1+ HGC-27 cells displayed more invasiveness than their α2δ1− counterparts. *p<0.05. |
α2δ1 is more specific than CD44 in defining gastric CSCs
In order to find out the possible relationship between α2δ1 and the conventional GCSC marker CD44, we analyzed the expression of α2δ1 and CD44 in the nine gastric cancer cell lines mentioned above using flow cytometry. As shown in Figure 4A and B, unlike the differential expression of α2δ1, CD44 was found highly expressed in eight of the nine tested cell lines, and the percentage of CD44+ fraction of those cell lines accounts for >90%. Interestingly, further analysis showed the α2δ1+ fraction of those cell lines accounts for a small part of the CD44+ fraction. This led us to propose that α2δ1 might be more specific than CD44 in defining GCSC population.
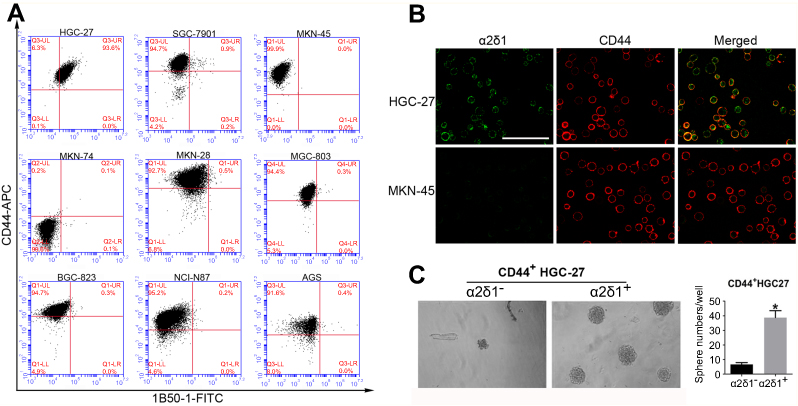 | Figure 4 α2δ1 is more specific than CD44 in identifying gastric cancer stem cells. (A) Coexpression analysis of α2δ1 and CD44 in gastric cancer cell lines by flow cytometry. α2δ1+ cells account for a fraction of CD44+ cells. (B) Coexpression analysis of α2δ1 and CD44 in HGC-27 and MKN-45 cell lines by confocal microscope. (C) Comparison of sphere-formation frequency of purified α2δ1+CD44+ and α2δ1−CD44+ HGC-27 cells in vitro. α2δ1+CD44+ cells displayed significantly higher sphere-forming capacity compared with their α2δ1−CD44+ counterparts. *p<0.05.Abbreviations: FITC, fluorescein isothiocyanate; APC, allophycocyanin. |
In an initial attempt to test our hypothesis, we performed sphere-formation assays in vitro and compared the sphere-forming capacity of purified CD44+ α2δ1+ fraction and CD44+ α2δ1− fraction of HGC-27 (Figure 4C). Sphere-formation assays showed CD44+ α2δ1+ cells displayed significantly higher sphere-forming capacity compared to their CD44+ α2δ1− counterparts. Furthermore, the descendant generations of CD44+ α2δ1+ cells showed similarly high sphere-forming capacity after subsequent serial propagations.
Knockdown of α2δ1 in α2δ1+ gastric cancer cells inhibits the CSC capacity
To further explore the correlation between α2δ1 and CSC properties in gastric cancer, we sorted α2δ1+ cells from HGC-27 cell line by FACS. Then, we performed RNAi experiments using the purified α2δ1+ HGC-27 cells to knock down α2δ1 and evaluated the subsequent effects. Western blot analysis was used to validate that α2δ1 expression was significantly reduced while CD44 expression remained unchanged at high level, as shown in Figure 5A. Then, we compared the sphere-formation frequency and the tumor-formation frequency of α2δ1 knocked-down HGC-27 cells and α2δ1+ HGC-27 cells. The results showed that both of the sphere-formation capacity in vitro and the tumorigenic capacity in vivo were significantly inhibited in HGC-27 cells after α2δ1 knockdown, indicating the decreased self-renewal property, as shown in Figure 5B, C, and Table 5.
 | Table 5 The tumorigenic capacity of α2δ1+ HGC-27 cells are inhibited after α2δ1 knockdown |
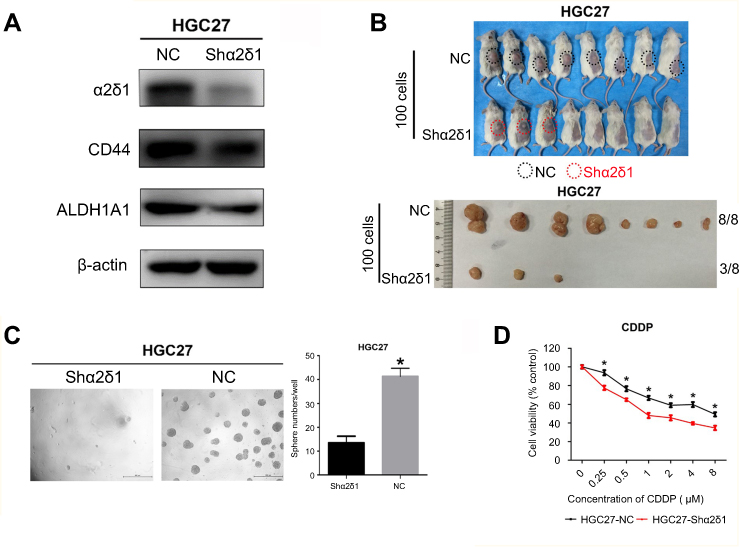 | Figure 5 Knockdown of α2δ1 inhibited cancer stem cell properties of α2δ1+ HGC-27 cells. (A) Western blotting showed the difference of α2δ1, CD44 and ALDH expression between unmediated α2δ1+ HGC-27 cells (NC) and shα2δ1 HGC-27 cells. α2δ1 was confirmed downregulated in shα2δ1 HGC-27 cells, while CD44 and ALDH remained at the same level. (B) Comparison of tumor-formation frequency of unmediated α2δ1+ HGC-27 cells (NC) and shα2δ1 HGC-27 cells in NOD/SCID mice. The tumorigenic capacity was significantly inhibited after α2δ1 was knocked down. (C) Comparison of sphere-formation frequency of unmediated α2δ1+ HGC-27 cells (NC) and shα2δ1 HGC-27 cells in vitro. The sphere-formation capacity was significantly inhibited after α2δ1 was knocked down. (D) Comparison of IC50 between unmediated α2δ1+ HGC-27 cells (black) and shα2δ1 HGC-27 cells (red) when treated with cisplatin. *p<0.05.Abbreviation: NC, negative control; CDDP, cisplatin. |
In addition, we treated α2δ1 knockdown HGC-27 cells and α2δ1+ HGC-27 cells with cytotoxic drug cisplatin separately and evaluated their viability with apoptosis assays. As a result, enhanced apoptosis was observed in α2δ1 knockdown HGC-27 cells compared with α2δ1+ HGC-27 cells when treated with cisplatin at the same concentration, indicating that α2δ1 knockdown rendered α2δ1+ HGC-27 cells more sensitive to cisplatin, as shown in Figure 5D.
Discussion
There is now accumulating evidence supporting the existence of CSC in various types of tumors including gastric cancer.5,23–29 In our current study, we are the first to analyze the expression of α2δ1 in gastric cancer cell lines, PDX models and clinical samples of malignant ascites from gastric cancer patients, and further investigate the relationship between α2δ1 and GCSC. We find out for the first time that the expression level of α2δ1 varies drastically in gastric cancer and that the α2δ1+ subpopulation of gastric cancer cells possessed CSC properties. Moreover, through comparison of the different biological characteristics of CD44+ α2δ1+ and CD44+ α2δ1− cells, we find that α2δ1 is more specific than CD44 in identifying GCSC.
α2δ1 is a subunit of the voltage-dependent calcium channel complex expressed on cell membrane. It has been verified in other studies that α2δ1 could be used to identify subpopulations of cancer cells with CSC properties in HCC and SCLC.18,19 In our current research, we sorted α2δ1+ and α2δ1− cells from HGC-27 and SGC-7901 cell lines using FACS and compared their sphere-formation capacity in vitro and tumorigenic capacities in vivo. Our results showed that α2δ1+ subpopulation of gastric cancer cells demonstrated both significantly high efficiency of sphere formation in vitro and high efficiency of tumor formation in vivo, whereas α2δ1− cells formed sphere or tumors at extremely low efficiency under the same condition. In addition, the transwell assay results showed that α2δ1+ HGC-27 cells were much more invasive than α2δ1− HGC-27 cells. These results indicate the level of α2δ1 expression defines a subpopulation of gastric cancer cells demonstrating both highly tumorigenic capacity and invasiveness, which are two of the reported key properties of CSC.30,31 It is notable that the sphere-formation capacity and tumorigenic capacity of α2δ1+ cells expanded in subsequent propagation in vitro and serial transplantation in vivo, demonstrating self-renewal property both in vitro and in vivo, which has been established as a golden standard in identifying CSC.29,32,33 Moreover, knockdown of α2δ1 in α2δ1+ HGC-27 cells led to drastically decreased efficiency of sphere formation or tumor formation, further indicating that the expression of α2δ1 is closely correlated with CSC properties.
Another important property of CSC is the differentiation capacity. Previous studies have demonstrated that CSCs undergo symmetric division to maintain the CSC population while at the same time undergo asymmetric division into non-CSC to expand the bulk of tumor, but non-CSC seldom differentiate into CSC.29,34,35 Our results showed that after being cultured in vitro in RPMI-1640 supplemented with 10% FBS, purified α2δ1+ cells from HGC-27 and SGC-7901 cell lines gave rise to both α2δ1+ and α2δ1− descendant cells, but not vice versa. This is consistent with the differentiation capacity of CSC.
Taken together, our results above confirmed that α2δ1 expression defines a subpopulation of cancer cells with CSC properties in gastric cancer and could be used as a biomarker for identifying GCSC.
A number of molecules have been reported by previous researches as suitable markers for identifying GCSC, including CD44/CD44v, CD133, ALDH, Sca-1, Lgr5, MIST-1 and Bmi-1.5–15 However, there have been concerns about the specificity of these reported GCSC markers. Therefore, it is necessary to seek additional marker or combined panels of markers that may improve the accuracy of identifying GCSC. In our current study, we analyzed the coexpression of α2δ1 and CD44 simultaneously and found that α2δ1+ gastric cancer cells accounted for a subpopulation of CD44+ gastric cancer cells. Further results of sphere-formation assays showed that CD44+ α2δ1+ HGC-27 cells formed sphere with significantly higher efficiency than their CD44+ α2δ1− counterpart, indicating that the α2δ1+ subset of cells might be responsible for the sphere-formation capacity and CSC properties of the CD44+ gastric cancer cells. This suggests that α2δ1 might be a better and more specific marker than CD44 in identifying GCSCs, or α2δ1 in combination with CD44 could be used to improve the accuracy in identifying GCSC populations.
In previous studies, the therapeutic potential of a new monoclonal antibody 1B50-1 generated by Zhao et al, which recognized the isoform 5 of α2δ1 subunit, had been demonstrated on HCC.18 Zhao et al demonstrated that treatment of 1B50-1mAb or silencing of α2δ1 reduced the CSC properties of HCC cells via induction of cellular apoptosis. Moreover, compared with treatment of chemotherapy alone, treatment of 1B50-1mAb combined with doxorubicin led to more significant tumor reduction in HCC PDX models.18 In another study, Yu et al reported that the combined treatment of 1B50-1mAb and chemotherapy resulted in partial response in originally chemoresistant SCLC PDX model.19 These studies suggest α2δ1 could be a potential target for novel anticancer therapy targeting CSC. In our research, we evaluated the effect of α2δ1 knockdown in α2δ1+ HGC-27 cells. The results showed that the α2δ1 knockdown in α2δ1+ HGC-27 led to significantly decreased sphere-forming capacity and tumorigenic capacity, indicating an inhibition of CSC properties. Moreover, α2δ1 knockdown rendered HGC-27 cells more sensitive to cisplatin in vitro, suggesting that α2δ1 knockdown might mimic the effect of 1B50-1mAb binding and improve the therapeutic effect of chemotherapy in gastric cancer cells.
One of the limitations of our current study is that the analysis and assays mainly focused on gastric cancer cells. Further experiments with clinical samples may provide a more comprehensive view of the actual function of GCSC in patients. Moreover, further explorations into the molecular mechanism of α2δ1 in regulating CSC properties may provide a deeper understanding of how α2δ1 participate in tumor initiation, metastasis, chemoresistance and relapse of gastric cancer. Expansion of the size of clinical samples may also provide additional information about the possible clinical significance of α2δ1 in gastric cancer.
Conclusion
Our current study was the first to confirm that α2δ1+ gastric cancer cells possessed CSC properties and that α2δ1 could be used as a marker for identifying GCSC with higher specificity than CD44. The combination of α2δ1 and CD44 could be used to identify GCSC more accurately. Knockdown of α2δ1 sensitized HGC-27 cells to cisplatin, suggesting α2δ1 might be a potential target for anticancer treatment.
Acknowledgments
We thank Huirong Ding, Zhihua Tian and Lina Wu from the Central Laboratory, Key Laboratory of Carcinogenesis and Translational Research (Ministry of Education), Beijing Cancer Hospital and Institute for their technical assistance.
Disclosure
The authors report no conflicts of interest in this work.
References
1. Wagner AD, Syn NL, Moehler M, et al. Chemotherapy for advanced gastric cancer. Cochrane Database Syst Rev. 2017;8:CD004064.
2. Guggenheim DE, Shah MA. Gastric cancer epidemiology and risk factors. J Surg Oncol. 2013;107(3):230–236. doi:10.1002/jso.23262
3. Van Cutsem E, Sagaert X, Topal B, Haustermans K, Prenen H. Gastric cancer. Lancet. 2016;388(10060):2654–2664. doi:10.1016/S0140-6736(16)30354-3
4. Pattabiraman DR, Weinberg RA. Tackling the cancer stem cells - what challenges do they pose? Nat Rev Drug Discov. 2014;13(7):497–512. doi:10.1038/nrd4253
5. Takaishi S, Okumura T, Tu S, et al. Identification of gastric cancer stem cells using the cell surface marker CD44. Stem Cells. 2009;27(5):1006–1020. doi:10.1002/stem.30
6. Qiao XT, Ziel JW, McKimpson W, et al. Prospective identification of a multilineage progenitor in murine stomach epithelium. Gastroenterology. 2007;133(6):1989–1998. doi:10.1053/j.gastro.2007.09.031
7. Richard V, Nair MG, Santhosh Kumar TR, Pillai MR. Side population cells as prototype of chemoresistant, tumor-initiating cells. Biomed Res Int. 2013;2013:517237. Epub 2013 Nov 4. doi:10.1155/2013/517237.
8. Siddique HR, Saleem M. Role of BMI1, a stem cell factor, in cancer recurrence and chemoresistance: preclinical and clinical evidences. Stem Cells. 2012;30(3):372–378. doi:10.1002/stem.1035
9. Varga J, Greten FR. Lifting the mist on gastric stem cells. Cell Stem Cell. 2016;18(1):7–9. doi:10.1016/j.stem.2015.12.008
10. Leushacke M, Tan SH, Wong A, et al. Lgr5-expressing chief cells drive epithelial regeneration and cancer in the oxyntic stomach. Nat Cell Biol. 2017;19(7):774–786. doi:10.1038/ncb3450
11. Zhao Y, Feng F, Zhou YN. Stem cells in gastric cancer. World J Gastroenterol. 2015;21(1):112–123. doi:10.3748/wjg.v21.i1.112
12. Park JW, Park JM, Park DM, Kim DY, Kim HK. Stem cells antigen-1 enriches for a cancer stem cell-like subpopulation in mouse gastric cancer. Stem Cells. 2016;34(5):1177–1187. doi:10.1053/j.gastro.2007.09.031
13. Rassouli FB, Matin MM, Saeinasab M. Cancer stem cells in human digestive tract malignancies. Tumour Biol. 2016;37(1):7–21. doi:10.1007/s13277-015-4155-y
14. Hoffmann W. Current status on stem cells and cancers of the gastric epithelium. Int J Mol Sci. 2015;16(8):19153–19169. doi:10.3390/ijms160819153
15. Nguyen PH, Giraud J, Chambonnier L, et al. Characterization of biomarkers of tumorigenic and chemoresistant cancer stem cells in human gastric carcinoma. Clin Cancer Res. 2017;23(6):1586–1597. doi:10.1158/1078-0432.CCR-15-2157
16. Qiao XT, Gumucio D. Current molecular markers for gastric progenitor cells and gastric cancer stem cells. J Gastroenterol. 2011;46(7):855–865. doi:10.1007/s00535-011-0413-y
17. Wang T, Shigdar S, Gantier MP, et al. Cancer stem cell targeted therapy: progress amid controversies. Oncotarget. 2015;6(42):44191–44206.
18. Zhao W, Wang L, Han H, et al. 1B50-1, a mAb raised against recurrent tumor cells, targets liver tumor-initiating cells by binding to the calcium channel α2δ1 subunit. Cancer Cell. 2013;23(4):541–556. doi:10.1016/j.ccr.2013.02.025
19. Yu J, Wang S, Zhao W, et al. Mechanistic exploration of cancer stem cell marker voltage-dependent calcium channel α2δ1 subunit-mediated chemotherapy resistance in small-cell lung cancer. Clin Cancer Res. 2018;24(9):2148–2158. doi:10.1158/1078-0432.CCR-17-1932
20. Akagi T, Kimoto T. Human cell line (HGC-27) derived from the metastatic lymph node of gastric cancer. Acta Med Okayama. 1976;30(3):215–219.
21. Zhu Y, Tian T, Li Z, et al. Establishment and characterization of patient-derived tumor xenograft using gastroscopic biopsies in gastric cancer. Sci Rep. 2015;5:8542. doi:10.1038/srep08542
22. Singh SR. Gastric cancer stem cells: a novel therapeutic target. Cancer Lett. 2013;338(1):110–119. doi:10.1016/j.canlet.2013.03.034
23. Clarke MF, Dick JE, Dirks PB, et al. Cancer stem cells–perspectives on current status and future directions: AACR workshop on cancer stem cells. Cancer Res. 2006;66(19):9339–9344. Epub 2006 Sep 21. doi:10.1158/0008-5472.CAN-06-3126.
24. Chiba T, Miyagi S, Saraya A, et al. The polycomb gene product BMI1 contributes to the maintenance of tumor-initiating side population cells in hepatocellular carcinoma. Cancer Res. 2008;68(19):7742–7749. doi:10.1158/0008-5472.CAN-07-5882
25. Bonnet D, Dick JE. Human acute myeloid leukemia is organized as a hierarchy that originates from a primitive hematopoietic cell. Nat Med. 1997;3(7):730–737.
26. Zeppernick F, Ahmadi R, Campos B, et al. Stem cell marker CD133 affects clinical outcome in glioma patients. Clin Cancer Res. 2008;14(1):123–129. doi:10.1158/1078-0432.CCR-07-0932
27. Cao L, Zhou Y, Zhai B, et al. Sphere-forming cell subpopulations with cancer stem cell properties in human hepatoma cell lines. BMC Gastroenterol. 2011;11:71. doi:10.1186/1471-230X-11-93
28. Lv C, Li F, Li X, et al. MiR-31 promotes mammary stem cell expansion and breast tumorigenesis by suppressing Wnt signaling antagonists. Nat Commun. 2017;8(1):1036. doi:10.1038/s41467-017-01059-5
29. de Sousa e Melo F, Av K, Jm H, et al. A distinct role for Lgr5+ stem cells in primary and metastatic colon cancer. Nature. 2017;543(7647):676–680. doi:10.1038/nature21713
30. Batlle E, Clevers H. Cancer stem cells revisited. Nat Med. 2017;23(10):1124–1134. doi:10.1038/nm.4265
31. Talukdar S, Emdad L, Das SK, Sarkar D, Fisher PB. Evolving strategies for therapeutically targeting cancer stem cells. Adv Cancer Res. 2016;131:159–191.
32. Singh SK, Clarke ID, Terasaki M. Identification of a cancer stem cell in human brain tumors. Cancer Res. 2003;63(18):5821–5828.
33. Hansford LM, McKee AE, Zhang L, et al. Neuroblastoma cells isolated from bone marrow metastases contain a naturally enriched tumor-initiating cell. Cancer Res. 2007;67(23):11234–11243. doi:10.1158/0008-5472.CAN-07-0718
34. Yan Y, Zuo X, Wei D. Concise review: emerging role of CD44 in cancer stem cells: a promising biomarker and therapeutic target. Stem Cells Transl Med. 2015;4(9):1033–1043. doi:10.5966/sctm.2015-0048
35. Rosen JM, Jordan CT. The increasing complexity of the cancer stem cell paradigm. Science. 2009;324(5935):1670–1673. doi:10.1126/science.1171837
36. Hu Y, Smyth GK. ELDA: extreme limiting dilution analysis for comparing depleted and enriched populations in stem cell and other assays. J Immunol Methods. 2009;347(1–2):70–78. doi:10.1016/j.jim.2009.06.008
Supplementary material
 | Table S1 α2δ1+ HGC-27 cells displayed significant tumorigenic capacity after subsequent transplantation |
 © 2019 The Author(s). This work is published and licensed by Dove Medical Press Limited. The
full terms of this license are available at https://www.dovepress.com/terms
and incorporate the Creative Commons Attribution
- Non Commercial (unported, 3.0) License.
By accessing the work you hereby accept the Terms. Non-commercial uses of the work are permitted
without any further permission from Dove Medical Press Limited, provided the work is properly
attributed. For permission for commercial use of this work, please see paragraphs 4.2 and 5 of our Terms.
© 2019 The Author(s). This work is published and licensed by Dove Medical Press Limited. The
full terms of this license are available at https://www.dovepress.com/terms
and incorporate the Creative Commons Attribution
- Non Commercial (unported, 3.0) License.
By accessing the work you hereby accept the Terms. Non-commercial uses of the work are permitted
without any further permission from Dove Medical Press Limited, provided the work is properly
attributed. For permission for commercial use of this work, please see paragraphs 4.2 and 5 of our Terms.