")
Back to Journals » Journal of Hepatocellular Carcinoma » Volume 9
Vitamin B6 Metabolic Pathway is Involved in the Pathogenesis of Liver Diseases via Multi-Omics Analysis
Authors Mei M, Liu D, Tang X, You Y, Peng B, He X, Huang J
Received 20 April 2022
Accepted for publication 4 August 2022
Published 11 August 2022 Volume 2022:9 Pages 729—750
DOI https://doi.org/10.2147/JHC.S370255
Checked for plagiarism Yes
Review by Single anonymous peer review
Peer reviewer comments 2
Editor who approved publication: Dr Ahmed Kaseb
Meihua Mei,1– 4,* Danping Liu,1– 4,* Xiuxin Tang,1– 4,* Ying You,1– 4 Baogang Peng,5 Xiaoshun He,1– 3 Junqi Huang1– 4
1Organ Transplant Center, the First Affiliated Hospital, Sun Yat-sen University, Guangzhou, 510080, People’s Republic of China; 2Guangdong Provincial Key Laboratory of Organ Donation & Transplant Immunology, Guangzhou, 510080, People’s Republic of China; 3Guangdong Provincial International Cooperation Base of Science & Technology (Organ Transplantation), Guangzhou, 510080, People’s Republic of China; 4Department of Laboratory Medicine, the First Affiliated Hospital, Sun Yat-sen University, Guangzhou, 510080, People’s Republic of China; 5Hepatobiliary Surgery, the First Affiliated Hospital, Sun Yat-sen University, Guangzhou, 510080, People’s Republic of China
*These authors contributed equally to this work
Correspondence: Junqi Huang, The First Affiliated Hospital, Sun Yat-sen University, No. 58, Zhong Shan Er Lu, Guangzhou, 510080, People’s Republic of China, Tel +86 (20) 28823388 ext. 8670, Email [email protected]
Purpose: To clarify the underlying regulatory mechanisms of progression from liver cirrhosis to hepatocellular carcinoma (HCC), we analyzed the microbiomics, metabolomics, and proteomics in plasma and tissues from patients with HCC or decompensated liver cirrhosis (DC).
Patients and Methods: Tissues and plasma from 44 HCC patients and 28 patients with DC were collected for metabolomic analysis. 16S rRNA sequencing was performed in nine HCC tissues (HCCT), four distal noncancerous tissues (HCCN), and 11 DC tissues (DCT). Five HCC tissues had liver cirrhosis (HCCT-LC). Five hepatocellular carcinoma tissues without liver cirrhosis (HCCT-NLC) and five DCT were selected for proteomic sequencing. After combining proteomic and metabolomic analysis, we constructed a mouse model of chronic liver injury using carbon tetrachloride (CCl4) and treated them with vitamin B6 (VB6).
Results: 16s rRNA sequence results showed that HCC tissues had higher alpha diversity. The highest LDA scores were detected for Elizabethkingia in HCCT, Subsaxibacter in DCT, and Stenotrophomon in HCCN. Metabolomics results demonstrated some metabolites, including capric acid, L-threonate, choline, alpha-D-Glucose, D-ribose, betaine, 2E-eicosenoic acid, linoleic acid, L-palmitoylcarnitine, taurodeoxycholic acid, L-pyroglutamic acid, androsterone sulfate, and phthalic acid mono-2-ethylhexyl ester (MEHP), had better diagnostic efficacy than AFP (AUC: 0.852; 95% CI: 0.749, 0.954). In a combined analysis of metabolomics and proteomics, we found that HCCT-LC had more obvious disorders of VB6 metabolism and pentose and glucuronate interconversions than DCT, and kynurenine metabolism disorder was more significant in HCCT-LC than in HCCT-NLC. In the CCl4-induced chronic liver injury model, after VB6 supplementation, inflammatory cell infiltration, hepatocyte edema, and degeneration were significantly improved.
Conclusion: We found significant differences in the flora distribution between HCCT and DC; MEHP was a new diagnostic biomarker of HCC, and VB6 ameliorated the inflammatory cell infiltration, hepatocyte edema, and degeneration in chronic liver injury.
Keywords: hepatocellular carcinoma, cirrhosis, proteomics, metabolomics, microbiomics, vitamin B6
Introduction
In 2020, primary liver cancer will be the sixth most common cancer and the third leading cause of worldwide cancer death, with more than 900,000 new cases and about 830,000 deaths annually. Also, the rates of new cases and deaths from hepatocellular carcinoma (HCC) in China rank first globally.1 HCC is characterized by a high degree of malignancy, rapid growth, easy metastasis, and poor prognosis.2 Patients with HCC had a low 5-year survival rate of less than 60%.3 There are many treatment methods for HCC, including surgery, chemotherapy, radiotherapy, and molecular targeted therapy.3 But patients are often diagnosed at an advanced stage because of the lack of early biomarkers. Therefore, there is an urgent to discover novel biomarkers for screening HCC and liver cancer progression mechanisms.
It is well acknowledged that cirrhosis is a risk factor for HCC;4 around 90% of HCC cases develop in a background of cirrhosis,5 and accumulating evidence also suggests that there are differences in gut microbiota between patients with cirrhosis and HCC,6 in which bacterial fragments may affect hepatic metabolism, immunity, and inflammatory processes.7 However, there is a lack of studies on bacterial metataxonomic signatures for HCC and cirrhosis tissues. Sookoian et al8 completed a bacterial metataxonomic profiles analysis of liver tissue in two cohorts of patients with non-alcoholic fatty liver disease by 16s rRNA sequence and found that Proteobacteria, especially Gamma class, was increased in the severe obesity, and Proteobacteria and Deinococcus-Thermus were predominant in moderate obesity. Therefore, we performed a combined microbiomics, metabolomics, and proteomics analysis in HCC tissues (HCCT), distal noncancerous tissues (HCCN), and decompensated cirrhosis tissues (DCT) to identify the early diagnostic markers of HCC and the mechanism of liver cancer progression.
LS/MS metabolomics primarily uses high-throughput analytical techniques to identify, quantify, and characterize small molecular metabolites of substrates and products of various metabolic pathways in biological systems, which contributes to the discovery of tumor-related metabolic markers.9,10 There are accumulating studies reporting serum metabolic markers for the diagnosis of HCC.11–13 For instance, a serum metabolite biomarker panel including phenylalanyl-tryptophan and glycocholate had a higher diagnostic performance than a-fetoprotein (AFP) in differentiating HCC from a high-risk population of cirrhosis.11 However, like the intrahepatic bacterial metataxonomic signature in HCC, there is a lack of combined analysis of metabolomics and proteomics aimed at liver tissue.
The proteome is downstream of the genome and transcriptome, and thus it is more strongly associated with the final metabolomic phenotype.14 In our study, after 16S rRNA sequencing, we performed metabolomics in the plasma of healthy adult volunteers and combined metabolomic and proteomic analysis in HCCT and DCT. We found VB6 metabolism, pentose, and glucuronate interconversions disorders in HCC. Therefore, our research may provide new insights into the monitoring and treatment of HCC related to liver cirrhosis.
Material and Methods
In this study, two cohorts of patients were analyzed. The HCC group included 44 patients with HCC; the DC group consisted of 28 cirrhosis patients, both of which were diagnosed at the First Affiliated Hospital, Sun Yat-sen University, between January 2018 and December 2019. HCCN was collected from the distal edge of the resected tissues, which were more than 2 cm from the border of the solid tumor. Detailed clinical information about the collected samples is presented in Table 1. HCC was diagnosed based on typical contrast patterns revealed by contrast-enhanced computed tomography, contrast-enhanced Magnetic Resonance Imaging or angiography, or histopathological diagnosis. The research process of this study is shown in Figure 1. Informed consent to participate in research was obtained. This study was approved by the Ethics Committee of the First Affiliated Hospital of Sun Yat-sen University and was conducted following the principles of the Declaration of Helsinki.
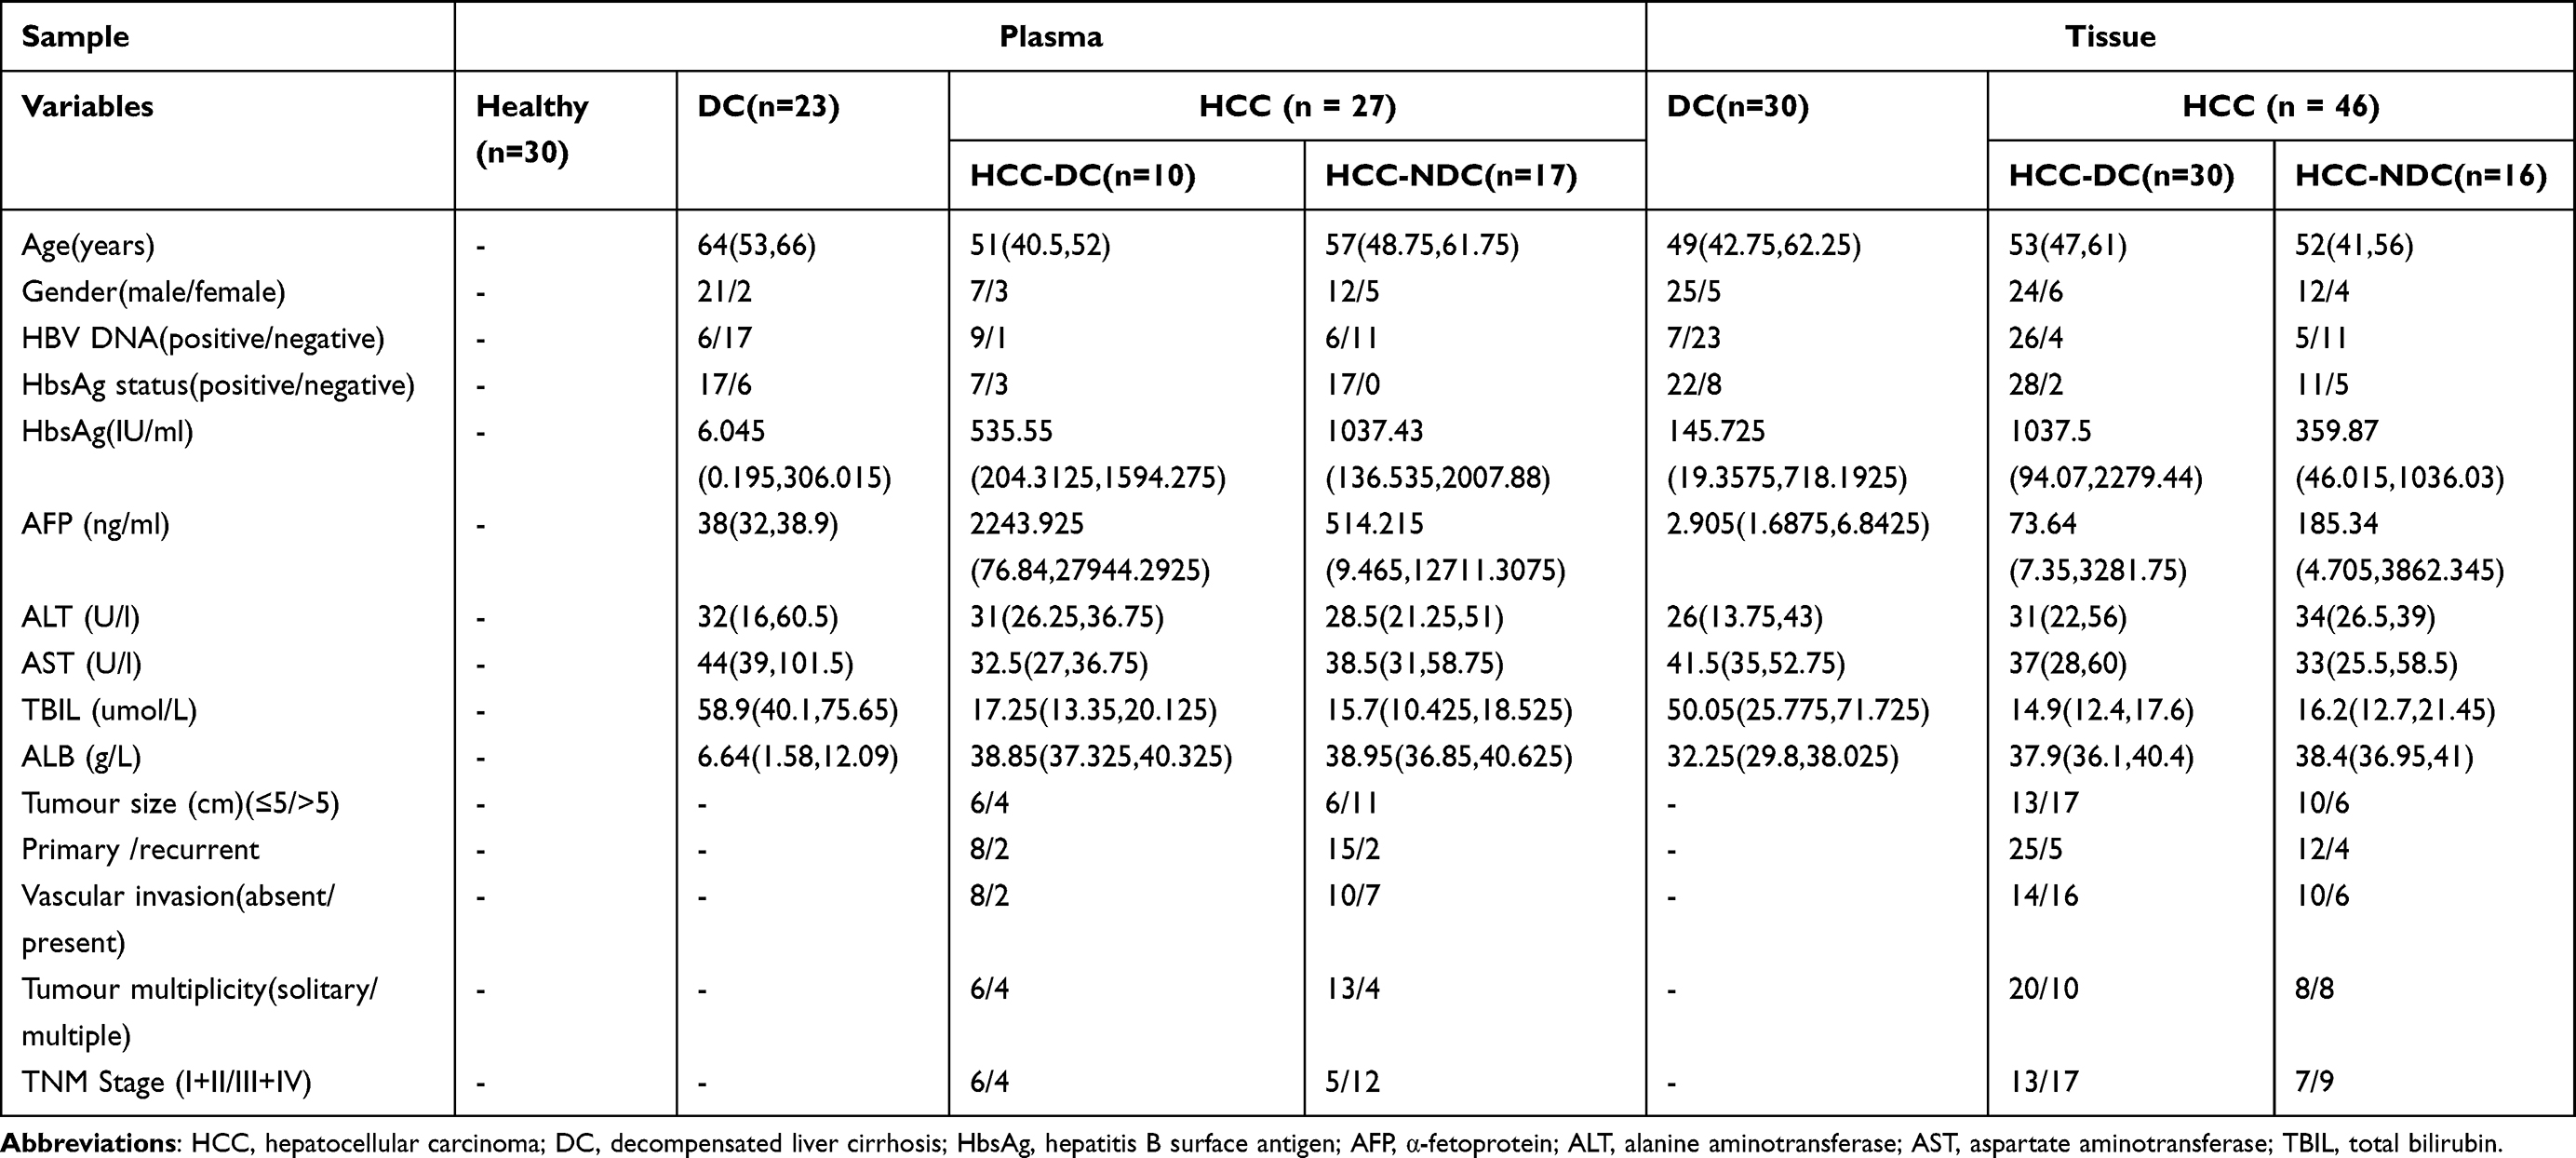 |
Table 1 Clinic Characteristics of the Subjects |
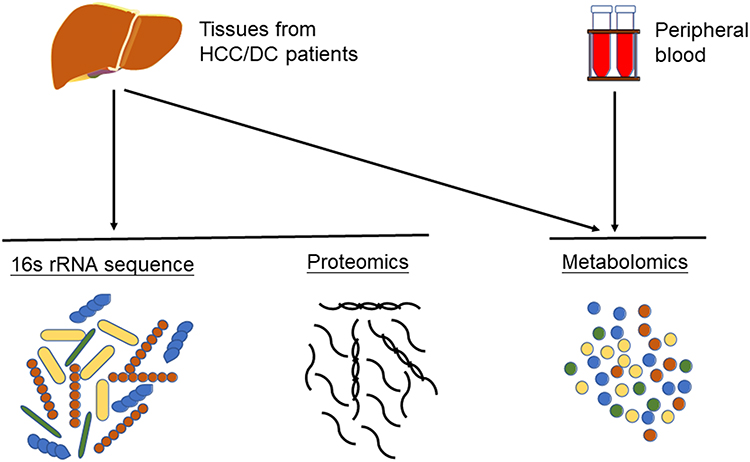 |
Figure 1 The flow chart of our study. Plasma isolated from peripheral blood was used for metabolomics analysis. Hepatocellular carcinoma tissues, normal adjacent tissues and decompensated liver cirrhosis tissues were used for metabolomics analysis, proteomics analysis, and 16S rRNA sequencing. |
Tissue and Plasma Pretreatment
Liver tissues, about 100 mg, were mixed with 1 mL of cold methanol/water (4:1, V: V) and then homogenized using a high-speed blender. After ultrasonication, the sample was placed on the ice for 20 min and then deproteinized by centrifugation at 15,000rpm for 10 min at 4°C. Finally, 800 µL of supernatant was stored at −80°C for further sequencing.
Acetonitrile (400 µL) was added to 100 µL of plasma and vortexed for 1 min. Then, the mixture was centrifuged at 12,000 rpm for 10 min at 4°C. After that, 400 µL supernatant was stored at −80°C for further LC/MS analysis.
16S Ribosomal RNA Gene Amplicon Sequencing
DNA extraction was done using a kit (TIANGEN, DP304-02, China). DNA concentration and purity were checked by the NanoDrop (Thermo Fisher Scientific, MA, USA). 16S rRNA/18SrRNA/ITS genes of distinct regions were amplified using a specific primer (eg, 16S: 338F and 806R/515F and 806R/515F and 907R; 18S: 528F and 706R/817F and 1196R; ITS5-1737F and ITS2-2043R/ITS3-F and ITS4R; Arc: Arch519F and Arch915R et al) with 12bp barcode. Primers were synthesized by Invitrogen (Invitrogen, Carlsbad, CA, USA). PCR reactions were using a PCR kit (Takara Biotechnology, Dalian Co. Ltd., China) and amplified by the PCR instrument (BioRad S1000, CA, USA). After the purification of PCR products, sequencing libraries were constructed on the Illumina MiSeq2500 platform.
Microbiome Data Analysis
Quality filtering on the paired-end raw reads was performed under specific filtering conditions to obtain the high-quality clean reads according to the Trimmomatic (V0.33) quality-controlled process. Paired-end clean reads were merged using FLASH (V1.2.11) according to the relationship of the overlap between the paired-end reads; when at least 10 of the reads overlap the read generated from the opposite end of the same DNA fragment, the maximum allowable error ratio of the overlap region of 0.1, and the spliced sequences were called Raw Tags. Sequences were assigned to each sample according to their unique barcode and primer using Mothur software (V1.35.1), after which the barcodes and primers were removed and got the effective Clean Tags. Sequences with ≥ 97% similarity were assigned to the same OTU. OTU abundance information was normalized using a standard sequence number corresponding to the sample with the least sequences. Subsequent alpha and beta diversity analyses were performed based on this output normalized data.
To assess community richness and diversity, alpha diversity, including Observed species, Chao1, Shannon, Simpson, dominance, and PD whole tree, was applied in analyzing the complexity of species diversity for a sample. β-diversity evaluates divergences among microbial communities via measuring the distance matrix of dissimilarity. Principal components analysis (PCA) was performed to access variance among different groups. The LEfSe pipeline was used to differentially identify microbes that distinguish HCCT from DC and HCCN. The significant taxa (from phylum to genus) with linear discriminant analysis (LDA) score >2.0 indicative of dominant relative abundance was demonstrated in the stacking diagram, and the taxa at the genus level were shown in the heat map. Then, the correlation coefficients among the microbes in the matrix were calculated with the Pearson algorithm. The data in our samples were calculated with QIIME (V1.9.1) and displayed with R software (V3.6.1).
Metabolomic Data Analysis
The original UPLC-Q-TOF/MS data were converted to mzXML format via ProteoWizard, and the XCMS program was then used for peak alignment, retention time adjustment, and peak area extraction. Accurate mass matching (< 25 ppm) and secondary spectrogram matching were used to identify metabolite structures, which should be retrieved and compared with the laboratory database (Shanghai Applied Protein Technology, Shanghai, China.). The identified metabolites both met the variable importance in the projection (VIP) > 1 and P < 0.05 (Student’s t-test). The heat plot was performed by Hiplot (https://hiplot.com.cn/). The metabolic pathways of important distinguished metabolites are used in the Kyoto Encyclopedia of Genes and Genomes (KEGG) database.
Proteomic Analysis
After peptides were labeled by iTRAQ and LC-MS/MS analysis, the MS raw data for each sample was searched using the MASCOT engine embedded into Proteome Discoverer 1.4 software for identification and quantitative analysis. Cluster 3.0 and Java Treeview software were used to perform hierarchical clustering analysis. The Euclidean distance algorithm for similarity measure and average linkage clustering algorithm for clustering were selected when performing hierarchical clustering. A Venn diagram and bar plot were drawn. A heat map was often presented as a visual aid in addition to the dendrogram. GO annotation: The protein sequences of the selected proteins that were differentially expressed were locally searched using the NCBI BLAST+ client software and InterProScan to find homolog sequences, then gene ontology terms were mapped, and sequences were annotated using the software program Blast2GO. The GO annotation results were plotted by R scripts. KEGG annotation: Following annotation steps, the studied proteins were blasted against the online KEGG database to retrieve their KEGG orthology identifications and were subsequently mapped to pathways in KEGG Enrichment analysis. Enrichment analysis was applied based on Fisher’s exact test, considering the whole quantified proteins as a background dataset. The Benjamini-Hochberg correction for multiple testing was further applied to adjust derived p-values. And only functional categories and pathways with p-values under a threshold of 0.05 were considered significant.
Combined Analysis of Proteomics and Metabolomics
All differentially expressed proteins/modified peptides/genes and metabolites were queried and mapped to pathways with the online KEGG. R Version 3.6.1 combined the KEGG annotation and enrichment results of the two omics. A Venn diagram and bar plot were drawn. Z-score normalization was performed on the quantitative data of the target differentially modified peptides; then, a heatmap was drawn with R Version 3.6.1 (Distance Matrix Computation: Euclidean, Hierarchical Clustering: complete linkage). Differentially abundant proteins/modified peptides/genes/metabolites/lipids were log2 scaled (TMT/iTRAQ) or Z-score scaled (Label-free) and concatenated into one matrix.
Animal Experiments
Male C57BL/6 mice aged from 6 to 8 weeks (purchased from the Animal Center of the First Affiliated Hospital, Sun Yat-sen University) were provided with free access to food and water at the Animal Center of the First Affiliated Hospital of Sun Yat-sen University. Liver fibrosis was induced by intraperitoneal injection of 20% carbon tetrachloride (CCl4, Macklin, C805327) in corn oil (Sigma-Aldrich, 230,230) at 5 µL·g−1 of body weight twice per week.15 The VB6 (YuanYe, S13026-100g) was dissolved in normal saline; the concentration was 0.05mg/mL, and the dose was 0.025 mg/day/animal by intraperitoneal injection. After 6 weeks of administration of CCl4 or CCl4 combined with VB6, the blood and livers were harvested and analyzed. All procedures were approved by the Sun Yat-sen University Institutional Animal Care and Use Committee guidelines.
Statistical Analysis
Results are expressed as the mean ± standard error of the mean (SEM). The Student’s t-test was used to compare two groups of data. One-way analysis of variance followed by Dunnett’s test was used to compare data in three groups. P<0.05 was considered to be statistically significant.
Results
Tissue Microbiomics
16S rRNA sequencing was performed in nine HCCT, four HCCN, and 11 DCT. Overall, microorganisms in the phylum level were concentrated in p_Acidobacteria, p_Actinobacteria, p_Armatimonadetes, p_Bacteroidetes, p_Chloroflexi, p_Cyanobacteria, p_Deinococcus−Thermus, p_Epsilonbacteraeota, and p_Firmicutes (Figure S1A). Relative abundance of microbiota (>10−5) at the phylum to genus level of the cohort is displayed (Figures 2A and S1E-G). When comparing alpha diversity in the cohort HCCT, HCCN, and DCT, HCC tissue presented higher Chao1 richness, observed species, and PD whole-tree (Figure 2B) compared with DCT, indicating that microbiota of HCCT had higher diversity. β-Diversity of the cohort was assessed with partial least squares discriminant analysis (PLS-DA) (Figure S1C).
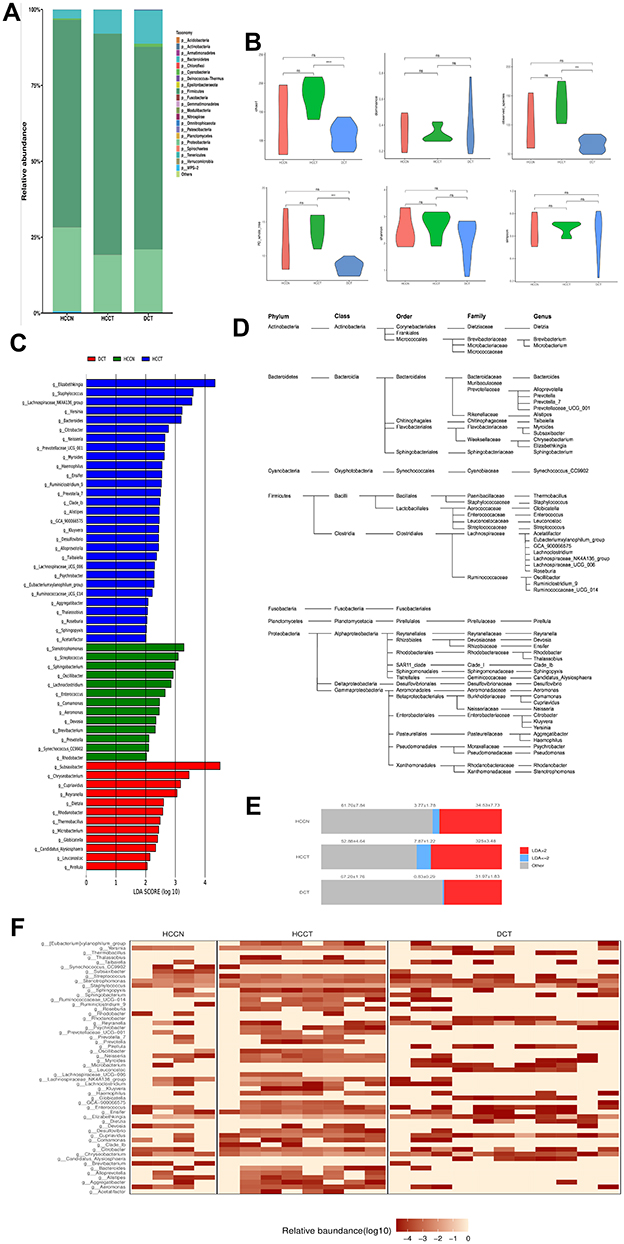 |
Figure 2 Tissue microbiota composition of HCCT, HCCN and DCT. (A) Stacked graph depicting composition of bacterial genera with relative abundance >10−5 in the cohort. (B) Diversity analysis of liver tissue microbiota of the whole cohort. ****P < 0.001; ***P < 0.01; ns, P ≥ 0.05; by one-way analysis of variance (ANOVA). (C) Characteristics of liver tissue microbiota in the cohort were evaluated with LEfSe analysis. Bacterial populations with LDA score >2 are displayed. (D) Phylogenetic classification of bacterial populations with LDA score >2. (E) Frequencies of the tissue bacterial genera according to LDA score. Mean±SE is displayed. (F) Heat map depicting the weight distribution of the 54 genera with LDA score >2. HCCT: hepatocellular carcinoma tissue. Abbreviations: HCCN, distal noncancerous tissue; DCT, decompensated cirrhosis tissues. |
By Spearman correlation analysis, we found close correlations among the tissue commensal bacterial populations at genus levels (Figure S2). To reveal the characteristics of microbiota in the cohort, we performed the linear discriminant analysis effect size (LEfSe) (Figure 2C) and their phylogenetic taxonomy (Figure 2D). The proportion of HCCT 16S rRNA mainly distributed in g_Elizabethking, g_Staphylococcus, g_Lachnospiraceae_NK4A136_group, g_Yersinia, g_Bacteroides, g_Citrobacter, g_Neisseria, g_Prevotellaceae_UCG_001, and g_Myroides, g_Haemophilus. The proportion of DCT 16S rRNA consisted of g_Subsaxibacter, g_Chryseobacterium, g_Cupriavidus, g_Reyranella, g_Dietzia, g_Rhodanobacter, g_Thermobacillus, g_Microbacterium, g_Globicatella, and g_Candidatus_Alysiosphaera (Figure 2E and F). There were obvious differences in the dominant flora among the three groups, and changes in the abundance of different flora may be related to disease progression, which needs further research to confirm.
Metabolic Profiling of Plasma and Tissue
To sift specific metabolites of HCC, we compared the plasma metabolites isolated from peripheral blood of healthy volunteers (normal control, NCB), patients with HCC (HCCB), and decompensated cirrhosis (DCB). There were 51 differential metabolites between HCCB and NCB and 41 differential metabolites between HCCB and DCB (Figure 3A-G and Table 2). Then, we compared the metabolites in the tissues of patients with HCC and cirrhosis. There were 178 differential metabolites between HCCT and DCT and 159 differential metabolites between HCCT and HCCN (Figure 4A-G and Table 3).
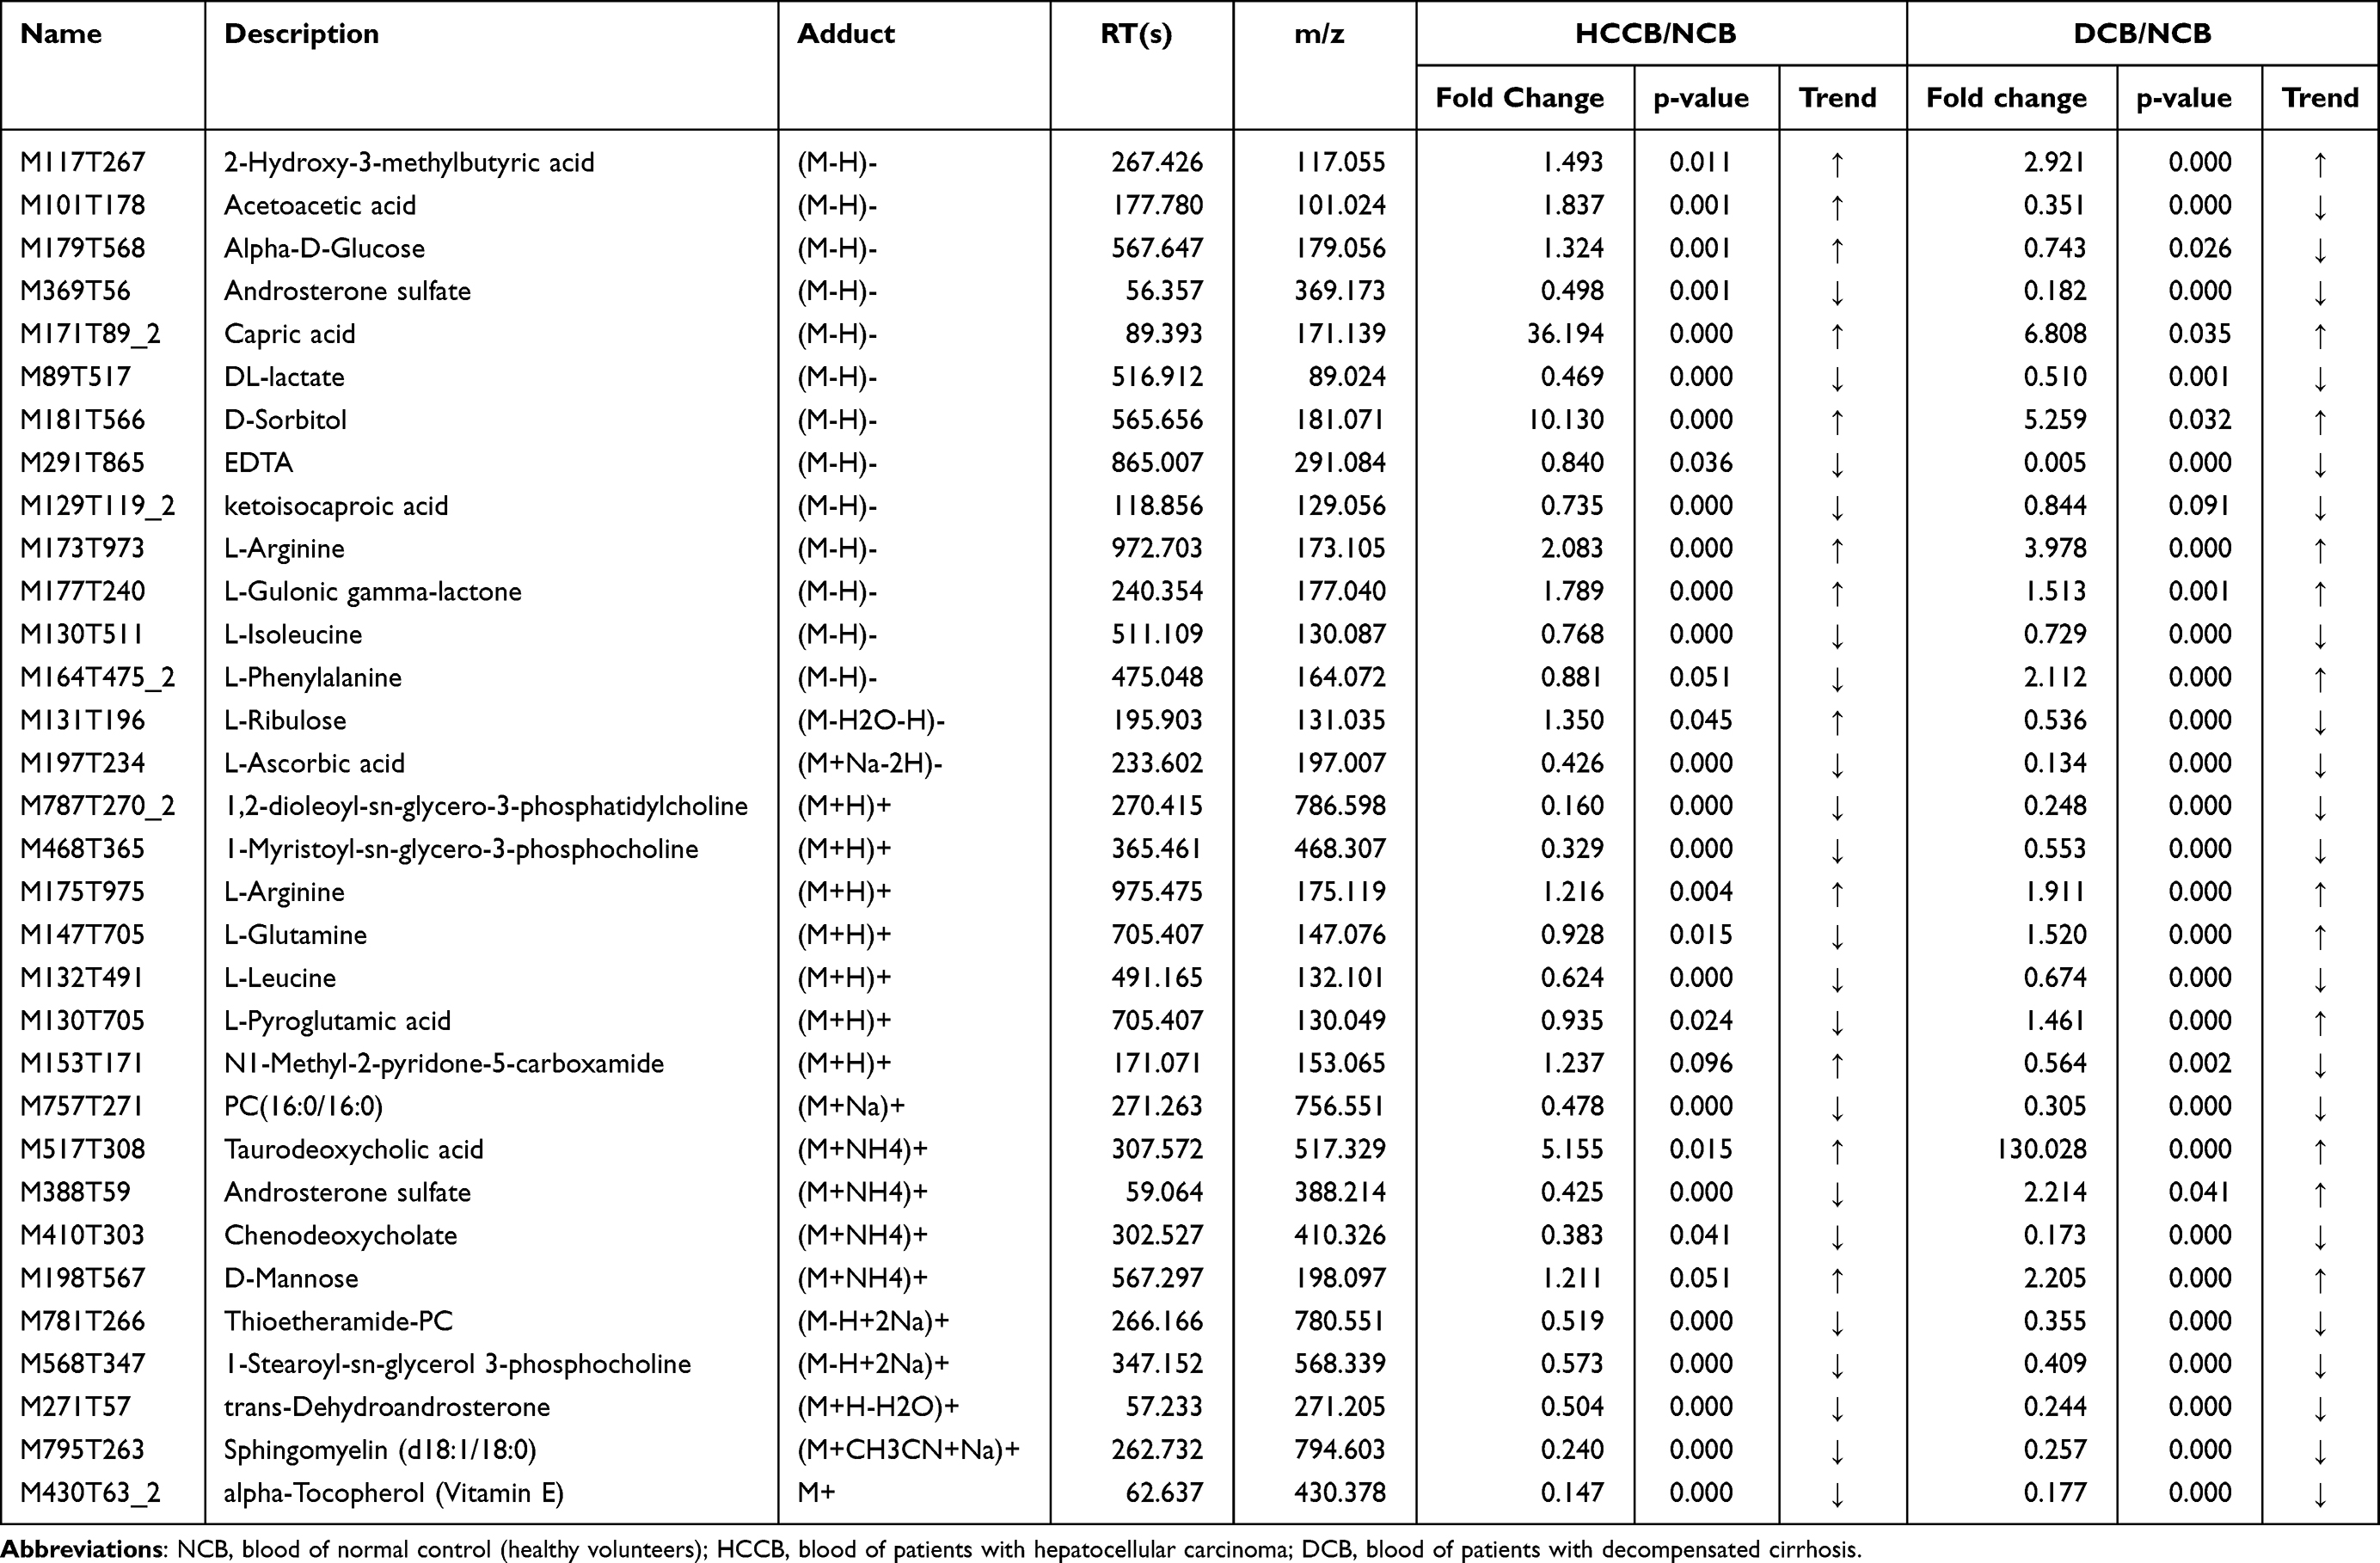 |
Table 2 List of the identified metabolites of the intersection statistics between HCCB vs NCB and DCB vs NCB in positive and negative ion mode based on UHPLC-Q-TOF/MS |
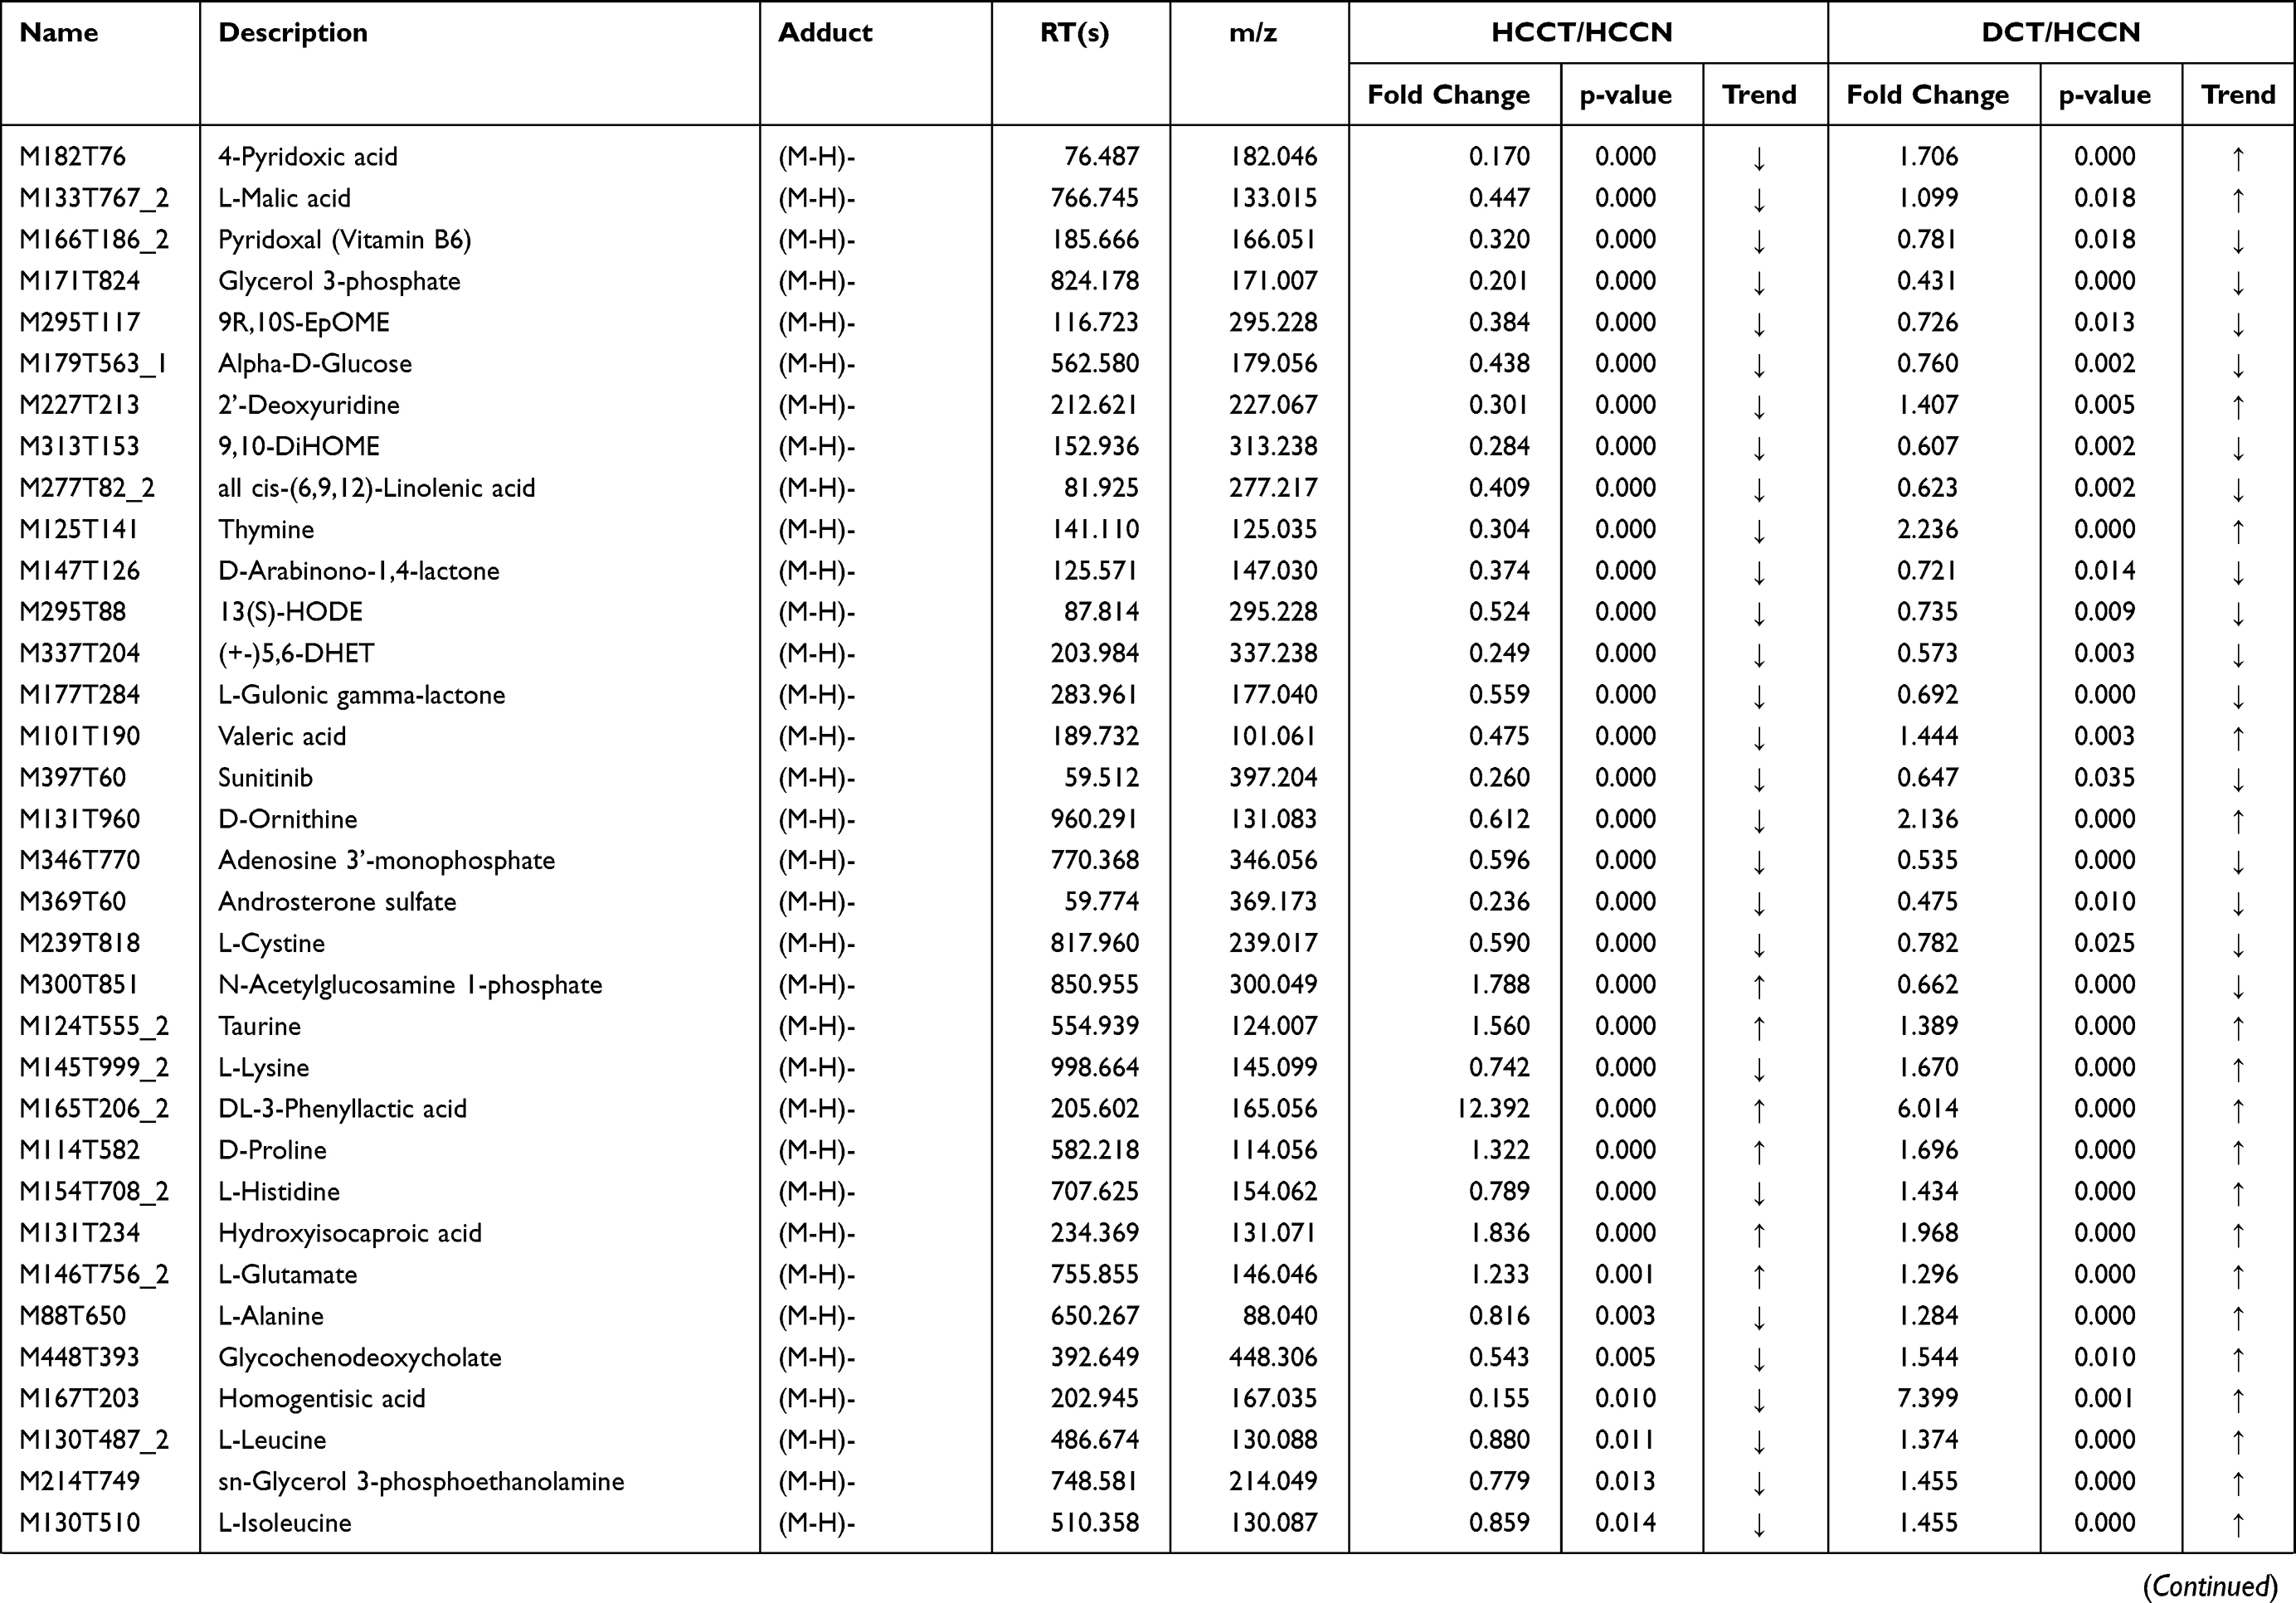 | 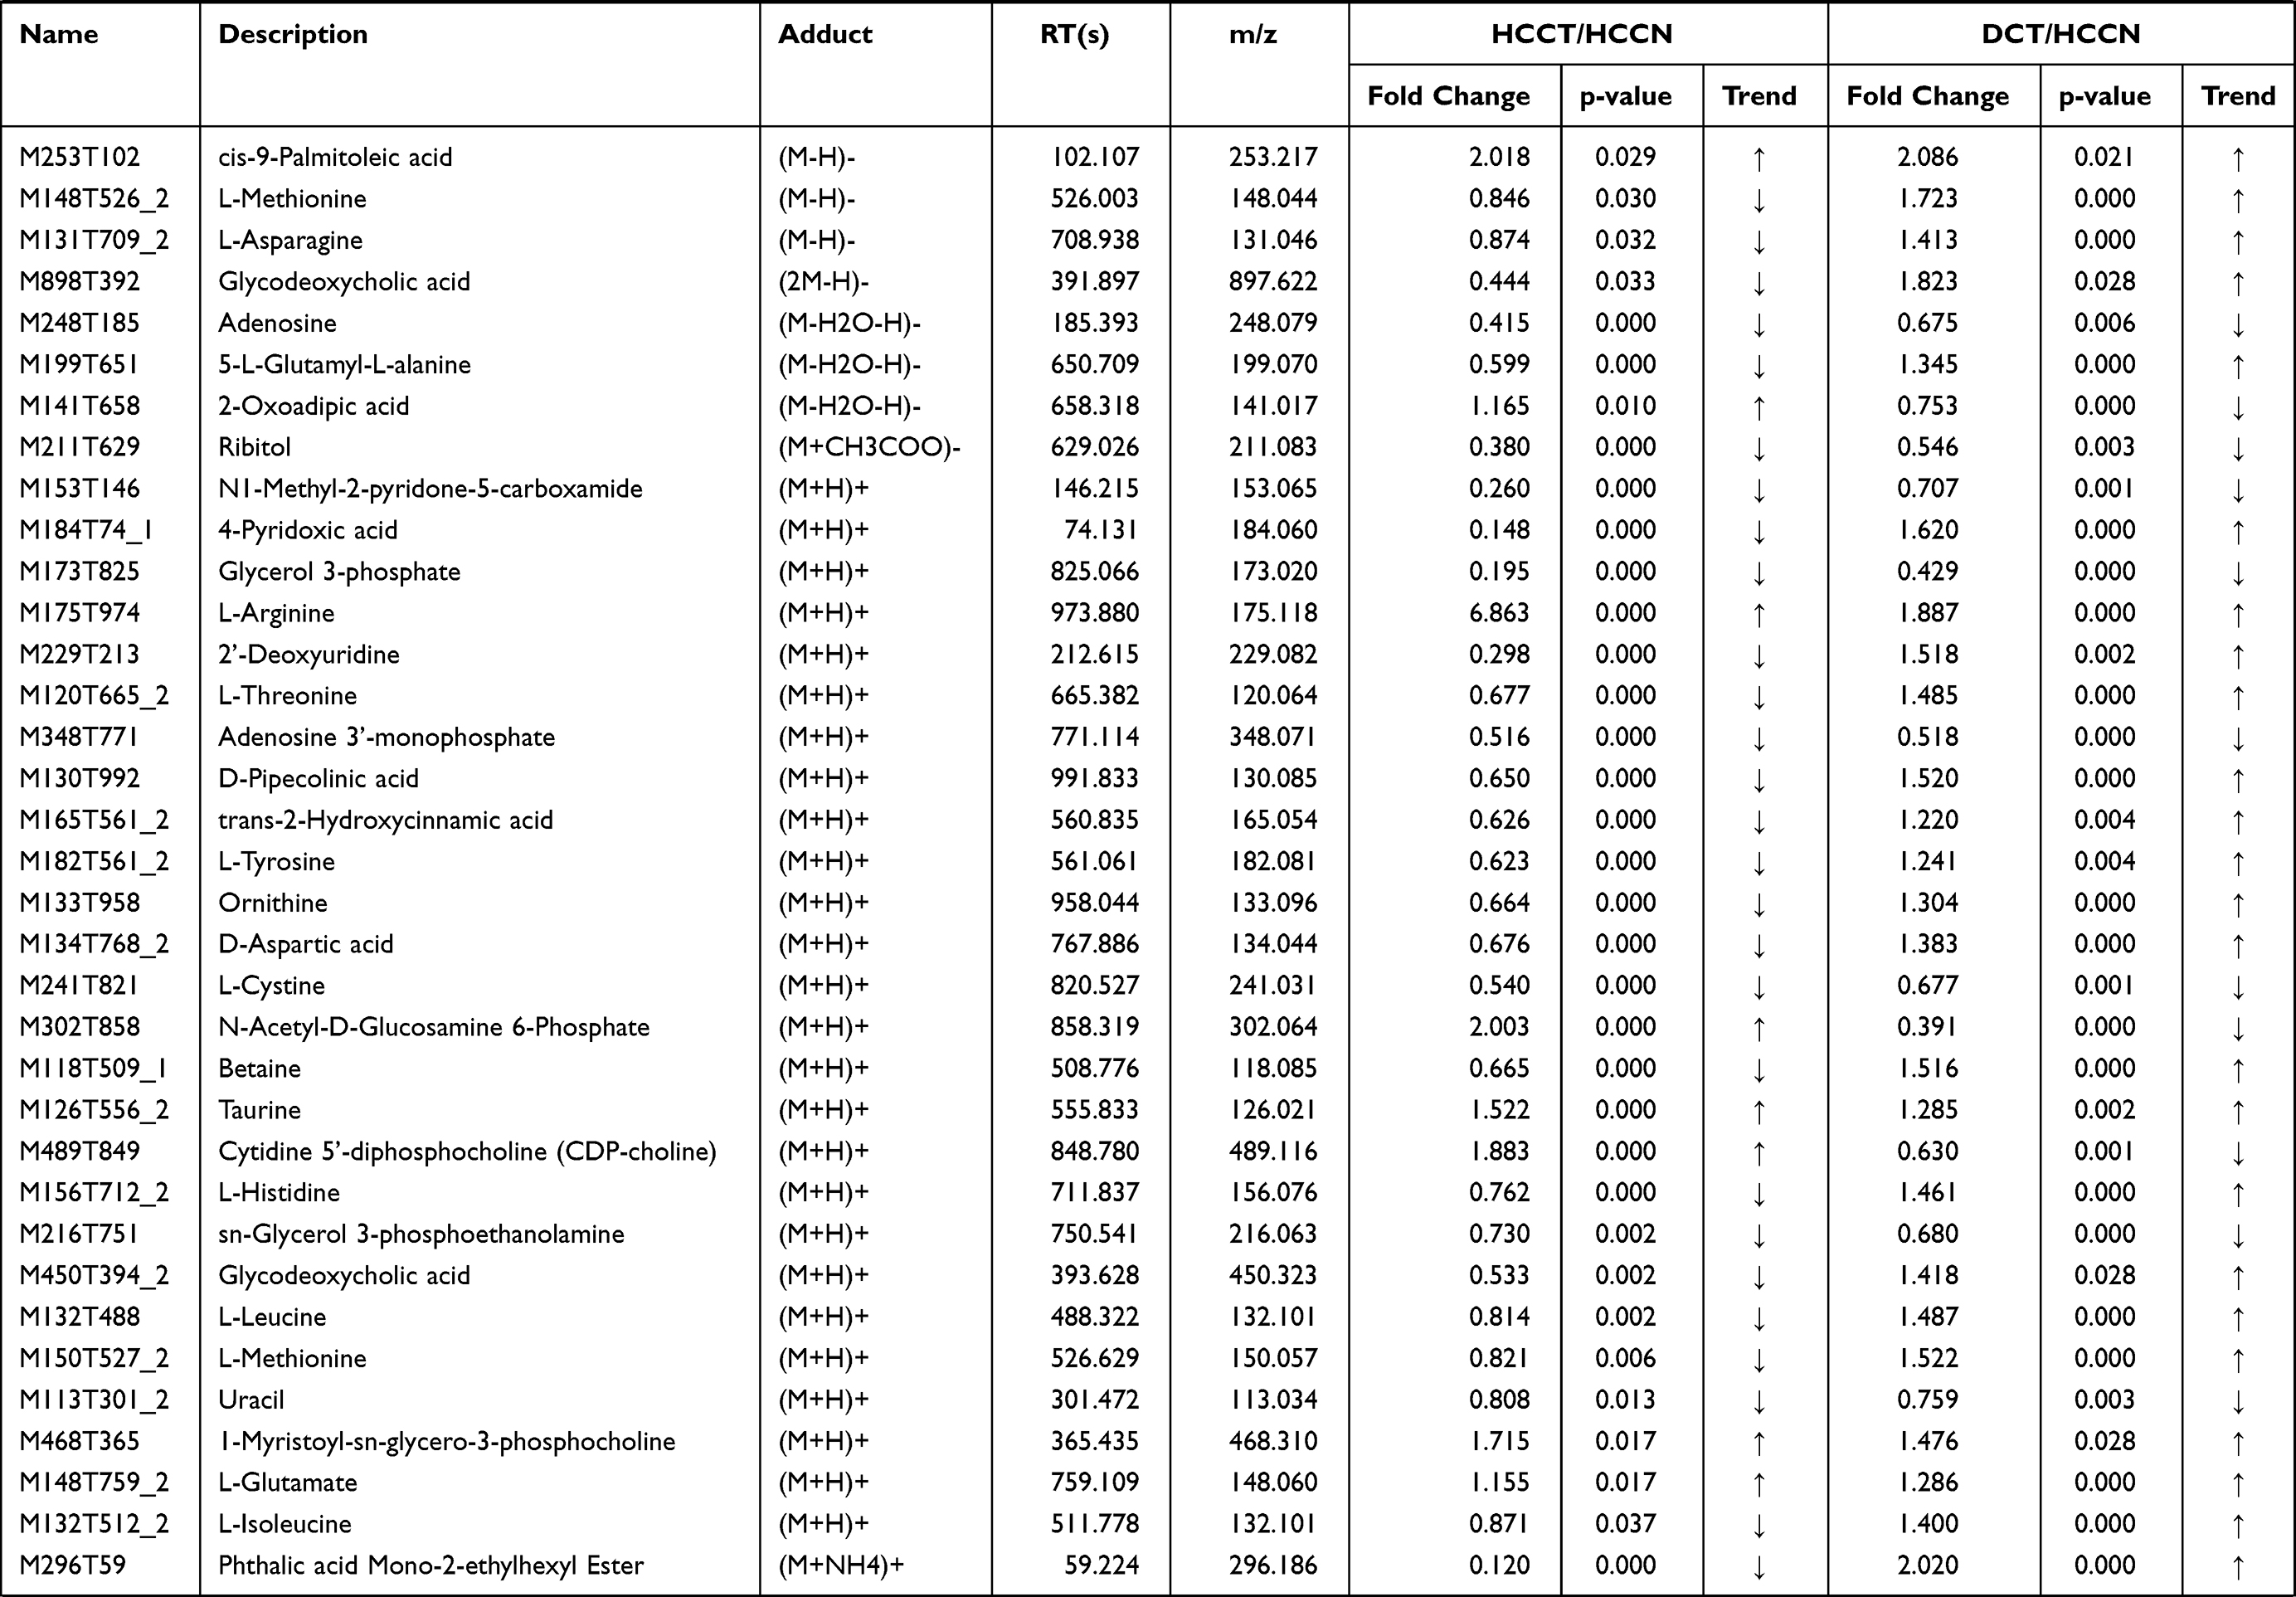 | 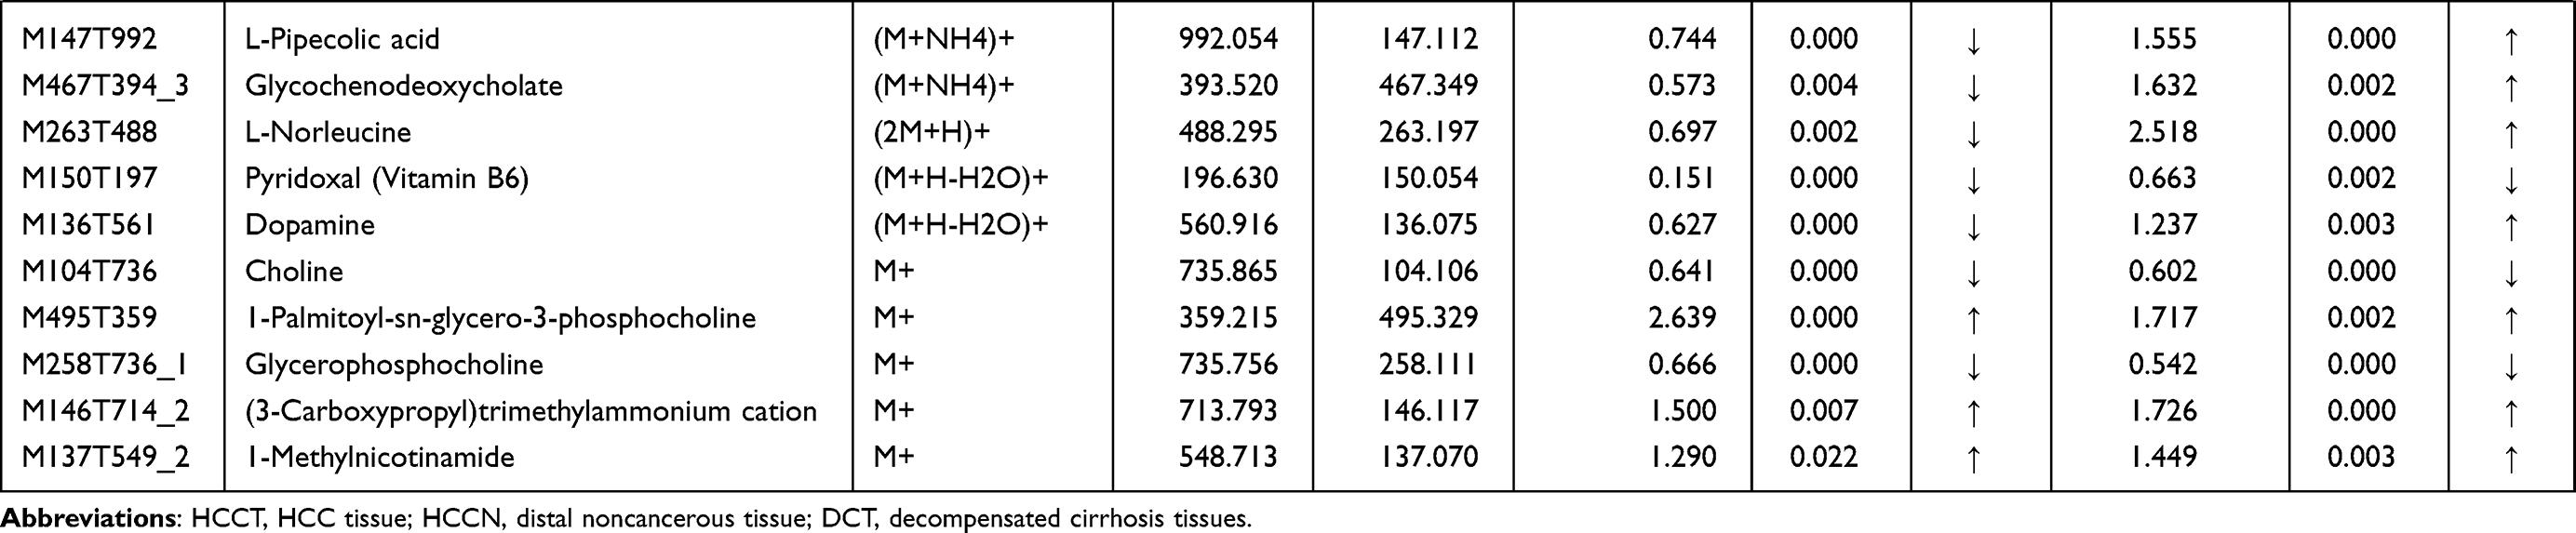 |
Table 3 List of the identified metabolites of the intersection statistics between HCCT vs HCCN and DCT VS HCCN in positive and negative ion mode based on UHPLC-Q-TOF/MS |
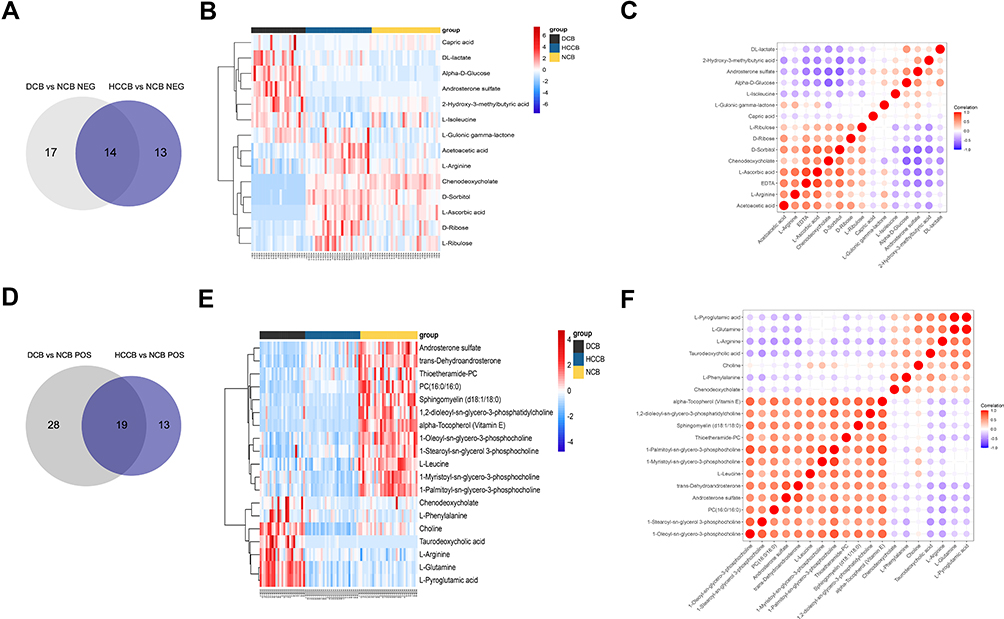 |
Figure 3 Common metabolites in the blood between groups HCCB vs NCB and DCB vs NCB. (A) Venn diagram of the overlapping metabolites in negative ion mode. (B) Heatmap of the overlapping 19 metabolites in negative ion mode. (C) Heatmap of the overlapping 19 metabolites in negative ion mode. (D) Venn diagram of the overlapping metabolites in positive ion mode. (E) Heatmap of the overlapping 23 metabolites in positive ion mode. (F) Heatmap of the overlapping 23 metabolites in positive ion mode. Abbreviations: NCB, blood of normal control (healthy volunteers); HCCB, blood of patients with hepatocellular carcinoma; DCB, blood of patients with decompensated cirrhosis. |
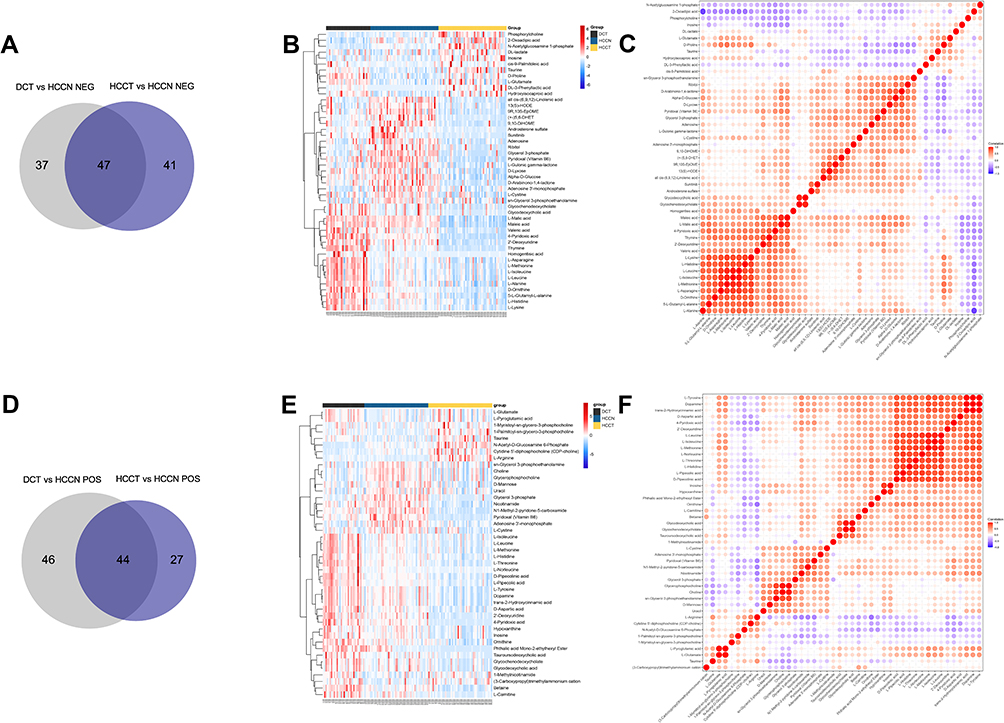 |
Figure 4 Common metabolites in the tissue between groups HCCT vs HCCN and DCT vs HCCN. (A) Venn diagram of the overlapping metabolites in negative ion mode. (B) Heatmap of the overlapping 47 metabolites in negative ion mode. (C) Heatmap of the overlapping 47 metabolites in negative ion mode. (D) Venn diagram of the overlapping metabolites in positive ion mode. (E) Heatmap of the overlapping 44 metabolites in positive ion mode. (F) Heatmap of the overlapping 44 metabolites in positive ion mode. HCCT: hepatocellular carcinoma tissue. Abbreviations: HCCN, distal noncancerous tissue; DCT, decompensated cirrhosis tissues. |
In the differential metabolites of tissue and plasma, we found 16 specific differential metabolites in patients with hepatocellular carcinoma (Figure 5A): 2E-eicosenoic acid and L-threonate were up-regulated in HCC plasma and tissues. Betaine, choline, L-pyroglutamic acid, and phthalic acid mono-2-ethylhexyl ester were down-regulated in HCC plasma and tissues. L-palmitoylcarnitine and 1-palmitoyl-sn-glycero-3-phosphocholine were down-regulated in HCCB and up-regulated in HCCT. Capric acid, D-ribose, alpha-D-glucose, and linoleic acid were up-regulated in HCCB and down-regulated in HCCT. Androsterone sulfate, DL-lactate, L-arginine, and taurodeoxycholic acid were up-regulated in HCCB compared with NCB but down-regulated compared with DCB.
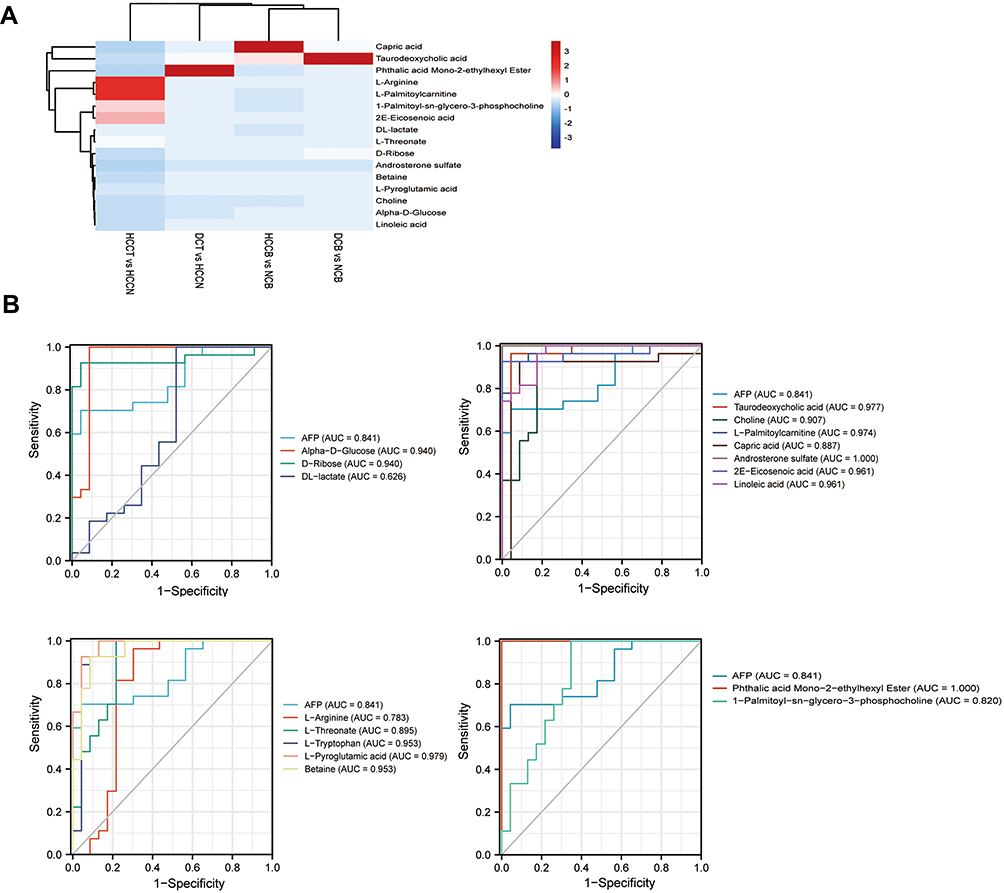 |
Figure 5 Characteristics of the biomarker signature from HCC VS DC (A) Heatmap of 16 differential metabolites among four groups: HCCB vs NCB, DCB vs NCB, HCCT vs HCCN and DCB vs HCCN. (B) ROC curve of AFP and 16 differential metabolites. Abbreviations: HCCB, blood of patients with hepatocellular carcinoma; DCB, blood of patients with decompensated cirrhosis. |
Then, we performed receiver operating characteristic (ROC) curve analysis on these differential plasma metabolites for sensitivity and specificity (Figure 5B, Table 4). Compared with AFP (AUC: 0.852; 95% CI: 0.749,0.954), some of above differential metabolites had higher diagnostic performance: capric acid (AUC: 0.89, 95% CI: 0.77,1.00), L-threonate (AUC: 0.90; 95% CI: 0.80,0.99), choline (AUC: 0.91, 95% CI:0.82,1.00), alpha-D-glucose (AUC: 0.94; 95% CI: 0.86,1.00), D-ribose (AUC: 0.94; 95% CI: 0.86,1.00), betaine (AUC: 0.95; 95% CI: 0.90,1.00), 2E-eicosenoic acid (AUC: 0.96; 95% CI: 0.90,1.00), linoleic acid (AUC: 0.96; 95% CI:0.92,1.00), L-palmitoylcarnitine (AUC: 0.97; 95% CI: 95% CI: 0.94,1.00), taurodeoxycholic acid (AUC: 0.98; 95% CI: 0.94,1.00), L-pyroglutamic acid (AUC: 0.98; 95% CI: 0.95,1.00), androsterone sulfate (AUC: 1.00; 95% CI: 1.00,1.00), and phthalic acid mono-2-ethylhexyl ester (AUC: 1.00; 95% CI: 1.00,1.00).
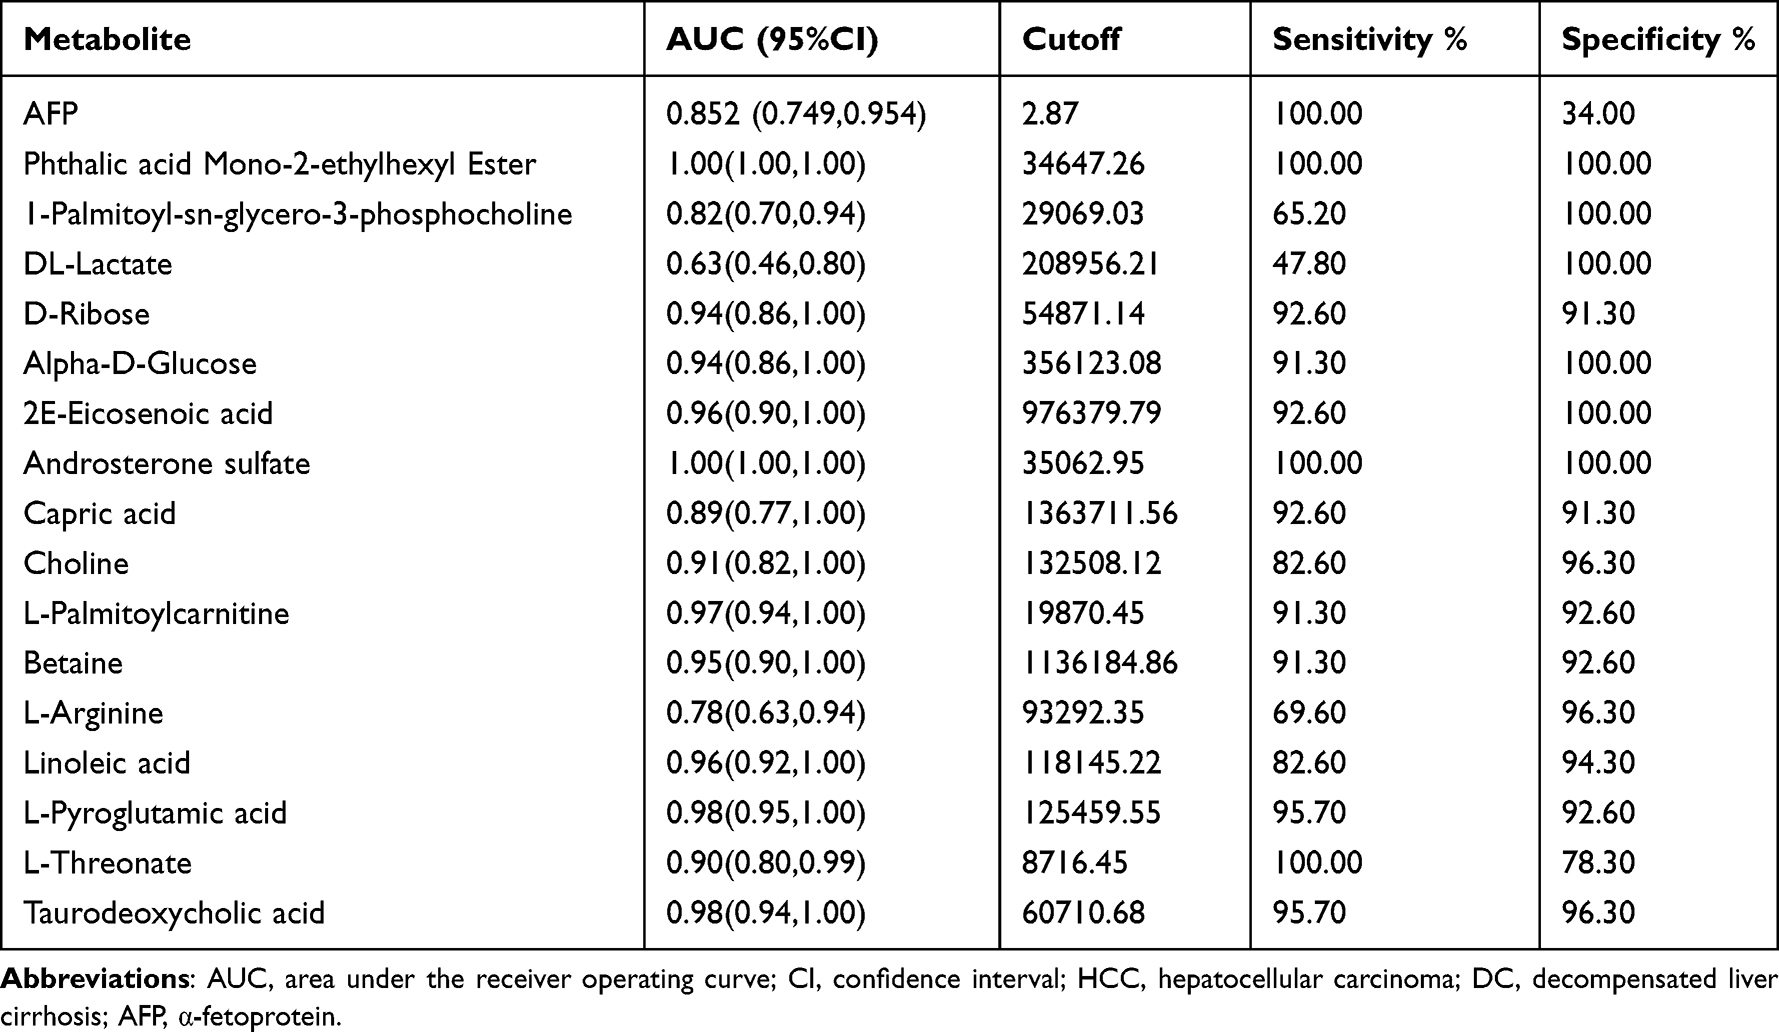 |
Table 4 Test performance characteristics for the plasma biomarker signature from HCC VS DC |
Proteomic Profiling of Tissue
While we investigated the clinical data of patients, we found some HCC patients were without liver cirrhosis, which may mask the mechanism of liver cirrhosis progressing to hepatocellular carcinoma. Therefore, we conducted a proteomic analysis for five HCC tissues with liver cirrhosis (HCCT-LC), five HCC tissues without liver cirrhosis (HCCT-NLC), and five DCTs (Figure 6A). Compared with the HCCT-NLC group, there were 107 up-regulated differential proteins and 137 down-regulated differential proteins in the HCCT-LC group. Compared with the DC group, there were 107 up-regulated differential proteins and 137 down-regulated differential proteins in the HCCT-LC group. Compared with the DC group, there were 371 up-regulated differential proteins and 379 down-regulated differential proteins in the HCCT-NLC group (Figure 6B-D, G and H).
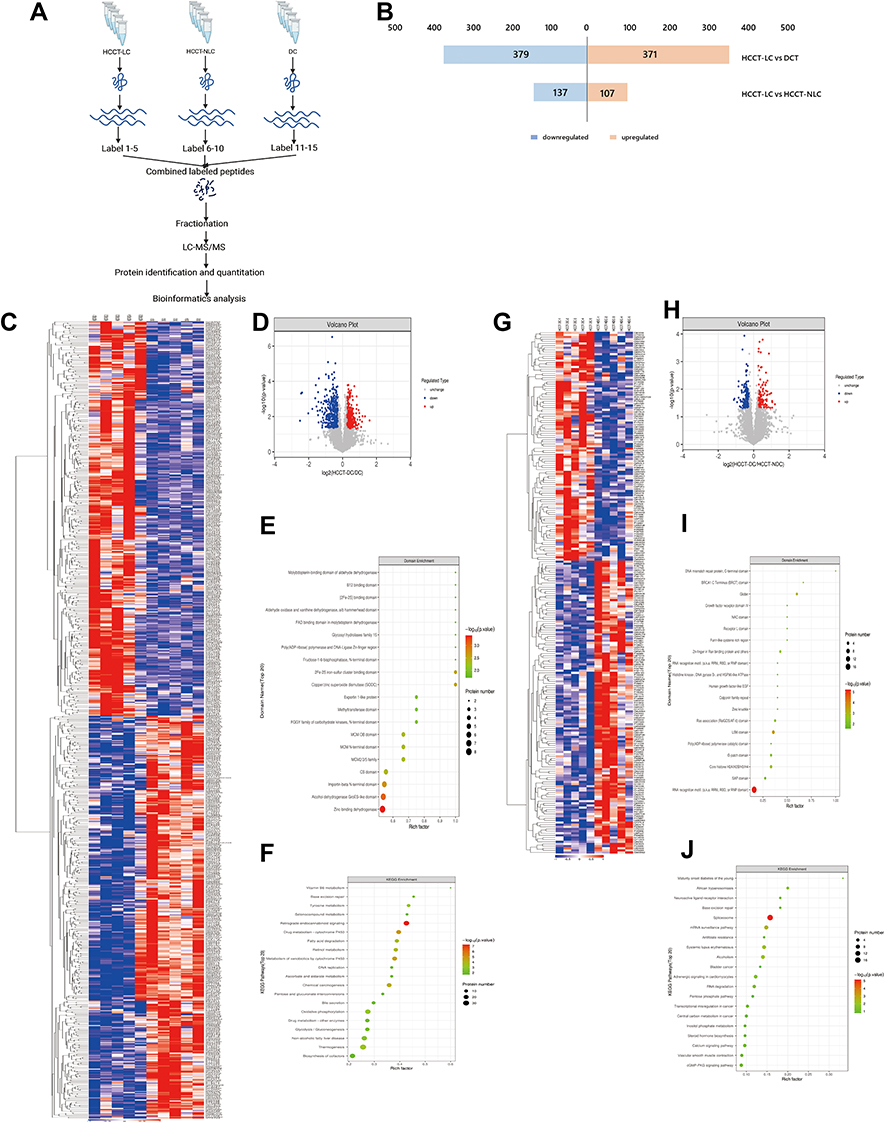 |
Figure 6 Proteomic analysis between HCCT-LC vs DC and HCCT-LC vs HCCT-NLC (A) Flow chart of proteomics. (B) The histogram of the differential proteins between the two groups of HCCT-LC vs DC and HCCT-LC vs HCCT-NLC. (C) Heatmap of up-regulated and down-regulated differential proteins in HCCT-LC vs DC group. (D) Log2 differential proteins between HCCT-LC and DC group is plotted on the x-axis, and the –log10 p-value is plotted on the y-axis. Probes that are identified to be significantly different between two groups are colored in red (up-regulation) and blue (down-regulation). (E) Domain enrichment shows that top 20 domain of HCCT-LC vs DC group. (F) KEGG plot indicates that enrichment pathways of HCCT-LC vs DC group. (G) Heatmap of up-regulated and down-regulated differential proteins in HCCT-LC vs HCCT-NLC group. (H) Log2 differential proteins between HCCT-LC and HCCT-NLC group is plotted on the X-axis, and the –log10 p-value is plotted on the Y-axis. Probes that are identified as significantly different between two groups are colored in red (up-regulation) and blue (down-regulation). (I) Domain enrichment shows that top 20 domain of HCCT-LC vs HCCT-NLC group. (J) KEGG plot indicates that enrichment pathways of HCCT-LC vs HCCT-NLC group. Abbreviations: HCCT-NLC, hepatocellular carcinoma tissues without liver cirrhosis; HCCT-LC, hepatocellular carcinoma tissues with liver cirrhosis; DCT, decompensated cirrhosis tissues. |
Domain analyses of differential proteins (Figure 6E) between the HCCT-LC group and DC group were enriched in zinc-binding dehydrogenase, alcohol dehydrogenase GroES-like domain, importin-beta N-terminal domain, copper/zinc superoxide dismutase (SODC), 2Fe-2S iron-sulfur cluster binding domain, CS domain, MCM2/3/5 family, MCM N-terminal domain, MCM OB domain, FGGY family of carbohydrate kinases, and N-terminal domain. Meanwhile, the differential protein KEGG pathways (Figure 6F) were enriched in retrograde endocannabinoid signaling, drug metabolism-cytochrome P450, metabolism of xenobiotics by cytochrome P450, chemical carcinogenesis, retinol metabolism, fatty acid degradation, thermogenesis, oxidative phosphorylation, tyrosine metabolism, non-alcoholic fatty liver disease, glycolysis/gluconeogenesis, drug metabolism and other enzymes, selenocompound metabolism, bile secretion, ascorbate and aldarate metabolism, DNA replication, base excision repair, pentose and glucuronate interconversions, biosynthesis of cofactors, VB6 metabolism, spliceosome, progesterone-mediated oocyte maturation, and non-homologous end-joining.
Domain analyses of differential proteins (Figure 6I) between the HCCT-LC group and the HCCT-NLC group were enriched in RNA recognition motif (a.k.a. RRM, RBD, or RNP domain), LSM domain, Globin, core histone H2A/H2B/H3/H4, DNA mismatch repair protein, C-terminal domain, Zn-finger in Ran-binding protein and others, Ras association (RalGDS/AF-6) domain, BRCA1 C Terminus (BRCT) domain, G-patch domain, and Furin-like cysteine-rich region. Meanwhile, the differential protein KEGG pathways (Figure 6J) were enriched in spliceosome, mRNA surveillance pathway, systemic lupus erythematosus, alcoholism, adrenergic signaling in cardiomyocytes, African trypanosomiasis, and RNA degradation.
Combined Analysis of Metabolomics and Proteomics of Liver Tissues
Next, we performed a combined analysis of metabolomics and proteomics between the HCCT-LC group and DC group, HCCT-LC group, and HCCT-NLC group.
Metabolomics and proteomics between the HCCT-LC group and DC group shared 58 KEGG pathways (Figure 7A). The top ten KEGG pathways with the largest number of proteins and metabolites were amyotrophic lateral sclerosis (ALS), retrograde endocannabinoid signaling, pathways in cancer, glycolysis/gluconeogenesis, lysosome, glucagon signaling pathway, bile secretion, ABC transporters, purine metabolism cysteine, and methionine metabolism (Figure 7B). The significant KEGG enrichment displays VB6 metabolism (Figure 7C) and pentose and glucuronate interconversions (Figure 8B). In VB6 metabolism, the expression of aldehyde oxidase, phosphoserine aminotransferase, and pyridoxine-5’-phosphate oxidase were decreased, whose synthetic products pyridoxal (VB6) and 4-Pyridoxic acid were decreased (Figure 8A, Table 5). In pentose and glucuronate interconversions, the expression of UTP-glucose-1-phosphate uridylyltransferase, UDP-glucuronosyltransferase 1–4, UDP-glucuronosyltransferase 1–6, UDP-glucuronosyltransferase 2B7, UDP-glucuronosyltransferase 1–1, xylulose kinase, beta-glucuronidase, whose synthetic products are Xylitol, D-lyxose, L-ribulose, were decreased (Figure 7C, Table 5). Because the pentose and glucuronate interconversions altered aimlessly among more than 20 tumor types,16 We specifically verified the VB6 metabolism at the animal level, which is an important physiological function of hepatocytes.
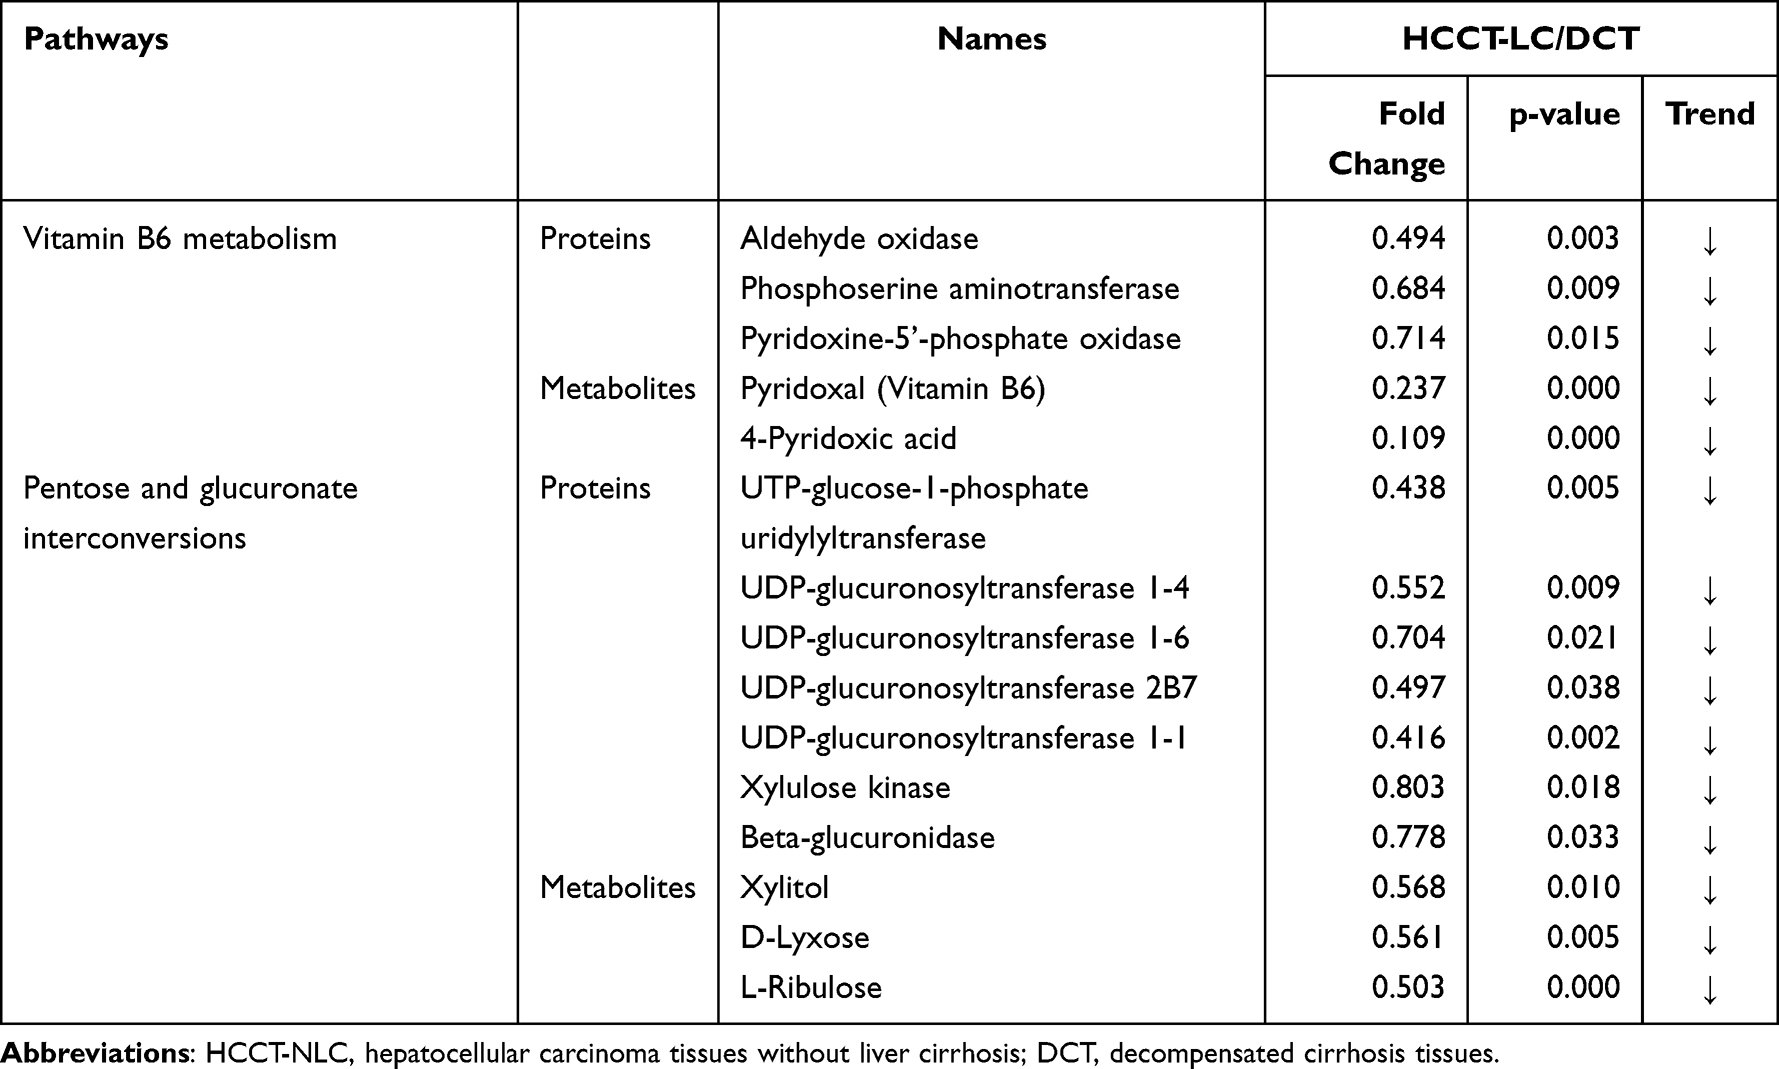 |
Table 5 HCCT-LC vs DC:The list of the specific proteins and metabolites involved in the shared pathways between metabolomics and proteomics |
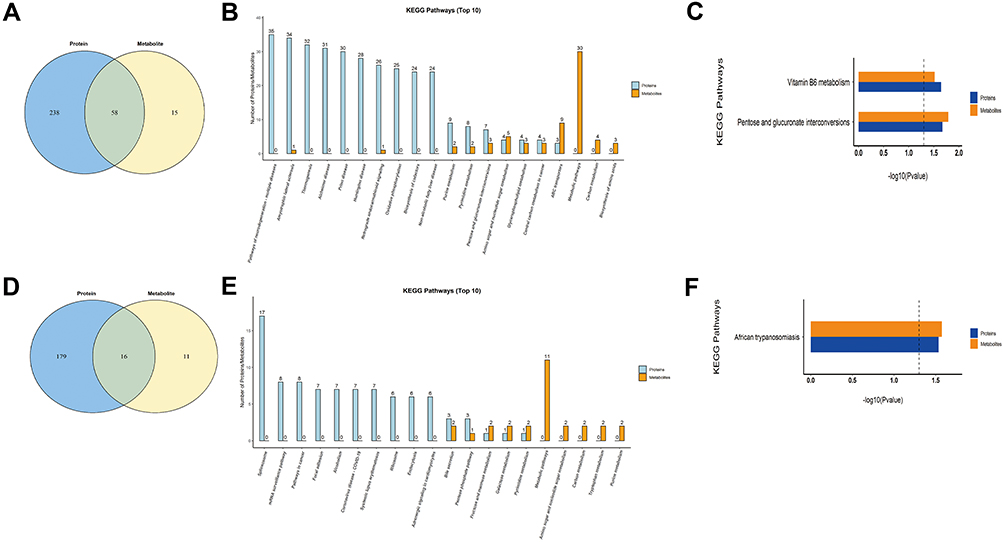 |
Figure 7 Combined analysis of metabolomics and proteomics. (A) The Venn diagram of the pathways involved in the differential metabolites and proteins between HCCT-LC group and DC group, and the overlap represents the shared pathways. (B) The top 10 pathways in quantity of metabolites and proteins co-participation between HCCT-LC group and DC group. (C) The KEGG pathway enrichment based on the differential metabolites and proteins between HCCT-LC group and DC group. (D) The Venn diagram of the pathways involved in the differential metabolites and proteins between HCCT-LC and HCCT-NLC group, and the overlap represents the shared pathways. (E) The top 10 pathways in quantity of metabolites and proteins co-participation between HCCT-LC and HCCT-NLC group. (F) The KEGG pathway enrichment based on the differential metabolites and proteins of HCCT-LC and HCCT-NLC group. Different colors represent different omics, blue represents proteomics, and Orange represents metabolomics. Abbreviations: HCCT-NLC, hepatocellular carcinoma tissues without liver cirrhosis; HCCT-LC, hepatocellular carcinoma tissues with liver cirrhosis; DCT, decompensated cirrhosis tissues. |
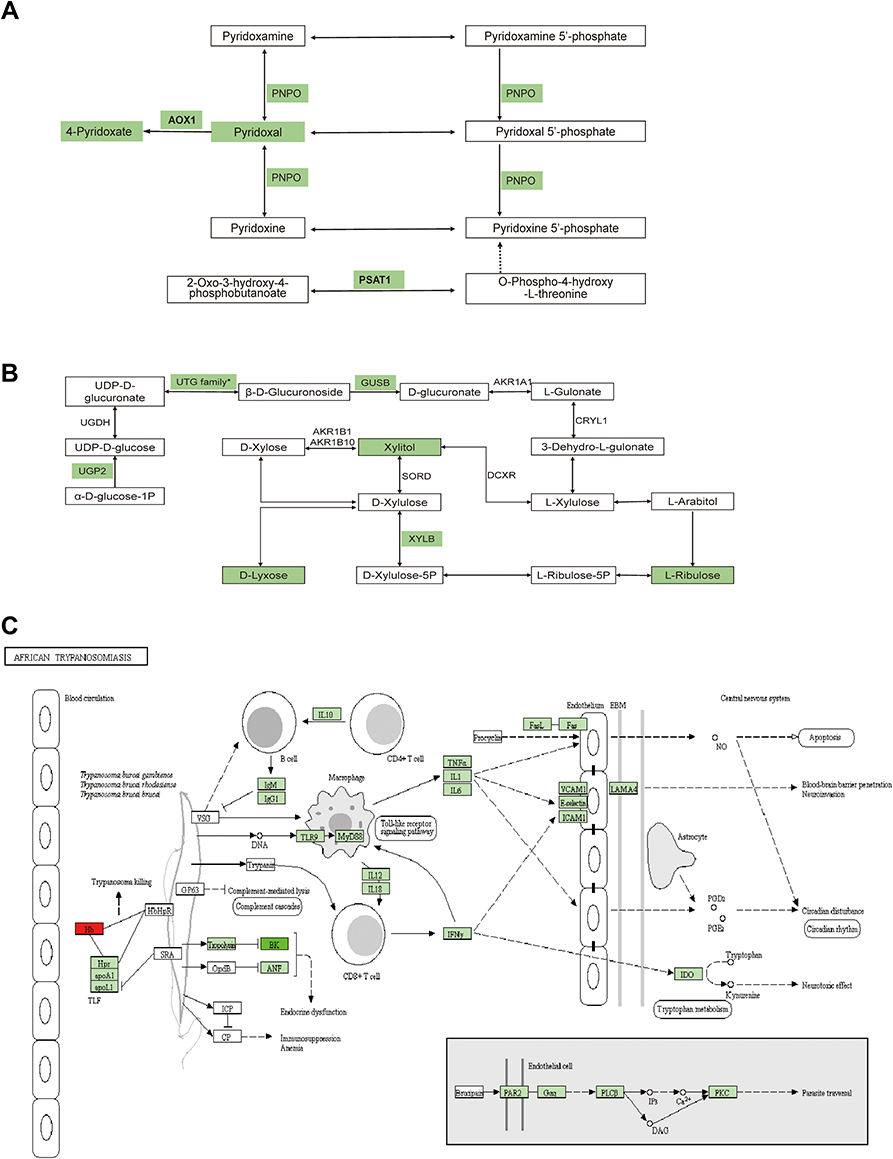 |
Figure 8 Schematic diagram of the proteins and metabolites pathways between HCCT-LC vs DCT and HCCT-LC vs HCCT-NLC. (A) Vitamin B6 metabolism. (B) Pentose and glucuronate interconversions metabolism. (C) African trypanosomiasis. Green means that the expression of proteins and metabolites is down-regulated and red means up regulated, the FDR-adjusted p-values were less than 0.001. Abbreviations: HCCT-NLC, hepatocellular carcinoma tissues without liver cirrhosis. HCCT-LC, hepatocellular carcinoma tissues with liver cirrhosis. DCT, decompensated cirrhosis tissues. AOX1, Aldehyde oxidase; PSAT1, Phosphoserine aminotransferase; PNPO, Pyridoxine-5’-phosphate oxidase, UGT family* contains a lot of UDP-glucuronosyltransferases, and UGT1A4, UGT1A6, UGT2B7, UGT1A1 were down-regulated. XYLB, Xylulose kinase; GUSB, Beta-glucuronidase; Hb, Hemoglobin subunit α and Hemoglobin subunit beta; LAMA4, Laminin subunit alpha 4. |
Metabolomics and proteomics between the HCCT-LC group and the HCCT-NLC group shared 16 KEGG pathways (Figure 7D). The top ten KEGG pathways with the largest number of proteins and metabolites were bile secretion, pentose phosphate pathway, lysosome thermogenesis, African trypanosomiasis, glycolysis/gluconeogenesis, pentose and glucuronate interconversions, arginine and proline metabolism, fructose and mannose metabolism, and galactose metabolism (Figure 7E). The significant KEGG enrichment displays African trypanosomiasis, which is related to the immune regulation of Kynurenine (Figure 7F). The expression levels of hemoglobin subunit beta, hemoglobin subunit α, and laminin subunit alpha 4 were increased, and L-kynurenine showed an upward trend (Figure 8C, Table 6).
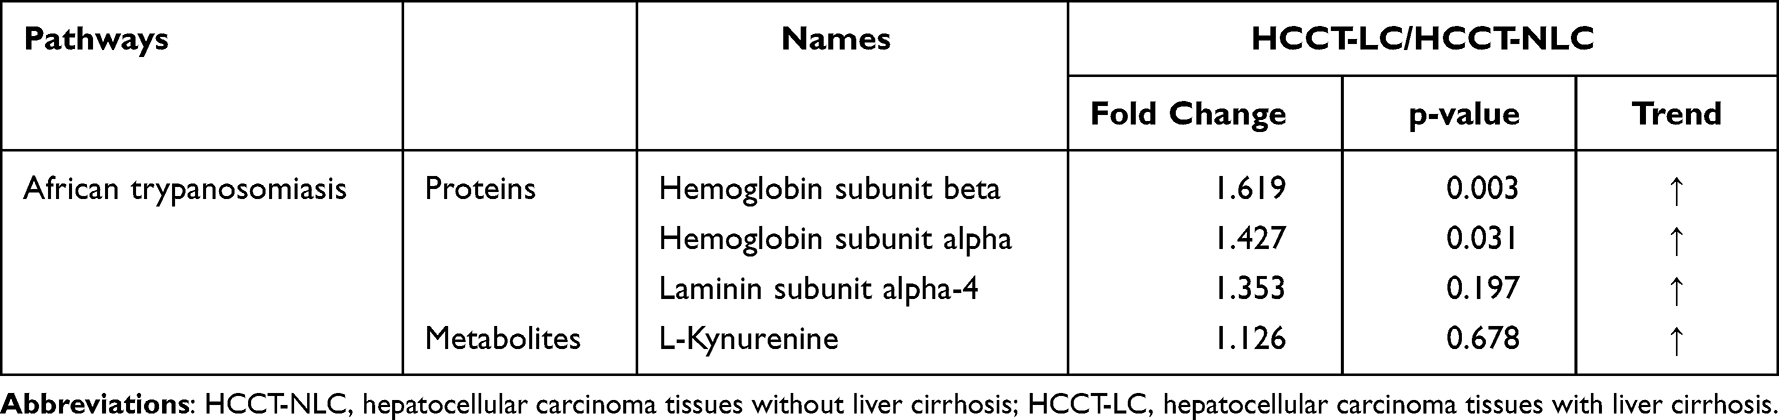 |
Table 6 HCCT-LC vs HCCT-NLC:The list of the specific proteins and metabolites involved in the shared pathways between metabolomics and proteomics |
VB6 Improves Liver Inflammation and Hepatocyte Injury in a Mouse Model of Chronic Liver Injury
Some studies have reported that patients with liver cirrhosis have VB6 metabolic disorder. Our combined proteomics and metabolomics analysis demonstrated that there was a significant disorder of VB6 metabolism in HCC with liver cirrhosis than in DCT. Therefore, we constructed a liver cirrhosis model induced by CCl4 and intervened with VB6 (Figure 9A). Although VB6 supplementation had not improved the elevated ALT and AST (Figure 9B) and collagen deposition caused by CCl4 (Figure 9C-E), VB6 markedly alleviated leukocyte infiltration, hepatocyte edema, and degeneration (Figure 9C).
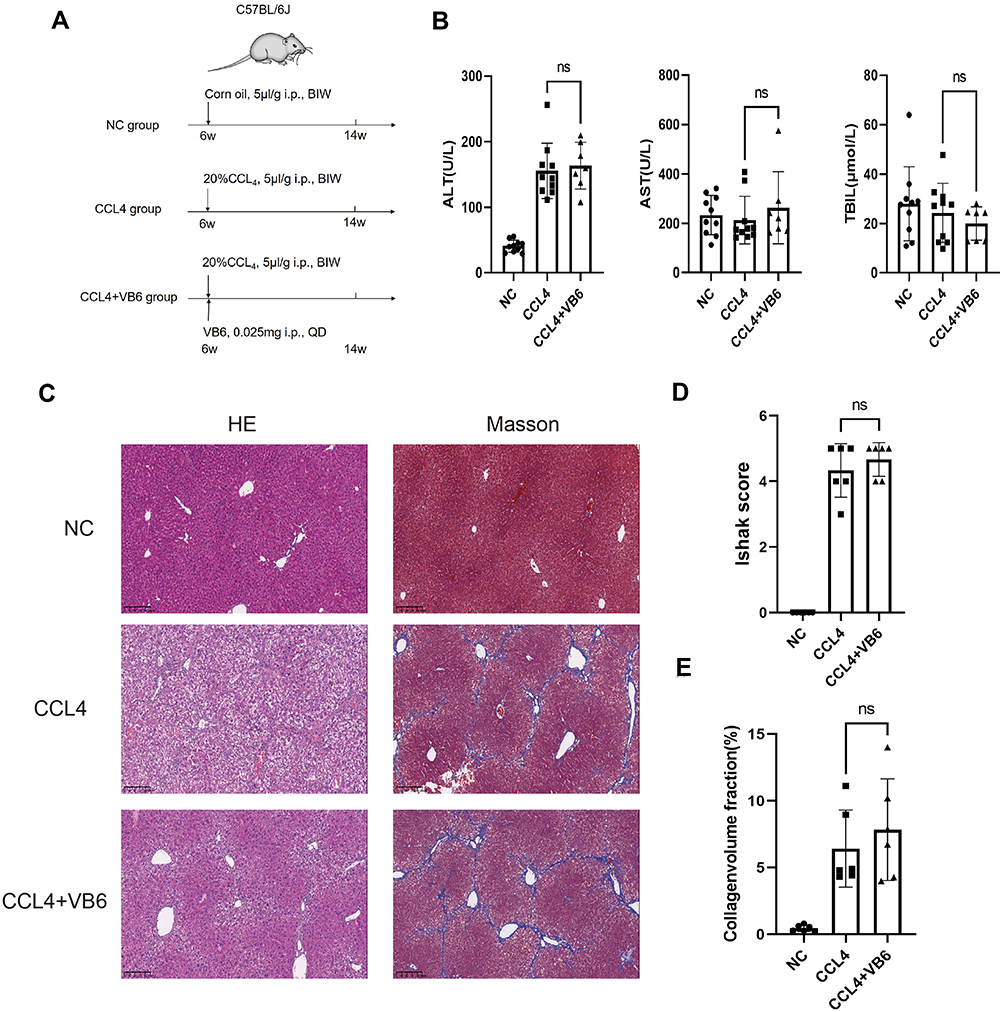 |
Figure 9 VB6 has protective effect on CCl4-induced chronic liver injury model. (A) Flow chart of experimental design of VB6 intervention on liver cirrhosis in mice. (B) AST, ALT and TBIL in mice after the intervention with CCl4 and/or VB6. (C) Liver pathological changes in HE staining and Masson staining after intervention with CCl4 and/or VB6. (D) Ishak score after Masson staining of liver. (E) Collagen volume fraction calculated by ImageJ after Masson staining of liver. ns means P ≥ 0.05. Abbreviations: CCl4, carbon tetrachloride; VB6, vitamin B6. |
Discussion
By 16S rRNA sequencing, we identified that HCCT had higher alpha diversity and higher abundance of Elizabethkingia. The genus Elizabethkingia is classified within the family Weeksellaceae, order Flavobacteriales, class Flavobacteriia, and ubiquitously distributed in natural environments, such as fish, frogs, and insects water, especially in the tap water of hospitals, which can cause fatal infection in human.17 Previous literature reported Elizabethkingia could cause severe hepatitis in frogs,18 but the relationship between human cancer tissue and Elizabethkingia has not been investigated. Elizabethkingia anophelis is positive for glycine arylamidase (GlyA),19 which is pyridoxal-5′-phosphate (PLP, an active form of VB6)-dependent enzyme that catalyzes the conversion of serine to glycine. PLP-binding protein, one member of the YggS/Ybl036c/PLPBP family, can competitively bind PLP with pyridoxine-5’-phosphate oxidase (PNPO) to maintain homeostasis of VB6.20 In a combined analysis of metabolomics and proteomics, compared with DC, aldehyde oxidase, phosphoserine aminotransferase, PNPO, and their synthetic products pyridoxal (VB6) and 4-pyridoxic acid were decreased in HCCT. These results suggested that the higher abundance of Elizabethkingia might involve the disorder of VB6, but the causality was still unclear, which would be a basis for further research.
AFP is a commonly used serum biomarkers to screen and diagnose HCC in the clinic, but its sensitivity is limited to 65% for clinical HCC diagnosis and <40% for preclinical prediction.21 We found two new specific metabolites, phthalic acid mono-2-ethylhexyl ester and 1-Palmitoyl-sn-glycero-3-phosphocholine. Phthalic acid mono-2-ethylhexyl ester is also known as mono-ethylhexyl phthalate (MEHP) and is present ubiquitously in the environment and organisms. Previous studies22,23 demonstrated that MEHP could induce ROS generation, DNA oxidative damage, and apoptosis in rats and in vitro. We found that MEHP had higher diagnostic performance than AFP (1 versus 0.852) and was down-regulated in plasma and HCCT. 1-palmitoyl-sn-glycero-3-phosphocholine was an enzyme activator of UDP-glucuronosyltransferase,24 which was consistent with the pentose and glucuronate interconversions metabolism disorder (Figure 8B and Table 5).
We performed a comprehensive metabolomics study of tissue and plasma, and some plasma results are consistent with many other reports, while some are not. 2E-eicosenoic acid and L-threonate were up-regulated in HCC plasma and tissues. 2E-eicosenoic acid has a high plasma level in metabolic dysfunction-associated fatty liver disease.25 L-threonate is produced by the metabolism of vitamin C under oxidative conditions.26 Betaine, choline, and L-pyroglutamic acid were down-regulated in HCC plasma and tissues. Betaine is a glycine derivative converted from serine under VB6-dependent enzyme catalysis. Its main role is serving as a methyl donor in hepatic metabolism, which is related to the occurrence of HCC.27 Choline is an essential nutrient in all cells to maintain the stability of cell membrane structure,28 and higher plasma Choline levels were associated with better HCC survival rates.29 Choline of HCC plasma was lower than liver cirrhosis and healthy control group,11 which is consistent with our results. L-Pyroglutamic acid is also called 5-oxoproline, a synthetic substrate of glutathione (GSH); its reduction will weaken hepatic antioxidant capacity. The same metabolite in blood and tissue may have inconsistent trends. L-palmitoylcarnitine was down-regulated in HCCB and up-regulated in HCCT and involved in fatty acid oxidation caused by hepatocytes damage.30 Capric acid, D-ribose, alpha D-glucose, and linoleic acid were up-regulated in HCCB and down-regulated in HCCT. D-Ribose participates in many physiological and metabolic pathways, including the synthesis of liver triglyceride by increasing liver diacylglycerol acyltransferase levels,31 affecting the structure and function of liver cystatin,32 which is the target of vitamin B6 in the treatment of hypercysteinemia. Not surprisingly, HCC disrupted cholic acid metabolism, resulting in abnormal levels of a series of bile acid metabolites, which were conjugated by taurodeoxycholic acid. It has been reported33 that linoleic acid peroxide, a downstream metabolite of linoleic acid, participates in the HCC occurrence. Capric acid, a medium-chain fatty acid, was beneficial to human health and had been proved to protect the liver through curtailing hepatic lipid synthesis and reducing lipid peroxidation.34,35 With the help of metabolomics of hepatic tissue, we found that the changing pattern of metabolites in liver tissue and blood is complicated and still needs more studies.
Combined analysis of proteomics and metabolomics revealed that, compared with DC, HCCT-LC had more obvious defects in VB6 metabolism and pentose and glucuronate interconversions. Subsequently, we confirmed the protective effect of vitamin B6 on liver injury in the mouse. Pentose and gluconic acid interconversions are one of the metabolic pathways of glucose in the liver,36 and its metabolites, D-xylose and xylitol, have been demonstrated anti-inflammatory, antiglycemic, antiviral, and antibacterial properties,37 which means that HCCT-LC may be accompanied by more severe liver metabolic dysfunction and affect systemic organ function. As early as 2006, some studies showed that the level of VB6 in patients with primary biliary sclerosis was low. Recently, scholars38 have found that VB6 is related to the metabolism of H2S, H2S2, cystine, cysteine, homocysteine, cystine sulfide, and methionine in the metabolic reprogramming of liver cancer.39 Many clinical trials40–42 have observed an anti-hepatocellular carcinoma effect by directly supplementing VB6, and some studies reported negative results. In the present study, we constructed a mouse model of chronic liver injury by CCl4 and treated these mice with VB6. Although the degree of fibrosis did not decrease after VB6 intervention, the inflammatory cell infiltration, hepatocyte edema, and degeneration significantly improved. In the future, we will focus on the key regulatory enzymes of VB6 metabolic pathways in HCC.
In addition, our study revealed that kynurenine showed an upward trend in HCCT-LC compared with HCCT-NLC. The kynurenine pathway is considered the main tryptophan catabolic pathway in humans,43 and is closely related to immune cells, especially T cell functions.44 Therefore, it is necessary to pay attention to the immunomodulatory effect of kynurenine in the progression of liver cirrhosis to liver cancer.
However, the present study has some limitations. First, although we completed microbiomic, metabolomic, and proteomic characteristic analysis in the tissues and plasma, we are still collecting prognostic information on these patients, which may reveal more mechanisms. Second, we did not verify kynurenine metabolism or pentose and glucuronate interconversions, which should be addressed in future work.
Conclusion
Our study revealed significant differences in the flora distribution between HCCT and DC. Metabolites including capric acid, L-threonate, choline, alpha-D-glucose, D-ribose, betaine, 2E-eicosenoic acid, linoleic acid, L-palmitoylcarnitine, taurodeoxycholic acid, L-pyroglutamic acid, androsterone sulfate, and phthalic acid mono-2-ethylhexyl ester showed potential for the diagnosis of HCC. VB6 ameliorated inflammatory cell infiltration, hepatocyte edema, and degeneration in chronic liver injury.
Acknowledgments
This work was supported by National Natural Science Foundation of China (No. 81871238), Natural Science Foundation of Guangdong Province No. 2021A1515010435), Guangdong Provincial Key Laboratory of Organ Donation and Transplant Immunology, The First Affiliated Hospital, Sun Yat-sen University, Guangzhou, China (No. 2017B030314018, No. 2020B1212060026), Guangdong Provincial International Cooperation Base of Science and Technology (Organ Transplantation), The First Affiliated Hospital, Sun Yat-sen University, Guangzhou, China (No. 2015B050501002), Science and Technology Program of Guangzhou, China (No. 202103000007), and Guangdong Provincial Funds for High-end Medical Equipment (No. 2020B1111140003).
The authors thank Dr. Zhen Tiantian of the pathology department of the First Affiliated Hospital of Sun Yat sen University for the identification of HE staining and Masson staining of mice liver.
Disclosure
The authors report no conflicts of interest in this work.
References
1. Sung H, Ferlay J, Siegel RL, et al. Global Cancer Statistics 2020: GLOBOCAN Estimates of Incidence and Mortality Worldwide for 36 Cancers in 185 Countries. CA Cancer J Clin. 2021;71(3):209–249.
2. Craig AJ, von Felden J, Garcia-Lezana T, Sarcognato S, Villanueva A. Tumour evolution in hepatocellular carcinoma. Nat Rev Gastroenterol Hepatol. 2020;17(3):139–152.
3. Forner A, Reig M, Bruix J. Hepatocellular carcinoma. Lancet. 2018;391(10127):1301–1314.
4. Garrido A, Djouder N. Cirrhosis: a Questioned Risk Factor for Hepatocellular Carcinoma. Trends in Cancer. 2021;7(1):29–36.
5. West J, Card TR, Aithal GP, Fleming KM. Risk of hepatocellular carcinoma among individuals with different aetiologies of cirrhosis: a population-based cohort study. Aliment Pharmacol Ther. 2017;45(7):983–990.
6. Schwabe RF, Greten TF. Gut microbiome in HCC - Mechanisms, diagnosis and therapy. J Hepatol. 2020;72(2):230–238.
7. Tilg H, Burcelin R, Tremaroli V. Liver tissue microbiome in NAFLD: next step in understanding the gut-liver axis? Gut. 2020;69(8):1373–1374.
8. Sookoian S, Salatino A, Castano GO, et al. Intrahepatic bacterial metataxonomic signature in non-alcoholic fatty liver disease. Gut. 2020;69(8):1483–1491.
9. Xie J, Zhang A, Wang X. Metabolomic applications in hepatocellular carcinoma: toward the exploration of therapeutics and diagnosis through small molecules. RSC Adv. 2017;7(28):17217–17226.
10. Yu M, Zhu Y, Cong Q, Wu C. Metabonomics Research Progress on Liver Diseases. Can J Gastroenterol Hepatol. 2017;2017:8467192.
11. Luo P, Yin P, Hua R, et al. A Large-scale, multicenter serum metabolite biomarker identification study for the early detection of hepatocellular carcinoma. Hepatology. 2018;67(2):662–675.
12. Wang KX, Du GH, Qin XM, Gao L. 1H-NMR-based metabolomics reveals the biomarker panel and molecular mechanism of hepatocellular carcinoma progression. Anal Bioanal Chem. 2022;414(4):1525–1537.
13. Cao LL, Han Y, Wang Y, et al. Metabolic Profiling Identified a Novel Biomarker Panel for Metabolic Syndrome-Positive Hepatocellular Cancer. Front Endocrinol (Lausanne). 2021;12:816748.
14. Geyer PE, Holdt LM, Teupser D, Mann M. Revisiting biomarker discovery by plasma proteomics. Mol Syst Biol. 2017;13(9):942.
15. Chen H, Cai J, Wang J, et al. Targeting Nestin(+) hepatic stellate cells ameliorates liver fibrosis by facilitating TbetaRI degradation. J Hepatol. 2021;74(5):1176–1187.
16. Rosario SR, Long MD, Affronti HC, Rowsam AM, Eng KH, Smiraglia DJ. Pan-cancer analysis of transcriptional metabolic dysregulation using The Cancer Genome Atlas. Nat Commun. 2018;9(1):5330.
17. Lin JN, Lai CH, Yang CH, Huang YH. Elizabethkingia Infections in Humans: from Genomics to Clinics. Microorganisms. 2019;7:9.
18. Lei XP, Yi G, Wang KY, et al. Elizabethkingia miricola infection in Chinese spiny frog (Quasipaa spinosa). Transbound Emerg Dis. 2019;66(2):1049–1053.
19. Hwang JH, Kim J, Kim JH, Mo S. Elizabethkingia argenteiflava sp. nov., isolated from the pod of soybean, Glycine max. Int J Syst Evol Microbiol. 2021;71(4):548.
20. Ito T, Hori R, Hemmi H, Downs DM, Yoshimura T. Inhibition of glycine cleavage system by pyridoxine 5’-phosphate causes synthetic lethality in glyA yggS and serA yggS in Escherichia coli. Mol Microbiol. 2020;113(1):270–284.
21. Marrero JA, Lok AS. Newer markers for hepatocellular carcinoma. Gastroenterology. 2004;127(5 Suppl 1):S113–119.
22. Yang G, Zhou X, Wang J, et al. MEHP-induced oxidative DNA damage and apoptosis in HepG2 cells correlates with p53-mediated mitochondria-dependent signaling pathway. Food Chem Toxicol. 2012;50(7):2424–2431.
23. Zhu L, Duan P, Hu X, et al. Exposure to cadmium and mono-(2-ethylhexyl) phthalate induce biochemical changes in rat liver, spleen, lung and kidney as determined by attenuated total reflection-Fourier transform infrared spectroscopy. J Appl Toxicol. 2019;39(5):783–797.
24. Zakim D, Cantor M, Eibl H. Phospholipids and UDP-glucuronosyltransferase. Structure/function relationships. J Biol Chem. 1988;263(11):5164–5169.
25. Mazzini FN, Cook F, Gounarides J, et al. Plasma and stool metabolomics to identify microbiota derived-biomarkers of metabolic dysfunction-associated fatty liver disease: effect of PNPLA3 genotype. Metabolomics. 2021;17(7):58.
26. Sun Q, Weinger JG, Mao F, Liu G. Regulation of structural and functional synapse density by L-threonate through modulation of intraneuronal magnesium concentration. Neuropharmacology. 2016;108:426–439.
27. Pellanda H. Betaine homocysteine methyltransferase (BHMT)-dependent remethylation pathway in human healthy and tumoral liver. Clin Chem Lab Med. 2013;51(3):617–621.
28. Ueland PM. Choline and betaine in health and disease. J Inherit Metab Dis. 2011;34(1):3–15.
29. Liu ZY, Yishake D, Fang AP, et al. Serum choline is associated with hepatocellular carcinoma survival: a prospective cohort study. Nutr Metab (Lond). 2020;17:25.
30. Xie G, Wang X, Huang F, et al. Dysregulated hepatic bile acids collaboratively promote liver carcinogenesis. Int J Cancer. 2016;139(8):1764–1775.
31. Chen Y, Yu L, Wei Y, et al. D-ribose increases triglyceride via upregulation of DGAT in the liver. Sci China Life Sci. 2019;62(6):858–861.
32. Mustafa MF, Bano B. Glycation of Liver Cystatin: implication on its Structure and Function. J Fluoresc. 2016;26(5):1743–1753.
33. Rohr-Udilova N, Sieghart W, Eferl R, et al. Antagonistic effects of selenium and lipid peroxides on growth control in early hepatocellular carcinoma. Hepatology. 2012;55(4):1112–1121.
34. Sengupta A, Ghosh M. Comparison of native and capric acid-enriched mustard oil effects on oxidative stress and antioxidant protection in rats. Br J Nutr. 2012;107(6):845–849.
35. Lee EJ, Oh H, Kang BG, et al. Lipid-Lowering Effects of Medium-Chain Triglyceride-Enriched Coconut Oil in Combination with Licorice Extracts in Experimental Hyperlipidemic Mice. J Agric Food Chem. 2018;66(40):10447–10457.
36. Magnusson I, Chandramouli V, Schumann WC, Kumaran K, Wahren J, Landau BR. Pentose pathway in human liver. Proc Natl Acad Sci U S A. 1988;85(13):4682–4685.
37. Cheudjeu A. Correlation of D-xylose with severity and morbidity-related factors of COVID-19 and possible therapeutic use of D-xylose and antibiotics for COVID-19. Life Sci. 2020;260:118335.
38. Zhang X, Chen M, Ni X, et al. Metabolic Reprogramming of Sulfur in Hepatocellular Carcinoma and Sulfane Sulfur-Triggered Anti-Cancer Strategy. Front Pharmacol. 2020;11:571143.
39. Song N, Zhu Y, Cui Y, et al. Vitamin B and Vitamin C Affect DNA Methylation and Amino Acid Metabolism in Mycobacterium bovis BCG. Front Microbiol. 2020;11:812.
40. Cheng SB, Lin PT, Liu HT, Peng YS, Huang SC, Huang YC. Vitamin B-6 Supplementation Could Mediate Antioxidant Capacity by Reducing Plasma Homocysteine Concentration in Patients with Hepatocellular Carcinoma after Tumor Resection. Biomed Res Int. 2016;2016:7658981.
41. Cheng SB, Liu HT, Lin PT, Lai CY, Huang YC. Folate and vitamin B-6 status are not associated with homocysteine, oxidative stress and antioxidant capacities in patients with hepatocellular carcinoma. Eur J Clin Nutr. 2016;70(7):855–858.
42. Antwi SO, Petrick JL, Campbell PT, et al. One-carbon metabolism-related micronutrients intake and risk for hepatocellular carcinoma: a prospective cohort study. Int J Cancer. 2020;147(8):2075–2090.
43. Curto M, Lionetto L, Fazio F, Mitsikostas DD, Martelletti P. Fathoming the kynurenine pathway in migraine: why understanding the enzymatic cascades is still critically important. Intern Emerg Med. 2015;10(4):413–421.
44. Sadik A, Somarribas Patterson LF, Ozturk S, et al. IL4I1 Is a Metabolic Immune Checkpoint that Activates the AHR and Promotes Tumor Progression. Cell. 2020;182(5):1252–1270 e1234.
 © 2022 The Author(s). This work is published and licensed by Dove Medical Press Limited. The full terms of this license are available at https://www.dovepress.com/terms.php and incorporate the Creative Commons Attribution - Non Commercial (unported, v3.0) License.
By accessing the work you hereby accept the Terms. Non-commercial uses of the work are permitted without any further permission from Dove Medical Press Limited, provided the work is properly attributed. For permission for commercial use of this work, please see paragraphs 4.2 and 5 of our Terms.
© 2022 The Author(s). This work is published and licensed by Dove Medical Press Limited. The full terms of this license are available at https://www.dovepress.com/terms.php and incorporate the Creative Commons Attribution - Non Commercial (unported, v3.0) License.
By accessing the work you hereby accept the Terms. Non-commercial uses of the work are permitted without any further permission from Dove Medical Press Limited, provided the work is properly attributed. For permission for commercial use of this work, please see paragraphs 4.2 and 5 of our Terms.