Back to Journals » Journal of Pain Research » Volume 13
Visualization of Epidermal Reservoir Formation from Topical Diclofenac Gels by Raman Spectroscopy
Authors Zhang Q ![]() , Flach CR
, Flach CR ![]() , Mendelsohn R, Page L
, Mendelsohn R, Page L ![]() , Whitson S, Boncheva Bettex M
, Whitson S, Boncheva Bettex M
Received 13 April 2020
Accepted for publication 9 June 2020
Published 2 July 2020 Volume 2020:13 Pages 1621—1627
DOI https://doi.org/10.2147/JPR.S253069
Checked for plagiarism Yes
Review by Single anonymous peer review
Peer reviewer comments 2
Editor who approved publication: Professor Robert B. Raffa
Qihong Zhang,1 Carol R Flach,1 Richard Mendelsohn,1 Leanne Page,2 Susan Whitson,2 Mila Boncheva Bettex3
1Department of Chemistry, Rutgers University, Newark, NJ 07102, USA; 2Charles River Laboratories Edinburgh Ltd., Tranent, East Lothian, UK; 3GSK Consumer Healthcare S.A., Nyon 1 1260, Switzerland
Correspondence: Mila Boncheva Bettex
GSK Consumer Healthcare S.A., Route de l’Etraz 2, Case Postale 1279, Nyon 1260, Switzerland
Tel +41 79 700 9281
Email [email protected]
Purpose: This work investigated whether topical pain relief diclofenac gels can form a diclofenac reservoir in the epidermal and dermal layers of human skin.
Methods: Excised human skin samples were treated with three topical diclofenac gels ex vivo and examined using Raman microscopy of transversally microtomed sections. The relative diclofenac concentration in the skin layers was calculated as the ratio of the integrated areas of bands characteristic of diclofenac (∼ 445 cm− 1) and skin (Amide I). A customized masking algorithm ensured that only diclofenac-specific signal was mapped in the resulting Raman images.
Results: A heterogenous spatial distribution of diclofenac was clearly visible in both the epidermis and the dermis in all samples, with a markedly higher diclofenac relative content and number of pixels above the detection limit in the epidermis compared to the dermis.
Conclusion: The Raman images evidenced that the studied topical gels deliver diclofenac through the stratum corneum skin barrier and form a drug depot localized in the epidermis. The data are in line with earlier clinical findings that this depot acts like a true reservoir and enables sustained drug release.
Keywords: diclofenac, drug permeation, epidermal reservoir, Raman microscopy, skin depot, topical pain relief
Introduction
The first prerequisite of efficacious topical formulations is their ability to enable drug transport across the main skin barrier, the stratum corneum (SC). For topical products targeting sites of action situated underneath the skin, the formulation must also ensure favorable drug distribution throughout the viable skin layers and underlying tissues.1,2 A well-known example of such products is diclofenac-containing topical products with anti-inflammatory and pain-relief action targeting soft tissue or articulations. Their clinically proven efficacy has been attributed to their ability to deliver diclofenac across the skin barrier and to form an intradermal depot of diclofenac capable of sustaining extended drug release.1–3 The ability of diclofenac topicals to form a drug tissue reservoir is well known. It has been demonstrated using single-pass perfusion models combined with physiological pharmacokinetic modelling4 and supported using tape-stripping5 and in vivo animal models.6,7 The reservoir existence was further strengthened by clinical observations: the plasma levels of diclofenac were upheld throughout 24h after single post-steady state application and were measurable even after completion of a 14-day washout period.8,9 Its exact localization, however, is not fully understood.
While diclofenac retention within the SC is well documented (see for example5), it does not preclude additional sequestration and binding of the drug to constituents of the underlying epidermal and dermal layers,10,11 interactions dependent largely on co-penetrating formulation excipients. While it is possible to quantify the diclofenac content in each skin layer by time-consuming and technically challenging differential extraction, this methodology cannot evidence the depth distribution of the drugs within the layers, information crucial to provide insight in the excipient-dependent transport and partitioning of the drug.12
This paper reports the direct visualization of diclofenac skin distribution following application of three different topical gels. The formation of an epidermal diclofenac reservoir by the gels was demonstrated using Raman microscopy of transversally microtomed human skin samples ex vivo.
Materials and Methods
Topical Diclofenac Gels
Table 1 shows the composition of the three commercial products used in the study (Voltaren Sodium Gel 1%, Voltaren Emulgel 1.16%, and Voltaren Emulgel 2.32% denoted further as V1% DNa, V1.16% DDEA, and V2.32% DDEA, respectively).
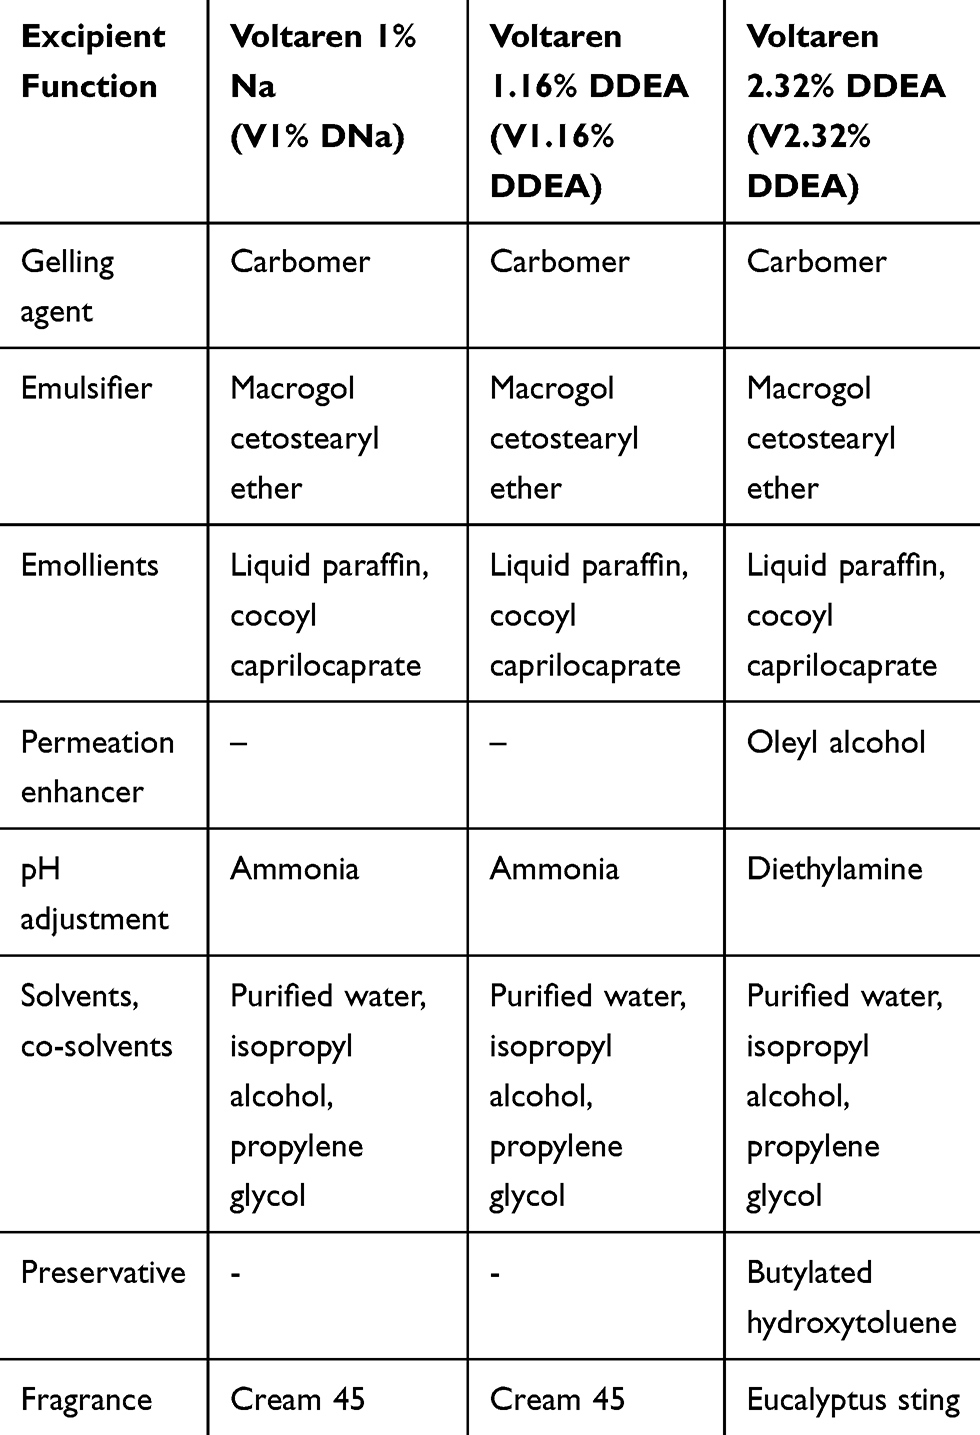 |
Table 1 Composition of the Three Topical Gels Used in the Study |
Skin Sample Preparation
Full-thickness, abdominal, Caucasian human skin samples were obtained from 8 patients (6 female and 2 male, aged 31 to 64 years) attending the Plastic Surgery Unit of St John’s Hospital (Livingston, Scotland UK) or from tissue banks (Biorepository, NHS Glasgow & Clyde, Glasgow, UK and Tissue Solutions, Glasgow, Scotland, UK) and stored at −20 °C until use. All donors have provided a written informed consent for skin sample collection which was performed in accordance with the Declaration of Helsinki. Ethical approval for receipt and use of human skin by Biorepository, NHS Glasgow & Clyde was obtained from Glasgow Royal Infirmary REC (Ethical approval number: 08/S0704/30) and for Plastic Surgery Unit of St John’s Hospital from Lothian Local Research Ethics Committee (Ethical approval number: 06/S1101/19). All sources that supply skin to Tissue Solutions have certified that Ethical Approval has been put in place. Split-thickness membranes (350–400 μm) were prepared using an electric dermatome (Zimmer Ltd., Swindon, SN2 4FP, UK). Treated samples were generated using PermaGear diffusion cells having an exposure area of 0.64 cm2, a receptor compartment volume of 5 mL filled with phosphate buffered saline containing bovine serum albumin (5% w/v), and maintaining a skin surface temperature of 32 ± 1 °C. The barrier function of all skin samples was confirmed by measuring the electrical resistance before the start of the experiment;13 in experiments using formulations of low diclofenac content (V1% DNa and V1.16% DDEA), a range of electrical resistance was used to reduce the impact of the normal skin variability and to ensure the barrier function was similar across all dosed samples. The products were applied to the skin surface according to their maximal recommended daily doses: 40 mg/cm2 for V1% DNa and V1.16% DDEA, and 20 mg/cm2 for V2.32% DDEA. Following a 24-hour incubation, the exposed skin was isolated using a biopsy punch, snap-frozen in liquid nitrogen as flat as possible, and stored at a temperature of −80 ºC for less than three months before being used for imaging. Sections were microtomed perpendicular to the skin surface to a thickness of ca 200 µm and placed on wet filter paper supported by a microscope slide; a glass coverslip was placed on top. This protocol was essential to maintain sample hydration and fidelity during Raman measurements.
Raman Measurements and Data Analysis
A WITec Alpha-300R Plus confocal Raman microscope (Ulm, Germany) equipped with a 785 nm excitation laser (~105mW of power) and a 100x oil immersion objective (NA 1.25) was used for all measurements. An exposure time of 30 s was used for collecting all images. Despite the theoretically high lateral spatial resolution of the microscope objective, a 2-µm step-size between spectra was employed for all images. In practice, factors such as rapidly changing refractive index gradients at multiple interfaces both in the tissue and in the Raman microscope degrade the spatial resolution. In addition, to prevent sample destruction by local heating, the stage was continually moving in the x-direction while collecting data so that each spectrum was averaged over the ~2µm pixel dimension. The overall image sizes varied as indicated by the scale bars in each figure.
Raman images were analyzed using WITec Project FOUR Plus software version 4.1. Initial data treatment included cosmic ray removal and baseline correction. The integrated area of peaks (sum) and intensity at peak maxima (max) were generated. Ratios of various spectral parameters were obtained. Control spectra of untreated skin, diclofenac powders, formulations, and placebo formulations are shown in Figure 1A and B. Upon comparison of all spectra, it became obvious that the peak at ~445 cm−1 was best suited for diclofenac detection in skin following application of each formulation. Relative diclofenac concentration was reported as the integrated band area ratio of the diclofenac ~445 cm−1 band/skin Amide I band (both marked in Figure 1). The ratio accounts for variations in the sampling parameters.
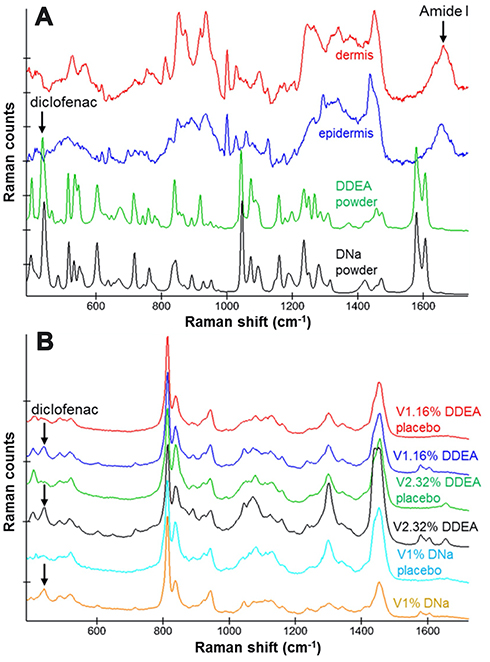 |
Figure 1 Raman spectra of controls (A) untreated dermis, untreated epidermis, DDEA powder, DNa powder and (B) placebo and diclofenac-containing formulations. The skin Amide I band is marked in (A), and the diclofenac marker band at ~445 cm−1 – in both (A) and (B). |
A signal to noise (S/N) filter was devised based on the ratio of the intensity of the Amide I band to the average intensity of the noise in a peak-free wavenumber region (1800–1900 cm−1). Spectra with S/N < 10 were excluded in all images shown herein.
Cluster analysis (Project FOUR Plus software: k-means, Euclidian normalization and distance mode with a minimum number of clusters) was used to delineate the dermal-epidermal junction (DEJ) in the images. The analysis created a binary mask and an average spectrum for each cluster. The demarcation was based to a significant extent on differences in the 820–990 cm−1 spectral region between keratin (epidermis) and collagen (dermis) where collagen displays a well-known doublet-of-doublets pattern (see Figure 1A). The position of the DEJ is marked by a horizontal white line in all images.
Upon comparison of untreated and treated skin images, additional masking was found to be necessary due to the very low intensity of the diclofenac-specific signal in the deeper regions of the viable epidermis (VE) and dermis. Thus, detection limits for relative diclofenac concentrations in these skin regions were established to avoid false-positive identification of diclofenac. Based on the images of the untreated controls, relative diclofenac detection limits of 0.06 and 0.002 in the VE and dermis, respectively, were used to mask the images in the respective regions. As an example, Figure 2 shows Raman images of relative diclofenac concentration in an untreated skin section before and after application of the VE detection limit mask. As is evident in the Figure, application of the VE mask removed essentially all pixels where the initial tentative detection of diclofenac was in fact below the limit of statistical significance and ensured that only diclofenac-specific signal was mapped in the Raman images.
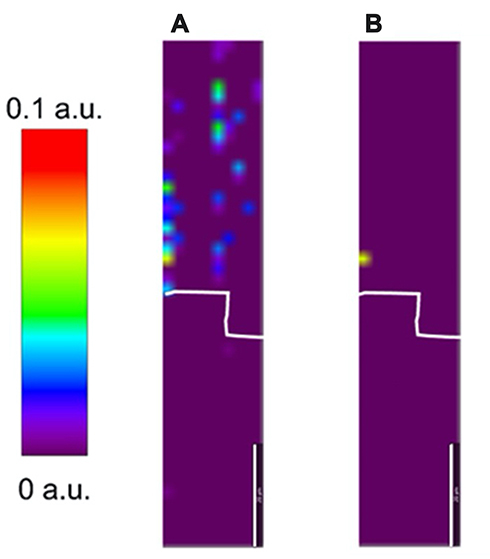 |
Figure 2 Raman images of the relative diclofenac concentration in untreated skin sections before (A) and after (B) application of the detection limit VE mask. The VE (top) and dermal (bottom) regions are delineated in the images by a white line indicating the position of DEJ. Scale bar, 20 µm. |
Results
Figure 3A-C shows Raman images of relative diclofenac concentration obtained from skin treated with V1% DNa, V1.16% DDEA and V2.32% DDEA, respectively. A heterogenous spatial distribution of diclofenac is clearly visible in both the VE and the dermis in all samples, with a markedly higher diclofenac relative content and number of pixels above the detection limit in the VE compared to the dermis.
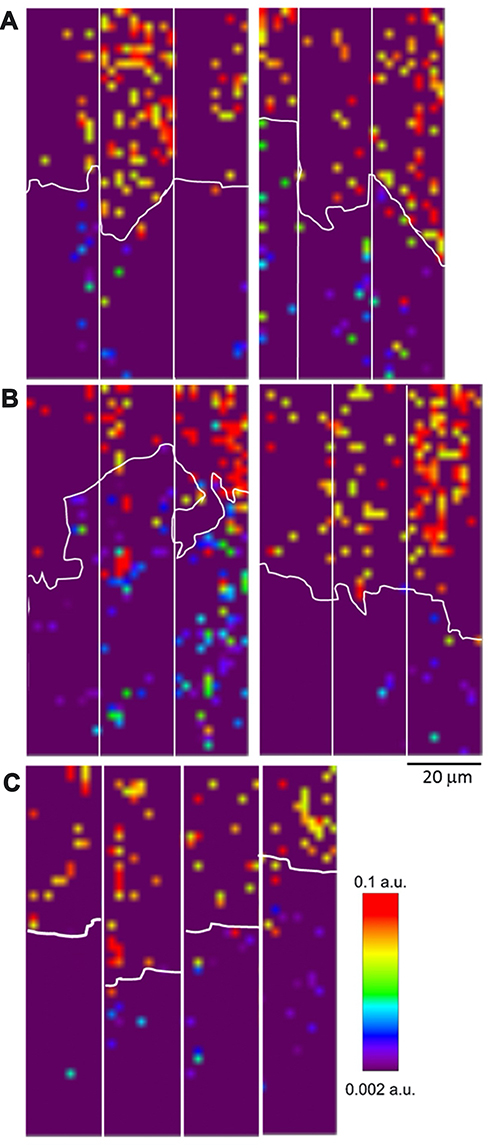 |
Figure 3 Raman images of the relative diclofenac concentration in skin treated with V1% DNa (A), V1.16% DDEA (B), and V2.32% DDEA (C). The horizontal white line indicates the location of DEJ, with the VE situated above and the dermis – below the line. The images in (A) and (B) were collected from two different skin donors (three images per donor), and those in (C) – from four different skin donors (one image per donor, different donors than those used in (A) and (B)). |
To firm up these observations, we also examined spectra extracted from the pixels in which diclofenac was detected in the VE and dermis.
Figure 4A-C shows average spectra obtained from all pixels in which diclofenac was detected within the VE, with a grey box highlighting the region used to obtain the integrated area of the diclofenac peak. Inspection of this region revealed a well-defined, broad band, confirming the data visualized in Figure 3.
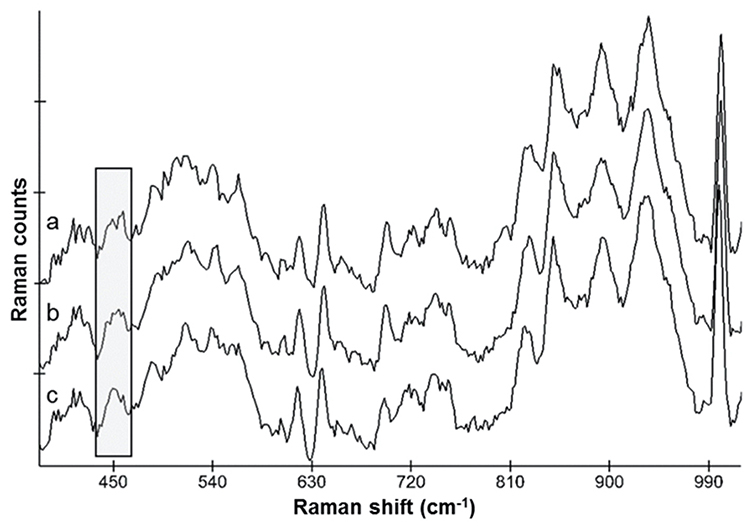 |
Figure 4 Overlaid average spectra of pixels where diclofenac was detected in the viable epidermis of skin treated with V1% DNa (a), V1.16% DDEA (b), and V2.32% DDEA (c) (average of all donors shown in Figure 3 A–C, respectively). The grey shaded bar highlights the region of the marker diclofenac peak. |
Because of the overall low relative content of diclofenac observed in the dermis (Figure 3), we examined spectra extracted from individual pixels instead of averaging across the entire dermis. Figure 5A-C shows several overlaid single pixel spectra from the dermis of samples treated with V1% DNa, V1.16% DDEA and V2.32% DDEA formulations, respectively. The spectra revealed a characteristic band within the spectral region used for diclofenac detection (highlighted with a grey box).
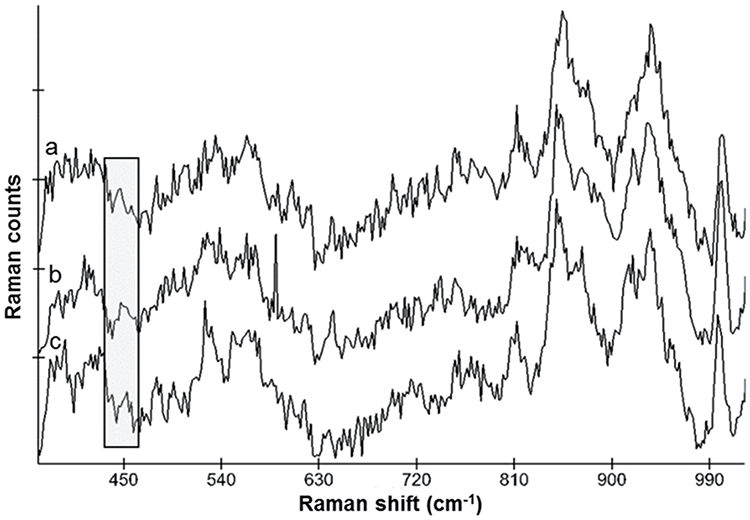 |
Figure 5 Overlaid single pixel spectra from dermal regions of skin treated with V1% DNa (a), V1.16% DDEA (b), and V2.32% DDEA (c) formulations. The grey shaded bar highlights the region of the marker diclofenac peak. |
Discussion
The reliable application of the imaging approach we present here was made possible by implementing a rigorous data treatment algorithm to eliminate the risk of false-positive identification of diclofenac. The data shown in Figures 1 and 2 confirm that all Raman images collected from treated samples reflect exclusively signal originating from diclofenac.
The images shown in Figure 3 demonstrate that topical application of the three gels enables diclofenac to cross the SC skin barrier and to be partially retained in the VE as a reservoir.
Additional confirmation of the presence and relative content of diclofenac in the VE and dermis was obtained by examining averaged or individual pixel spectra extracted from these layers (Figures 4 and 5). The spectral characteristics – position, width, and overall shape – of the bands observed at ~445 cm−1 confirm the presence of diclofenac throughout the skin thickness. The relative intensity of these bands was considerably higher in spectra collected in the VE compared to the dermis, indicating higher drug concentrations in the epidermal reservoir and lower ones in the dermis (close to the detection limit).
Evidently, the extent of drug binding in the dermis is considerably lower compared to the VE, which in turn may explain why passive drug diffusion through skin towards the site of action is not slowed down.1 In vivo, additional factors (eg, convection through the local vasculature) may aid its transport towards muscles and joints.14
Conclusions
Taken together, the data presented here indicate that the three topical gels enable both diclofenac penetration through the SC skin barrier and the formation of a diclofenac reservoir in the viable epidermis. These observations are in line with the clinically observed upheld diclofenac plasma levels throughout 24h after single dosing post-steady state and even after a 14-day washout8,9 – findings which indicate that the reservoir is capable of sustaining extended drug release.
In this proof of principle study, we did not attempt to compare quantitatively the magnitude of the epidermal reservoir between formulations in view of the low number of donors and samples per donor imaged. It is safe to conclude, however, that the reservoir contains only a fraction of the topically applied drug since all three formulations have been shown to sustain a transdermal diclofenac flux ex vivo (reviewed in1). Even more importantly, their clinically proven pain- and inflammation-relieving action is a further proof that therapeutically-relevant amounts of the drug can reach the tissues underlying the skin layers.
It was intriguing to find the diclofenac reservoir localized almost exclusively in the epidermis, even in the absence of functioning blood circulation promoting dermal clearance.10 Further work is needed to establish the formulation-dependent differential binding of diclofenac to the epidermal and dermal constituents, a factor that can skew skin retention predictions based on blood clearance alone.
The need for accurate and reproducible methods to effectively analyze topical drug delivery has been highlighted in recent years by industry and regulatory authorities alike.15 The availability of such methodologies is expected to drive the development of highly performing and broadly accessible topical products whose formulations can deliver the drug at the right place, in the right amount, for the right duration of time. The most recent push in this direction came earlier this year with the announced grant by the US Food and Drug Administration (FDA) supporting the development of Raman spectroscopy and mass spectrometry imaging methods to determine the rate and extent at which topically administered drugs become available at their site of action within the skin.16 Our proof of principle study suggests that Raman spectroscopic imaging can be applied also to assess topical formulations of drugs whose site of action is located beneath the skin, in soft tissues and articulations. The data shown here demonstrate that it provides easy to interpret visuals evidencing the ability of diclofenac formulations to form reservoir of the drug within the skin and its localization.
In principle, the methodology is applicable to both ex vivo treated skin explants and skin biopsies ensuing from clinical treatment. We believe that its future application in time-resolved studies would help understanding the composition-dependent correlations between the magnitude of the epidermal reservoir, the kinetics of its maintenance, and the formulation efficacy – insights that can drive the successful design of efficacious next-gen topical pain relief products. Furthermore, this work lends additional support to the possibility of using Raman imaging as a tool to evaluate the bioequivalence of topical pain relief products.15
Acknowledgment
We thank Clive Roper for his insightful comments on the manuscript.
Author Contributions
All authors made substantial contributions to the study conception and design, acquisition of data, and analysis and interpretation of data; took part in drafting the article and revising it critically for important intellectual content; gave final approval of the version to be published; and agree to be accountable for all aspects of the work.
Disclosure
Mila Boncheva Bettex is an employee of GSK Consumer Healthcare S.A. Skin samples were contracted to Charles River Laboratories in studies directed by Leanne Page and Susan Whitson. The spectroscopic work was contracted to Rutgers University and performed by Qihong Zhang, Carol R. Flach, and Richard Mendelsohn. This work was funded by GSK Consumer Healthcare S.A. The authors report no other conflicts of interest in this work.
References
1. Hagen M, Baker M. Skin penetration and tissue permeation after topical administration of diclofenac. Curr Med Res Opinion. 2017;33(9):1623–1634. doi:10.1080/03007995.2017.1352497
2. Lionberger DR, Brennan MJ. Topical nonsteroidal anti-inflammatory drugs for the treatment of pain due to soft tissue injury: diclofenac epolamine topical patch. J Pain Res. 2010;4:47–53.
3. Goh CF, Lane M. Formulation of diclofenac for dermal delivery. Int J Pharmaceut. 2014;473(1–2):607–616. doi:10.1016/j.ijpharm.2014.07.052
4. Roberts MS, Cross SE. A physiological pharmacokinetic model for solute disposition in tissues below a topical application site. Pharm Res. 1999;16:1392–1398. doi:10.1023/A:1018998908655
5. Cordery SF, Pensado A, Chiu WS, et al. Topical bioavailability of diclofenac from locally-acting, dermatological formulations. Int J Pharmaceut. 2017;529(1–2):55–64. doi:10.1016/j.ijpharm.2017.06.063
6. Clijsen R, Baeyens JP, Barel AO, Clarys P. In vivo determination of the diclofenac skin reservoir: comparison between passive, occlusive, and iontophoretic application. Drug Design Dev Ther. 2015;9:835–840. doi:10.2147/DDDT.S76002
7. Tse S, Powell KD, Maclennan SJ, Moorman AR, Paterson C, Bell RR. Skin permeability and pharmacokinetics of diclofenac epolamine administered by dermal patch in Yorkshire-Landrace pigs. J Pain Res. 2012;5:401–408. doi:10.2147/JPR.S35450
8. Kienzler J-L, Gold M, Nollevaux F. Systemic bioavailability of topical diclofenac sodium gel 1% versus oral diclofenac sodium in healthy volunteers. J Clin Pharmacol. 2010;50(1):50–61. doi:10.1177/0091270009336234
9. Sioufi A, Pommier F, Boschet F, Godbillon J, Lavoignat D, Salliere D. Percutaneous absorption of diclofenac in healthy volunteers after single and repeated topical application of diclofenac Emulgel. Biopharmaceut Drug Disposition. 1994;15(6):441–449. doi:10.1002/bdd.2510150602
10. Jepps OG, Dancik Y, Anissimov YG, Roberts MS. Modeling the human skin barrier–towards a better understanding of dermal absorption. Adv Drug Deliv Rev. 2013;65:152–168. doi:10.1016/j.addr.2012.04.003
11. Roberts MS, Cross SE, Anissimov YG. Factors affecting the formation of a skin reservoir for topically applied solutes. Skin Pharmacol Physiol. 2004;17(1):3–16. doi:10.1159/000074057
12. Haque T, Rahman KM, Thurston DE, Hadgraft J, Lane M. Topical delivery of anthramycin II. Influence of binary and ternary solvent systems. Eur J Pharm Sci. 2018;121:59–64. doi:10.1016/j.ejps.2018.05.002
13. Blackstock C. Evaluation of Electrical Resistance for Use as a Rapid Method for Human Skin Barrier Integrity Assessment in the Flow-Through Diffusion Cell. Charles River Laboratories; 2012.
14. Dancik Y, Anissimov YG, Jepps OG, Roberts MS. Convective transport of highly plasma protein bound drugs facilitates direct penetration into deep tissues after topical application. Br J Clin Pharmacol. 2011;73(4):564–578. doi:10.1111/j.1365-2125.2011.04128.x
15. European Medicines Agency (EMA). Draft guideline on quality and equivalence of topical products. 2018. Available from https://www.ema.europa.eu/en/quality-equivalence-topical-products.
16. National Physical Laboratory (NPL) UK. A team of leading scientists granted research funding to use advanced tools for assessment of drug delivery to the skin. 2020. Available from https://www.npl.co.uk/news/scientists-receive-funding-from-fda.
 © 2020 The Author(s). This work is published and licensed by Dove Medical Press Limited. The
full terms of this license are available at https://www.dovepress.com/terms
and incorporate the Creative Commons Attribution
- Non Commercial (unported, 3.0) License.
By accessing the work you hereby accept the Terms. Non-commercial uses of the work are permitted
without any further permission from Dove Medical Press Limited, provided the work is properly
attributed. For permission for commercial use of this work, please see paragraphs 4.2 and 5 of our Terms.
© 2020 The Author(s). This work is published and licensed by Dove Medical Press Limited. The
full terms of this license are available at https://www.dovepress.com/terms
and incorporate the Creative Commons Attribution
- Non Commercial (unported, 3.0) License.
By accessing the work you hereby accept the Terms. Non-commercial uses of the work are permitted
without any further permission from Dove Medical Press Limited, provided the work is properly
attributed. For permission for commercial use of this work, please see paragraphs 4.2 and 5 of our Terms.