Back to Journals » Diabetes, Metabolic Syndrome and Obesity » Volume 17
Visceral Fat Area and Subcutaneous Fat Area Increase in Hyperthyroidism Patients After Treatment—A Single-Group Repeated-Measures Trial
Authors Li M ![]() , Yang X, Li R, Wu B, Hao J, Qi Y
, Yang X, Li R, Wu B, Hao J, Qi Y ![]() , Bai T, Yang L, Zhang Y
, Bai T, Yang L, Zhang Y ![]() , Liu Y
, Liu Y ![]()
Received 19 February 2024
Accepted for publication 20 May 2024
Published 27 May 2024 Volume 2024:17 Pages 2165—2176
DOI https://doi.org/10.2147/DMSO.S458486
Checked for plagiarism Yes
Review by Single anonymous peer review
Peer reviewer comments 2
Editor who approved publication: Prof. Dr. Antonio Brunetti
Mengnan Li,1,2,* Xifeng Yang,1,2,* Ru Li,1,2 Baofeng Wu,1,2 Jinxuan Hao,1,2 Yijie Qi,1,2 Tao Bai,1 Luyang Yang,1 Yi Zhang,3 Yunfeng Liu1,4
1Department of Endocrinology, First Hospital of Shanxi Medical University, Taiyuan, People’s Republic of China; 2First Clinical Medical College, Shanxi Medical University, Taiyuan, People’s Republic of China; 3Department of Pharmacology, Shanxi Medical University, Taiyuan, People’s Republic of China; 4Clinical Research Center of Endocrine and Metabolic Diseases in Shanxi Medical University, Taiyuan, Shanxi, 030001, People’s Republic of China
*These authors contributed equally to this work
Correspondence: Yunfeng Liu, Department of Endocrinology, First Hospital of Shanxi Medical University, Taiyuan, People’s Republic of China, Email [email protected] Yi Zhang, Department of Pharmacology, Shanxi Medical University, Taiyuan, People’s Republic of China, Email [email protected]
Purpose: There is evidence that long-term vascular risk remains increased in patients with hyperthyroidism even after normalization of thyroid function, and the mechanisms that regulate this risk are unclear. The aim of this study was to assess how visceral fat area and subcutaneous fat area change after hyperthyroidism treatment, and to further explore the relationship between thyroid hormones, abdominal fat area (visceral fat area and subcutaneous fat area), and lipids.
Patients and Methods: 50 patients with newly diagnosed Graves’ disease were selected. Anthropometric parameters (weight, height, body mass index, waist circumference, neck circumference), laboratory parameters (thyroid hormones, lipid metabolism indices), abdominal fat area (visceral fat area and subcutaneous fat area), and drug dose were collected. Measurements were made at baseline, 6 and 12 months after treatment. We used linear mixed-effects models for analysis.
Results: The results showed that the following indexes changed significantly at different time points: visceral fat area, subcutaneous fat area, free triiodothyronine, free thyroxine, thyroid stimulating hormone, total cholesterol, high-density lipoprotein, low-density lipoprotein, body weight, neck circumference, body mass index, waist circumference, and drug dose (All P< 0.001). We found that free triiodothyronine and free thyroxine were significantly negatively associated with abdominal fat area (P< 0.01). There was no significant correlation between drug dose and abdominal fat area (P> 0.05). Total cholesterol and low-density lipoprotein were significantly positively associated with abdominal fat area (P< 0.01). However, high-density lipoprotein (P=0.06) was not correlated with abdominal fat area. Moreover, the results showed a significant negative correlation between thyroid hormones and lipids (P< 0.001).
Conclusion: After anti-thyroid medicine treatment, patients had elevated visceral fat area and subcutaneous fat area and altered lipid profiles. These changes may be one of the reasons why metabolic and cardiovascular diseases remain increased after thyroid function is restored.
Keywords: visceral fat area, subcutaneous fat area, thyroid hormones, lipids, Graves’ disease
A Letter to the Editor has been published for this article.
Introduction
The incidence of hyperthyroidism is on the rise, and the age of onset is gradually advancing. Graves’ disease (GD) is the most common type of hyperthyroidism, and its pathogenesis is complex. The thyroid stimulating hormone (TSH) receptor antibody is the ultimate cause of GD. These antibodies bind to TSH receptors on the surface of thyroid follicular cells, resulting in excessive secretion of thyroid hormones (THs) and increased multisystem excitability and hypermetabolism.1 The typical manifestation of hyperthyroidism is palpitation, shaking hands, fatigue, a strong appetite but weight loss, and other symptoms. For patients with hyperthyroidism, anti-thyroid drugs (especially methimazole) are the main choice of treatment at present.2 Most of the above symptoms will be relieved after treatment of hyperthyroidism.
Studies have clearly shown a significant increase in cardiovascular morbidity and mortality in patients with hyperthyroidism because thyroid receptors are also present on cardiomyocytes and vascular endothelial cells and are sensitive to changes in the concentration of THs.3 Overproduction of THs can lead to increased heart rate, a hyperdynamic state of circulation, and even cardiovascular disease (CVD) such as atrial fibrillation.4 These changes are reversible with regular treatment. However, there is evidence that long-term vascular risk remains increased even after normalization of thyroid function.5 A study evaluating the rate of hospitalizations and mortality due to CVD in patients with hyperthyroidism after surgery showed that all hospitalizations due to CVD, hypertension, heart failure, valvular disease, and cardiomyopathy remained more common 10 years after thyroidectomy6,7 and could persist up to 20 years after effective surgical treatment. Similarly, compared with the general population, patients with hyperthyroidism treated with radioactive iodine or with antithyroid drugs continue to have increased cardiovascular morbidity and CVD mortality for decades, even if their final THs levels return to normal.8–11 These evidences suggest that regardless of treatment, the risk of CVD remains high even after thyroid function modification. The mechanisms mediating this risk are not yet clear.
Previous studies have shown that the weight gain after treatment of hyperthyroidism is mainly the increase of muscle content,12 but recent studies have suggested that the weight gain may be related to the increase of visceral and subcutaneous fat.13 A study have further pointed out that THs has some effect on abdominal visceral fat and subcutaneous fat.14 Visceral fat is an important risk factor for CVD. The increased visceral fat can lead to insulin resistance and hyperinsulinemia.15 In addition to being associated with glucose metabolism, the visceral fat area (VFA) is positively associated with hypertension and dyslipidemia.5 Some experiments have demonstrated that the ratio of VFA to body fat mass is a better predictor of coronary heart disease.16 In contrast, the increase in subcutaneous fat is more likely to cause diabetes, because subcutaneous fat releases free fatty acids into the circulation, and elevated levels of free fatty acids are associated with insulin resistance.17,18
Therefore, we hypothesized that the increased incidence of CVD after treatment of hyperthyroidism would be associated with increased VFA or subcutaneous fat area (SFA). We collected abdominal fat area parameters, laboratory parameters, and anthropometric parameters in patients with GD at baseline, and 6 and 12 months of follow-up, respectively. The aim of this study was to investigate the changes of these parameters over time and to further investigate the correlation between serum lipids, THs and abdominal fat area.
Materials and Methods
The present study was performed as a single group pre-test–posttest semi-experimental design.
Subjects
50 patients with newly diagnosed GD who attended the Department of Endocrinology of the First Hospital of Shanxi Medical University in July 2022 were selected. The diagnosis of GD was based on the presence of thyrotoxicosis with positive thyrotropin (TSH) receptor antibodies with or without thyroid enlargement.19 All patients were treated with methimazole for 1 year. Dose adjustments of methimazole were performed by each patient’s physician. Exclusion criteria included age <18 or >75 years; transient thyrotoxicosis due to destructive thyroiditis; athletes, fitness trainers; suffering from diseases affecting the indexes of the study investigations, such as Cushing’s syndrome, malignant neoplasms, nephrotic syndrome, etc; taking medications affecting lipids and thyroid function, such as glucocorticoids, amiodarone, lipid-lowering medications, weight-loss medications, etc; suffering from severe cardiac, hepatic, renal, brain and other chronic diseases; being in the active stage of chronic diseases, surgery, trauma and other stressful situations; the existence of mental illness diagnosis or physical disability, who can not cooperate with the examination.
Anthropometric and Laboratory Parameters
General information of all subjects was collected, including age, sex, height, weight, waist circumference, neck circumference. Body mass index (BMI) was calculated by dividing the weight (kg) by the square of height (m2). After fasting for at least 8 hours, venous blood was drawn from the anterior elbow early the next morning to measure free triiodothyronine (FT3), free thyroxine (FT4), TSH, total cholesterol (TC), low-density lipoprotein (LDL), high-density lipoprotein (HDL), triglyceride (TG). FT3, FT4 and TSH were measured by chemiluminescence immunoassay (Abbott I2000, Abbott Reagent).
Abdominal Fat Area Parameters
In this study, we applied Bioelectrical impedance analysis (BIA) to evaluate the distribution of abdominal adipose tissue in hyperthyroid patients. BIA is easy to perform, saves time, and has no risk of radiation exposure. Several studies have demonstrated significant correlation between BIA measurements and CT and MRI.20,21 The abdominal SFA and VFA were measured by dual BIA using the visceral fat detection device DUALSCAN HDS-2000 (Omron, Japan). The subjects were fasted for at least 8 hours before the examination, and the abdomen was exposed while lying on the examination bed. Breath-holding was required during the measurement. First, the overall cross-sectional area of the abdomen was measured using the abdominal detection unit, then the electrode belt and limb electrode clips were installed, and the subjects were instructed to hold their breath again, and the abdominal SFA and VFA were measured in cm2.
Statistical Analysis
SPSS27.0 software was used to analyze the data. Kurtosis and skewness tests were used to test the normal distribution of the data. Data conforming to normal distribution were described by mean and standard deviation (SD). Non-normal distribution was described by median and quartile [q25, q75]. We used linear mixed-effects models to compare means for repeated measures (before the intervention and at 6 and 12 months after the intervention). Bonferroni corrections were used for post hoc comparisons when significant interactions were found in linear mixed effects models. Furthermore, we used this model to investigate the effects of THs and lipids on SFA and VFA in hyperthyroidism patients during treatment. Similarly, we also explored the effect of THs on lipids. In all models, sex and age were controlled. p<0.05 was considered significant.
Results
50 patients completed 6 - and 12-month follow-up. The mean age was 39.02 years (13.27) and the age range was 19–74. Of the 50 patients, 45 (90%) were female. The mean waist circumference of the 50 patients was 80.78 cm (9.94), the mean neck circumference was 33.57 cm (3.20), the weight was 59.02 kg (11.11), and the height was 162c m (0.07). The average initial dose of methimazole is 16.90mg (5.04). There were no reports of abnormal or spontaneous adverse events in this study. Baseline demographic and clinical characteristics are shown in Table 1.
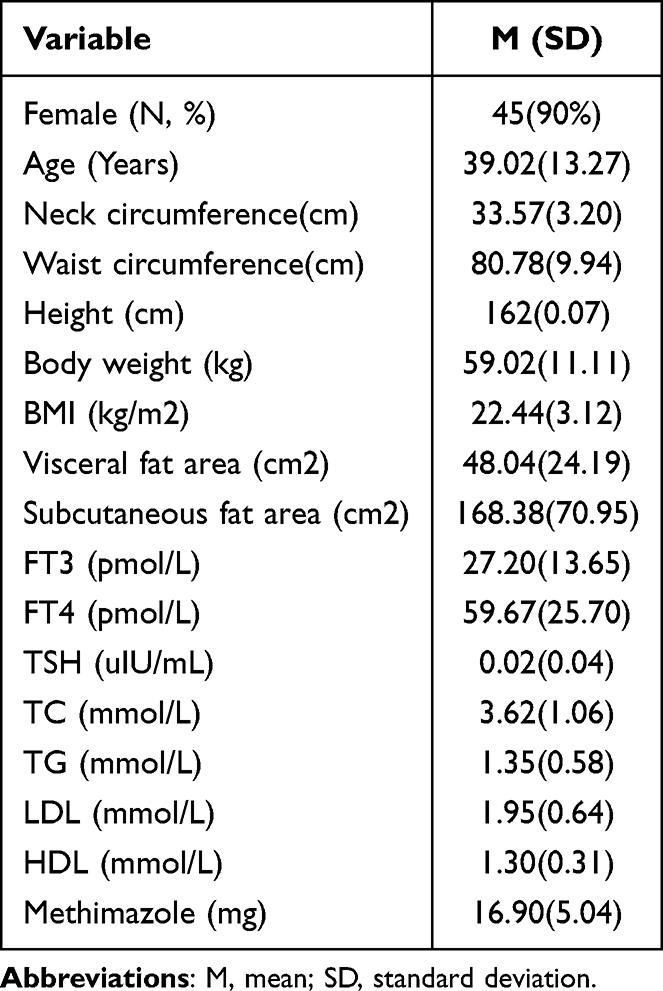 |
Table 1 Baseline Demographic and Clinical Characteristics (n = 50) |
For the abdominal fat area parameters, the results of the linear mixed-effects model showed an increase in both SFA (F = 21.38, p < 0.001) (Figure 1A) and VFA (F = 23.45, p < 0.001) (Figure 1B) after treatment for hyperthyroidism. The results of the Bonferroni post hoc test showed that the values at 6 and 12 months after treatment were all significantly higher than the values before treatment (T1<T2,T1<T3, All P<0.001), but there were no statistically significant differences between 6 months and 12 months after intervention (T2 and T3) (All P >0.05) (Table 2) (Figure 1).
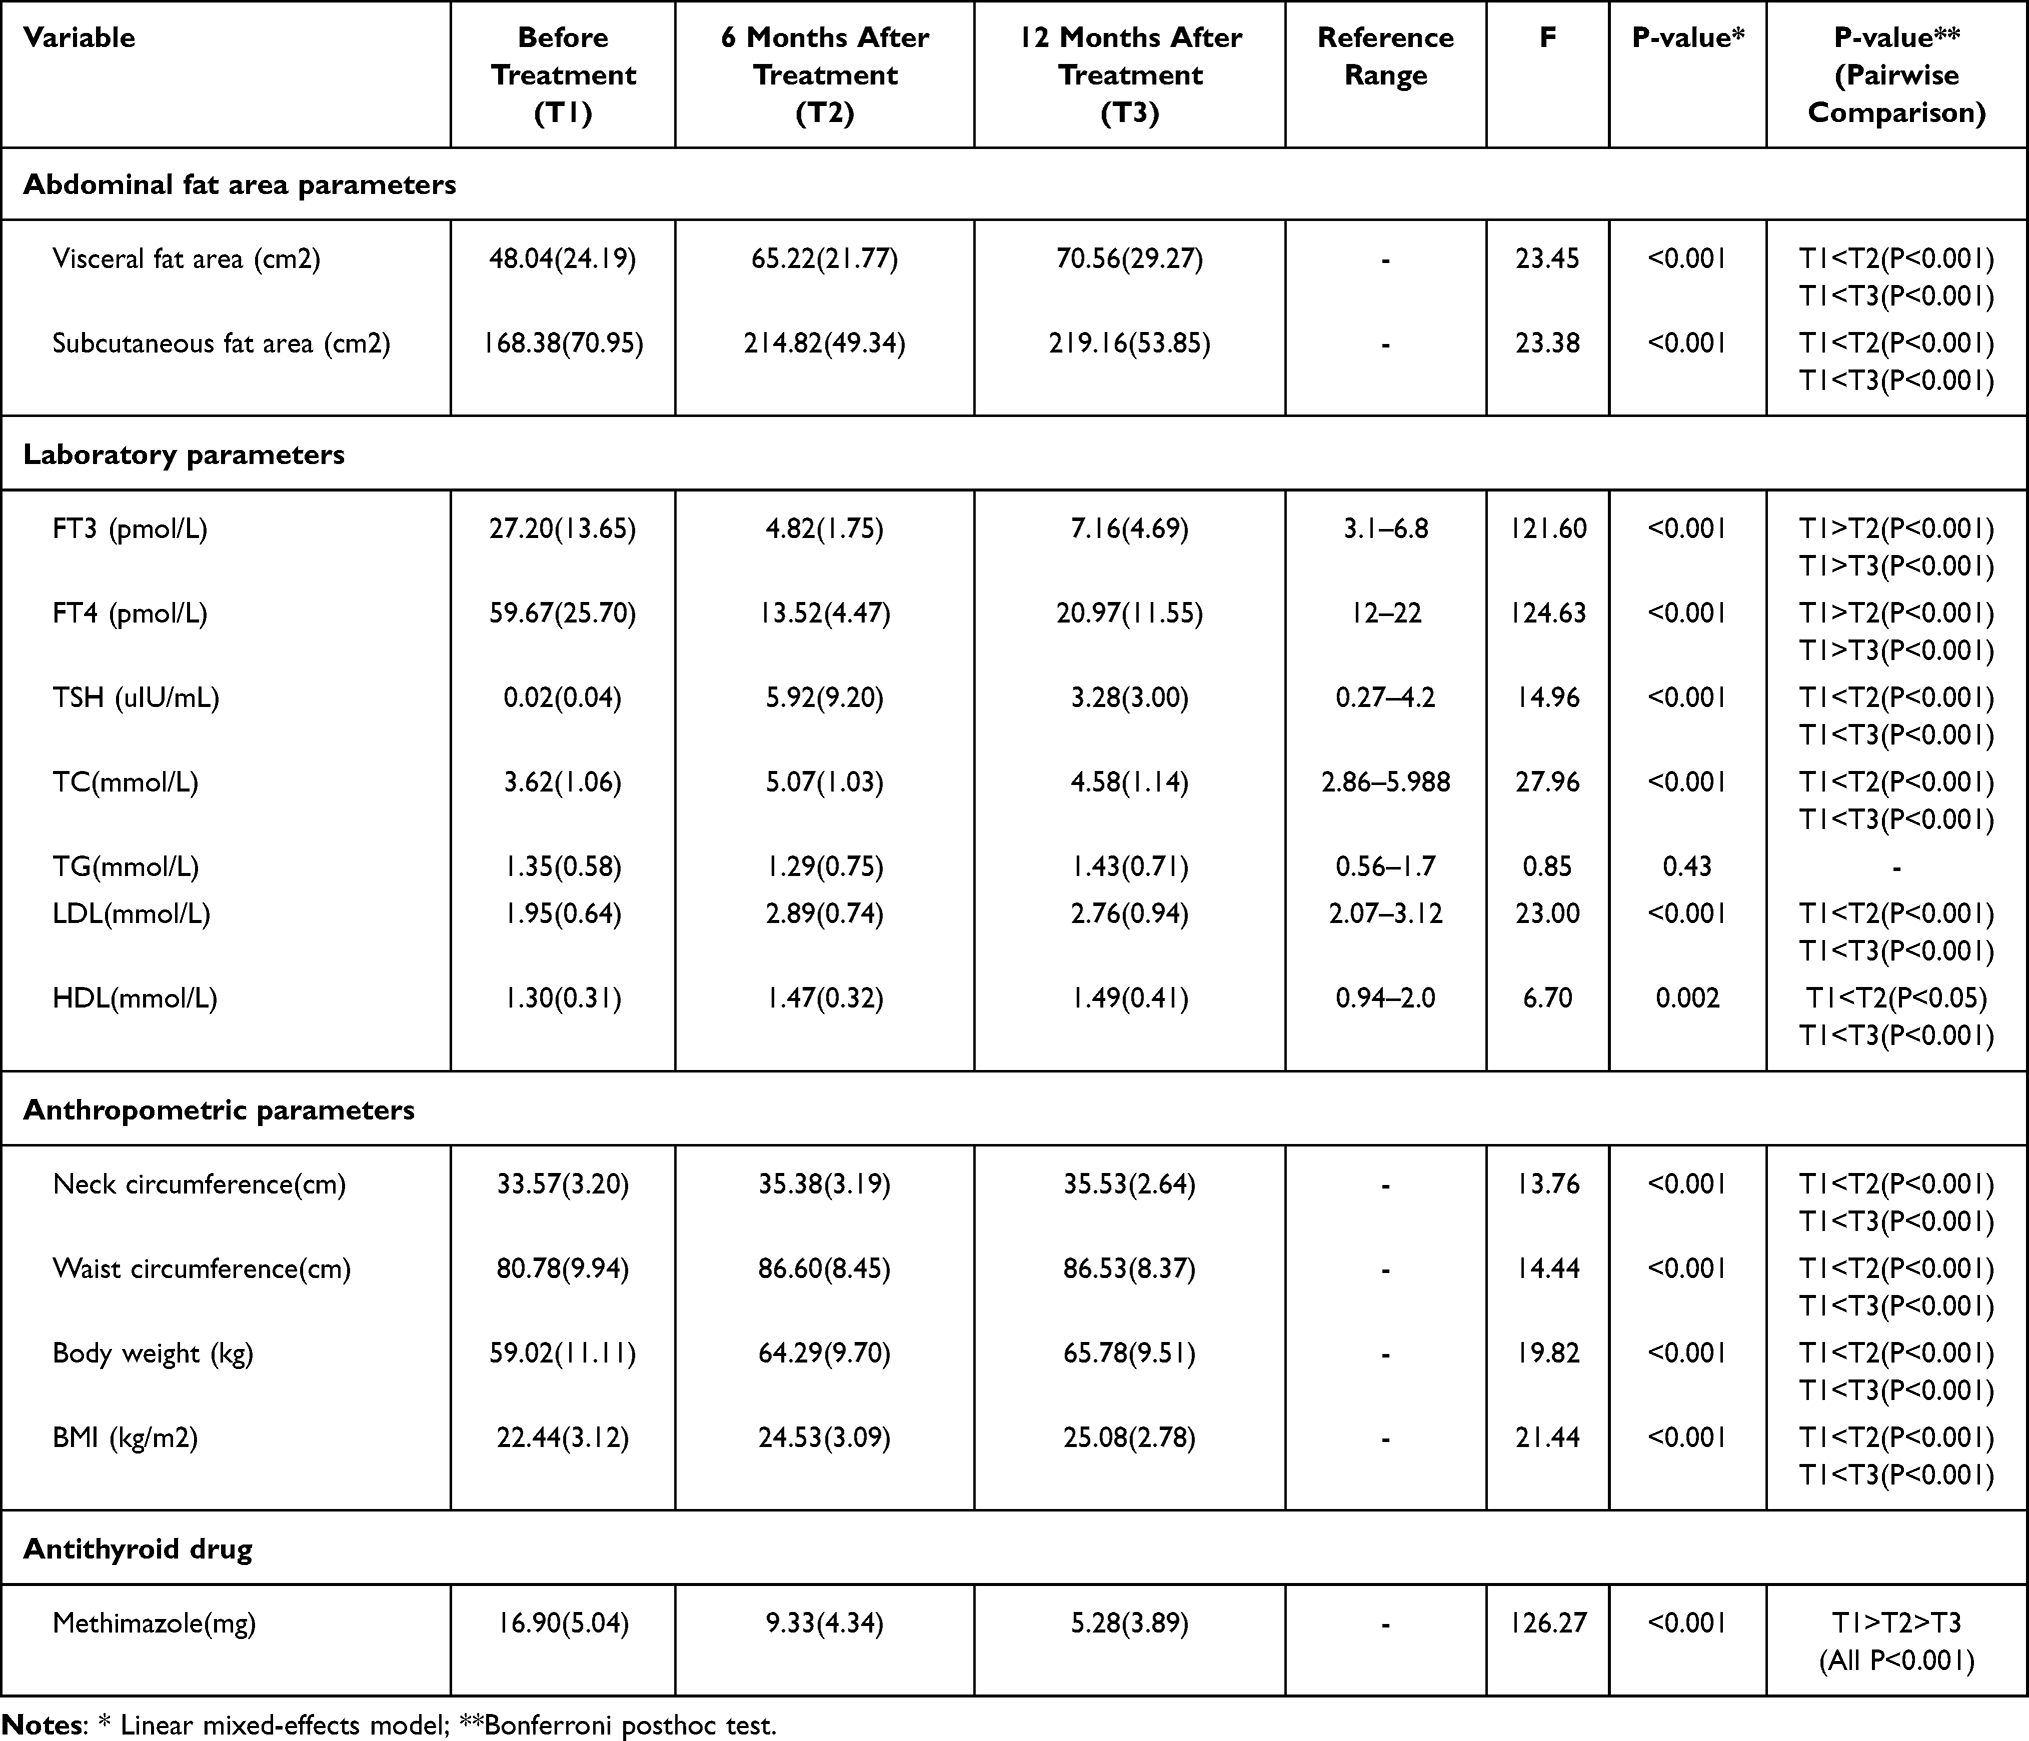 |
Table 2 Comparison of the Following Parameters at Different Time Points |
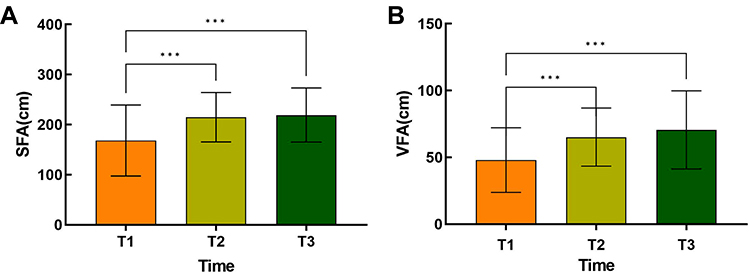 |
Figure 1 (A) Comparison of SFA at different time points. ***P<0.001 (B) Comparison of VFA at different time points. ***P<0.001. |
For laboratory parameters, the results of linear mixed-effects modeling showed that after treatment of hyperthyroidism, both FT3 (F = 121.60, p < 0.001) (Figure 2A) and FT4 (F = 124.63, p < 0.001) (Figure 2B) decreased, while TSH (F=14.96, P <0.001) (Figure 2C) was increased. TC (F = 27.96, p < 0.001) (Figure 3A), HDL (F = 6.70, p < 0.001) (Figure 3B), and LDL (F = 23.00, p < 0.01) (Figure 3C) were increased. However, the change in TG (F = 0.85, p=0.43) (Figure 3D) was not significant (p > 0.05) across time points. Bonferroni post hoc test results of the above parameters with significant changes showed that there were statistically significant differences between pre-intervention and 6 months after intervention (T1 and T2) and between pre-intervention and 12 months after intervention (T1 and T3) (All P<0.05). However, the difference was not statistically significant (p>0.05) when comparing 6 and 12 months after the intervention (T2 and T3) (Table 2) (Figures 2 and 3).
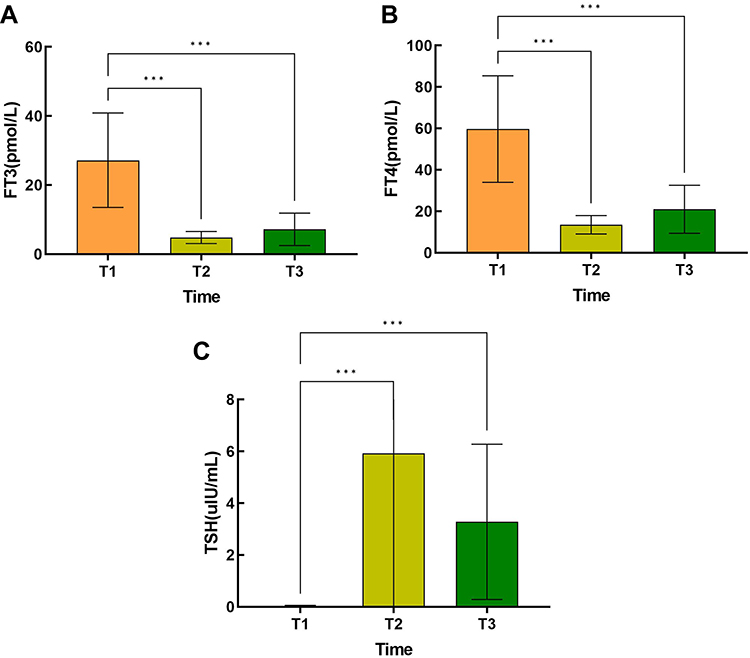 |
Figure 2 (A) Comparison of FT3 at different time points. ***P<0.001 (B) Comparison of FT4 at different time points. ***P<0.001 (C) Comparison of TSH at different time points. ***P<0.001. |
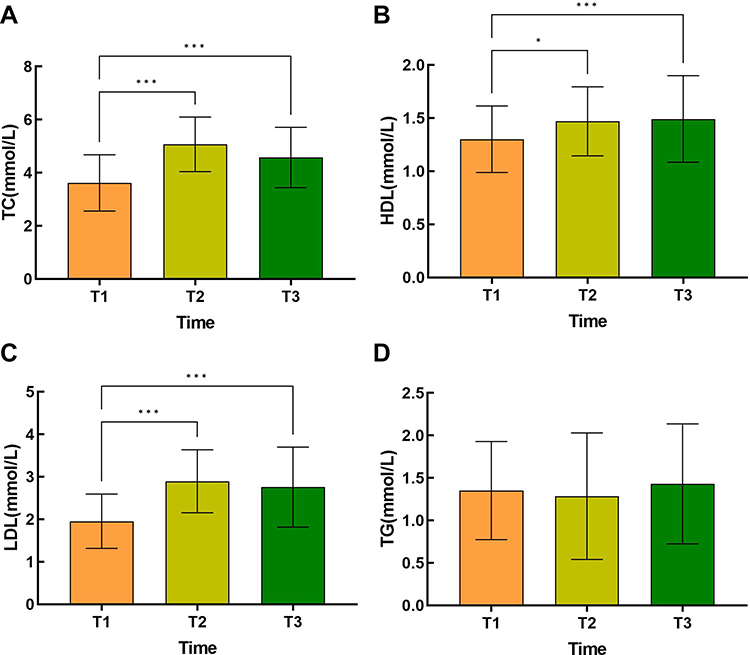 |
Figure 3 (A) Comparison of TC at different time points. ***P<0.001 (B) Comparison of HDL at different time points. ***P<0.001 *P<0.05 (C) Comparison of LDL at different time points. ***P<0.001 (D) Comparison of TG at different time points. P>0.05. |
For anthropometric parameters, the results of linear mixed-effects modeling showed increases in body weight (F = 19.82, p < 0.001) (Figure 4A), neck circumference (F = 13.76, p < 0.001) (Figure 4B), BMI (F = 21.44, p < 0.001) (Figure 4C) and waist circumference (F = 14.44, p < 0.001) (Figure 4D) after treatment. The results of the Bonferroni post hoc test showed that the values at 6 and 12 months after treatment were all significantly higher than the values before treatment (T1<T2,T1<T3, All P<0.001), but there were no significant differences between 6 months and 12 months after intervention (T2 and T3) (All P >0.05) (Table 2)(Figure 4).
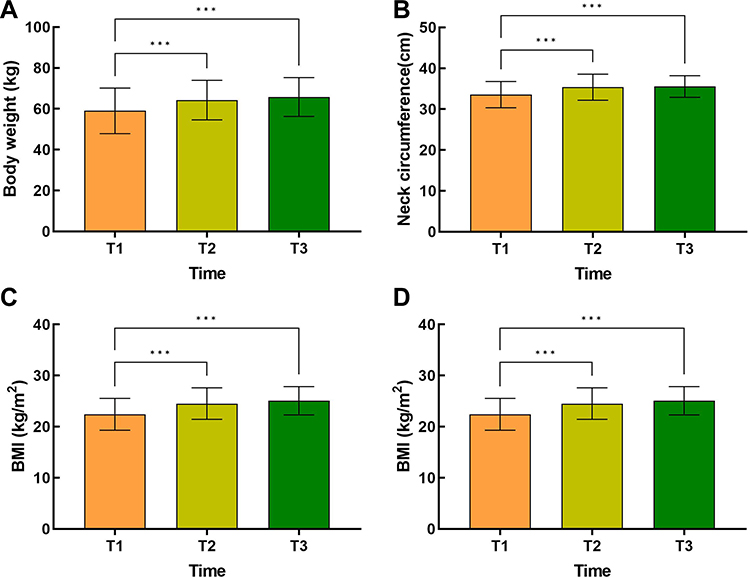 |
Figure 4 (A) Comparison of body weight at different time points. ***P<0.001 (B) Comparison of neck circumference at different time points. ***P<0.001 (C) Comparison of BMI at different time points. ***P<0.001 (D) Comparison of waist circumference at different time points. ***P<0.001. |
For the dose of methimazole, the linear mixed effects model showed that the dose was reduced after hyperthyroidism. The results of the Bonferroni post hoc test showed that the dose is gradually reduced over time (T1>T2>T3) (All P<0.001) (Table 2) (Figure 5).
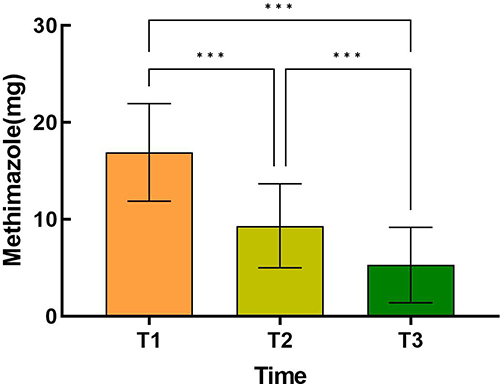 |
Figure 5 Comparison of methimazole dose at different time points. ***P<0.001. |
We investigated the effects of THs on SFA and VFA in patients with hyperthyroidism, and found that for SFA, the results of the linear mixed effects model showed that FT3 (Estimate=−2.12, P<0.001) and FT4 (Estimate=−1.02, P<0.001) were significantly negatively correlated with SFA. We also find that FT3 plays a bigger role than FT4. TSH (Estimate=3.62, P=0.001) was positively correlated with SFA. Also for VFA, the results of the linear mixed effects model showed that FT3 (Estimate=−0.71, P<0.001) and FT4 (Estimate=−0.35, P<0.001) were significantly negatively correlated with VFA. We also find that FT3 has a greater effect than FT4. TSH (Estimate=1.97, P=0.002) was positively correlated with VFA. In addition, according to the results in the table, we find that THs has a greater impact on SFA than on VFA (Table 3).
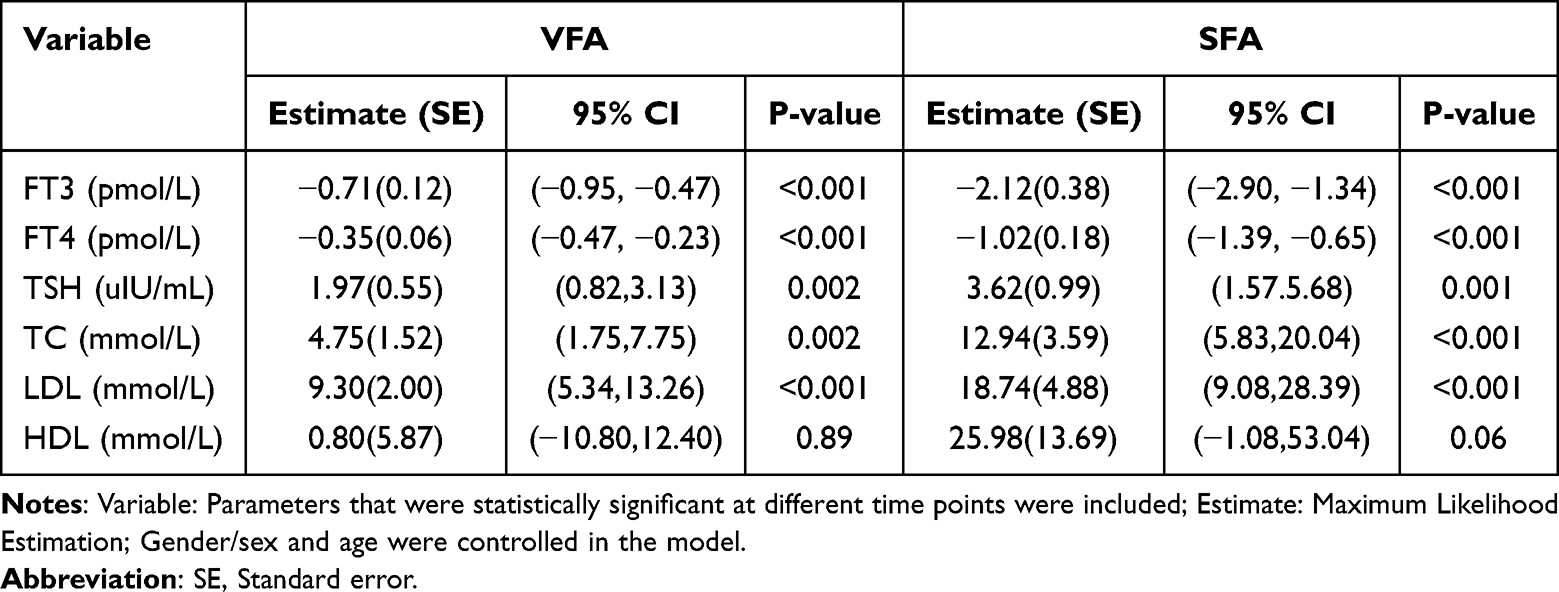 |
Table 3 The Effects of Thyroid Hormones and Lipids on VFA and SFA Were Summarized by a Linear Mixed-Effect Model |
We explored the effect of lipid metabolism parameters on SFA and VFA in hyperthyroidism patients during treatment, and found that TC (Estimate=12.94, P<0.001) and LDL (Estimate=18.74, P<0.001) were positively correlated with SFA, and the effect of LDL was greater. However, HDL (Estimate=25.98, P=0.06) was not significantly associated with SFA. Also for VFA, the results showed that TC (Estimate=4.75, P=0.002) and LDL (Estimate=9.30, P<0.001) were significantly positively correlated with VFA, and the effect of LDL was greater. However, HDL (Estimate=0.80, P=0.89) was not significantly correlated with VFA. In addition, according to the results in the table, we found that lipid metabolism indicators had a greater impact on SFA (Table 3).
We investigated the effect of methimazole dose on VFA and SFA during anti-thyroid treatment. The results showed that there was no significant correlation between the dose of methimazole and abdominal fat area (both VFA and SFA) (Both P>0.05) (Table 4).
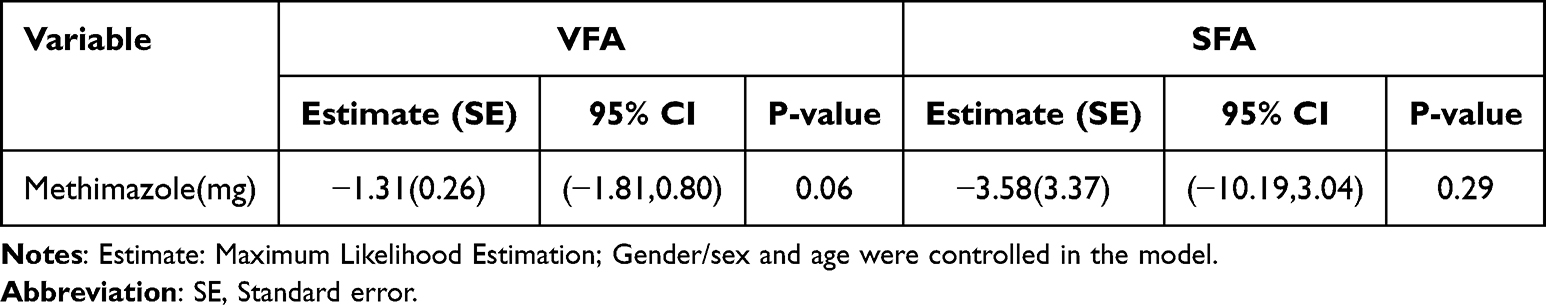 |
Table 4 The Effects of Methimazole Dose on VFA and SFA Were Summarized by a Linear Mixed-Effect Model |
The linear mixed effect model showed that FT3 and FT4 were negatively correlated with TC, LDL and HDL (All P<0.001). Compared with FT4, FT3 had a greater effect on each index of lipid metabolism. FT3 and FT4 had the greatest effect on TC compared with LDL and HDL. For TSH, our results showed that TSH was only positively correlated with TC (P<0.05), and had no significant correlation with LDL and HDL (Both P>0.05) (Table 5).
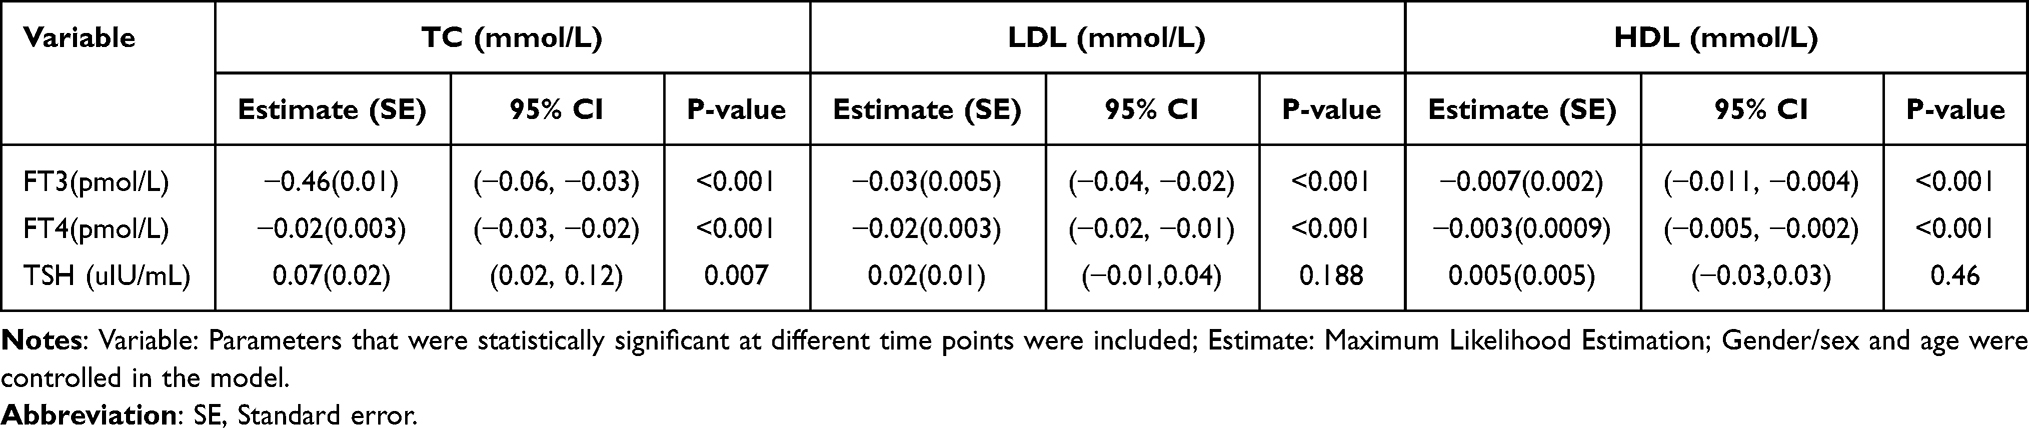 |
Table 5 The Effects of Thyroid Hormones on Blood Lipids Were Summarized by a Linear Mixed-Effect Model |
Discussion
In this study, we prospectively evaluated the dynamic changes in abdominal fat area parameters, laboratory parameters, and anthropometric parameters in patients with hyperthyroid hormone during 12 months of drug therapy. The interrelationships between THs, lipids, and abdominal fat area were further investigated. At 6- and 12- months follow-up we found that VFA and SFA increased after treatment. THs basically returned to normal levels. Blood lipids were in the normal range before treatment, and TC, HDL and LDL were elevated after treatment, but still within the normal reference range. However, there was no significant change in TG before and after treatment.
The results of this experiment showed that FT3 and FT4 were negatively correlated with SFA and VFA. There was no significant correlation between the dose of methimazole and abdominal fat area. This suggests that THs directly regulates abdominal fat area during hyperthyroidism treatment, and drug dose has no significant effect in this process. The main mechanisms related to the enhancement of lipolysis in adipose tissue induced by THs are as follows: 1. THs can up-regulate the number of β2 adrenergic receptors and reduce the activity of phosphodiesterase, and indirectly promote lipolysis through the effect of catecholamine.22,23 2. THs can promote the transformation of white adipose tissue into brown adipose tissue, and increase heat production by inducing uncoupling protein-1.24–26 3. FT3 promotes mRNA expression of liver fibroblast growth factor 21 (FGF21), and FGF21 can induce brown adipose tissue to stimulate thermogenesis.27,28 Previous studies have shown that the content of FGF21 in patients with hyperthyroidism increases and is negatively correlated with body fat percentage.29 Our study showed an increase in abdominal fat area during the treatment of hyperthyroidism. This is possible because decreased THs concentrations during treatment increase abdominal fat area by down-regulating the aforementioned mechanisms. Clinical manifestations were an increase in body weight, abdominal fat area, and waist circumference compared to pre-treatment.
We found that TC and LDL were positively correlated with SFA and VFA during the treatment, however, HDL was not correlated with SFA and VFA. It suggests that lipids somehow affect the abdominal fat area. The increase in abdominal fat area in patients with hyperthyroidism after treatment may be due in part to the increase in LDL and TC. Several previous studies have shown that LDL is positively associated with VFA and independently predicts cardiovascular events.30–32 In a study of Canadian, Lemieux et al33 found that CT-measured VFA was positively associated with LDL levels. A one-year lifestyle intervention study of 107 non-diabetic white men with abdominal obesity found that a reduction in LDL was accompanied by a significant reduction in VFA.34 A study of 157 subjects with a high prevalence of metabolic syndrome (34%) found that LDL levels were independently associated with VFA in men, but not in women.35 Therefore, the current treatment target is LDL. Consistent with our study some larger studies have shown a significant positive correlation between TC and VFA.35,36 In addition, the relationship between HDL and changes in abdominal fat area has also been demonstrated in many studies. One study evaluated whether the accumulation of abdominal fat measured by CT over a 5-year period was correlated with baseline HDL concentration and found that HDL concentration and future abdominal fat accumulation were negatively correlated, indicating that in this population, the accumulation of abdominal fat was greater in subjects with lower baseline HDL concentration.37 Hye-Rin Park et al further illustrated that the TG/HDL ratio was associated with visceral fat but not with SFA.38 Song et al found that baseline plasma HDL concentration independently predicted intra-abdominal adiposity after performing a 5-year follow-up.37 However, the relationship between HDL and abdominal fat area was not found in our study.
During the transition phase from hyperthyroidism to normal thyroid function, FT3 and FT4 were negatively correlated with TC, LDL, and HDL. It indicates that THs do regulate lipids during the treatment of hyperthyroid patients. Decrease in THs increases lipid levels. It has been shown that THs stimulate the expression of the LDL receptor mRNA gene on the hepatocyte membrane, leading to an increase in the number and activity of LDL receptors. Ultimately, the ability to remove LDL via the LDL receptor pathway increases, resulting in lower LDL levels.39,40 Elevated LDL eventually leads to elevated TC.41,42 In addition, reduced THs levels decrease hepatic cholesterol 7α-hydroxylase activity, contributing to decreased cholesterol metabolism, which can also lead to elevated TC levels during hyperthyroidism treatment.43 It has been shown that a decrease in THs levels decreases the activity of lipoprotein lipase, the enzyme responsible for the removal of TG-rich lipoproteins, which leads to an increase in serum TG levels.44 However, in our study we found no significant change in TG during follow-up. For changes in HDL, the effect of changes in THs levels on HDL cholesterol levels has produced conflicting results as reported in the existing literature.45–47 In our study, we found a significant increase in HDL cholesterol levels after treatment of hyperthyroidism.
Existing studies have shown that VFA measured at the umbilicus is independently associated with the development of coronary artery disease and that VFA is a better predictor of cardiovascular risk factors than BMI.48–50 In contrast, there are no consistent findings regarding the relationship between SFA and CVD risk.48 In this study, we focused on treatment-induced changes in abdominal fat area in patients. The results showed that both VFA and SFA increased after GD treatment. In addition to this, we also focused on the changes in lipid profile during hyperthyroidism treatment. The results showed that in addition to TG, LDL, HDL and TC were elevated and we found that LDL levels were significantly elevated leading to an increase in the LDL to HDL ratio. It has been shown that the ratio of LDL to HDL is considered a prognostic marker for CVD, and an elevated LDL to HDL ratio suggests an increased risk of cardiac exercise.51 Taken together with the above available evidence and our results, we speculate that increased abdominal fat area as well as altered lipid profiles are potential causes of metabolic disorder and CVD in hyperthyroid patients after treatment.
Although this study generated some new knowledge about the above-measured parameters in patients with hyperthyroidism, there are still some limitations. First, this was a single-center study, whereas the results of a multicenter study that recruited more participants may be more reliable. Second, this was a single-group repeated measures design study. Studies with control groups (eg, randomized controlled trials) are needed to assess changes in the above parameters and their interrelationships after hyperthyroidism treatment. Third, we had only a 12-month follow-up, and a longer-term study is needed to assess long-term effects.
Conclusion
In conclusion, our results suggest that the reason why metabolic disorder and CVD remain increased after thyroid function is restored may somehow be related to the increase in abdominal fat area as well as the altered lipid profile. Therefore, during the diagnosis and treatment of hyperthyroidism, it is recommended to monitor the distribution of abdominal fat and lipid metabolism indicators in order to find the abnormal situation of adipose tissue and lipid metabolism in time.
Abbreviations
FT3, free triiodothyronine; FT4, free thyroxine; TSH, thyroid stimulating hormone; TC, total cholesterol; TG, triglyceride; LDL, low-density lipoprotein; HDL, high-density lipoprotein; VFA, visceral fat area; SFA, subcutaneous fat area; BMI, body mass index; Graves’ disease, GD; thyroid hormones, THs; CVD, cardiovascular disease; THs, thyroid hormones.
Ethics Approval and Informed Consent
All procedures followed were in accordance with the ethical standards of the responsible committee on human experimentation (Ethics Committee of the First Hospital of Shanxi Medical University/ Date of approval: March 13, 2018 / Approval number: 2018K002) and with the Helsinki Declaration of 1964 and later versions. Informed consent for it was obtained from all patients for being included in the study.
Acknowledgments
The co-authors thank the National Natural Science Foundation of China (81973378, 82073909), the Shanxi Provincial Central Leading Local Science and Technology Development Fund Project (YDZJSX2022A059, YDZJSX20231A059), and Four “Batches” Innovation Project of Invigorating Medical through Science and Technology of Shanxi Province (2023XM022) for their support.
Funding
The co-authors thank the National Natural Science Foundation of China (81973378, 82073909), the Shanxi Provincial Central Leading Local Science and Technology Development Fund Project (YDZJSX2022A059, YDZJSX20231A059), and Four “Batches” Innovation Project of Invigorating Medical through Science and Technology of Shanxi Province (2023XM022) for their support.
Disclosure
The authors report no conflicts of interest in this work.
References
1. Wiersinga WM, Poppe KG, Effraimidis G. Hyperthyroidism: aetiology, pathogenesis, diagnosis, management, complications, and prognosis. Lancet Diabetes Endocrinol. 2023;11(4):282–298. doi:10.1016/S2213-8587(23)00005-0
2. Ross DS, Burch HB, Cooper DS, et al. 2016 American Thyroid Association guidelines for diagnosis and management of hyperthyroidism and other causes of thyrotoxicosis. Thyroid. 2016;26(10):1343–1421. doi:10.1089/thy.2016.0229
3. Jabbar A, Pingitore A, Pearce SH, Zaman A, Iervasi G, Razvi S. Thyroid hormones and cardiovascular disease. Nat Rev Cardiol. 2017;14(1):39–55. doi:10.1038/nrcardio.2016.174
4. Klein I, Ojamaa K. Thyroid hormone and the cardiovascular system. N Engl J Med. 2001;344(7):501–509. doi:10.1056/NEJM200102153440707
5. Nyirenda MJ, Clark DN, Finlayson AR, et al. Thyroid disease and increased cardiovascular risk. Thyroid. 2005;15(7):718–724. doi:10.1089/thy.2005.15.718
6. Brandt F, Thvilum M, Almind D, et al. Morbidity before and after the diagnosis of hyperthyroidism: a nationwide register-based study. PLoS One. 2013;8(6):e66711. doi:10.1371/journal.pone.0066711
7. Ryödi E, Salmi J, Jaatinen P, et al. Cardiovascular morbidity and mortality in surgically treated hyperthyroidism - a nation-wide cohort study with a long-term follow-up. Clin Endocrinol. 2014;80(5):743–750. doi:10.1111/cen.12359
8. Metso S, Auvinen A, Salmi J, Huhtala H, Jaatinen P. Increased long-term cardiovascular morbidity among patients treated with radioactive iodine for hyperthyroidism. Clin Endocrinol. 2008;68(3):450–457. doi:10.1111/j.1365-2265.2007.03064.x
9. Franklyn JA, Maisonneuve P, Sheppard MC, Betteridge J, Boyle P. Mortality after the treatment of hyperthyroidism with radioactive iodine. N Engl J Med. 1998;338(11):712–718. doi:10.1056/NEJM199803123381103
10. Franklyn JA, Sheppard MC, Maisonneuve P. Thyroid function and mortality in patients treated for hyperthyroidism. JAMA. 2005;294(1):71–80. doi:10.1001/jama.294.1.71
11. Hall P, Lundell G, Holm LE. Mortality in patients treated for hyperthyroidism with iodine-131. Acta Endocrinol. 1993;128(3):230–234. doi:10.1530/acta.0.1280230
12. Lönn L, Stenlöf K, Ottosson M, Lindroos AK, Nyström E, Sjöström L. Body weight and body composition changes after treatment of hyperthyroidism. J Clin Endocrinol Metab. 1998;83(12):4269–4273. doi:10.1210/jcem.83.12.5338
13. Ito A, Ando T, Nozaki A, Haraguchi A, Horie I, Kawakami A. VISCERAL AND SUBCUTANEOUS FAT INCREASED AFTER TREATMENT OF GRAVES DISEASE. Endocr Pract. 2020;26(5):484–491. doi:10.4158/EP-2019-0459
14. Steinhoff KG, Krause K, Linder N, et al. Effects of Hyperthyroidism on Adipose Tissue Activity and Distribution in Adults. Thyroid. 2021;31(3):519–527. doi:10.1089/thy.2019.0806
15. Huang H, Zheng X, Wen X, Zhong J, Zhou Y, Xu L. Visceral fat correlates with insulin secretion and sensitivity independent of BMI and subcutaneous fat in Chinese with type 2 diabetes. Front Endocrinol. 2023;14:1144834. doi:10.3389/fendo.2023.1144834
16. Zhang B, He J, Guo P, et al. Ratio of visceral fat area to body fat mass (VBR) is a superior predictor of coronary heart disease. Chin Med J. 2023;1:3.
17. Paiman EHM, de Mutsert R, Widya RL, Rosendaal FR, Jukema JW, Lamb HJ. The role of insulin resistance in the relation of visceral, abdominal subcutaneous and total body fat to cardiovascular function. Nutr Metab Cardiovasc Dis. 2020;30(12):2230–2241. doi:10.1016/j.numecd.2020.07.011
18. Preis SR, Massaro JM, Robins SJ, et al. Abdominal subcutaneous and visceral adipose tissue and insulin resistance in the Framingham heart study. Obesity. 2010;18(11):2191–2198. doi:10.1038/oby.2010.59
19. Bartalena L. Diagnosis and management of Graves disease: a global overview. Nat Rev Endocrinol. 2013;9(12):724–734. doi:10.1038/nrendo.2013.193
20. Amato MC, Giordano C, Galia M, et al. Visceral Adiposity Index: a reliable indicator of visceral fat function associated with cardiometabolic risk. Diabetes Care. 2010;33(4):920–922. doi:10.2337/dc09-1825
21. Andreoli A, Scalzo G, Masala S, Tarantino U, Guglielmi G. Body composition assessment by dual-energy X-ray absorptiometry (DXA). Radiol Med. 2009;114(2):286–300. doi:10.1007/s11547-009-0369-7
22. Polak J, Moro C, Klimcakova E, et al. The atrial natriuretic peptide- and catecholamine-induced lipolysis and expression of related genes in adipose tissue in hypothyroid and hyperthyroid patients. Am J Physiol Endocrinol Metab. 2007;293(1):E246–E251. doi:10.1152/ajpendo.00688.2006
23. Hellström L, Wahrenberg H, Reynisdottir S, Arner P. Catecholamine-induced adipocyte lipolysis in human hyperthyroidism. J Clin Endocrinol Metab. 1997;82(1):159–166. doi:10.1210/jcem.82.1.3664
24. Martínez-Sánchez N, Moreno-Navarrete JM, Contreras C, et al. Thyroid hormones induce browning of white fat. J Endocrinol. 2017;232(2):351–362. doi:10.1530/JOE-16-0425
25. Seale P, Kajimura S, Spiegelman BM. Transcriptional control of brown adipocyte development and physiological function--of mice and men. Genes Dev. 2009;23(7):788–797. doi:10.1101/gad.1779209
26. Yau WW, Yen PM. Thermogenesis in adipose tissue activated by thyroid hormone. Int J Mol Sci. 2020;21(8):3020. doi:10.3390/ijms21083020
27. Adams AC, Astapova I, Fisher FM, et al. Thyroid hormone regulates hepatic expression of fibroblast growth factor 21 in a PPARalpha-dependent manner. J Biol Chem. 2010;285(19):14078–14082. doi:10.1074/jbc.C110.107375
28. Angelin B, Larsson TE, Rudling M. Circulating fibroblast growth factors as metabolic regulators--a critical appraisal. Cell Metab. 2012;16(6):693–705. doi:10.1016/j.cmet.2012.11.001
29. Bande AR, Kalra P, Dharmalingam M, Selvan C, Suryanarayana KM. Serum fibroblast growth factor 21 levels in patients with hyperthyroidism and its association with body fat percentage. Indian J Endocrinol Metab. 2019;23(5):557–562. doi:10.4103/ijem.IJEM_273_19
30. Kobayashi H, Nakamura T, Miyaoka K, et al. Visceral fat accumulation contributes to insulin resistance, small-sized low-density lipoprotein, and progression of coronary artery disease in middle-aged non-obese Japanese men. Jpn Circ J. 2001;65(3):193–199. doi:10.1253/jcj.65.193
31. Luo Y, Ma X, Shen Y, et al. Positive relationship between serum low-density lipoprotein cholesterol levels and visceral fat in a Chinese nondiabetic population. PLoS One. 2014;9(11):e112715. doi:10.1371/journal.pone.0112715
32. Raghu Teja K, Durgaprasad BK, Vijayalakshmi P. Evaluation and comparative correlation of abdominal fat related parameters in obese and non-obese groups using computed tomography. Curr Med Imaging. 2021;17(3):417–424. doi:10.2174/1573405616666201008145801
33. Lemieux S, Prud’homme D, Moorjani S, et al. Do elevated levels of abdominal visceral adipose tissue contribute to age-related differences in plasma lipoprotein concentrations in men? Atherosclerosis. 1995;118(1):155–164. doi:10.1016/0021-9150(95)05603-T
34. Pelletier-Beaumont E, Arsenault BJ, Alméras N, et al. Normalization of visceral adiposity is required to normalize plasma apolipoprotein B levels in response to a healthy eating/physical activity lifestyle modification program in viscerally obese men. Atherosclerosis. 2012;221(2):577–582. doi:10.1016/j.atherosclerosis.2012.01.023
35. Onat A, Avci GS, Barlan MM, Uyarel H, Uzunlar B, Sansoy V. Measures of abdominal obesity assessed for visceral adiposity and relation to coronary risk. Int J Obes Relat Metab Disord. 2004;28(8):1018–1025. doi:10.1038/sj.ijo.0802695
36. Fox CS, Massaro JM, Hoffmann U, et al. Abdominal visceral and subcutaneous adipose tissue compartments: association with metabolic risk factors in the Framingham Heart Study. Circulation. 2007;116(1):39–48. doi:10.1161/CIRCULATIONAHA.106.675355
37. Song SO, Hwang YC, Ryu HU, et al. Lower high-density lipoprotein cholesterol concentration is independently associated with greater future accumulation of intra-abdominal fat. Endocrinol Metab. 2021;36(4):835–844. doi:10.3803/EnM.2021.1130
38. Park H-R, Shin S-R, Han AL, Jeong YJ. The correlation between the triglyceride to high density lipoprotein cholesterol ratio and computed tomography-measured visceral fat and cardiovascular disease risk factors in local adult male subjects. Korean J Fam Med. 2015;36(6). doi:10.4082/kjfm.2015.36.6.335
39. Bakker O, Hudig F, Meijssen S, Wiersinga WM. Effects of triiodothyronine and amiodarone on the promoter of the human LDL receptor gene. Biochem Biophys Res Commun. 1998;249(2):517–521.
40. Shin DJ, Osborne TF. Thyroid hormone regulation and cholesterol metabolism are connected through Sterol Regulatory Element-Binding Protein-2 (SREBP-2). J Biol Chem. 2003;278(36):34114–34118. doi:10.1074/jbc.M305417200
41. Duntas LH. Thyroid disease and lipids. Thyroid. 2002;12(4):287–293. doi:10.1089/10507250252949405
42. Faure P, Oziol L, Artur Y, Chomard P. Thyroid hormone (T3) and its acetic derivative (TA3) protect low-density lipoproteins from oxidation by different mechanisms. Biochimie. 2004;86(6):411–418. doi:10.1016/j.biochi.2004.04.009
43. Gullberg H, Rudling M, Forrest D, Angelin B, Vennström B. Thyroid hormone receptor beta-deficient mice show complete loss of the normal cholesterol 7alpha-hydroxylase (CYP7A) response to thyroid hormone but display enhanced resistance to dietary cholesterol. Mol Endocrinol. 2000;14(11):1739–1749. doi:10.1210/mend.14.11.0548
44. Nikkilä EA, Kekki M. Plasma triglyceride metabolism in thyroid disease. J Clin Invest. 1972;51(8):2103–2114. doi:10.1172/JCI107017
45. Agdeppa D, Macaron C, Mallik T, Schnuda ND. Plasma high density lipoprotein cholesterol in thyroid disease. J Clin Endocrinol Metab. 1979;49(5):726–729. doi:10.1210/jcem-49-5-726
46. Aviram M, Luboshitzky R, Brook JG. Lipid and lipoprotein pattern in thyroid dysfunction and the effect of therapy. Clin Biochem. 1982;15(1):62–66. doi:10.1016/S0009-9120(82)90529-X
47. Lithell H, Boberg J, Hellsing K, et al. Serum lipoprotein and apolipoprotein concentrations and tissue lipoprotein-lipase activity in overt and subclinical hypothyroidism: the effect of substitution therapy. Eur J Clin Invest. 1981;11(1):3–10. doi:10.1111/j.1365-2362.1981.tb01758.x
48. Fujimoto WY, Bergstrom RW, Boyko EJ, et al. Visceral adiposity and incident coronary heart disease in Japanese-American men. The 10-year follow-up results of the Seattle Japanese-American Community diabetes study. Diabetes Care. 1999;22(11):1808–1812. doi:10.2337/diacare.22.11.1808
49. Nieves DJ, Cnop M, Retzlaff B, et al. The atherogenic lipoprotein profile associated with obesity and insulin resistance is largely attributable to intra-abdominal fat. Diabetes. 2003;52(1):172–179. doi:10.2337/diabetes.52.1.172
50. Yusuf S, Hawken S, Ounpuu S, et al. Obesity and the risk of myocardial infarction in 27,000 participants from 52 countries: a case-control study. Lancet. 2005;366(9497):1640–1649. doi:10.1016/S0140-6736(05)67663-5
51. Jellinger PS, Handelsman Y, Rosenblit PD, et al. American association of clinical endocrinologists and American college of endocrinology guidelines for management of dyslipidemia and prevention of cardiovascular disease. Endocr Pract. 2017;23(Suppl 2):2.
 © 2024 The Author(s). This work is published and licensed by Dove Medical Press Limited. The
full terms of this license are available at https://www.dovepress.com/terms
and incorporate the Creative Commons Attribution
- Non Commercial (unported, 3.0) License.
By accessing the work you hereby accept the Terms. Non-commercial uses of the work are permitted
without any further permission from Dove Medical Press Limited, provided the work is properly
attributed. For permission for commercial use of this work, please see paragraphs 4.2 and 5 of our Terms.
© 2024 The Author(s). This work is published and licensed by Dove Medical Press Limited. The
full terms of this license are available at https://www.dovepress.com/terms
and incorporate the Creative Commons Attribution
- Non Commercial (unported, 3.0) License.
By accessing the work you hereby accept the Terms. Non-commercial uses of the work are permitted
without any further permission from Dove Medical Press Limited, provided the work is properly
attributed. For permission for commercial use of this work, please see paragraphs 4.2 and 5 of our Terms.