Back to Journals » Diabetes, Metabolic Syndrome and Obesity » Volume 16
Visceral Adiposity Index and Lipid Accumulation Product as Effective Markers of Different Obesity Phenotypes in Korean Adults: A Cross-Sectional Analysis
Received 10 November 2022
Accepted for publication 2 February 2023
Published 17 February 2023 Volume 2023:16 Pages 495—504
DOI https://doi.org/10.2147/DMSO.S397043
Checked for plagiarism Yes
Review by Single anonymous peer review
Peer reviewer comments 2
Editor who approved publication: Prof. Dr. Juei-Tang Cheng
Sung Ryul Yu,1 Kyung-A Shin2
1Department of Clinical Laboratory Science, Semyung University, Jaecheon, Republic of Korea; 2Department of Clinical Laboratory Science, Shinsung University, Dangjin, Republic of Korea
Correspondence: Kyung-A Shin, Department of Clinical Laboratory Science, Shinsung University, Daehak-ro 1, Jeongmi-myeon, Dangjin, Chungnam, 31801, Republic of Korea, Tel +82-41-350-1408, Fax +82-41-350-1045, Email [email protected]
Purpose: The visceral adiposity index (VAI) and lipid accumulation product (LAP) are useful for assessing visceral obesity. However, these indices were developed for Caucasians, and it is necessary to confirm whether the VAI and LAP are appropriate indicators for identifying obesity phenotypes in Asians. This study investigated whether the VAI and LAP are effective indicators for diagnosing four obesity phenotypes in South Korean adults.
Patients and Methods: This cross-sectional study enrolled 23,310 adult participants (age ≥ 20 years) who had undergone a health checkup at a general hospital in Gyeonggi-do, South Korea from January 2017 to December 2020. VAI and LAP were calculated based on the presented mathematical model according to sex. According to the metabolic health status and presence or absence of obesity, the obesity phenotypes were classified into 4 groups: metabolically healthy non-obese (N=14,240, 61.1%), metabolically unhealthy non-obese (N=477, 2.0%), metabolically healthy obese (MHO; N=6796, 29.2%), and metabolically unhealthy obesity (MUO; N=1797, 7.7%).
Results: The receiver operating characteristics curve analysis showed VAI best predicted MUO among the four obesity phenotypes, whereas the LAP showed excellent discriminating ability for the MUO group (area under the curve 0.877, 0.849, and 0.921 and 0.923, 0.907, and 0.954 for all participants, men, and women, respectively). The optimal VAI cutoff values for identifying the MUO group were 1.83 in men and 1.58 in women, and the optimal cutoff values for the LAP were 41.45 in men and 23.83 in women, with a higher value for men. After adjusting for potential confounding factors, the VAI and LAP were associated with an increased risk in the MHO and MUO groups among the obesity phenotypes in both sexes.
Conclusion: In South Korean adults, the VAI and LAP are closely related to the MUO phenotype in both sexes and are effective indices for predicting the MUO phenotype.
Keywords: lipid accumulation product, visceral adiposity index, metabolic syndrome, obesity phenotype
Introduction
The prevalence of obesity is increasing worldwide, and the obesity rate among South Koreans has increased from 31.7% in 2007 to 38.3% in 2020.1 In the case of obesity, excessive energy intake leads to an excess deposition of ectopic fat, which causes agglomeration of triglycerides not only in adipose tissues, but also in non-fat tissues, such as the liver, skeletal muscle, pancreas, and myocardium.2 Ectopic fats, in turn, may cause insulin resistance, dyslipidemia, hypertension, systemic inflammatory response, type 2 diabetes, cardiovascular disease, and cancer.3–5 However, epidemiological studies have shown that obesity and overweight are not necessarily associated with the increased morbidity and mortality of chronic diseases, including cardiovascular disease.6,7 Among the obesity phenotypes, there exists a metabolically healthy obese (MHO) phenotype that, despite excessive body fat, maintains insulin sensitivity without metabolic complications and cardiovascular dysfunction.8 Another type is the metabolically unhealthy obese (MUO) phenotype that is characterized by obesity, insulin resistance, hypertension, impaired glucose tolerance, and dyslipidemia.9 Increasingly, it has been recognized that the risk for diseases may not be similar for all obese people.10 Furthermore, the identification of each obesity phenotype is crucial for selecting the most appropriate therapy; however, as there is no internationally standardized definition for obesity phenotypes, its clinical application is challenging.11,12
Abdominal visceral fat is recognized as a key factor that is associated with an increased risk of the metabolic syndrome.13 Body mass index (BMI) is commonly used to evaluate obesity; however, as the BMI cannot help distinguish between muscle mass and body fat mass, an increase in muscle mass can actually be diagnosed as overweight or obese.14,15 Therefore, additional anthropometric indicators are needed to assess abdominal visceral obesity.
The visceral adiposity index (VAI) and lipid accumulation product (LAP), which have been presented recently, are useful for measuring visceral obesity.16,17 The VAI is calculated using anthropometric indices, such as BMI and waist circumference, and a lipid index, such as triglyceride and high-density lipoprotein (HDL)-cholesterol; the VAI is a good index of body fat distribution and visceral fat accumulation.16 The LAP is composed of a combination of waist circumference and triglycerides and is associated with cardiovascular disease and all-cause mortality.17,18 Moreover, the VAI and LAP are sensitive indicators of visceral obesity and can help evaluate adipocyte function.16,17 In particular, the VAI shows a high correlation with visceral fat accumulation, as measured by magnetic resonance imaging (MRI) or computerized tomography (CT) scanning.16 As the VAI and LAP correlate with metabolic syndrome, these are effective indices for predicting metabolic obesity.19 However, there studies of the predictive ability and optimal cutoff values of the VAI and LAP for various obesity phenotypes are scarce. At the same BMI, Asians tend to have more visceral fat than other races, and thus may be seen as having metabolic abnormalities despite normal weight.20 As the abovementioned indices were developed for Westerners, it is necessary to verify whether the VAI and LAP are appropriate indices for identifying obesity phenotypes in Asians.
Therefore, this study aimed to determine whether the VAI and LAP are effective indicators for diagnosing four obesity phenotypes in South Korean adults. Furthermore, the study determined an optimal standard for diagnosing the obesity phenotype.
Materials and Methods
Study Population
This cross-sectional study was conducted in a cohort of adults aged 20 years or more who underwent a health checkup at a general hospital in Gyeonggi-do, South Korea from January 2017 to December 2020. After excluding those with brain and cardiovascular diseases, malignancies, pregnancy, underweight (BMI <18.5 kg/m2), treated with lipid-lowering drugs that affect lipid metabolism, and have missing values in the measurement results, we enrolled 23,310 participants (14,275 men, 9035 women) in the study. The medical and medication histories were ascertained through self-reported questionnaires. All personally identifiable data, such as the patient’s name and patient ID, were coded and anonymized. This study was conducted with the approval of the Institutional Review Board of Bundang Jesaeng Hospital, Seongnam-si, Gyeonggi-do, Korea (IRB No.: DMC 2022-07-014). As this was a retrospective study, the requirement for informed consent was waived by the Institutional Review Board. This study was conducted in accordance with the declaration of Helsinki.
Clinical Measurements
Height and weight were measured with an Inbody 720 (Biospace Co., Seoul, Korea) bioelectrical impedance body composition analyzer, and BMI was calculated as the weight (kg)/(height, m)2. The waist circumference was measured at the narrowest part between the lower border of the rib cage and the top of iliac crest to 0.1 cm with a tape measure while exhaling with the feet set 25 to 30 cm apart to distribute weight. The VAI was calculated according to the following formula.16 Men: [WC / 39.68 + (1.88 × BMI)] × (TG / 1.03) × (1.31 / HDL), women: [WC / 36.58 + (1.89 × BMI)] × (TG / 0.81) × (1.52 / HDL). The LAP was calculated as follows for men: (WC − 65) × TG, for women: (WC − 58) × TG.17 Systolic and diastolic blood pressures were measured with an automated sphygmomanometer (HBP-9020, OMRON, Kyoto, Japan) after maintaining a stable state for 10 minutes in a sitting position. The blood pressure was measured at least 3 times at intervals of 1 to 2 minutes, and the average value was derived for use in the data analysis. Blood tests were performed on the same day immediately after sample collection in the morning with fasting for more than 8 hours. Serum total cholesterol (TC), triglyceride (TG), HDL-C, low-density lipoprotein (LDL-C), fasting glucose, uric acid, and high sensitivity C-reactive protein (hs-CRP) were measured on a TBA-2000FR NEO automatic biochemical analyzer (Toshiba, Tokyo, Japan). Quantitative analysis was carried out using the following methods: enzymatic colorimetric test for TC and TG; enzymatic method for HDL-C; liquid selective detergent assay for LDL-C; hexokinase/glucose-6-phosphate dehydrogenase (HK/G6P-DH) method for glucose; uricase-peroxidase (POD) method for uric acid; and turbidimetric immunoassay (TIA) for hs-CRP. Furthermore, the glycated hemoglobin (HbA1c) level was measured by high-performance liquid chromatography (HPLC) using Variant II (Bio Rad, CA, USA). The insulin level was measured with electrochemiluminescence immunoassay (ECLIA) using Roche Modular Analytics E170 (Roche, Mannheim, Germany). The homeostasis model assessment-insulin resistance (HOMA-IR) was calculated using the following formula:21 HOMA-IR = [Fasting insulin concentration (μIU/mL) × Fasting blood glucose (mmol/L)/22.5].
Obesity Phenotypes
To distinguish obesity phenotypes based on previous studies, metabolic abnormality was defined as meeting 3 or more of the 5 diagnostic criteria for metabolic syndrome that were defined according to the Adult Treatment Panel III (ATP III) report of the National Cholesterol Education Program (NCEP):22 fasting blood glucose ≥ 100 mg/dL or taking diabetes medications; TG ≥150 mg/dL; HDL-C <40 mg/dL for men or <50 mg/dL for women; systolic blood pressure ≥130 mmHg or diastolic blood pressure ≥85 mmHg; waist circumference ≥90 cm for men or ≥80 cm for women.3,17 A history of hypertension or diabetes was regarded as meeting the relevant criteria. Based on the World Health Organization (WHO) Asia Pacific regional standards, participants with BMI of 18.5 to 25.0 kg/m2 were classified as non-obese, whereas those with a BMI >25.0 kg/m2 were classified as obese.23 According to metabolic health status (metabolically healthy vs unhealthy) and obesity (normal weight vs obesity), obesity phenotypes were classified into the following 4 groups: metabolically healthy non-obese (MHNO; N=14,240, 61.1%), metabolically unhealthy non-obese (MUNO; N=477, 2.0%), metabolically healthy obese (MHO; N=6796, 29.2%), and metabolically unhealthy obese (MUO; N=1797, 7.7%).
Statistical Analysis
In this study, categorical variables were presented as numbers and percentages, and continuous variables as mean and standard deviation. The independent sample t-test was conducted for ascertaining the sex-stratified general characteristics of the participants. One way ANOVA was performed to confirm the intergroup differences in anthropometric and biochemical variables, including VAI and LAP, according to the obesity phenotype. If significant intergroup differences were detected, the Scheffe post-hoc test (multiple comparison) was applied. In addition, a chi-square test was performed to compare categorical variables. To confirm the ability of VAI and LAP to accurately discriminate the obesity phenotypes, an area under the curve (AUC) was obtained using a receiver operating characteristic curve (ROC curve). The optimal cutoff value, sensitivity, specificity, and Youden Index of the VAI and LAP were obtained through the ROC curve. To verify the differences in the prevalence of obesity phenotypes according to the LAP and VAI quartiles, the odds ratio and 95% confidence interval were obtained through logistic regression after adjusting for age, systolic and diastolic blood pressure, TC, and fasting blood glucose. Statistical analysis in this study was performed with IBM SPSS Statistics 24.0 (IBM, NY, USA) and statistical significance was set to a two-tailed P<0.05 in all analyses.
Results
General Characteristics of the Study Population
The mean age in this study cohort was 45.37±11.26 years, and the mean waist circumference and BMI were 23.83±3.25 kg/m2 and 79.55±9.36 cm, respectively. The sex-stratified clinical characteristics of the study cohort are presented in Table 1. Compared to women, men were older and had higher BMI, waist circumference, blood pressure, TC, LDL-C, fasting blood glucose, HbA1c, uric acid, and hs-CRP (P<0.001 for all). However, HDL-C (P<0.001) and HOMA-IR (P=0.001) were significantly higher in women. In particular, the VAI and LAP were higher in men than in women (P<0.001 for all; Table 1).
 |
Table 1 Anthropometric and Biochemical Measures According to Sex |
Comparison of the Subgroups Defined by the Criteria of Metabolic Health Status and Obesity
The participants were classified into 4 groups according to their metabolic health status and obesity, and the results of the intergroup comparisons of clinical characteristics are presented in Table 2. Metabolically unhealthy participants were older than metabolically healthy participants and had higher systolic and diastolic blood pressure, TC, TG, fasting blood glucose, HbA1c, insulin, HOMA-IR, uric acid, and hs-CRP levels. However, metabolically unhealthy participants had lower HDL-C, In addition, the MUO group had the highest prevalence of abdominal obesity among risk factors for metabolic syndrome (85.2%) whereas the MUNO group showed the highest frequency of hypertension (56.8%), low HDL-C (61.6%), hyperglycemia (65.6%), and hypertriglyceridemia (97.4%). In the sex-stratified analysis of intergroup differences in the VAI and LAP, the highest VAI and LAP values for men was noted in the MUO group; however, for women, the VAI value was the highest in the MUNO group and the LAP value was the highest in the MUO group (P<0.001; Figure 1).
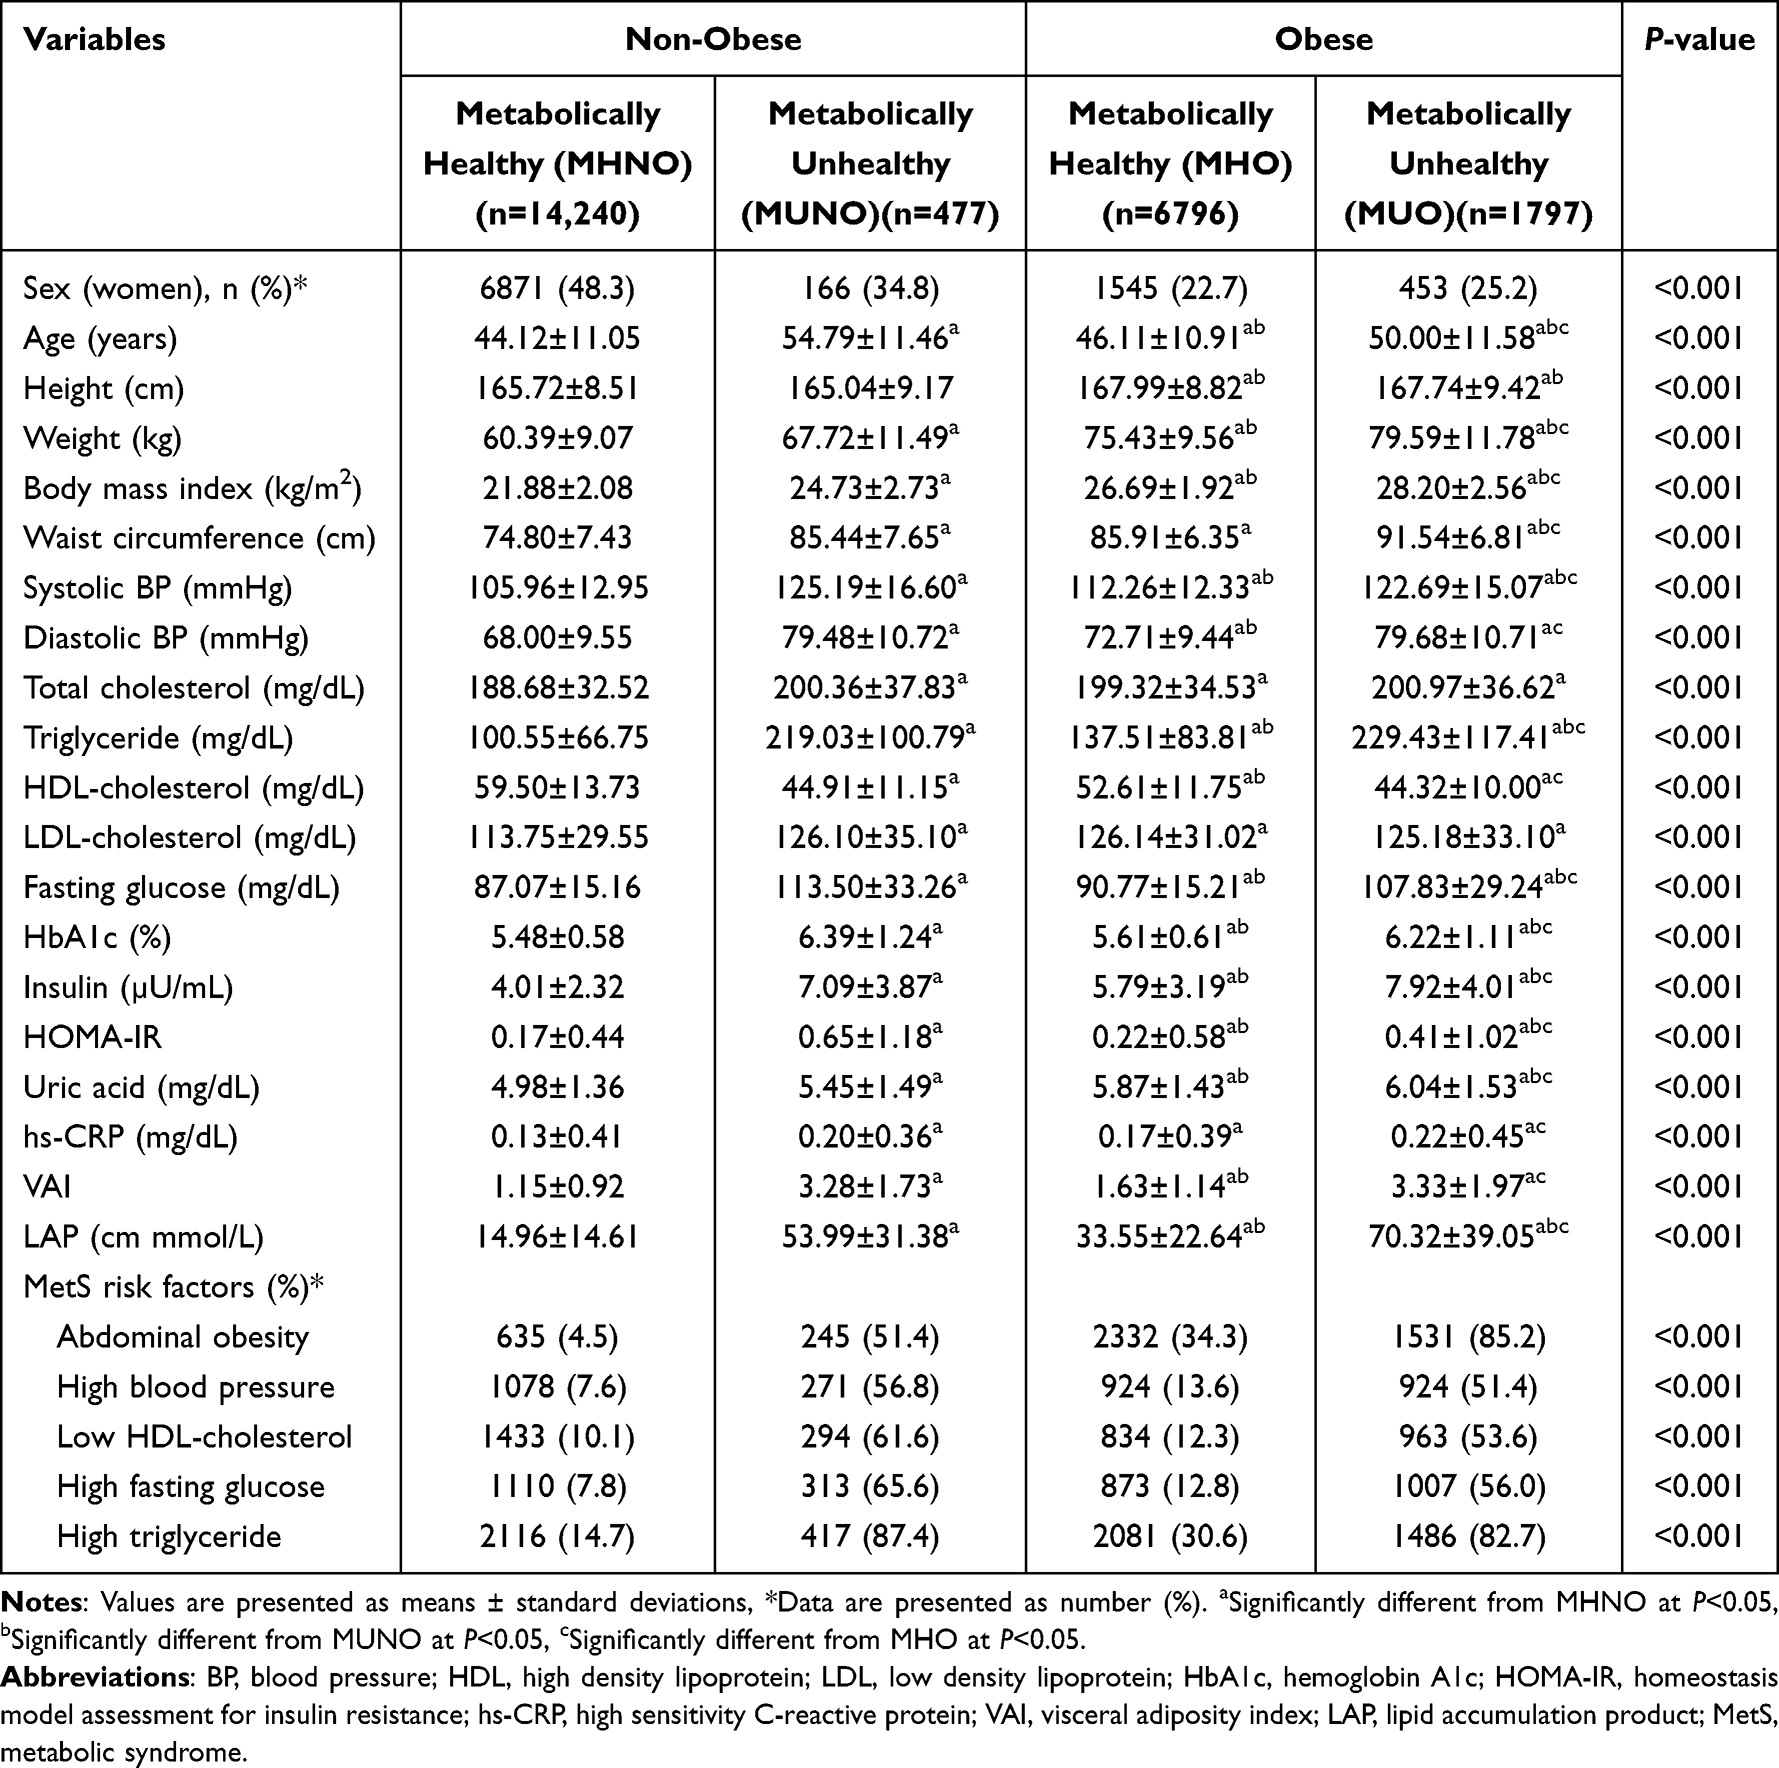 |
Table 2 Anthropometric and Biochemical Measures According to Obesity Phenotype |
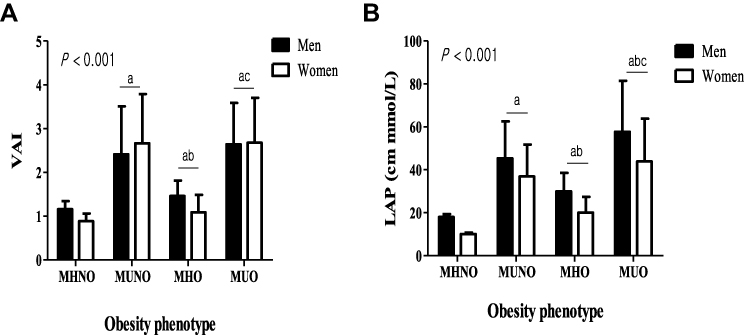 |
Figure 1 Difference between VAI (A) and LAP (B) according to obesity phenotype. Abbreviations: VAI, visceral adiposity index; LAP, lipid accumulation product; MHNO, metabolically healthy non-obese; MUNO, metabolically unhealthy non-obese; MHO, metabolically healthy obese; MUO, metabolically unhealthy obese. Notes: aSignificantly different from MHNO at P < 0.05. bSignificantly different from MUNO at P < 0.05. cSignificantly different from MHO at P < 0.05. |
Usefulness of VAI and LAP for Obesity Phenotype Identification
The usefulness of the VAI for identifying obesity phenotypes through ROC curves is presented in Table 3. For the VAI, the AUC in the MUO group was 0.877 (95% CI, 0.873–0.882, P<0.001), 0.849 (95% CI, 0.843–0.855, P<0.001), and 0.921 (95% CI, 0.916–0.927, P<0.001) for all participants, men, and women, respectively, and was optimal for identifying the MUO group. This was followed by the AUC value of the MUNO group, which was 0.865 (95% CI, 0.861–0.870), 0.829 (95% CI, 0.822–0.835), and 0.918 (95% CI, 0.912–0.924) in all participants, men, and women, respectively (all P<0.001), thereby indicating good discrimination ability. In addition, the optimal cutoff values of the VAI for identifying the MUO group were 1.83 for men and 1.58 for women, and the optimal cutoff values for identifying the MUNO group were 1.73 for men and 2.10 for women. For the LAP, the AUC in the MUO group was 0.923 (95% CI, 0.920–0.927), 0.907 (95% CI, 0.902–0.924), and 0.954 (95% CI, 0.949–0.958) in all participants, men, and women, respectively (all P<0.001), and had the best performance in identifying the MUO group. Next, the AUC value of the MHNO group was 0.817 for men whereas the AUC value for the MUNO group was 0.905 for women, indicating good discrimination ability. In addition, the optimal cutoff values of the LAP for identifying the MUO group were 41.45 for men and 23.83 for women (Table 4).
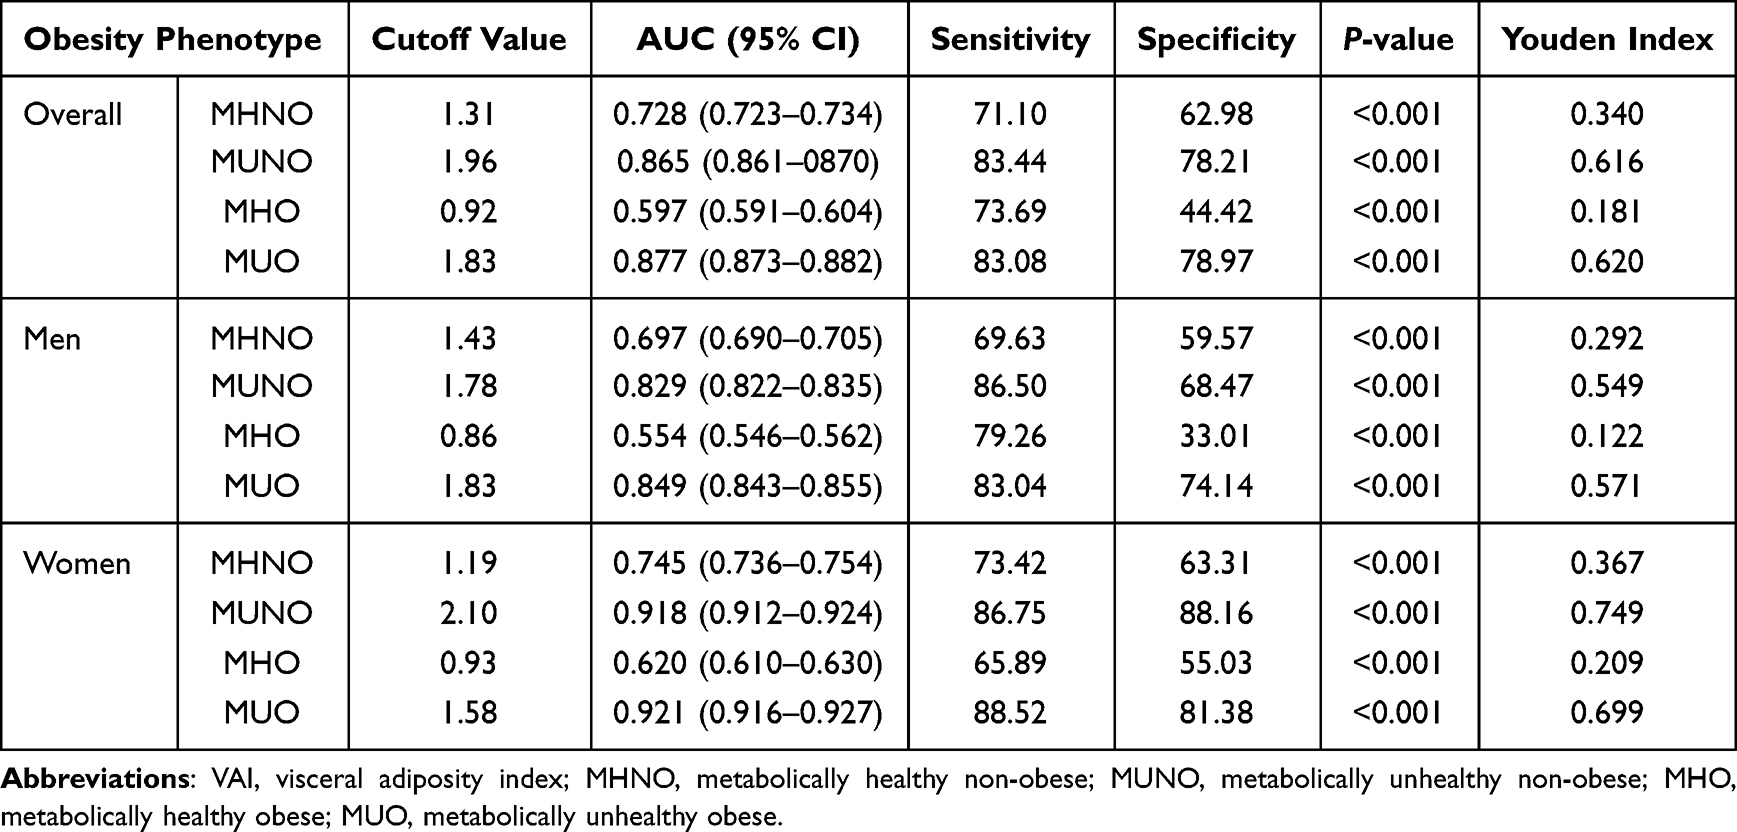 |
Table 3 Areas Under the Receiver Operating Characteristic Curve (AUC) for Detecting Obesity Phenotype with VAI |
 |
Table 4 Areas Under the Receiver Operating Characteristic Curve (AUC) for Detecting Obesity Phenotype with LAP |
Association Among the VAI, LAP, and Obesity Phenotype
The adjusted OR (95% CI) of the VAI for the obesity phenotype is presented in Table 5. After controlling for age, blood pressure, TC, and fasting blood glucose in men, the VAI of the MUO group had a hazard ratio of 5.633 (3.817–10.178) in the 4th quartile compared to the 1st quartile in the MUO group, whereas the hazard ratio of the MHO group was 1.876 (1.682–2.093) and of the MUNO group was 2.087 (1.422–9.590). For women, the hazard ratio of MUO increased to 1.468 (1.387–3.842), 2.463 (1.362–6.818), and 4.843 (1.140–8.988) as the quartiles of the VAI increased after controlling for related factors. The hazard ratio in the MHO group was 1.598 (1.324–1.929) in the 4th quartile compared to that in the 1st quartile. For the LAP, the hazard ratio of the MHO increased as the quartile increased in both men and women. Compared with the 1st quartile, the hazard ratio for the 4th quartile was 4.071 (1.917–8.893) for men and 4.750 (1.650–8.082) for women. Compared to the 1st quartile, the hazard ratio of MUO was 4.037 (2.335–4.887) in the 4th quartile for men; for women, the hazard ratio of MUO increased to 1.176 (1.142–3.717), 3.636 (1.427–5.512), and 5.893 (2.255–10.101) as the quartile increased (Table 6).
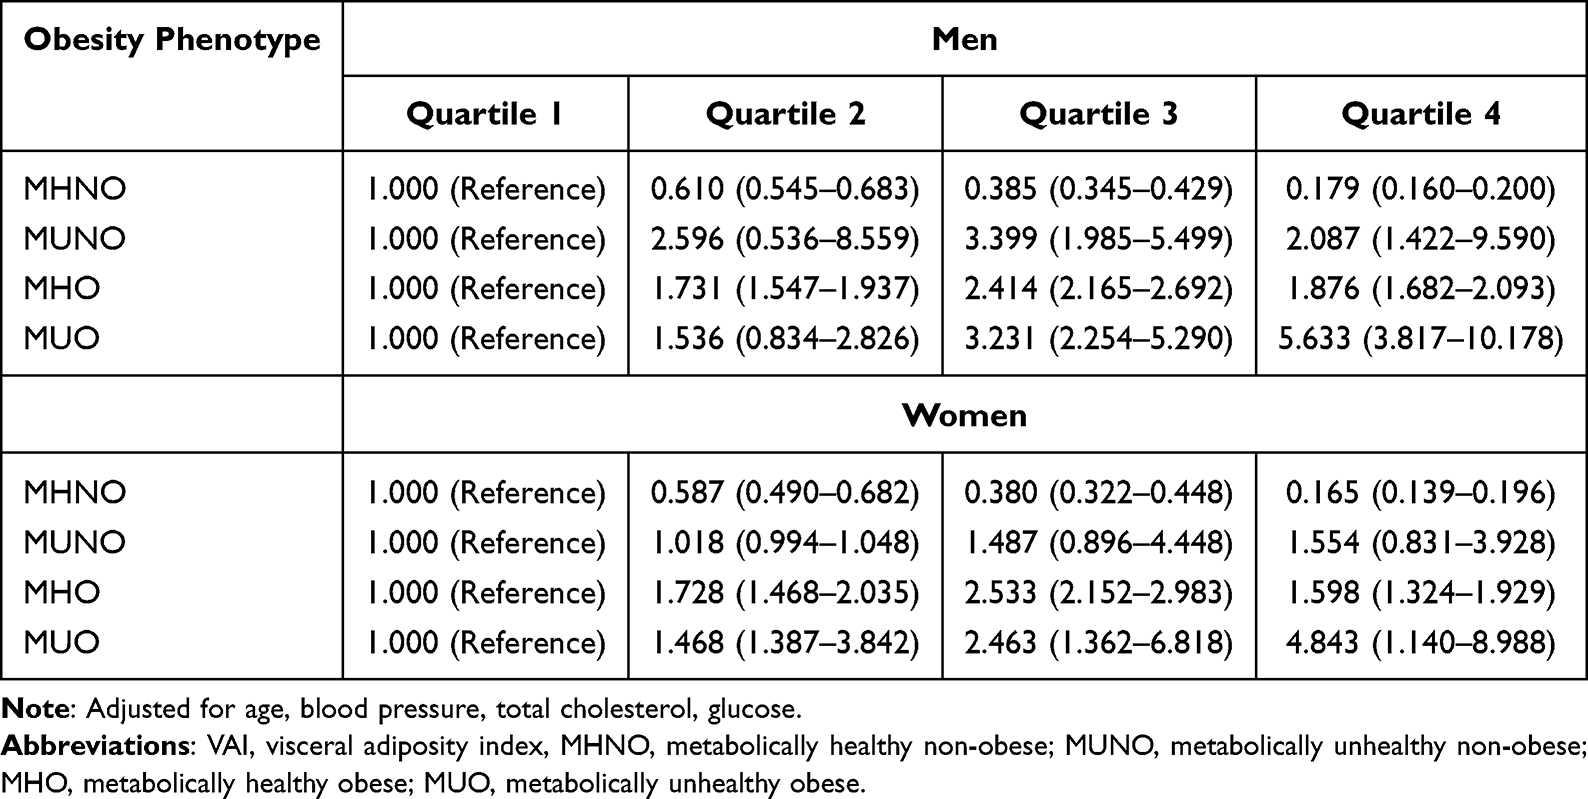 |
Table 5 Odds Ratios (OR) and 95% Confidence Intervals (CI) for Obesity Phenotype Associated with VAI |
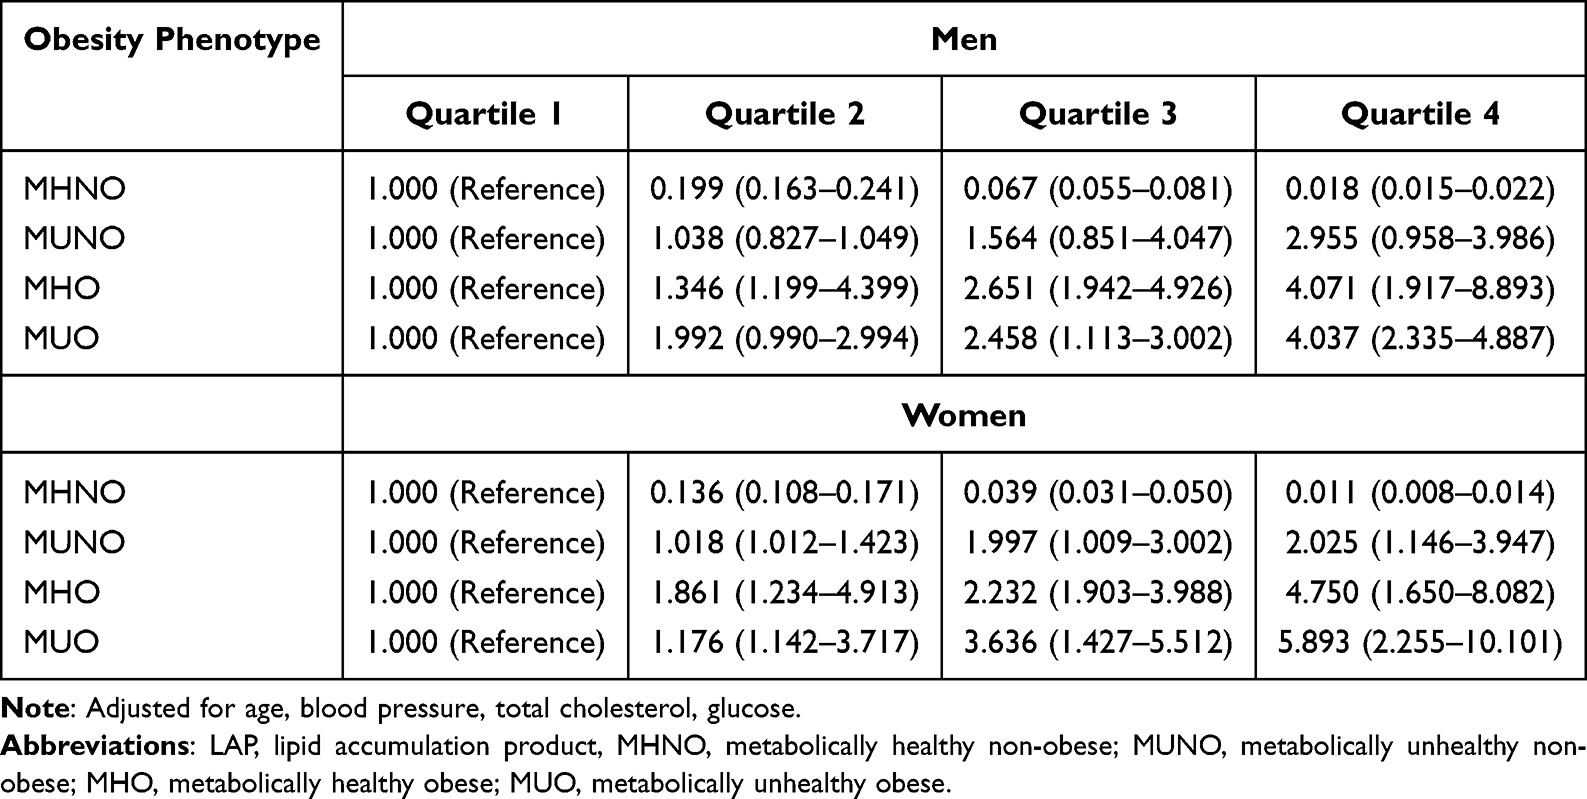 |
Table 6 Odds Ratios (OR) and 95% Confidence Intervals (CI) for Obesity Phenotype Associated with LAP |
Discussion
This study was conducted to verify whether the VAI and LAP are effective indicators for diagnosing four obesity phenotypes in South Korean adults, and our findings revealed that they were effective indicators for predicting the MUO phenotype. For both the VAI and LAP, the MUO group showed the highest diagnostic predictive ability, and the MHO group showed the lowest predictive ability. Additionally, the VAI and LAP were found to be associated with increased risk of MHO and MUO among the obesity phenotypes in both sexes.
Recently, with the increased awareness of the risk of visceral obesity, interest in measuring visceral fat more accurately has increased.24 The area of abdominal visceral fat measured by MRI is considered the best index for assessing abdominal obesity.25 Nevertheless, this method is unsuitable for measuring abdominal obesity because of the high cost and risk for some patients.15 The waist circumference, which predicts abdominal visceral fat, is a key component of metabolic syndrome, and visceral fat measurement is useful for differentiating the MUNO group from the MHO group among the obesity phenotypes.2,24,26 Obesity phenotypes are classified into four groups according to the presence or absence of metabolic syndrome and obesity based on BMI.27 However, BMI has limitations in accurately assessing the distribution of body fat in Asians, who have a relatively high body fat percentage compared to other races.28,29
Accordingly, the VAI and LAP are useful for measuring visceral obesity and are predictive indicators of the risk for metabolic syndrome.16,17 In addition, although the VAI and LAP were developed for healthy adults, these indices are effective for predicting the risk for metabolic syndrome in patients with chronic kidney disease or polycystic ovary syndrome (PCOS).15,16,30
The results of this study showed that the VAI had the best ability to discriminate the MUO phenotype in both men and women, and had relatively good ability to discriminate the MUNO phenotype. The optimal cutoff values of the VAI for identifying the MUO phenotype were 1.83 for men and 1.58 for women, and the optimal cutoff values for the MUNO phenotype were 1.73 for men and 2.10 for women. According to the findings of previous studies, the VAI could best predict the MUNO phenotype in both men and women and the MUO phenotype in women, and this study showed similar results.31,32 Furthermore, the results of this study showed that LAP had the best ability to identify the MUO group in both men and women, followed by relatively good ability to identify the MHNO group in men and the MUNO group in women. The optimal cutoff values of the LAP for identifying the MUO group were 41.45 for men and 23.83 for women, and showed a higher value in men. Du et al12 suggested that the VAI and LAP are effective markers for differentiating obesity phenotypes in adults. We conclude that the VAI and LAP are suitable predictors of the metabolically unhealthy status among the obesity phenotypes, presumably because these markers evaluate visceral fat.31 However, in our study, VAI and LAP showed the lowest ability for predicting the MHO group in both men and women. In particular, VAI had a low ability to identify the MHO group with an AUC of 0.597.
The optimal cutoff value of the VAI, which predicts the onset of metabolic syndrome in middle-aged and older South Koreans, was 1.84, whereas the optimal cutoff value for Caucasians is 1.90.16,33 In addition, the optimal cutoff values for the prediction of metabolic syndrome in patients with chronic kidney disease were 1.56 for men and 2.24 for women.15 The optimal cutoff values of the LAP for predicting the onset of metabolic syndrome in middle-aged and older South Koreans were 40.78 for men and 23.85 for women and, among Iranians, 39.9 for men and 49.7 for women.33,34 In addition, for patients with chronic kidney disease, the optimal cutoff values were 36.6 for men and 33.5 for women. As such, various cutoff values are reported depending on the study participants.15 This is likely related to the type of visceral fat accumulation.35 Although a direct comparison was difficult because no study has suggested optimal cutoff values for the VAI and LAP for diagnosing obesity phenotypes, in this study, we confirmed that the optimal cutoff values of VAI and LAP for predicting the MUO group were similar to the optimal cutoff values for predicting metabolic syndrome in middle-aged and older South Koreans.
The VAI and LAP are closely related to the MUNO phenotype, and are considered a more effective indicator than the BMI, waist circumference, waist-to-hip ratio, and waist-to-height ratio for identifying Chinese adults with the MUNO phenotype.12 In this study, the VAI and LAP values were higher in the MUNO and MUO groups than in the MHO group, and the VAI and LAP showed a correlation with the MHO and MUO groups among the obesity phenotypes in both men and women. Furthermore, this association was detected regardless of age, blood pressure, TC, and fasting blood glucose levels. These results suggest that the VAI and LAP constitute potential risk factors for cardiac metabolism.31 In particular, as the VAI and LAP are correlated with metabolic syndrome, these markers are effective indicators for predicting metabolically unhealthy obesity.19
This study had several limitations. First, owing to a cross-sectional study design, the causal relationship between the obesity phenotype and the VAI and LAP could not be confirmed. Additional large-scale cohort studies are needed to address this limitation. Second, there are no unified criteria for the obesity phenotype that may influence the outcomes. Third, the characteristics of lifestyle habits, such as drinking, smoking, and exercise, which can affect obesity, were not taken into consideration.
Conclusions
This study aimed to investigate whether VAI and LAP are effective indicators for diagnosis of obesity phenotypes in Korean adults. We confirmed that the VAI and LAP are closely related to the MUO phenotype and useful indices for predicting MUO phenotype amongst obesity phenotypes in South Korean men and women. The optimal cutoff values to identify the MUO group for VAI were 1.83 for men and 1.58 for women and those for LAP were 41.45 for men and 23.83 for women.
Abbreviations
BP, blood pressure; HDL, high density lipoprotein; LDL, low density lipoprotein; HbA1c, hemoglobin A1c; HOMA-IR, homeostasis model assessment for insulin resistance; hs-CRP, high sensitivity C-reactive protein; BMI, body mass index; VAI, visceral adiposity index; LAP, lipid accumulation product; MetS, metabolic syndrome; MHNO, metabolically healthy non-obese; MUNO, metabolically unhealthy non-obese; MHO, metabolically healthy obese; MUO, metabolically unhealthy obese.
Acknowledgments
The authors are highly grateful to the people who provided help for this study. The authors acknowledgments Myung Shin Kang for his assistance in obtaining the study approval of the research by the Institutional Review Board of Bundang Jesaeng Hospital.
Author Contributions
Both authors made a significant contribution to the work reported, whether that is in the conception, study design, execution, acquisition of data, analysis and interpretation, or in all these areas; took part in drafting, revising or critically reviewing the article; gave final approval of the version to be published; have agreed on the journal to which the article has been submitted; and agree to be accountable for all aspects of the work.
Funding
There is no funding to report.
Disclosure
The authors declare that there are no competing interests for this work.
References
1. Korea Ministry of Health and Welfare. Korean national health and nutrition examination survey ‘08–’20. Sejong: Ministry of Health and Welfare; 2022. Available from: https://www.index.go.kr/unify/idx-info.do?idxCd=8021.
2. Stefan N, Kantartzis K, Machann J, et al. Identification and characterization of metabolically benign obesity in humans. Arch Intern Med. 2008;168:1609–1616.
3. Khandekar MJ, Cohen P, Spiegelman BM. Molecular mechanisms of cancer development in obesity. Nat Rev Cancer. 2011;11:886–895.
4. Kahn SE, Hull RL, Utzschneider KM. Mechanisms linking obesity to insulin resistance and type 2 diabetes. Nature. 2006;444:840–846.
5. Van Gaal LF, Mertens IL, De Block CE. Mechanisms linking obesity with cardiovascular disease. Nature. 2006;444:875–880.
6. Flegal KM, Kit BK, Orpana H, Graubard BI. Association of all-cause mortality with overweight and obesity using standard body mass index categories: a systematic review and meta-analysis. JAMA. 2013;309:71–82.
7. Beleigoli AM, Boersma E, Diniz Mde F, Lima-Costa MF, Ribeiro AL. Overweight and class I obesity are associated with lower 10-year risk of mortality in Brazilian older adults: the Bambuí Cohort Study of Ageing. PLoS One. 2012;7:e52111.
8. Karelis AD. Metabolically healthy but obese individuals. Lancet. 2008;372:1281–1283.
9. Hinnouho GM, Czernichow S, Dugravot A, Batty GD, Kivimaki M, Singh-Manoux A. Metabolically healthy obesity and risk of mortality: does the definition of metabolic health matter. Diabetes Care. 2013;36:2294–2300.
10. Liu C, Wang C, Guan S, et al. The prevalence of metabolically healthy and unhealthy obesity according to different criteria. Obes Facts. 2019;12:78–90.
11. Phillips CM, Dillon C, Harrington JM, et al. Defining metabolically healthy obesity: role of dietary and lifestyle factors. PLoS One. 2013;8:e76188.
12. Du T, Yu X, Zhang J, Sun X. Lipid accumulation product and visceral adiposity index are effective markers for identifying the metabolically obese normal-weight phenotype. Acta Diabetol. 2015;52:855–863.
13. Hwang YC, Hayashi T, Fujimoto WY, et al. Visceral abdominal fat accumulation predicts the conversion of metabolically healthy obese subjects to an unhealthy phenotype. Int J Obes. 2015;39:1365–1370.
14. Aydin M, Bulur S, Alemdar R, et al. The impact of metabolic syndrome on carotid intima media thickness. Eur Rev Med Pharmacol Sci. 2013;17:2295–2301.
15. Biyik Z, Guney I. Lipid accumulation product and visceral adiposity ındex: two new indices to predict metabolic syndrome in chronic kidney disease. Eur Rev Med Pharmacol Sci. 2019;23:2167–2173.
16. Amato MC, Giordano C, Galia M, et al. Visceral Adiposity Index: a reliable indicator of visceral fat function associated with cardiometabolic risk. Diabetes Care. 2010;33:920–922.
17. Kahn HS. The “lipid accumulation product” performs better than the body mass index for recognizing cardiovascular risk: a population-based comparison. BMC Cardiovasc Disord. 2005;5:26.
18. Bozorgmanesh M, Hadaegh F, Azizi F. Predictive performances of lipid accumulation product vs. adiposity measures for cardiovascular diseases and all-cause mortality, 8.6-year follow-up: Tehran lipid and glucose study. Lipids Health Dis. 2010;9:100.
19. Zhang XH, Zhang M, He J, et al. Comparison of anthropometric and atherogenic indices as screening tools of metabolic syndrome in the Kazakh adult population in Xinjiang. Int J Environ Res Public Health. 2016;13:428.
20. Gordon-Larsen P, Adair LS, Meigs JB, et al. Discordant risk: overweight and cardiometabolic risk in Chinese adults. Obesity. 2013;21:E166–E174.
21. Moon K, Sung SH, Chang YK, et al. The association between Apolipoprotein E genotype and lipid profiles in healthy woman workers. J Prev Med Public Health. 2010;43:213–221. Korean.
22. Expert Panel on Detection, Evaluation, and Treatment of High Blood Cholesterol in Adults. Executive summary of the third report of The National Cholesterol Education Program (NCEP) expert panel on detection, evaluation, and treatment of high blood cholesterol in adults (Adult Treatment Panel III). JAMA. 2001;285:2486–2497.
23. WHO Expert Consultation. Appropriate body-mass index for Asian populations and its implications for policy and intervention strategies. Lancet. 2004;363:157–163.
24. Ozcelik F, Yiginer O, Dogan M, Tokatli A. The importance of visceral adipose tissue as a scale for assessing the metabolic syndrome and obesity. Eur Rev Med Pharmacol Sci. 2016;20:2475.
25. Hou X, Lu J, Weng J, et al. Impact of waist circumference and body mass index on risk of cardiometabolic disorder and cardiovascular disease in Chinese adults: a national diabetes and metabolic disorders survey. PLoS One. 2013;8:e57319.
26. Primeau V, Coderre L, Karelis AD, et al. Characterizing the profile of obese patients who are metabolically healthy. Int J Obes. 2011;35:971–981.
27. Choi JI, Cho YH, Lee SY, et al. The association between obesity phenotypes and early renal function decline in adults without hypertension, dyslipidemia, and diabetes. Korean J Fam Med. 2019;40:176–181.
28. Park YW, Allison DB, Heymsfield SB, Gallagher D. Larger amounts of visceral adipose tissue in Asian Americans. Obes Res. 2001;9:381–387.
29. Caterson ID, Gill TP. Obesity: epidemiology and possible prevention. Best Pract Res Clin Endocrinol Metab. 2002;16:595–610.
30. Abruzzese GA, Cerrrone GE, Gamez JM, et al. Lipid accumulation product (LAP) and visceral adiposity index (VAI) as markers of insulin resistance and metabolic associated disturbances in young Argentine women with polycystic ovary syndrome. Horm Metab Res. 2017;49:23–29.
31. Ferreira FG, Juvanhol LL, da Silva DCG, Longo GZ. Visceral adiposity index is a better predictor of unhealthy metabolic phenotype than traditional adiposity measures: results from a population-based study. Public Health Nutr. 2019;22:1545–1554.
32. Janghorbani M, Aminorroaya A, Amini M. Comparison of different obesity indices for predicting incident hypertension. High Blood Press Cardiovasc Prev. 2017;24:157–166.
33. Shin KA, Kim YJ. Usefulness of surrogate markers of body fat distribution for predicting metabolic syndrome in middle-aged and older Korean populations. Diabetes Metab Syndr Obes. 2019;12:2251–2259.
34. Motamed N, Razmjou S, Hemmasi G, Maadi M, Zamani F. Lipid accumulation product and metabolic syndrome: a population-based study in northern Iran, Amol. J Endocrinol Invest. 2016;39:375–382.
35. Kahn HS, Cheng YJ. Longitudinal changes in BMI and in an index estimating excess lipids among white and black adults in the United States. Int J Obes. 2008;32:136–143.
 © 2023 The Author(s). This work is published and licensed by Dove Medical Press Limited. The
full terms of this license are available at https://www.dovepress.com/terms
and incorporate the Creative Commons Attribution
- Non Commercial (unported, 3.0) License.
By accessing the work you hereby accept the Terms. Non-commercial uses of the work are permitted
without any further permission from Dove Medical Press Limited, provided the work is properly
attributed. For permission for commercial use of this work, please see paragraphs 4.2 and 5 of our Terms.
© 2023 The Author(s). This work is published and licensed by Dove Medical Press Limited. The
full terms of this license are available at https://www.dovepress.com/terms
and incorporate the Creative Commons Attribution
- Non Commercial (unported, 3.0) License.
By accessing the work you hereby accept the Terms. Non-commercial uses of the work are permitted
without any further permission from Dove Medical Press Limited, provided the work is properly
attributed. For permission for commercial use of this work, please see paragraphs 4.2 and 5 of our Terms.