Back to Journals » International Journal of Chronic Obstructive Pulmonary Disease » Volume 13
Validation of lung density indices by cardiac CT for quantification of lung emphysema
Authors Ronit A, Kristensen T, Çolak Y, Kühl JT, Kalhauge A ![]() , Lange P, Nordestgaard BG
, Lange P, Nordestgaard BG ![]() , Vestbo J
, Vestbo J ![]() , Nielsen SD, Kofoed KF
, Nielsen SD, Kofoed KF
Received 30 April 2018
Accepted for publication 16 July 2018
Published 11 October 2018 Volume 2018:13 Pages 3321—3330
DOI https://doi.org/10.2147/COPD.S172695
Checked for plagiarism Yes
Review by Single anonymous peer review
Peer reviewer comments 3
Editor who approved publication: Prof. Dr. Richard Russell
Andreas Ronit,1 Thomas Kristensen,2 Yunus Çolak,3 Jørgen Tobias Kühl,4 Anna Kalhauge,2 Peter Lange,5,6 Børge G Nordestgaard,3,7 Jørgen Vestbo,8 Susanne D Nielsen,1 Klaus F Kofoed2,4
1Department of Infectious Diseases 8632, Rigshospitalet, Copenhagen University Hospital, Copenhagen, Denmark; 2Department of Radiology, Rigshospitalet, Copenhagen University Hospital, Copenhagen, Denmark; 3Department of Clinical Biochemistry and the Copenhagen General Population Study, Herlev and Gentofte Hospital, Copenhagen University Hospital, Herlev, Denmark; 4Department of Cardiology, Rigshospitalet, Copenhagen University Hospital, Copenhagen, Denmark; 5Department of Public Health, Section of Social Medicine, University of Copenhagen, Copenhagen, Denmark; 6Medical Unit, Respiratory Section, Hvidovre Hospital, Copenhagen University Hospital, Hvidovre, Denmark; 7Faculty of Health and Medical Sciences, University of Copenhagen, Copenhagen, Denmark; 8Division of Infection, Immunity and Respiratory Medicine, University of Manchester, Manchester, UK
Objectives: Cardiovascular disease is often associated with COPD. Lung density quantification of images obtained from cardiac computed tomography (CT) scans would allow simultaneous evaluation of emphysema and coronary artery calcification score and provide further mechanistic insight into the relationship between these syndromes.
Patients and methods: We assessed the agreement between lung density indices obtained by cardiac and full-lung CT scans. Paired cardiac and chest CT scans were assessed in 156 individuals with and without airflow limitation. Quantitative threshold indices of low attenuation area (LAA) and 15th percentile density index (PD15) were compared in terms of precision using Spearman’s correlation coefficient, accuracy using concordance correlation coefficient (CCC), and relative accuracy using P15 and P30. We also assessed the relationship between visually and quantitatively determined emphysema and used receiver operating characteristic curves to evaluate the ability of lung density indices to discriminate airflow limitation.
Results: Correlation coefficients between lung density indices obtained from cardiac and chest CT scans were 0.49 for percent LAA (%LAA)-950 and 0.71 for PD15. Corresponding values for CCC, P15, and P30 were 0.33, 3.2, and 5.1, respectively, for %LAA-950, and 0.34, 17.3, and 37.8, respectively, for PD15. For both cardiac and chest CT scans, visually determined emphysema was associated with higher %LAA-950 and lower PD15, and the ability of %LAA-950 and PD15 to discriminate airflow limitation were comparable.
Conclusion: Although chest CT imaging is preferable, cardiac CT imaging may also be used for lung emphysema quantification where association measures are of primary interest.
Keywords: agreement, cardiac CT, chest CT, chronic obstructive pulmonary disease, emphysema, lung density
Introduction
Cardiovascular disease is often associated with COPD.1–4 Whether the association is due to shared risk factors or other undiscovered mechanisms is still unknown. Cardiac computed tomography (CT) imaging has been increasingly used both in clinical settings and for cardiovascular research, particularly for the determination of coronary artery calcium (CAC) score, which is believed to be an important predictor for future cardiovascular events and mortality.5,6 Although cardiac CT imaging has not been traditionally used for the determination of lung density indices, as the entire lung volume is not scanned, its use for quantification of lung emphysema would provide further insight into the mechanistic relationship between cardiovascular disease and COPD.7–9 Furthermore, assessment of both degree of CAC score and lung emphysema during cardiac CT imaging would provide important diagnostic information with therapeutic consequences in a clinical setting.
In the present study, we assessed the agreement between lung density indices from cardiac and chest CT for lung emphysema quantification. For this purpose, we included HIV-infected individuals, as these individuals would be expected to represent a broader disease spectrum10 and uninfected individuals from the general population. In addition, individuals with and without airflow limitation were included. First, we assessed the precision and accuracy of well-established lung density indices. Second, we assessed the ability of lung density indices to discriminate airflow limitation and the relationship between visual emphysema and quantitative measures of lung density.
Patients and methods
Study design and patient selection
Subjects who had undergone paired unenhanced chest and ECG-gated cardiac CT scans were randomly recruited from the Copenhagen Co-morbidity in HIV-infection (COCOMO) study and the Copenhagen General Population Study (CGPS). The COCOMO study is a cohort that tracks non-AIDS diseases in HIV-infected individuals in Denmark.11 The CGPS is a cohort study of the general population of Denmark.12 HIV-infected individuals were included, as these individuals have a higher burden of tobacco smoking and were expected to have more lung emphysema compared to individuals from the general population.10 In addition, we intended to include individuals with and without airflow limitation (approximately one-third of the entire study population). The study was approved by the Regional Ethics Committee of Copenhagen (H-15017350; H-KF-01-144/01). Written informed consent was obtained from all participants.
Spirometry and other measurements
All participants completed a comprehensive questionnaire about smoking and underwent a physical examination, including pre-bronchodilatory spirometry; details regarding data collection and procedures have previously been described.13 Predicted values for FEV1 and FVC were calculated according to the Global Lung Function Initiative (GLI).14 Airflow limitation was defined spirometrically as FEV1/FVC <the lower limit of normal (LLN), calculated according to the GLI, and as FEV1/FVC <0.7.
CT scanning procedure
All individuals underwent a paired unenhanced chest CT and electrocardiography (ECG)-gated cardiac CT scans; details regarding the scan protocol and scan parameters have previously been described.11,12 In brief, an Aquilion One Vision Edition scanner (Toshiba Medical Systems, Otawara, Japan) was used for both image acquisitions with the following settings: 120 kVp (both CT modalities), automated exposure control (SD15 and SD55), and reconstruction with filtered back projection and a soft tissue kernel (1 mm slice thickness) for chest CT scans and 3 mm slice thickness and interval for ECG-gated cardiac CT scans. Both CT modalities were acquired in sequence during the same visit. The chest CT was acquired during a deep inspiratory breath-hold, whereas the cardiac CT was acquired during a normal inspiratory breath-hold (around 50% of maximum lung capacity). Chest CT was acquired using spiral image acquisition including the entire lungs, whereas cardiac CT was acquired using ECG-gated, single rotation with a Z-axis from 8 to 16 cm depending on heart length in the Z-axis.
Emphysema scoring
For chest CT, lung emphysema was quantified using low attenuation area (LAA) ≤950 Hounsfield units and the 15th percentile density index (PD15).15 While there is at least some consensus regarding the optimal %LAA threshold for chest CT, there is no consensus regarding optimal %LAA cutoff values for cardiac CT, but differences in lung volumes and acquisition parameters are likely to be of influence.16,17 In addition to PD15, we therefore included a number of different cutoff values for the %LAA (−910 to −950). A representative cardiac CT slice is found in Figure S1. Furthermore, chest CT scans were also evaluated visually for lung emphysema using a 6-point semiquantitative scale. Visual lung emphysema was determined for the entire lung by a radiologist (author: TK) using a well-defined scoring system:18 score 0 =0% (none), 1 =1%–10% (trace), 2 =11%–25% (mild), 3 =26%–50% (moderate), 4 =51%–75% (severe), and 5 >75% (very severe) visual emphysema of the lung. Visual assessment was performed blinded to the quantitative analysis. Visual lung emphysema was dichotomized prior to analysis. Manual correction of lung segmentation was performed if the software failed to automatically and fully identify the whole lung parenchyma. Images obtained from chest CT and cardiac CT scans were scored using a dedicated lung density program Vitrea (Vital Images, Minnetonka, MN, USA).
Statistical analyses
Paired t-tests were used for comparisons of lung volumes obtained by chest and cardiac CT scans. Wilcoxon’s rank-sum test was used for comparisons of lung density indices in scans with and without visual emphysema. Correlations between the various emphysema indices were compared using Spearman’s rho (ρ) due to the skewed and heteroscedastic nature of the data. We evaluated accuracy using concordance correlation coefficient (CCC), defined as CCC = r×Cb, where r is the Pearson’s correlation coefficient (a measure of precision) and Cb is a bias correction factor that measures how far the best-fit line deviates from the 45° line through the origin (a measure of accuracy).19 We also calculated relative accuracy, defined as the cumulative percentage of cardiac CT scan emphysema indices falling within 15% (P15) or within 30% (P30) of chest CT emphysema indices. Agreement between PD15 by chest CT and PD15 by cardiac CT was evaluated using a Bland–Altman plot. Performance characteristics were evaluated by receiver operating characteristics (ROC) curves and area under the curve (AUC). In sensitivity analyses, we confined results to individuals without HIV infection. A P-value <0.05 was used to infer statistical significance. Statistical analyses were performed using R software version 3.3.2 (R Foundation for Statistical Computing, Vienna, Austria).
Results
Clinical and scan characteristics
In total, 156 individuals underwent paired cardiac and chest CT scanning. Most participants were white males aged >50 years with a relatively even distribution of current, former, and never-smokers (Table 1). Approximately, one-third of the study population had airflow limitation. Although mean (SD) lung volumes were significantly different between cardiac and chest CT scans (2.8 [0.9] L vs 5.8 [1.5] L, P<0.0001), the lung volumes correlated well with each other (ρ=0.72, P<0.0001). The lung density program was unable to automatically and fully identify the whole lung parenchyma in 24 (15%) cases of cardiac CT scans. Thus, a minor form of manual correction was necessary for these individuals. Mean (SD) lung volume increased from 2.3 (0.8) L to 3.3 (0.8) L, P<0.0001, in those cardiac CT scans that required a manual correction; however, the manual correction did not change mean values of %LAA or PD15; for %LAA-950 =Δ0.04 (2.1)%, P=0.93, and for PD15 =Δ0.6 (7.8) g/L, P=0.72.
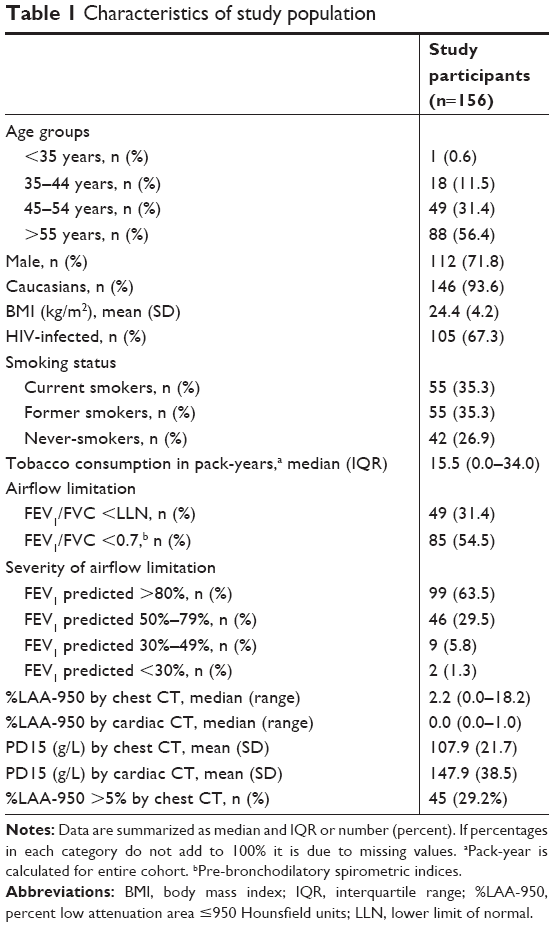 | Table 1 Characteristics of study population |
Association and agreement of lung density indices between cardiac and chest CT
In general, different thresholds of %LAA and PD15 from cardiac CT scans were at least moderately associated with %LAA-950 and PD15 obtained by chest CT scans. The highest correlation coefficient was obtained by PD15 from cardiac CT vs PD15 from chest CT (ρ=0.71, P<0.0001) (Table 2). The lowest correlation coefficient was obtained by %LAA-950 from cardiac CT vs %LAA-950 from chest CT (ρ=0.49, P<0.0001). Accounting the %LAA measures and PD15 for cardiac CT volumes did not significantly improve the correlation coefficients (Table 2). In contrast, the accuracy for all lung density indices from cardiac CT scans was poor (Table 2); %LAA-950 from cardiac CT vs %LAA-950 from chest CT CCC =0.33, P15 =3.2, and P30 =5.1, and PD15 from cardiac CT vs PD15 from chest CT CCC =0.34, P15 =17.3, and P30 =37.8. Likewise, the limits of agreement for PD15 were also wide with relatively many points in the Bland–Altman plot far from the mean (Figure 1). Similar results were observed in analyses restricted to individuals without HIV infection (Table S1). Furthermore, correlation coefficients for individuals with airflow limitation, defined as FEV1/FVC <LLN, were high for both %LAA-950 and PD15; for %LAA-950: ρ=0.68, P<0.0001, and for PD15: ρ=0.66, P<0.0001. In contrast, correlation coefficient for individuals without airflow limitation were low for %LAA-950 but high for PD15; for %LAA-950: ρ=0.36, P<0.001, and for PD15: ρ=0.72, P<0.0001.
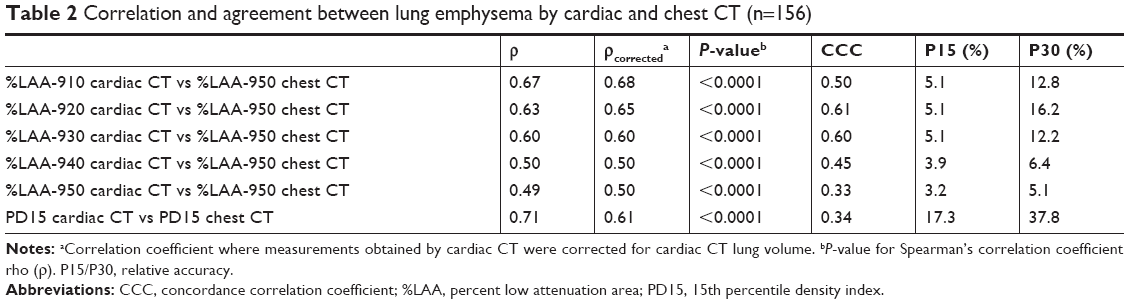 | Table 2 Correlation and agreement between lung emphysema by cardiac and chest CT (n=156) |
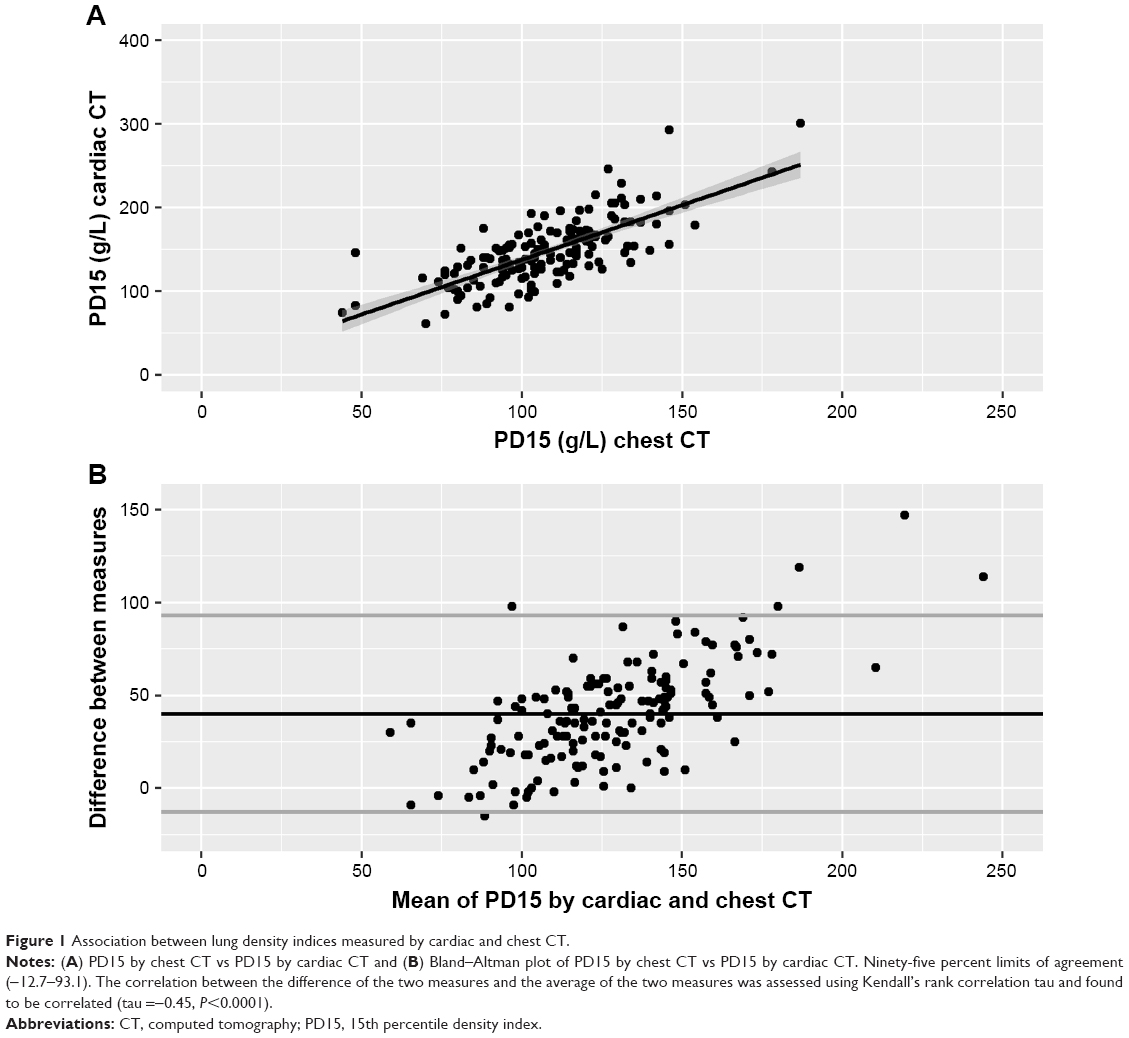 | Figure 1 Association between lung density indices measured by cardiac and chest CT. |
Association between lung density indices and airflow limitation
Individuals with high values of %LAA-950 were more likely to have low values of FEV1% predicted for both cardiac and chest CT (Figure 2). Performance characteristics were used to compare the ability of two modalities to classify airflow limitation defined as FEV1/FVC < LLN. ROC curves for %LAA-950 and PD-15 from chest CT and cardiac CT scans are depicted in Figure 3. Neither %LAA-950 nor PD15 was a good discriminator for airflow limitation; AUC for %LAA-950 was 0.66 (95% CI: 0.55–0.78) and for PD15 was 0.64 (95% CI: 0.53–0.75) in cardiac CT, and for %LAA-950 was 0.62 (95% CI: 0.51–0.73) and for PD15 was 0.62 (95% CI: 0.51–0.73) in chest CT. For individuals without HIV infection, the values for AUC seemed higher; AUC for %LAA-950 was 0.66 and for PD15 was 0.75 in cardiac CT, and for %LAA-950 was 0.70 and for PD15 was 0.77 in chest CT.
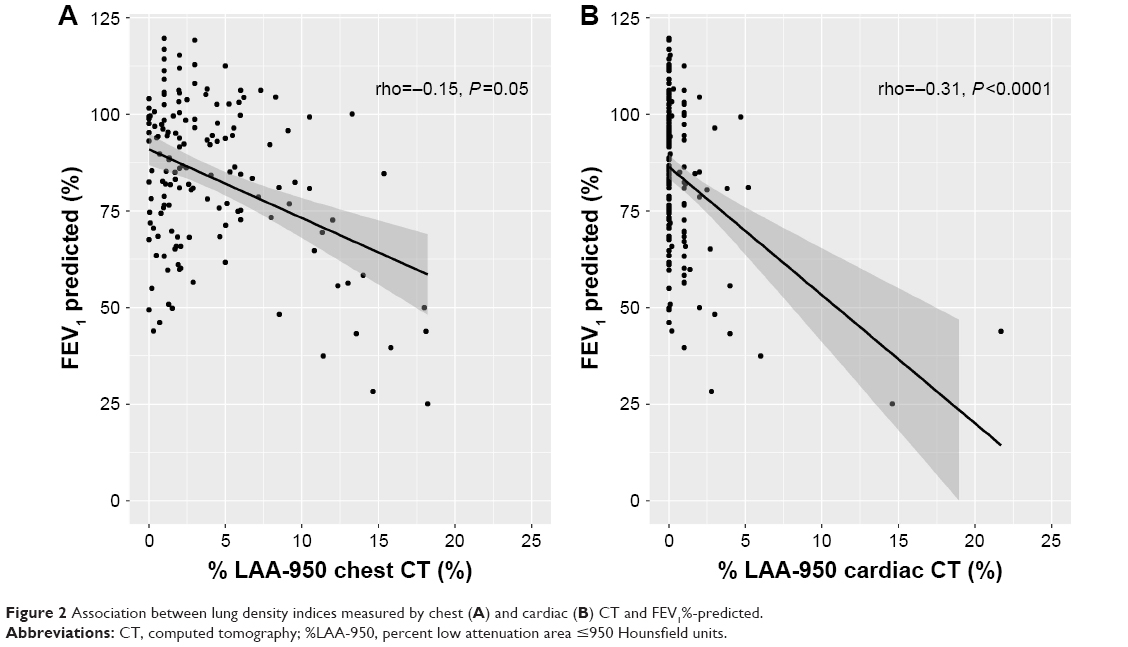 | Figure 2 Association between lung density indices measured by chest (A) and cardiac (B) CT and FEV1%-predicted. |
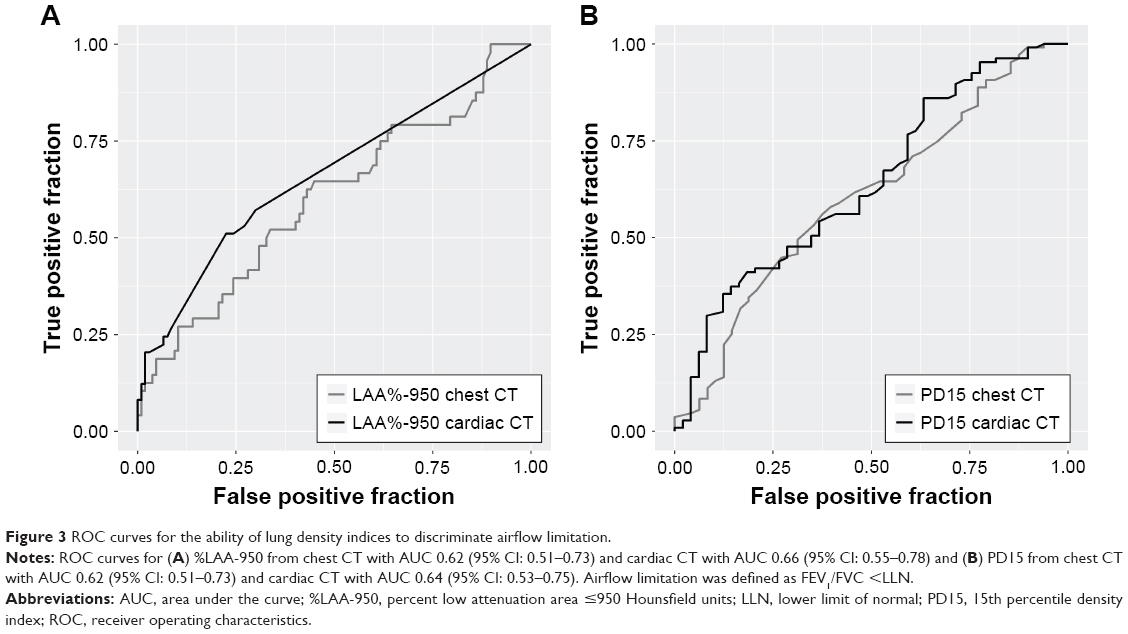 | Figure 3 ROC curves for the ability of lung density indices to discriminate airflow limitation. |
Association between visually and quantitatively assessed lung emphysema for cardiac and chest CT
Individuals with visually determined lung emphysema on chest CT had higher median [IQR] values of %LAA-950 compared to individuals without visually determined lung emphysema on both chest CT (score 2.0 [1.0–5.0] vs score 4.5 [1.6–11.2], P<0.01) and cardiac CT (score 0.0 [0.0–0.1] vs score 1.0 [0.0–2.5], P<0.0001) (Figure 4). Likewise, PD15 was lower for individuals with visually determined lung emphysema on chest CT compared to individuals without visually but quantitatively determined lung emphysema on both cardiac and chest CT. Similar results were observed in individuals without HIV infection (data not shown).
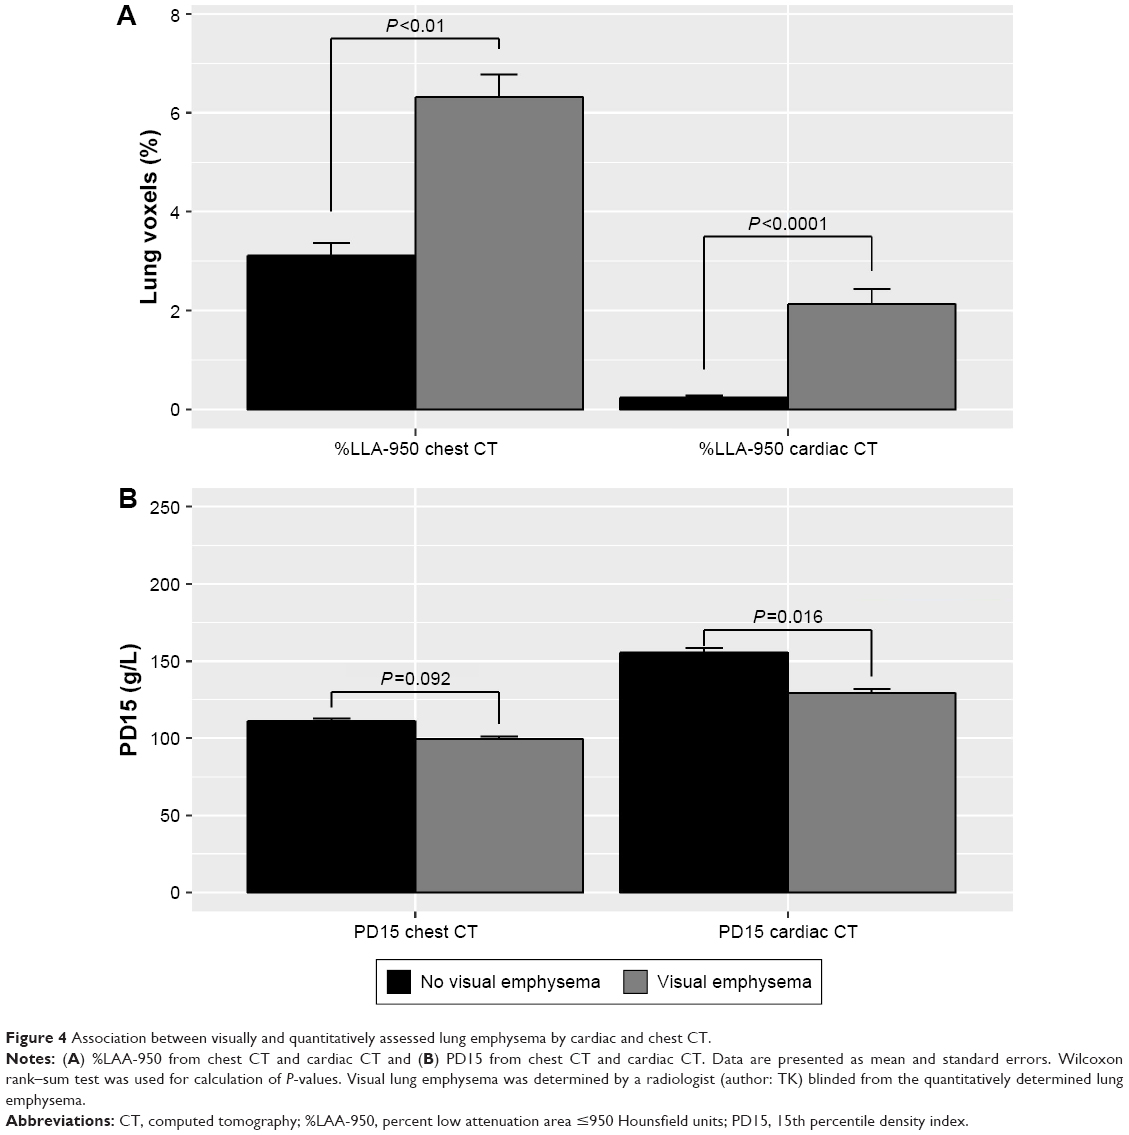 | Figure 4 Association between visually and quantitatively assessed lung emphysema by cardiac and chest CT. |
Using a lung emphysema threshold of >5% for %LAA-950 resulted in misclassification of 26 individuals (corresponding to 58%) on chest CT by not having visual emphysema, whereas none were misclassified on cardiac CT. Increasing the lung emphysema threshold to >10% reduced the misclassification rate on chest CT (from 58% to 32%) without affecting the misclassification rate on cardiac CT. In contrast, using a lung emphysema threshold of <5% for %LAA-950 resulted in misclassification of 23 individuals (21%) on chest CT and 41 individuals (27%) on cardiac CT by having visual emphysema. Increasing the lung emphysema threshold to <10% did not seem to affect the misclassification rate on chest CT (from 21% to 22%) or on cardiac CT (from 27% to 28%).
Discussion
Lung density indices obtained from cardiac CT scans were at least moderately correlated with lung density indices obtained from chest CT scans. Furthermore, lung density indices obtained from both acquisition types performed equally with regard to discriminating airflow limitation and both were associated with visually quantified emphysema. Nevertheless, the accuracy of cardiac CT lung density indices was overall poor, and absolute scores should therefore be interpreted with care. Yet, taking all of the findings together, it seems that cardiac CT imaging may be used for lung emphysema quantification where association measures are of primary interest.
Complete volumetric CT is the best method for the detection of lung emphysema in vivo,20 and lung density indices assessed by chest CT scans represent well-validated measures of lung emphysema severity.15,21 In contrast, assessing lung emphysema from cardiac CT scans is expected to be impeded by several factors, including lower lung volumes,16 lack of assessment of the upper parts of the lungs, and technical CT parameters (eg, scan exposure parameters and reconstruction algorithms).17 Lung volume, which is known to be the source of largest variation in lung attenuation,22 is of greatest concern as cardiac CT scans include only a limited field of view that encompasses only the thorax at the level of the heart. The low accuracies found in this study do suggest that cardiac CT cannot be used for clinical purposes in individual patients. As cardiac CT was not performed during full inspiration, lung volume (and thus density) is likely to have a wide variation which we cannot compensate for using the present setup.
Despite the barriers mentioned above, cardiac CT scans were at least moderately correlated with chest CT scans with regard to determining lung density indices. Overall, PD15 seemed to have the highest correlation in both individuals with and without HIV infection. Among patients with COPD, PD15 has also proven to be a potentially more useful marker for lung density decline compared to %LAA.23
We are not aware of studies comparing PD15 in cardiac and chest CT scans. To the best of our knowledge, only the Multi-Ethnic Study of Atherosclerosis (MESA) has previously performed a comparability study between %LAA derived from cardiac and chest CT scans,24 which has provided a methodological fundament for a number of subsequent studies using lung emphysema from cardiac CT scans.25,26 In their study, the correlation between lung emphysema threshold indices was found to be very strong (ρ=0.93); however, the analyses included only 24 individuals.24 The lower correlation found in our study may be explained by several factors. MESA participants were asked to take deep breaths in both CT modalities, thereby minimizing the mean difference of lung volumes. Images were mostly obtained by early generation scanners and reconstruction algorithms, which may have affected quantification of lung density indices. Moreover, participants in the MESA study primarily included healthy individuals with a low tobacco exposure and with less airflow limitation. Individuals in the present study are expected to have more emphysema in the upper parts of the lungs due to a higher tobacco exposure, which may not be detected using cardiac CT imaging.
We also assessed the association of %LAA-950 with FEV1% predicted for both modalities. It is well-known that some individuals with COPD, regardless of severity of airflow limitation, have extensive lung emphysema and some have no trace of it.27 In some studies, the degree of %LAA emphysema has been associated with steeper lung function decline,28 whereas other studies have demonstrated a poor association between airflow limitation and lung emphysema.29 In the present study, the association with FEV1% predicted was poor for both imaging modalities. However, it should be noted that we did not include a high proportion of individuals with severe airflow limitation which may explain the poor association with FEV1% and the inability to discriminate airflow limitation. In addition, both imaging modalities performed equally poor with regard to discriminating airflow limitation. Thus, lung density indices from both cardiac and chest CT scans seem to provide similar information that is different from spirometric indices. This may, in part, be explained by the fact that airflow limitation in early disease is not exclusively accounted for by the extent of emphysema.
Visually determined lung emphysema provides distinct and complementary information compared to quantitatively determined lung emphysema. Previous studies have shown only moderate concordance between these two methods.30 As expected, we also observed some degree of misclassification when different thresholds for %LAA-950 were chosen and compared to visually determined lung emphysema. Yet, it was noteworthy that the false-negative rate was comparable for both CT modalities, whereas cardiac CT had no false-positive rate. Thus, both CT modalities seem to perform equally bad in precluding visual lung emphysema; however, cardiac CT imaging seems to perform better in identifying visual lung emphysema compared to chest CT imaging. The relatively poor performance of the quantitative indices may also be explained by the ability of the radiologist to detect emphysema. Visual emphysema was determined using a semi-quantitative cutoff of ≥2, corresponding to >10% emphysema, but choosing a different cutoff may change the performance of the quantitative indices.
Our study has several limitations. First, we did not perform repeated CT scans to evaluate reproducibility. The MESA was well-powered (n=119) to assess the reproducibility and found a high correlation and intra-class correlation coefficient for %LAA; however, PD15 was not evaluated. Second, although we included HIV-infected individuals, results were similar in HIV-uninfected individuals, and it seems unlikely that HIV status alone would change the correlation between emphysema indices derived from chest CT vs cardiac CT. Third, it should also be noted that we did not include additional static lung volume measures and we did not study interstitial abnormalities or compare high attenuation areas between the two modalities. Finally, for unknown reasons, some form of minor manual correction of lung segmentation was necessary for some of the cardiac CT scans; however, pathological conditions were not the cause of cardiac CT segmentation failures, and manual corrections did not affect the lung density scores.
Conclusion
Lung density indices obtained from cardiac CT scans were at least moderately associated with lung density indices obtained from chest CT scans. Although chest CT imaging is preferable, it seems that cardiac CT imaging may also be used for lung emphysema quantification, where association measures are of primary interest.
Acknowledgments
We thank all the study subjects for their participation and the radiographic staff for their technical assistance. This work was supported by Rigshospitalet Research Council, Region Hovedstaden; the Lundbeck Foundation; the Novo Nordisk Foundation; and the Danish National Research Foundation grant 126. The study was designed, conducted, analyzed, and written by the authors without involvement of any commercial party.
Author contributions
AR was responsible for concept, data collection, statistical analyses, and drafted the manuscript. TK was responsible for concept, data collection, and drafted the manuscript. YÇ, JTK, AK, PL, BGN, and JV were responsible for concept and provided content review and editing input. SDN was responsible for concept, data collection, and provided content review and editing input. KK was responsible for concept, data collection, drafted the manuscript, and provided content review and editing input. AR is a guarantor of the manuscript. All authors contributed toward data analysis, drafting and critically revising the paper, gave final approval of the version to be published, and agree to be accountable for all aspects of the work.
Disclosure
YÇ received personal fees from Boehringer Ingelheim and AstraZeneca. JV received honoraria for consulting and presenting from AstraZeneca, Boehringer Ingelheim, Chiesi, GSK, and Novartis. SDN received grants from Canon Medical Corporation and AP Møller og hustru Chastine McKinney Møllers Fond, and unrestricted research grants from Novo Nordisk Foundation, Lundbeck Foundation, Augustinus Foundation, Rigshospitalet Research Council and traveling grants from Gilead, MSD, BMS, and GSK/ViiV, and performed advisory board activities for Gilead and GSK/ViiV. KFK performed advisory board activities for Gilead. The authors report no other conflicts of interest in this work.
References
Feary JR, Rodrigues LC, Smith CJ, Hubbard RB, Gibson JE. Prevalence of major comorbidities in subjects with COPD and incidence of myocardial infarction and stroke: a comprehensive analysis using data from primary care. Thorax. 2010;65(11):956–962. | ||
Mannino DM, Thorn D, Swensen A, Holguin F. Prevalence and outcomes of diabetes, hypertension and cardiovascular disease in COPD. Eur Respir J. 2008;32(4):962–969. | ||
Sin DD, Man SF. Why are patients with chronic obstructive pulmonary disease at increased risk of cardiovascular diseases? The potential role of systemic inflammation in chronic obstructive pulmonary disease. Circulation. 2003;107(11):1514–1519. | ||
Hole DJ, Watt GC, Davey-Smith G, Hart CL, Gillis CR, Hawthorne VM. Impaired lung function and mortality risk in men and women: findings from the Renfrew and Paisley prospective population study. BMJ. 1996;313(7059):711–715. | ||
Schuleri KH, George RT, Lardo AC. Applications of cardiac multidetector CT beyond coronary angiography. Nat Rev Cardiol. 2009;6(11):699–710. | ||
Detrano R, Guerci AD, Carr JJ, et al. Coronary calcium as a predictor of coronary events in four racial or ethnic groups. N Engl J Med. 2008;358(13):1336–1345. | ||
Williams MC, Murchison JT, Edwards LD, et al. Coronary artery calcification is increased in patients with COPD and associated with increased morbidity and mortality. Thorax. 2014;69(8):718–723. | ||
Rabinovich RA, Miller BE, Wrobel K, et al; Evaluation of COPD Longitudinally to Identify Predictive Surrogate Endpoints (ECLIPSE) Investigators. Circulating desmosine levels do not predict emphysema progression but are associated with cardiovascular risk and mortality in COPD. Eur Respir J. 2016;47(5):1365–1373. | ||
Martinez CH, Freeman CM, Nelson JD, et al; COPDGene Investigators. GDF-15 plasma levels in chronic obstructive pulmonary disease are associated with subclinical coronary artery disease. Respir Res. 2017;18(1):42. | ||
Drummond MB, Kirk GD. HIV-associated obstructive lung diseases: insights and implications for the clinician. Lancet Respir Med. 2014;2(7):583–592. | ||
Ronit A, Haissman J, Kirkegaard-Klitbo DM, et al. Copenhagen comorbidity in HIV infection (COCOMO) study: a study protocol for a longitudinal, non-interventional assessment of non-AIDS comorbidity in HIV infection in Denmark. BMC Infect Dis. 2016;16(1):713. | ||
Fuchs A, Mejdahl MR, Kühl JT, et al. Normal values of left ventricular mass and cardiac chamber volumes assessed by 320-detector computed tomography angiography in the Copenhagen General Population Study. Eur Heart J Cardiovasc Imaging. 2016;17(9):1009–1017. | ||
Ronit A, Lundgren J, Afzal S, et al. Airflow limitation in people living with HIV and matched uninfected controls. Thorax. 2018;73(5):431–438. | ||
Quanjer PH, Stanojevic S, Cole TJ, et al. Multi-ethnic reference values for spirometry for the 3-95-yr age range: the global lung function 2012 equations. Eur Respir J. 2012;40(6):1324–1343. | ||
Lynch DA, Al-Qaisi MA. Quantitative computed tomography in chronic obstructive pulmonary disease. J Thorac Imaging. 2013;28(5):284–290. | ||
Madani A, Van Muylem A, Gevenois PA. Pulmonary emphysema: effect of lung volume on objective quantification at thin-section CT. Radiology. 2010;257(1):260–268. | ||
Boedeker KL, Mcnitt-Gray MF, Rogers SR, et al. Emphysema: effect of reconstruction algorithm on CT imaging measures. Radiology. 2004;232(1):295–301. | ||
Wilson DO, Weissfeld JL, Balkan A, et al. Association of radiographic emphysema and airflow obstruction with lung cancer. Am J Respir Crit Care Med. 2008;178(7):738–744. | ||
Lin LI. A concordance correlation coefficient to evaluate reproducibility. Biometrics. 1989;45(1):255–268. | ||
Klein JS, Gamsu G, Webb WR, Golden JA, Müller NL. High-resolution CT diagnosis of emphysema in symptomatic patients with normal chest radiographs and isolated low diffusing capacity. Radiology. 1992;182(3):817–821. | ||
Sheikh K, Coxson HO, Parraga G. This is what COPD looks like. Respirology. 2016;21(2):224–236. | ||
Newell JD, Sieren J, Hoffman EA. Development of quantitative computed tomography lung protocols. J Thorac Imaging. 2013;28(5):266–271. | ||
Coxson HO, Dirksen A, Edwards LD, et al; Evaluation of COPD Longitudinally to Identify Predictive Surrogate Endpoints (ECLIPSE) Investigators. The presence and progression of emphysema in COPD as determined by CT scanning and biomarker expression: a prospective analysis from the ECLIPSE study. Lancet Respir Med. 2013;1(2):129–136. | ||
Hoffman EA, Jiang R, Baumhauer H, et al. Reproducibility and validity of lung density measures from cardiac CT Scans – The Multi-Ethnic Study of Atherosclerosis (MESA) Lung Study. Acad Radiol. 2009;16(6):689–699. | ||
Oelsner EC, Hoffman EA, Folsom AR, et al. Association between emphysema-like lung on cardiac computed tomography and mortality in persons without airflow obstruction: a cohort study. Ann Intern Med. 2014;161(12):863–873. | ||
Oelsner EC, Carr JJ, Enright PL, et al. Percent emphysema is associated with respiratory and lung cancer mortality in the general population: a cohort study. Thorax. 2016;71(7):624–632. | ||
Friedlander AL, Lynch D, Dyar LA, Bowler RP. Phenotypes of chronic obstructive pulmonary disease. COPD. 2007;4(4):355–384. | ||
Schroeder JD, Mckenzie AS, Zach JA, et al. Relationships between airflow obstruction and quantitative CT measurements of emphysema, air trapping, and airways in subjects with and without chronic obstructive pulmonary disease. AJR Am J Roentgenol. 2013;201(3):W460–W470. | ||
Baldi S, Miniati M, Bellina CR, et al. Relationship between extent of pulmonary emphysema by high-resolution computed tomography and lung elastic recoil in patients with chronic obstructive pulmonary disease. Am J Respir Crit Care Med. 2001;164(4):585–589. | ||
Barr RG, Berkowitz EA, Bigazzi F, et al; COPDGene CT Workshop Group. A combined pulmonary-radiology workshop for visual evaluation of COPD: study design, chest CT findings and concordance with quantitative evaluation. COPD. 2012;9(2):151–159. |
Supplementary materials
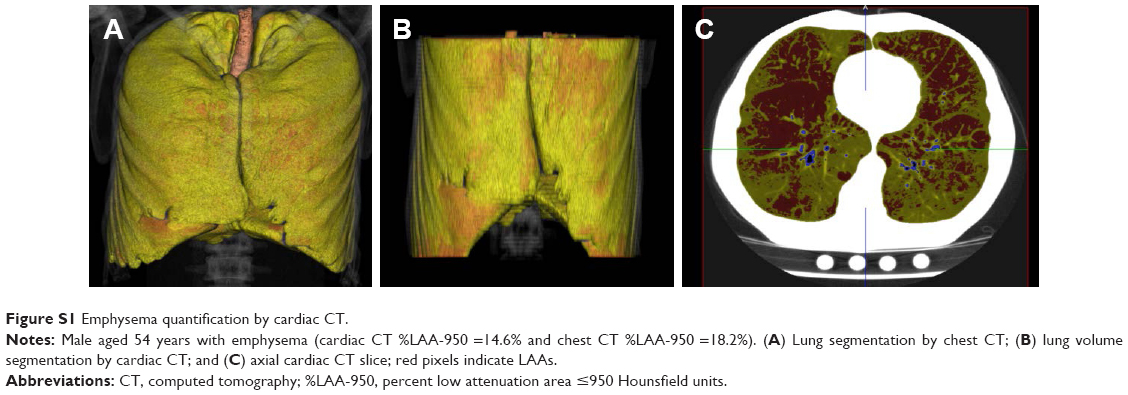 | Figure S1 Emphysema quantification by cardiac CT. |
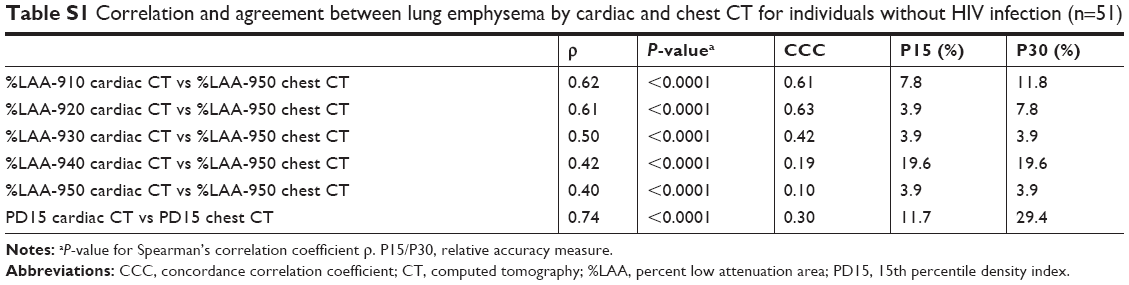 | Table S1 Correlation and agreement between lung emphysema by cardiac and chest CT for individuals without HIV infection (n=51) |
 © 2018 The Author(s). This work is published and licensed by Dove Medical Press Limited. The
full terms of this license are available at https://www.dovepress.com/terms
and incorporate the Creative Commons Attribution
- Non Commercial (unported, 3.0) License.
By accessing the work you hereby accept the Terms. Non-commercial uses of the work are permitted
without any further permission from Dove Medical Press Limited, provided the work is properly
attributed. For permission for commercial use of this work, please see paragraphs 4.2 and 5 of our Terms.
© 2018 The Author(s). This work is published and licensed by Dove Medical Press Limited. The
full terms of this license are available at https://www.dovepress.com/terms
and incorporate the Creative Commons Attribution
- Non Commercial (unported, 3.0) License.
By accessing the work you hereby accept the Terms. Non-commercial uses of the work are permitted
without any further permission from Dove Medical Press Limited, provided the work is properly
attributed. For permission for commercial use of this work, please see paragraphs 4.2 and 5 of our Terms.