Back to Journals » Journal of Multidisciplinary Healthcare » Volume 16
Validation of HF-Bioelectrical Impedance Analysis versus Body Mass Index in Classifying Overweight and Obese Pakistani Adults
Authors Anwer R ![]() , Baig LA, Musharraf M
, Baig LA, Musharraf M
Received 1 November 2022
Accepted for publication 6 March 2023
Published 7 April 2023 Volume 2023:16 Pages 983—996
DOI https://doi.org/10.2147/JMDH.S378367
Checked for plagiarism Yes
Review by Single anonymous peer review
Peer reviewer comments 3
Editor who approved publication: Dr Scott Fraser
Rabia Anwer,1 Lubna Ansari Baig,2 Mehjabeen Musharraf3
1Registered Dietitian Nutritionist, PNS Shifa Hospital, Karachi, 75270, Pakistan; 2Chairperson, APPNA Institute of Public Health, Jinnah Sindh Medical University, Karachi, 75510, Pakistan; 3Senior Lecturer, APPNA Institute of Public Health, Jinnah Sindh Medical University Karachi, Karachi, 75510, Pakistan
Correspondence: Rabia Anwer, THB Global, 59 C Khyaban-e-Seher DHA Phase 6, Karachi, 75500, Pakistan, Tel + 92 333-5289010, Email [email protected] Lubna Ansari Baig, APPNA Institute of Public Health, Jinnah Sindh Medical University, Karachi, 75510, Pakistan, Tel +92300-8239680, Email [email protected]
Purpose: To determine the validity of hand-to-foot bioelectrical impedance analysis (HF-BIA) versus body mass index (BMI) to assess overweight and obesity status in adults against a reference method, dual-energy x-ray absorptiometry (DXA).
Patients and Methods: It is a validation study conducted on 206 Pakistani adults ≥ 20 years recruited through convenience sampling technique at PNS Shifa Hospital and Jinnah Post Medical Centre, Karachi, Pakistan.
Results: HF-BIA showed better sensitivity of 90.1% and 100% specificity with no false positive, but 9% false negative as compared to BMI which indicated 80.3% sensitivity and 100% specificity with a false-negative rate of 19.6%.HF-BIA also showed better sensitivity 80.9– 97.1% with 100% specificity and PPV across all age groups. The correlation coefficient between BMI and DXA bf% (r=0.67) was moderate and less than the correlation coefficient between HF-BIA and DXA bf % (r=0.87). Kappa agreement showed weak to a fair agreement between BMI and DXA bf % (0.1 overall; 0.22 men; 0.14 women) compared to HF-BIA, which had a better agreement between BIA bf% and DXA bf% (0.43 overall; 0.46 men; 0.34 women). HF-BIA bf % demonstrated a better discriminatory power than BMI (AUC of ≥ 0.91) and was better predictor of body fat than BMI.
Conclusion: HF-BIA is a more accurate method than BMI and may be used consistently throughout the country in primary care and research to identify the fat-based overweight and obese in the Pakistani population.
Keywords: body fat, area under the curve, correlation, sensitivity, specificity
Introduction
Obesity has become an emerging public health concern; there is a continuous rise in the burden of obesity all over the world.
Overweight is a state in which body exceeds standard based on height whereas obesity is a condition where excessive adipose tissues either generalized or localized accumulates in the body and may impair health.1,2
Body mass index (BMI) endorsed by World Health Organization (WHO) and the Centers for Disease Control and Prevention (CDC) has been used universally to classify overweight and obese individuals at the population level3,4 mainly because of its simplicity as it only involves measurements of weight and height, but at the same time, it has been repeatedly criticized for having several limitations as it does not consider muscle mass, age, and gender in its estimation.5 Hand-to-foot bioelectrical impedance analysis (HF-BIA) on the other hand is a well-known method that is quick, non-invasive and gives reasonably accurate body composition estimation than BMI.6 It can be compared to dual x-ray absorptiometry (DXA) which is considered a gold standard,7 and can be used in field settings. Though studies have used different BIA techniques, but HF-BIA method has been validated for estimating body fat percentage (bf%) against different reference methods like total body water hydro-densitometry, dual-energy X-ray absorptiometry (DXA), and air displacement plethysmography.8 There is very limited data available on the diagnostic accuracy of BMI in assessing overweight and obesity in the Pakistani population. We found only one study that compared BMI with the BIA technique to estimate overweight and obesity, but both these techniques were not compared to any reference method.9 Therefore, there was a need to assess the validity of the BMI and in-built equation of HF-BIA for identifying obesity in Pakistani adults. The research aims to determine the validity of BMI and body fat % assessed by HF-BIA against a gold standard DXA bf% to assess which method performs better in diagnosing overweight and obesity in Pakistani adults. To our knowledge, this is the first investigation that will compare BMI and HF-BIA methods with DXA in identifying overweight and obesity in Pakistani population.
Materials and Methods
Study Design & Sampling Technique
It was a cross-sectional validation study. The sample size was calculated using the LinNaing calculator for sensitivity and specificity with an expected sensitivity of 77%, expected specificity of 100%,10 and expected prevalence of overweight and obesity of 37% taken from a previous study at a 95% confidence level and bound on error 1.0%.9 The minimum sample size obtained was 187. A total of 212 subjects were invited to participate in the study, but 206 total participants (80 males and 126 females) completed the data collection after 06 dropouts.
Study participants were recruited through the convenience sampling technique. The subjects were invited through text messages on WhatsApp and Facebook targeting different social groups, subjects were also recruited from hospital staff, patient attendants, offices, gyms, etc.
Inclusion Exclusion Criteria
BMI and BIA bf % estimation criteria are designed for individuals’ ≥20 yrs. Participants below this age, pregnant and lactating women were excluded.
Study Setting and Duration
Data collection was carried out at the PNS Shifa hospital radiology department and JPMC radiology department over a period of 4 months period.
Data Collection
Two trained and qualified dietitians collected the data including anthropometric measurements. Guidelines were followed to reduce both random and systematic measurement errors by repeated measurements, controlling extraneous variables and using calibrated tools. Data collection was supervised by the principal investigator.
Data Collection Tools
A structured questionnaire was used to collect study participants’ socio-demographic and anthropometric data. Weight was measured to the nearest 0.1kg in light clothing using a digital scale. Height was measured using a wall-mounted stadiometer to the nearest 0.1cm. Measurements were taken twice by two data collectors and values were averaged for a final measurement value. BMI was calculated as weight (kg)/height m2. Hand-to-foot bioelectric impedance analysis was carried out by making the subjects stand barefoot on the metal sole plates of the machine (Omron Body Fat Monitor, model HF 508, Japan). The hand device was held with both hands with arms stretched straight in front of the body. Age, sex, gender and height details were entered manually into the machine. The HF-BIA device then calculated body weight, and total body fat estimated in percentage using the standard built-in prediction equation for the given age group. Subjects were asked to refrain from food and drink for at least 6 hours and avoid urine before the analysis. DXA scan of participants were done after the hand-to-foot bioelectric impedance analysis on the same day using (Model V4.0.7.Medilink Medix DR) by trained technicians in PNS Shifa and JPMC hospital. Whole-body DXA (2D fan beam mode) was used to measure total body fat. DXA consisted of scanning the body with x-rays radiation exposure of 5 micro Sieverts. The attenuation of these rays by body tissues was subjected to computer analysis to yield measures of total bone mineral, total body fat-free tissue, and body fat. Subjects were asked to remove all metal accessories and were scanned in light clothing while lying flat on their backs with arms at their sides. The DXA examination included measurements of the whole body as well as in the trunk in three regions: (chest, abdomen, pelvis, arms, and legs). Total body fat was measured for each subject in percentages.
Statistical Analysis
Statistical analysis of data was done by (SPSS) Version 20.0. Demographic characteristics and body composition indices were presented in descriptive statistics (frequencies, distributions, mean, standard deviation (SD), median, and interquartile range (IQR)). Sensitivity, specificity, positive predictive value (PPV), and negative predictive value (NPV) of BMI and HF-BIA were computed in comparison to the bf% determined by DXA using 2 × 2 contingency tables. The agreement between BMI and DXA and HF-BIA and DXA was assessed using kappa statistics. Landis and Koch’s criterion was used to set the kappa index with the following levels of agreement: “from 0 to 0.19: poor; 0.2 to 0.39: weak; 0.4–0.59: moderate; 0.6 to 0.79: substantial; 0.8 to 1.0: almost perfect”.11 Spearman correlation was used to evaluate which index (BMI or BIA) correlates more strongly with DXA-derived fat percentage. The area under the curve (AUC) was determined by ROC (receiver operating characteristic) curves for both BMI and HF-BIA with DXA to identify the discriminatory capacity of each adiposity index for bf% at a 95% confidence interval (95% CI). The ROC was also used to determine optimal cutoffs for BMI and BIA in context with the bf % determined by DXA based on the best-balanced sensitivity and 1-specificity on the X- and Y-axis, respectively, for both genders. The area under the curve (AUC) of 1 represents a perfect test; 0.90–1.0 excellent, 0.80–0.90 good, 0.70–0.80 fair, 0.60–0.70 poor, 0.50–0.60 fail (F). The levels of significance for all statistical tests were set at p ≤0.05.
Results
The mean age of study participants was 37.9 ± 12.3 years. The demographic data of the study participant is presented in Table 1.
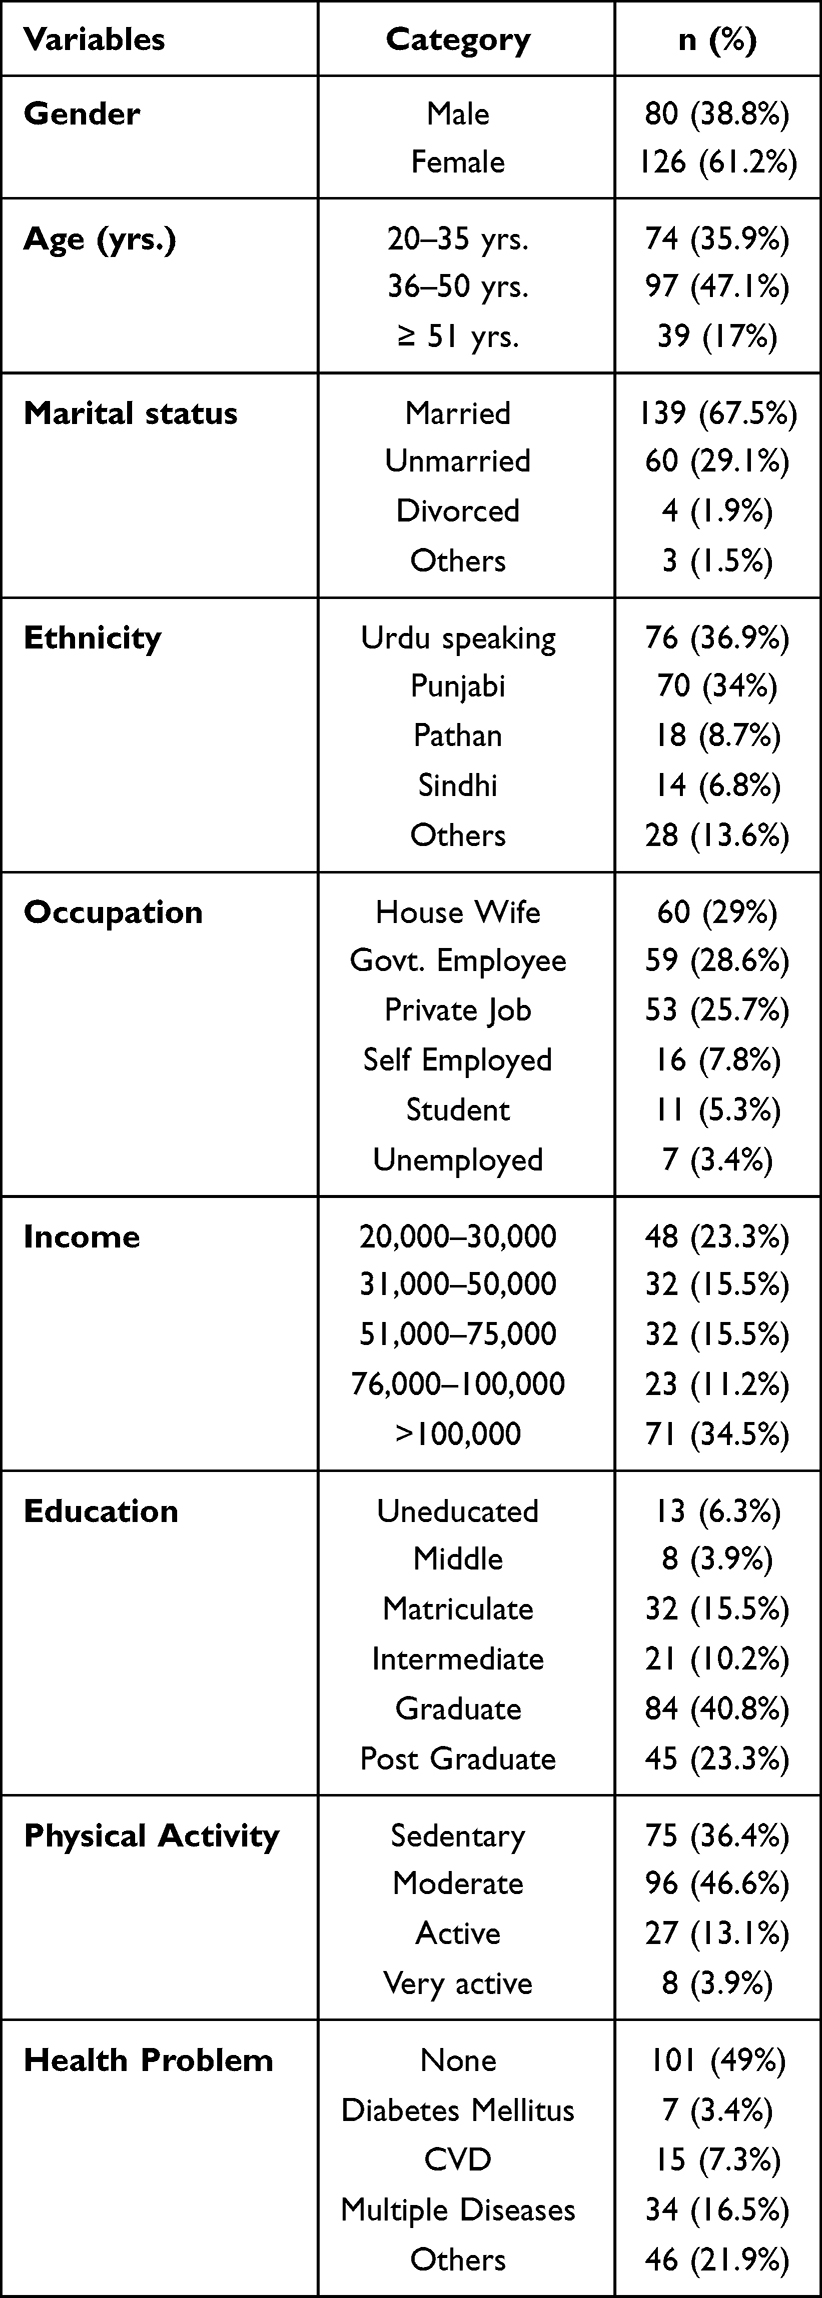 |
Table 1 Demographic Data of the Study Participants |
Gender-wise analysis showed a significant median difference between the genders in all body composition parameters (p<0.01) except age. Women participants showed high BMI and bf % than men (p. value 0.001) (Table 2).
 |
Table 2 Gender-Wise Body Composition Characteristics of Study Participants |
Age-wise analysis showed a significant mean difference across the age groups in all body composition parameters (p<0.01) with a significant increase in all the anthropometric indices with age (Table 3).
 |
Table 3 Age-Wise Analysis of Body Composition Characteristics of Study Participants |
We divided the study participants into normal-weight and obese groups according to WHO BMI cutoffs for the Asian population.11 For BIA- and DXA-derived bf% classification, we used cutoff values most frequently cited by international scientific literature12 (Table 4). HF-BIA showed better sensitivity (91%) than BMI (83%) and both showed 100% specificity when compared to DXA-derived bf % in the overall group (Table 5). The sensitivity of both BMI (84.7%) and HF-BIA (94.3%) was better in females than male subjects (BMI 73%; BIA 85%).
 |
Table 4 Body Adiposity Characteristics of Study Participants |
 |
Table 5 Sensitivity, Specificity, PPV, NPV of BMI and BIA |
The HF-BIA sensitivity was also better (80.9% −97.7%) than BMI (63.3–90%) for the diagnosis of bf %, with 100% specificity, PPV, and a better NPV across all age groups (Table 6). The sensitivity of BMI was lowest at 63.2% in the younger age group (20–35 yr.) with a false-positive rate of 36.7%.
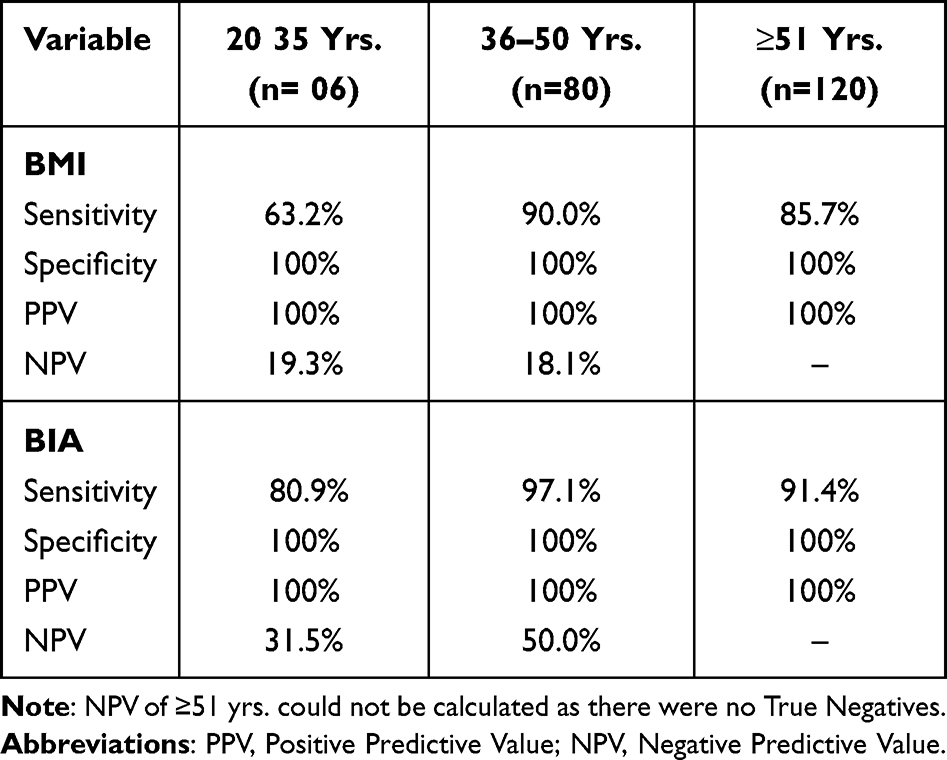 |
Table 6 Age-Wise Sensitivity, Specificity, PPV, NPV of BMI and BIA |
The results of the correlation coefficient are presented in Table 7 and Figures 1–3. The correlation coefficient between BMI and DXA bf % (r=0.67) was lower than the correlation coefficient between HF-BIA and DXA bf % (r = 0.87).
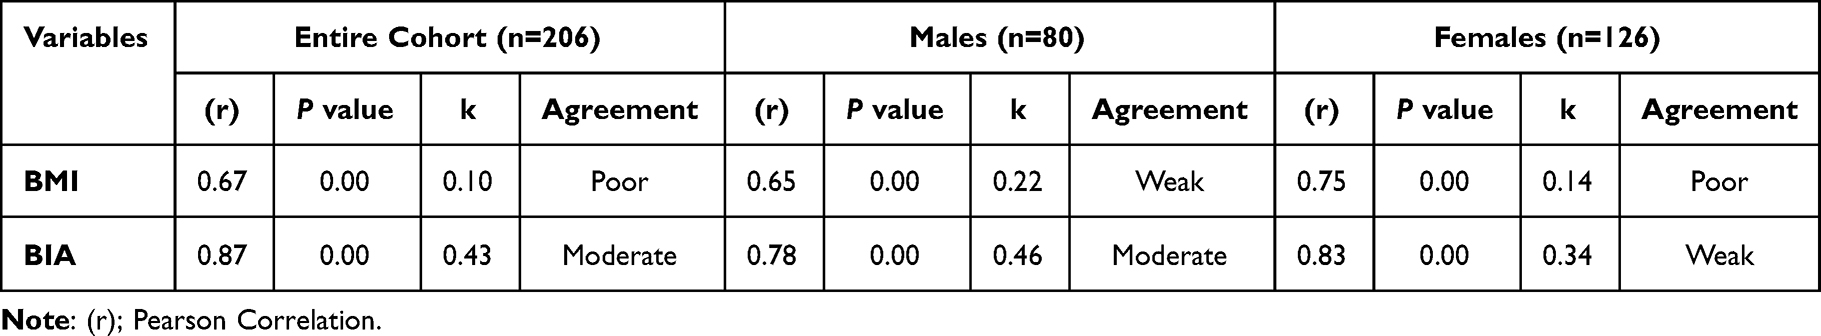 |
Table 7 Correlation and Kappa Agreement of Different Adiposity Methods Compared with DXA |
 |
Figure 1 Scatter plot showing correlation of BMI vs BIA BF % with DXA BF % in all subjects. |
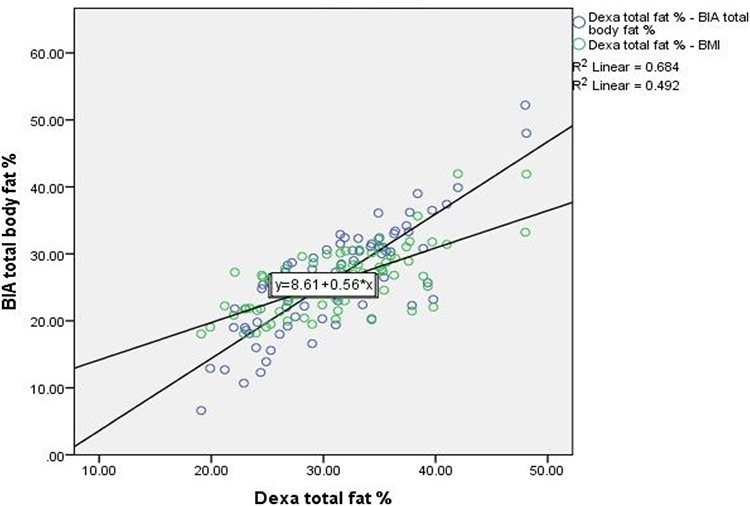 |
Figure 2 Scatter plot showing correlation of BMI vs BIA BF % with DXA BF % in male subjects. |
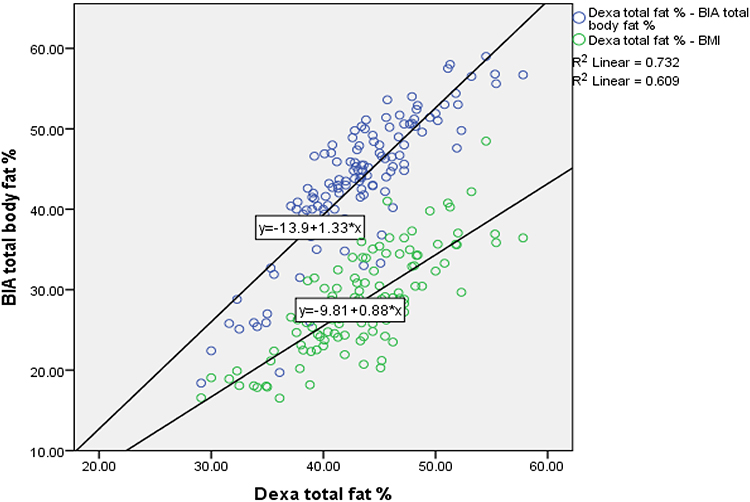 |
Figure 3 Scatter plot showing correlation of BMI vs BIA BF % with DXA BF % in female subjects. |
The kappa agreement showed slight to fair agreement between BMI and DXA bf% (0.1 overall; 0.22 men; 0.14 women) compared to HF-BIA, which had a better agreement between HF-BIA bf% and DXA bf% (0.43 overall; 0.46 men; 0.34 women) with a higher kappa agreement in men than in women (Table 7).
The area under the receiver operating curve (ROC) for BMI and HF-BIA bf % is presented in Table 8 and Figures 4–6. HF-BIA showed a better diagnostic power with a higher area under the curve (AUC) ≥0.94 than BMI (AUC) 0.89.
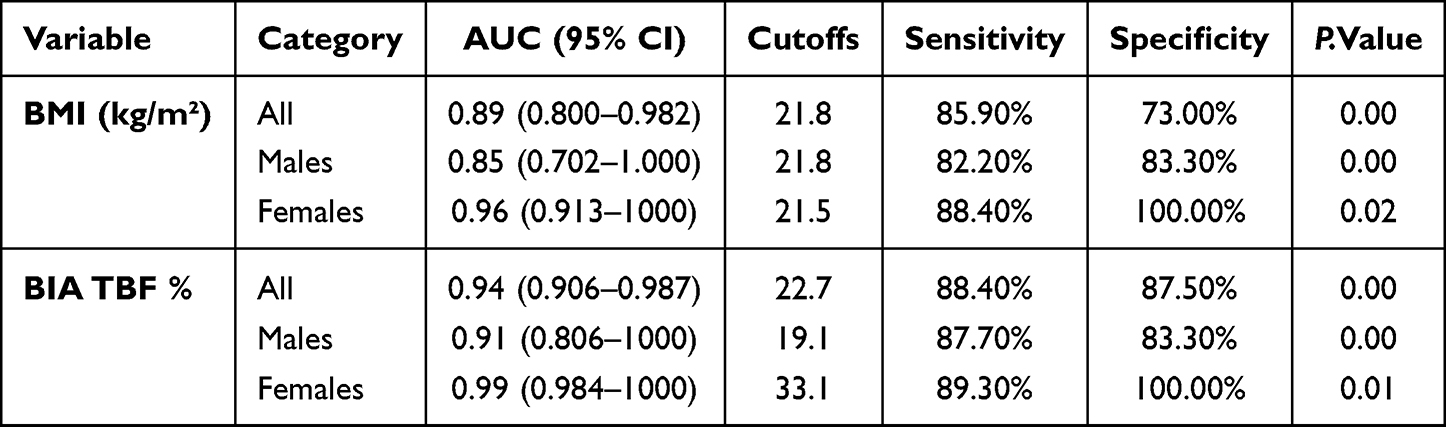 |
Table 8 Area Under the ROC Curve (AUC) with Optimal Cut-Off Points, Sensitivity, and Specificity of BIA & BMI |
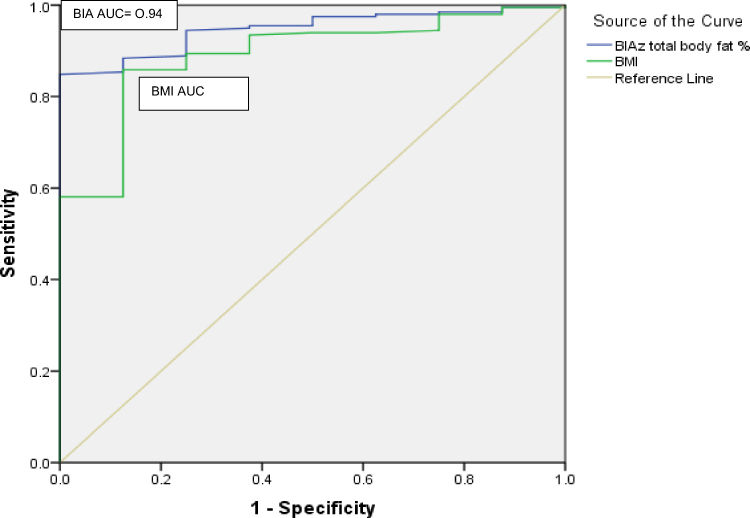 |
Figure 4 ROC curves of BIA BF % vs BMI in predicting excess body fat in all subjects. |
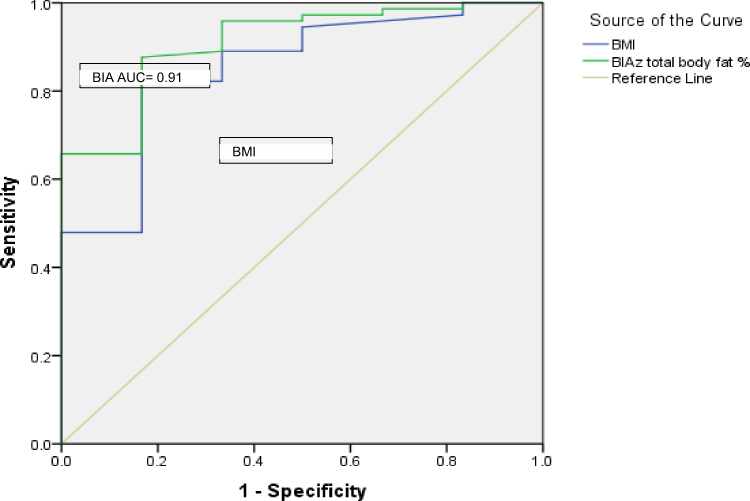 |
Figure 5 ROC curves of BIA BF % vs BMI in predicting excess body fat in male subjects. |
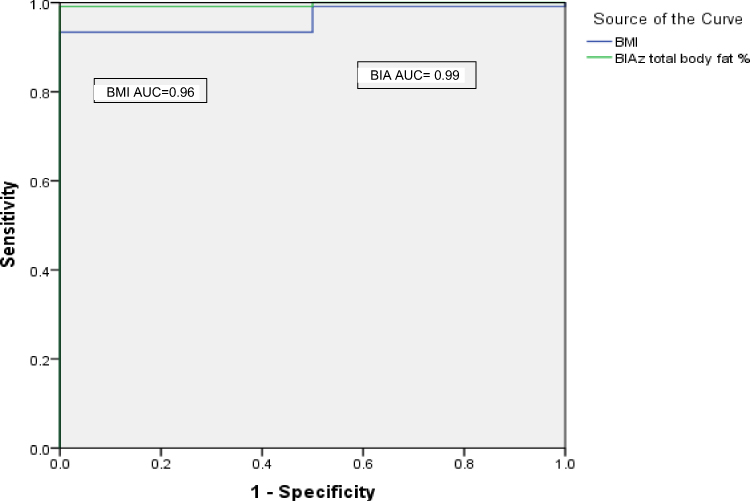 |
Figure 6 ROC curves of BIA BF % vs BMI in predicting excess body fat in female subjects. |
Discussion
The study found a significantly high BMI and bf% amongst women participants (p. value 0.001). A study on type 2 diabetic patients in AKU Karachi also found high bf % in almost all women.13 This usual trend of greater bf% in women is reported by other studies on different populations as well.14,15 The possible explanation of this gender difference is that sex hormones play a major role in the regulation of adipose tissue distribution, function, and stores. Studies show estrogen reduces a woman’s ability to burn energy after eating, resulting in more gluteal-femoral fat storage. The likely reason is to prime women for childbearing but after menopause, there is a shift towards storing more abdominal fat, apparently due to decreasing estrogen levels.15 Most of the women were premenopausal in the present study and they had more total body fat than postmenopausal women.
Our study found a significant increase in bf % with age in all subjects. Ranasinghe et al also observed a linear increase in bf% when study participants grew old, but BMI showed changes in a curvilinear manner with age, showing a reduction in BMI in old Sri Lankan subjects.4 Meeuwsen et al reported an increase in BMI with age in women, however, it became static between 40 and 70 years in men. At a static BMI, he reported an increase in body fat with age. The relationship between BMI and body fat was curvilinear rather than linear, with a poor association at low BMI values.8 Our study also observed a slight decrease in weight and BMI in participants ≥50 yrs. The decrease in weight in the older age group may be due to sarcopenia, a gradual decrease of muscle mass with age, buildup of body fat due to decreased physical activity, motor-unit transformation, declined hormone levels, and reduced protein synthesis related to the ageing process.15 So, the findings of our study support the current evidence that gender and age factors should be considered when estimating overweight/obesity by BMI in clinics as well as in public health interventions.
In our study, BMI showed 80.3% sensitivity in identifying fat-based-overweight and obesity suggesting that it can label 19.6% of subjects as either underweight or normal despite having low or high bf %. However, the higher specificity (100%) of BMI showed that it has a good ability to identify individuals who are not overweight and obese as it identified no false positives in the study participants. Most studies on the western population have reported poor sensitivity and good specificity of BMI.15,16 Romero et al reported that
BMI ≥ 30 in the US population had a high specificity (men=95% and women= 99%), but a poor sensitivity (men=36% and women=49%) to detect fat defined obesity hence BMI failed to discriminate between bf % and lean mass in both sexes15.
A meta-analysis of 32 studies determined the accuracy of body mass Index (BMI) to identify body fat also concluded that BMI has good specificity, but poor sensitivity of 50% as it labelled almost half of the subjects with excessive bf% as normal.16 The better sensitivity of BMI observed in our study than other studies done may be because we used Asian cutoffs of 23kg/m2 whereas most studies used western WHO cutoffs of 25kg/m², however when the BMI cutoffs were lowered to 23kg/m² and 22kg/m², the sensitivity improved.17,18 Yoon et al reported a good specificity (89% men; 84% women) at BMI ≥25kg/m2 and poor sensitivity (56% men; 72% women) for bf% derived obesity (25.2% men; 31.1% women). When the optimal BMI cut-off point (24.2 kg/m2) was used sensitivity improved to 78% and specificity was slightly reduced to 71% with better sensitivity and specificity in females than men.19 The study findings are consistent with the results of studies done on the Asian population using Asian BMI cutoffs. A study on Saudi adults by Habib et al reported BMI sensitivity of 76.4% and specificity of 88.2% at Asian BMI cutoffs.20 Another study conducted in North India by Verma et al observed that BMI had high sensitivity (67%) using Asian cutoffs than WHO standards (55%) in identifying hypertension and showed similar sensitivity to bf% assessment (69%),21 the study results are also consistent with our study’s findings reporting both BMI (84% in females and 73% in males) and BIA (94.3% in females and 84% in males) having better sensitivity in women than men. The sensitivity of BMI was lowest (63.2%) in the younger age group (20–35 yr.) in the present study with a false-positive rate of 36.7%. BMI classified 36.7% of normal subjects in this age group as obese and failed to differentiate fat mass from muscle mass. Sharpe et al also reported BIA to be a good measure of obesity with 86% sensitivity and 75% specificity as compared to BMI’s 55% sensitivity and 80% specificity in a study on schizophrenic patients.22 Piers et al also reported poor sensitivity of BMI compared to BIA.23 The low NPV value for both BMI and HF-BIA in the present study was due to the high prevalence (≥80%) of overweight and obesity in the study population.
The HF-BIA correlated better with DXA bf % (r=0.87) than BMI and DXA bf % (r = 0.67) in our study, demonstrating that BIA bf% has a strong relationship with DXA bf%. The correlation was stronger in women than men (BMI: men r = 0.65; women r=0.75; HF-BIA: men r=0.78: women r=0.82). The results of a large cross-sectional Chennai Urban-Rural Epidemiology Study (CURES) also reported a similar result with leg-to-leg impedance (BIA) showing a better correlation with DXA at r 0.772.24 Bolanowski et al also reported a significant correlation of HF-BIA with DXA-derived bf% (p. value 0.001) with sex-specific correlations slightly better for women when fat tissue was determined.25 However, Wang et al reported a strong correlation of BMI with bf% in both men (0.785, p.no 0.01) and women (0.864, p.no 0.01) in Chinese adults following the same trend of better correlation in women than men.26
The kappa analysis found better agreement between HF-BIA bf% and DXA bf% (0.43 overall; 0.46 men; 0.34 women) than between BMI and DXA bf% (0.1 overall; 0.22 men; 0.14 women) with a higher kappa agreement in men than in women. It means that HF-BIA is better than BMI in assessing fat-based obesity of the current study is consistent with the findings of other studies. A study done on older adults by Yulong Li in Iowa reported fair kappa agreement between HF-BIA bf% and DXA bf% (Kappa=0.36) with a higher agreement (Kappa=0.50) in males than females (Kappa=0.29).27 Gupta et al reported a strong kappa agreement between BIA and DXA for FM and FFM (0.992 and 0.947).28 A study done by Gonçalvesa et al also reported moderate (kappa =0.43) to substantial (kappa=0.65) agreement using different BIA devices. He also found moderate to weak agreement in females compared to male subjects.29 The poor agreement between BMI and DXA bf % in our study is consistent with the results of a study done on the Chinese population that also reported a weak agreement between Chinese BMI and bf % in men (kappa: 0.210) and a fair agreement in women (kappa: 0.327).26 Although BMI reasonably correlates with bf% in the present study similar to the findings of other research studies (26,31–33) but low kappa values in our study showed strong disagreement of Asian BMI cutoff ≥23 kg/m2 with bf% cutoffs cited in the international literature (≥25% in men; ≥35% in women).11,12
ROC analysis showed a better diagnostic power of HF-BIA device with a higher area under the curve (AUC ≥0.94) than BMI (AUC 0.89) in the study. This is consistent with the results reported by Romulo et al in which BIA bf% represented its discriminative power with high AUC values (males 0.89; females 0.82) in young Brazilians.29 Although studies have reported both underestimation and an overestimation of body fat by BIA when compared to DXA.30–33 Different impedance devices and the anonymous inbuilt prediction equations used in various research studies may be the reason behind this disagreement reported by different authors.34 Our study found a built-in equation of hand-to-foot bioelectrical impedance analyzer superior to body mass index in measuring total bf% in study participants.
The review of the literature suggests that individual factors like age, gender, and ethnicity affect body composition.28,30–36 The present study found high body fat at low BMI values in the study sample. In a study on Iranian subjects, Tayefi et al observed that a normal BMI on its own does not predict complications of obesity like CVD, dyslipidemia and diabetes defined by the increased bf% therefore it was suggested that body fat analysis among normal weight individuals can have an important contribution to the prevention of cardiovascular disease and other obesity-related conditions.35 Thus, the findings of our study support the recommendations that there is a requirement to identify population-based BMI cut-offs for estimating fat-based obesity among various ethnic groups.10,36 Instead of adjusting the BMI cut-off points for various populations, the WHO left the decision to the governments of respective Asian countries to identify country-based BMI cutoffs and has decided to observe the findings of different ongoing research in the future.11,36 Based on this pilot study, we have proposed an optimal BMI cut-off of 21.8kg/m2 with best-balanced sensitivity and 1-specificity using ROC curve analysis for Pakistanis adults to identify fat-based obesity. Misra et al also proposed a BMI cutoff of 21 kg/m2 to identify at least one risk factor with a sensitivity of 63.6% and specificity of 65.1% in a study on the North Indian adult population.18 Yoon et al found BMI AUC 0.82 to identify excess bf%, and proposed the optimum BMI cut-off of 24.2 kg/m2 with the best sensitivity and specificity in Korean adults; after gender-wise classification, he proposed 24.6 kg/m2 (80% sensitivity and 67% specificity) as the optimal cut-off point for men and 24.1 kg/m2 (74% sensitivity and 79% specificity) for women in the Korean population.19 Another study in North India found a higher AUC of 0.98 for BMI denoting a good fit in determining excess bf ≥30% in healthy premenopausal women. The optimal cutoff point proposed for BMI in the study was 23.1 kg/m2 with a high sensitivity of 98% (95% CI: 87.9–99.9%) and specificity of 80.6% (95% CI: 61.9–91.9%). After gender-wise classification, BMI showed less discriminatory power in men (AUC 0.876) than in women (AUC 0.943) (p. value 0.001). The BMI cut-off point of 23.6 kg/m2 for men and 24.2 kg/m2 for women corresponded well with bf % standards, respectively.37 The cutoff value for BMI proposed in the present study closely fits into the cut-off range of 21–24 kg/m2 determined by the previous studies.19,36 The current study found HF-BIA body fat % (AUC ≥0.91) to be a better judge of bf% based obesity than BMI.
Conclusion
The study suggests that hand-to-foot bioelectrical impedance analysis (HF-BIA) is a more valid method than BMI when compared with the reference method DXA. Though BMI is a simple and easy-to-calculate tool and shows a strong correlation with bf%, it should not be considered diagnostic as it tends to misclassify. Therefore, it may be used as a method for initial screening. The study found BMI cutoffs of 21.5 kg/m2 for females and 21.8 kg/m2 for males to be better cutoffs for improved sensitivity and specificity corresponding to the current international body fat cutoffs to assess overweight and obese individuals.12
Some of the limitations are the small sample size due to the high cost of the DXA test. All steps to control measurement errors were followed in the study, but some unmeasured or imprecisely measured errors may have persisted. However, our study results are comparable to the findings of other studies conducted in more controlled conditions. The participants were recruited by convenience sampling, therefore the results cannot be generalized. A similar large-scale study can be done to validate BIA and BMI methods for the adult Pakistani population. We used western body fat cutoffs, and as a result, it was observed that body fat percentage was higher at even very low BMI values in the study participants, however we did not associate the bf% with health outcomes, therefore it is recommended that further studies may be done to identify body fat % cutoffs for the Pakistani adults based on the several associated risk factors.
Abbreviations
AUC, area under the curve; BCM, Body Cell Mass; BF, Body Fat; BIA, Bioelectrical Impedance Analysis; BMI, Body Mass Index; CVD, Cardiovascular Disease; DALY, Disability Adjusted Life Years; DXA, Dual X‐Ray Absorptiometry; ECW, Extra Cellular Water; FFM, Fat-Free Mass; FM, Fat Mass; ICW, Intra Cellular Water; IQR, Inter Quartile Range; NCD, Non-Communicable Disease; NIH, National Institutes of Health; NHANES, National Health and Nutrition Examination Survey; NPV, Negative Predictive Value; PPV, Positive Predictive Value; ROC, Receiver Operating Characteristic; SD, Standard Deviation; TBF, Total Body Fat; WHO, World Health Organization.
Ethical Consideration and Consent to Participate
Study ethical approval was taken from the Ethical Review Board of Jinnah Sindh Medical University (JSMU). The study was conducted according to the principles of the Helsinki declaration.38 Participants were informed in detail about the procedures involved in the study and the purpose of the research. Both verbal and written consent was obtained from all subjects.
Acknowledgment
The author wishes to thank the Jinnah Sindh Medical University (JSMU) for providing partial financial and technical support for the study (Ref. No. JSMU/ Research/2019/-97). The author also wants to acknowledge the unconditional financial and technical support (BIA machine) provided by Pharmevo Pharmaceuticals in conducting the study. The author also wants to thank fellow dietitians and radiology technicians of PNS Shifa hospital and JPMC Radiology department who contributed to data collection.
Funding
The finance needed to undertake this study was covered by Jinnah Sindh Medical University (JSMU) and Pharmevo Pharmaceuticals.
Disclosure
The authors report no conflicts of interest in this work.
References
1. Khola NKN. Association between obesity and low serum vitamin D concentrations in healthy adult females: a public health perspective. JBUMDC. 2015;5:196–200.
2. Abarca-Gómez L, Abdeen ZA, Hamid ZA, et al. Worldwide trends in body-mass index, underweight, overweight, and obesity from 1975 to 2016: a pooled analysis of 2416 population-based measurement studies in 128· 9 million children, adolescents, and adults. Lancet. 2016;390:2627–2642.
3. Grier T, Canham-Chervak M, Sharp M, et al. Does body mass index misclassify physically active young men? Prev Med Rep. 2015;2:483–487.
4. Ranasinghe C, Gamage P, Katulanda P, et al. Relationship between body mass index (BMI) and body fat percentage, estimated by bioelectrical impedance, in a group of Sri Lankan adults: a cross-sectional study. BMC Public Health. 2013;13:797.
5. Ode JJ, Pivarnik JM, Reeves MJ, et al. Body mass index as a predictor of percent fat in college athletes and nonathletes. Med Sci Sports Exerc. 2007;39:403–409.
6. Kamariya C, Vachhani U. Usefulness of anthropometric parameters and the bioelectrical impedance analysis in assessment of obesity in young adults. Int.J.Med.Sci.Educ. 2019;6:95–99.
7. Aandstad A, Holtberget K, Hageberg R, et al. Validity and reliability of bioelectrical impedance analysis and skinfold thickness in predicting body fat in military personnel. Mil Med. 2014;179:208–217.
8. Meeuwsen S, Horgan GW, Elia M. The relationship between BMI and percent body fat, measured by bioelectrical impedance, in a large adult sample is curvilinear and influenced by age and sex. Clin Nutr. 2010;29:1.
9. Fatima SS, Rehman R, Chaudhry B. Body mass index or body fat! Which is a better obesity scale for the Pakistani population? JPMA. 2014;64:225.
10. Nevill AM, Metsios G. The need to redefine age-and gender-specific overweight and obese body mass index cutoff points. Nutr Diabetes. 2015;5:e186.
11. World Health Organization Expert Consultation. Appropriate body-mass index for Asian populations and its implications for policy and intervention strategies. Lancet. 2004;363:57–63.
12. Snitker S. Use of body fatness cutoff points. Mayo Clin Proc. 2010;85:1057.
13. Akhter O, Fiazuddin F, Shaheryar A, et al. Central adiposity is significantly higher in females compared to males in Pakistani type 2 diabetes mellitus patients. Indian J Endocrinol Metab. 2015;19:72.
14. Chen Y, Ho S, Lam S, Chan S. Validity of body mass index and waist circumference in the classification of obesity as compared to percent body fat in Chinese middle-aged women. Int J Obes. 2006;30:918–921.
15. Romero-Corral A, Somers VK, Sierra-Johnson J, et al. Accuracy of body mass index in diagnosing obesity in the adult general population. Int J Obes. 2008;32:959.
16. Mutsert R, Gast K, Widya R, et al. Associations of abdominal subcutaneous and visceral fat with insulin resistance and secretion differ between men and women: the Netherlands epidemiology of obesity study. Metab Syndr Relat Disord. 2018;16:54–63.
17. Okorodudu DO, Jumean MF, Montori VM, et al. Diagnostic performance of body mass index to identify obesity as defined by body adiposity: a systematic review and meta-analysis. Int J Obes. 2010;34:791–799.
18. Misra A, Vikram N, Gupta R, et al. Waist circumference cutoff points and action levels for Asian Indians for identification of abdominal obesity. Int J Obes. 2006;30:106–111.
19. Yoon JL, Cho JJ, Park KM, et al. Diagnostic performance of body mass index using the western pacific regional office of world health organization reference standards for body fat percentage. J Korean Med Sci. 2015;30:162–166.
20. Habib SS. Evaluation of obesity prevalence by comparison of body mass index with body fat percentage assessed by bioelectrical impedance analysis in Saudi adults. Biomed Environ Sci. 2013;26::94–9.
21. Verma M, Rajput M, Kishore K, et al. Asian BMI criteria are better than WHO criteria in predicting Hypertension: a cross-sectional study from rural India. J Fam Med Prim Care. 2019;8:2095–2100.
22. Sharpe JK, Byrne NM, Stedman TJ, et al. Bioelectric impedance is a better indicator of obesity in men with schizophrenia than body mass index. Psychiatry Res. 2000;159:121–126.
23. Piers L, Soares M, Frandsen S, et al. Indirect estimates of body composition are useful for groups but unreliable in individuals. Int J Obes. 2000;24:1145–1152.
24. Sudha VAM. Validation of body fat measurement by skinfolds and two bioelectric impedance methods with DEXA — the Chennai Urban Rural Epidemiology Study [CURES-3]. JAPI. 2004;52:877–881.
25. Bolanowski M, Nilsson BE. Assessment of human body composition using dual-energy x-ray absorptiometry and bioelectrical impedance analysis. Med Sci Monit. 2001;7:1029–1033.
26. Wang C, Hou X, Zhang M, et al. Comparison of body mass index with body fat percentage in the evaluation of obesity in Chinese. BES. 2010;23:173–179.
27. Day K, Kwok A, Evans A, et al. Comparison of a bioelectrical impedance device against the reference method dual energy X-ray absorptiometry and anthropometry for the evaluation of body composition in adults. Nutrients. 2018;10:1469.
28. Gupta N, Balasekaran G, Govindaswamy VV, et al. Comparison of body composition with bioelectric impedance (BIA) and dual-energy X-ray absorptiometry (DEXA) among Singapore Chinese. J Sci Med Sports. 2013;14:33–35.
29. Gonçalvesa VSS, de Fariab ER, Franceschinia SD, et al. The predictive capacity of different bioelectrical impedance analysis devices, with and without protocol, in the evaluation of adolescents. J Pediatr. 2013;89:567–584.
30. Kesavachandran CN, Bihari V, Mathur N. The normal range of body mass index with high body fat percentage among male residents of Lucknow city in north India. Indian J Med Res. 2012;135:72–77.
31. Roubenoff R. Applications of bioelectrical impedance analysis for body composition to epidemiologic studies. Am J Clin Nutr. 1996;64:459S–62S.
32. Coppini LZ, Waitzberg DL, Campos AC. Limitations and validation of bioelectrical impedance analysis in morbidly obese patients. Curr Opin Clin Nutr Metab Care. 2005;8:329–332.
33. Heo M, Faith MS, Pietrobelli A, et al. Percentage of body fat cutoffs by sex, age, and race-ethnicity in the US adult population from NHANES 1999–2004. Am J Clin Nutr. 2012;95:594–602.
34. Wang J, Thornton JC, Russell M, et al. Asians have lower body mass index (BMI) but higher percent body fat than do whites: comparisons of anthropometric measurements. Am J Clin Nutr. 1994;60:23–28.
35. Tayefi M, Darroudi S. There is an association between body fat percentage and metabolic abnormality in normal weight subjects: Iranian large population. Transll Metab Syndr Res. 2019;1:11–16.
36. Stevens J. Ethnic-specific cutpoints for obesity vs country-specific guidelines for action. International journal of obesity and related metabolic disorders. J Int Assoc Stud Obes. 2003;27:287–288.
37. Gupta S, Raghuvanshi RS. Receiver Operating Characteristic (ROC) curve analysis of BMI and other adiposity indices with body fat percent as standard in North Indian premenopausal women. Int J Agric Stat Sci. 2018;14:469–473.
38. World Medical Association Declaration of Helsinki. Ethical principles for medical research involving human subjects. J Med Assoc. 2013;20:2191–2194.
 © 2023 The Author(s). This work is published and licensed by Dove Medical Press Limited. The
full terms of this license are available at https://www.dovepress.com/terms
and incorporate the Creative Commons Attribution
- Non Commercial (unported, 3.0) License.
By accessing the work you hereby accept the Terms. Non-commercial uses of the work are permitted
without any further permission from Dove Medical Press Limited, provided the work is properly
attributed. For permission for commercial use of this work, please see paragraphs 4.2 and 5 of our Terms.
© 2023 The Author(s). This work is published and licensed by Dove Medical Press Limited. The
full terms of this license are available at https://www.dovepress.com/terms
and incorporate the Creative Commons Attribution
- Non Commercial (unported, 3.0) License.
By accessing the work you hereby accept the Terms. Non-commercial uses of the work are permitted
without any further permission from Dove Medical Press Limited, provided the work is properly
attributed. For permission for commercial use of this work, please see paragraphs 4.2 and 5 of our Terms.
Recommended articles
Association Between Nutritional Knowledge, Dietary Regimen, and Excess Body Weight in Primary School Teachers
Saintila J, Calizaya-Milla YE, Calizaya-Milla SE, Elejabo-Pacheco AA, Sandoval-Valentin GA, Rodriguez-Panta SG
Journal of Multidisciplinary Healthcare 2022, 15:2331-2339
Published Date: 14 October 2022
Impact of Pre-Pregnancy Hemoglobin Level on the Association Between Pre-Pregnancy Body Mass Index and Gestational Diabetes Mellitus: A Retrospective Cohort Study in a Single Center in China
Wu K, Ke HH, Gong W, Hu H, Chen L
Diabetes, Metabolic Syndrome and Obesity 2022, 15:3767-3775
Published Date: 8 December 2022
Association of Overweight and Inflammatory Indicators with Breast Cancer: A Cross-Sectional Study in Chinese Women
Zha JM, Zhang M, Wang T, Li HS, Ban QY, Liu M, Jiang XX, Guo SY, Wang J, Zhou YR, Liu YH, He WQ, Xu H
International Journal of Women's Health 2024, 16:783-795
Published Date: 6 May 2024