Back to Journals » Nature and Science of Sleep » Volume 16
Validation of Downloadable Mobile Snore Applications by Polysomnography (PSG)
Authors Shiao YH ![]() , Yu CC
, Yu CC ![]() , Yeh YC
, Yeh YC ![]()
Received 2 September 2023
Accepted for publication 27 April 2024
Published 21 May 2024 Volume 2024:16 Pages 489—501
DOI https://doi.org/10.2147/NSS.S433351
Checked for plagiarism Yes
Review by Single anonymous peer review
Peer reviewer comments 2
Editor who approved publication: Prof. Dr. Ahmed BaHammam
Yi-Hsien Shiao,1,2 Chung-Chieh Yu,3 Yuan-Chieh Yeh1,4
1Department of Traditional Chinese Medicine, Chang Gung Memorial Hospital, Keelung Medical Center, Keelung, Taiwan; 2Graduate Institute of Natural Products, College of Medicine, Chang Gung University, Taoyuan, Taiwan; 3Department of Chest, Critical Care, and Sleep Medicine, Chang Gung Memorial Hospital, Keelung Medical Center, Keelung, Taiwan; 4Program in Molecular Medicine, College of Life Sciences, National Yang Ming Chiao Tung University, Taipei, Taiwan
Correspondence: Yuan-Chieh Yeh, Department of Traditional Chinese Medicine, Chang Gung Memorial Hospital, Keelung Medical Center, No. 222, Maijin Road, Anle Dist, Keelung, 204, Taiwan, Tel +886 02-24313131 ext 2777, Fax +886 02-24313161, Email [email protected]
Purpose: Obstructive sleep apnea (OSA) is a common breathing disorder during sleep that is associated with symptoms such as snoring, excessive daytime sleepiness, and breathing interruptions. Polysomnography (PSG) is the most reliable diagnostic test for OSA; however, its high cost and lengthy testing duration make it difficult to access for many patients. With the availability of free snore applications for home-monitoring, this study aimed to validate the top three ranked snore applications, namely SnoreLab (SL), Anti Snore Solution (ASS), and Sleep Cycle Alarm (SCA), using PSG.
Patients and Methods: Sixty participants underwent an overnight PSG while simultaneously using three identical smartphones with the tested apps to gather sleep and snoring data.
Results: The study discovered that all three applications were significantly correlated with the total recording time and snore counts of PSG, with ASS showing good agreement with snore counts. Furthermore, the Snore Score, Time Snoring of SL, and Sleep Quality of SCA had a significant correlation with the natural logarithm of apnea hypopnea index (lnAHI) of PSG. The Snore Score of SL and the Sleep Quality of SCA were shown to be useful for evaluating snore severity and for pre-diagnosing or predicting OSA above moderate levels.
Conclusion: These findings suggest that some parameters of free snore applications can be employed to monitor OSA progress, and future research could involve adjusted algorithms and larger-scale studies to further authenticate these downloadable snore and sleep applications.
Keywords: polysomnography, snoring, smartphone applications, apps, obstructive sleep apnea, apnea hypopnea index
Introduction
Obstructive sleep apnea (OSA) is a prevalent sleep-related breathing disorder characterized by various symptoms, such as loud snoring, excessive daytime sleepiness, gasping or choking during sleep, and more.1 The primary cause of OSA is the repetitive collapse of the upper airway, resulting in fragmented and non-restful sleep. Globally, an estimated million adults are diagnosed with OSA every year,2 with 22% of men and 17% of women being diagnosed between 1993–2013, with an apnea-hypopnea index (AHI) ≥ 5.3 OSA may lead to several complications, such as pulmonary hypertension, neurocognitive effects, motor vehicle accidents, and disrupted quality of life.1 Snoring is one of the most common symptoms of OSA, and it is believed that louder snoring is associated with a more severe condition.4 Research shows that the intensity of snoring increases as OSA becomes more severe. In Taiwan, 51.9% of people snore, and 2.6% have witnessed apnea.5 Those who snore or have witnessed apnea are more likely to have major medical conditions than those who do not snore or witness apnea.5 Although not all OSA patients snore, snoring can be an essential factor in evaluating the severity of OSA and the patient’s sleep condition.
Polysomnography (PSG) is the current gold standard diagnostic test for OSA, which involves multiple measurements including brain waves, eye movement, heart rate, breathing pattern, blood oxygen level, chest and abdominal movement, limb movement, and snoring.6 PSG can diagnose sleep disorders and provide crucial information for adjusting the treatment plan of OSA patients. However, PSG is often not accessible due to higher cost and longer investigation time. Its application is also limited due to the need for qualified operators, and the unfamiliar environment can affect its accuracy. Moreover, PSG cannot provide actual home sleep monitoring. To address these issues in the era of the internet and artificial intelligence, downloadable smartphone applications are promising solutions.
Previously, a study conducted a review of available sleep analysis smartphone applications for download on the iOS and Google Play mobile app store. While many of these apps had high ratings and multiple functionalities, their algorithms had not been validated by scientific studies, which could lead to inappropriate information being provided to patients.7 As a result, the aim of this study is to validate selected downloadable snoring applications and identify the most suitable one, which could provide additional confirmed data for clinicians and patients to support continuous daily follow-up.
Materials and Methods
Participants, Equipment, and Smartphone Applications
We initially assessed snore detection applications with a rating above 4 stars in Google Play as of October 8, 2018. Six applications were selected for evaluation: 1. Sleep Cycle alarm clock, 2. Do I Snore or Grind, 3. SnoreLab, 4. Sleep as Android, 5. Anti Snore Solution, and 6. SnoreApp Light. “Do I Snore or Grind” was excluded due to the lack of a recording function for snore time and sound, “Sleep as Android” due to varying versions across devices, and “SnoreApp Light” due to the absence of an archive function to save data without purchasing. Finally, we included three applications for this study: 1. SnoreLab (SL), 2. Anti Snore Solution (ASS), and 3. Sleep Cycle alarm clock (SCA), each with the function of monitoring snore counts, snore time, and snore sound. Table 1 shows the detailed functions of each application.
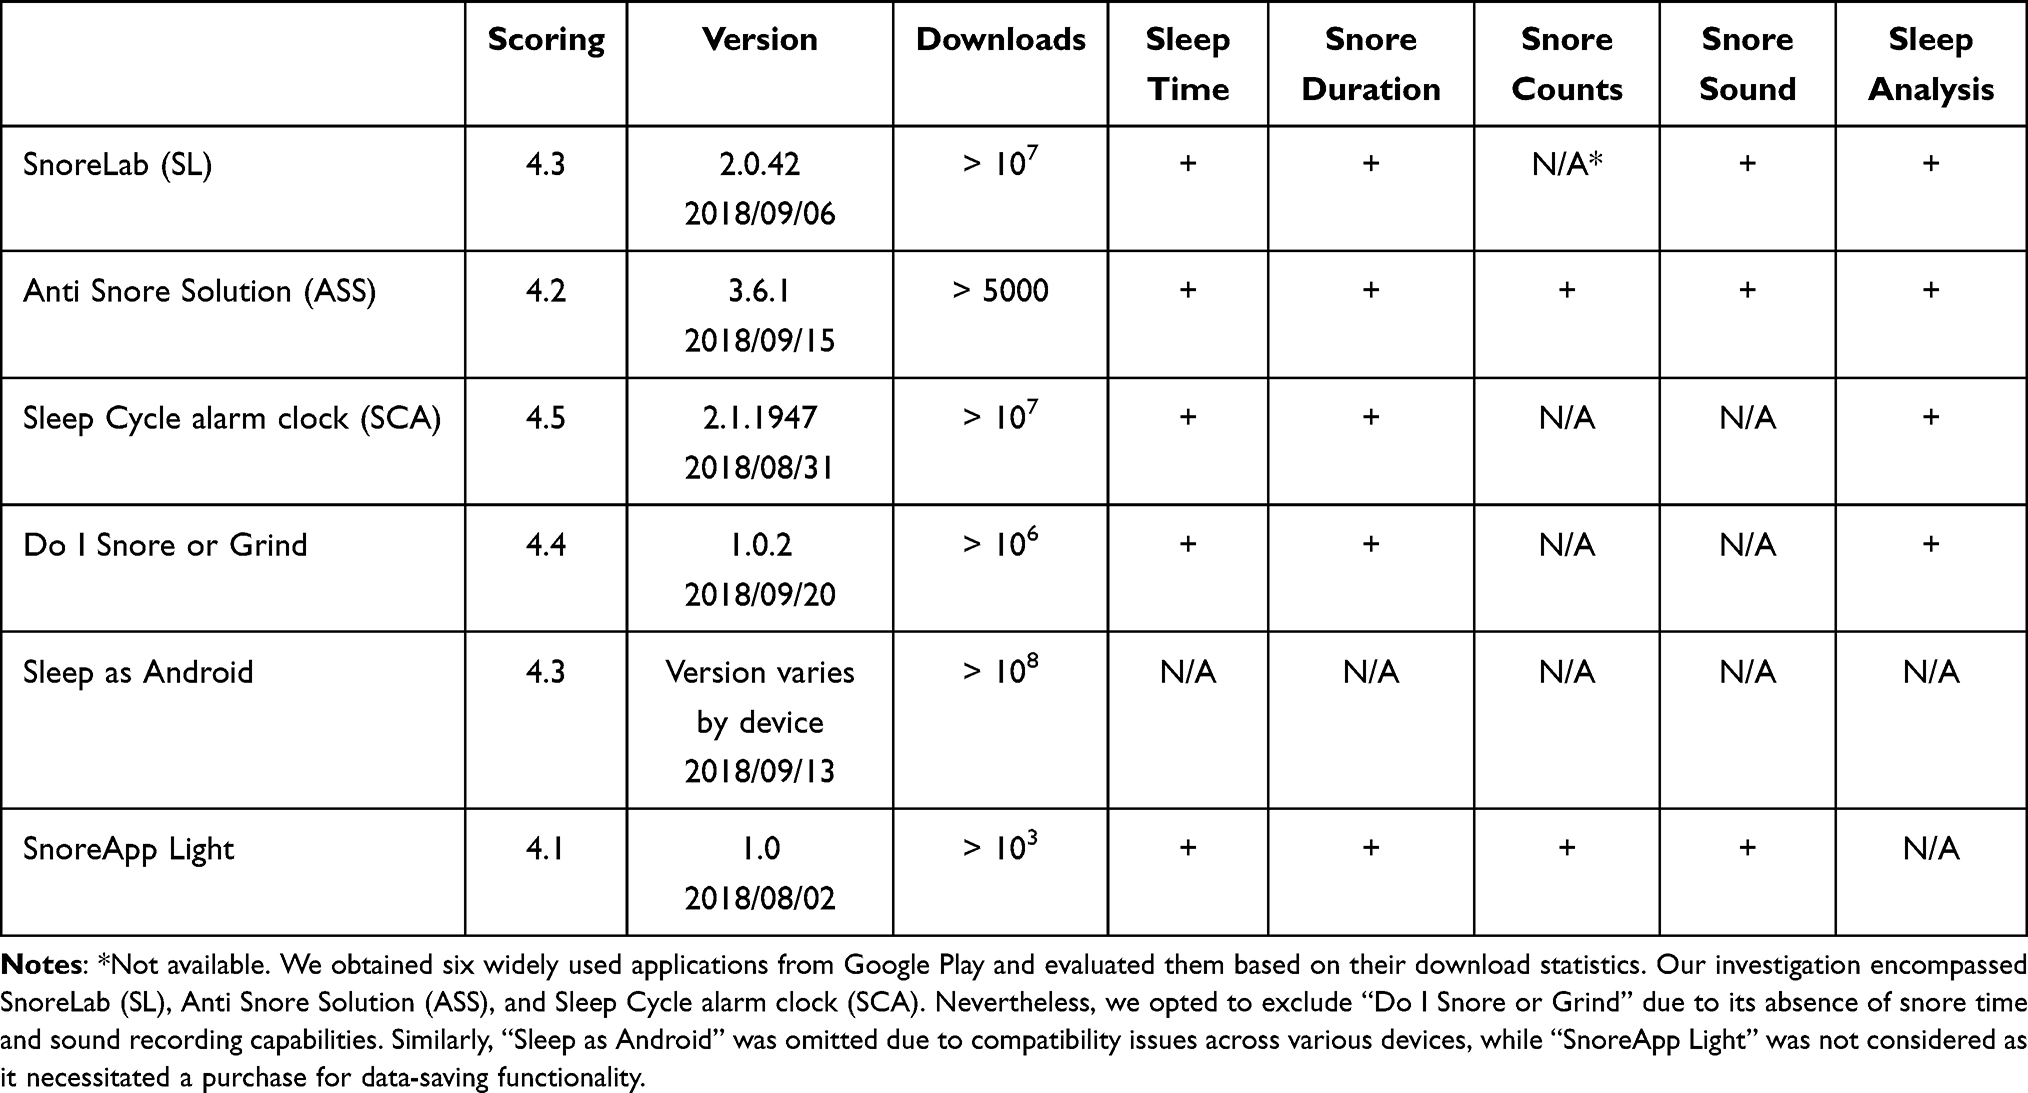 |
Table 1 Comparison of Each Snore Detection Application with Google Play Scoring > 4, Updated to Oct 8, 2018 |
From April 2019 to August 2020, we enrolled 60 participants who were diagnosed with OSA and underwent overnight PSG at the sleep center of Chang Gung Memorial Hospital, Keelung Medical Center. During the same period, three Samsung J7 smartphones, each equipped with SL, ASS, and SCA, respectively, were placed 15 cm away from the participants’ beds to collect sleep and snore data for comparison with PSG. All data were collected simultaneously with the PSG recordings. This clinical trial was approved by the Institutional Review Board of Chang Gung Medical Foundation (Permit No. 201801799B0 and 201801807A3) and registered on ClinicalTrials.gov (Identifier: NCT03890549). In accordance with the ethical principles outlined in the Declaration of Helsinki, this study obtained informed consent from all participants prior to their inclusion. Written informed consent was obtained from all study participants before the study commenced. Measures were implemented to safeguard participant confidentiality and protect their rights throughout the study process. By complying with the Declaration of Helsinki, we affirm our commitment to upholding ethical conduct in research involving human subjects.
Parameters of PSG and Smartphone Applications
The PSG sleep parameters included in the study were defined as follows: Total recording time referred to the duration of the recording from the start to the end of the session. Sleep period total referred to the duration of time from sleep onset to final awakening. Sleep efficiency was calculated as the ratio of total sleep time to time spent in bed. The Apnea–Hypopnea Index (AHI) is a composite index used to indicate the severity of sleep apnea, calculated by the number of apnea and hypopnea events per hour of sleep. The severity of OSA was classified as mild when AHI was between 5 and 15 per hour, moderate when AHI was between 15 and 30 per hour, and severe when AHI was greater than 30 per hour.
The sleep parameters of the application included in the study were defined as follows: Time in bed and sleep duration referred to the duration of time from the start of the application to the end of recording. Active time was the duration of time spent in bed reducing the induction time. Snore Score measured the intensity of snoring, calculated based on the duration and loudness of detected snoring events, and developed by the SL team. Sleep Quality was a parameter developed by the SCA team to evaluate the overall sleep condition. It should be noted that both snore score and sleep quality are protected by intellectual property rights.
The Epworth Sleepiness Scale (ESS) is a questionnaire that was administered prior to PSG testing.8 It is a widely used subjective measurement of a patient’s level of sleepiness in the field of sleep medicine research. The ESS scale consists of four categories (0, 1, 2, 3) that correspond to the likelihood of dozing off during specific activities: no chance of dozing, slight chance of dozing, moderate chance of dozing, and high chance of dozing, respectively. The total ESS score ranges from 0 to 24, and provides an estimation of a patient’s level of excessive sleepiness that may require medical attention.8
Statistical Analysis
The statistical analysis was conducted using IBM SPSS Statistics for Windows, Version 23.0 (IBM Corp., Armonk, NY, USA). A significance level of p < 0.05 was considered statistically significant for all analyses. Bivariate correlations (Spearman’s coefficient) were performed between the parameters provided by each application and their corresponding indices obtained from the PSG recording. The consistency between two independent parameters, such as a specific parameter of PSG and another parameter of smartphone application, was measured using the Intraclass Correlation Coefficient (ICC) to analyze the agreement of snore data between PSG and the other three snore applications.9 The log-transformation is frequently utilized in biomedical and psychosocial research to handle skewed data.10 Given that the Apnea-Hypopnea Index (AHI) exhibited a non-normal distribution, the natural logarithm of AHI or log-transformed AHI (lnAHI) was employed to normalize the distribution of the AHI data, following a methodology established in previous studies.11 Bland-Altman method was utilized to evaluate the agreement between PSG and SL, ASS, and SCA.12 A positive mean difference implies an underestimation of the sleep parameter, while a negative difference indicates an overestimation. Before conducting the Bland-Altman method, we first standardized the parameters of both PSG and Apps for facilitating subsequent comparisons between the two. Receiver operating characteristic (ROC) curves were utilized to evaluate the accuracy of the parameters of each application compared to AHI and identify the most appropriate cutoff point.
Results
General Demographics and Clinical Characteristics of the Participants
The study included 60 participants recruited between April 2019 and August 2020, with 52 participants enrolled in statistical analysis (43 male and 9 female). Of the 8 excluded subjects, 2 were from SL and 6 were from SCA due to missing smartphone recording data, likely due to technical issues (Figure 1). Among the 52 subjects included in the analysis, 31 were diagnosed with severe OSA, 10 with moderate OSA, 9 with mild OSA, and 2 were classified as normal. Table 2 presents the basic demographics and clinical characteristics of the participants, while Table 3 presents the PSG data. Male OSA patients were generally more obese than female OSA patients, with significantly higher height, weight, and BMI. Additionally, the neck circumferences of male OSA patients were larger than those of female patients (p < 0.0001). The sex ratio of participants was approximately 4.78:1, with 43 male participants and 9 female participants.
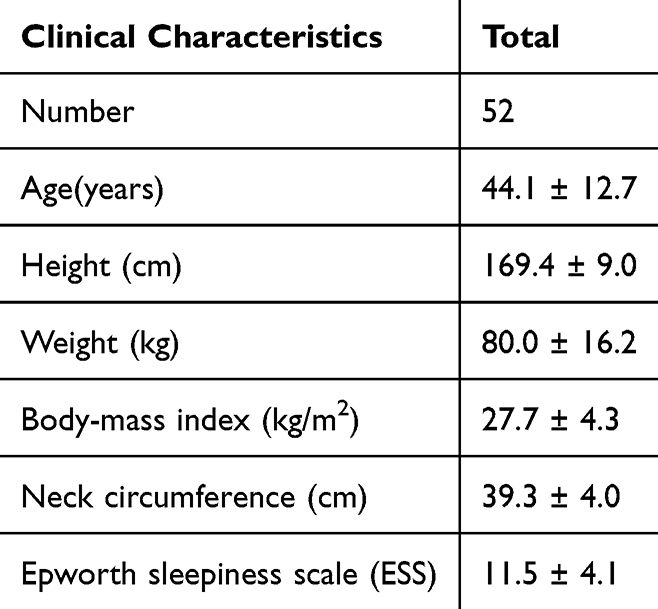 |
Table 2 Demographic Characteristics Data of Participants |
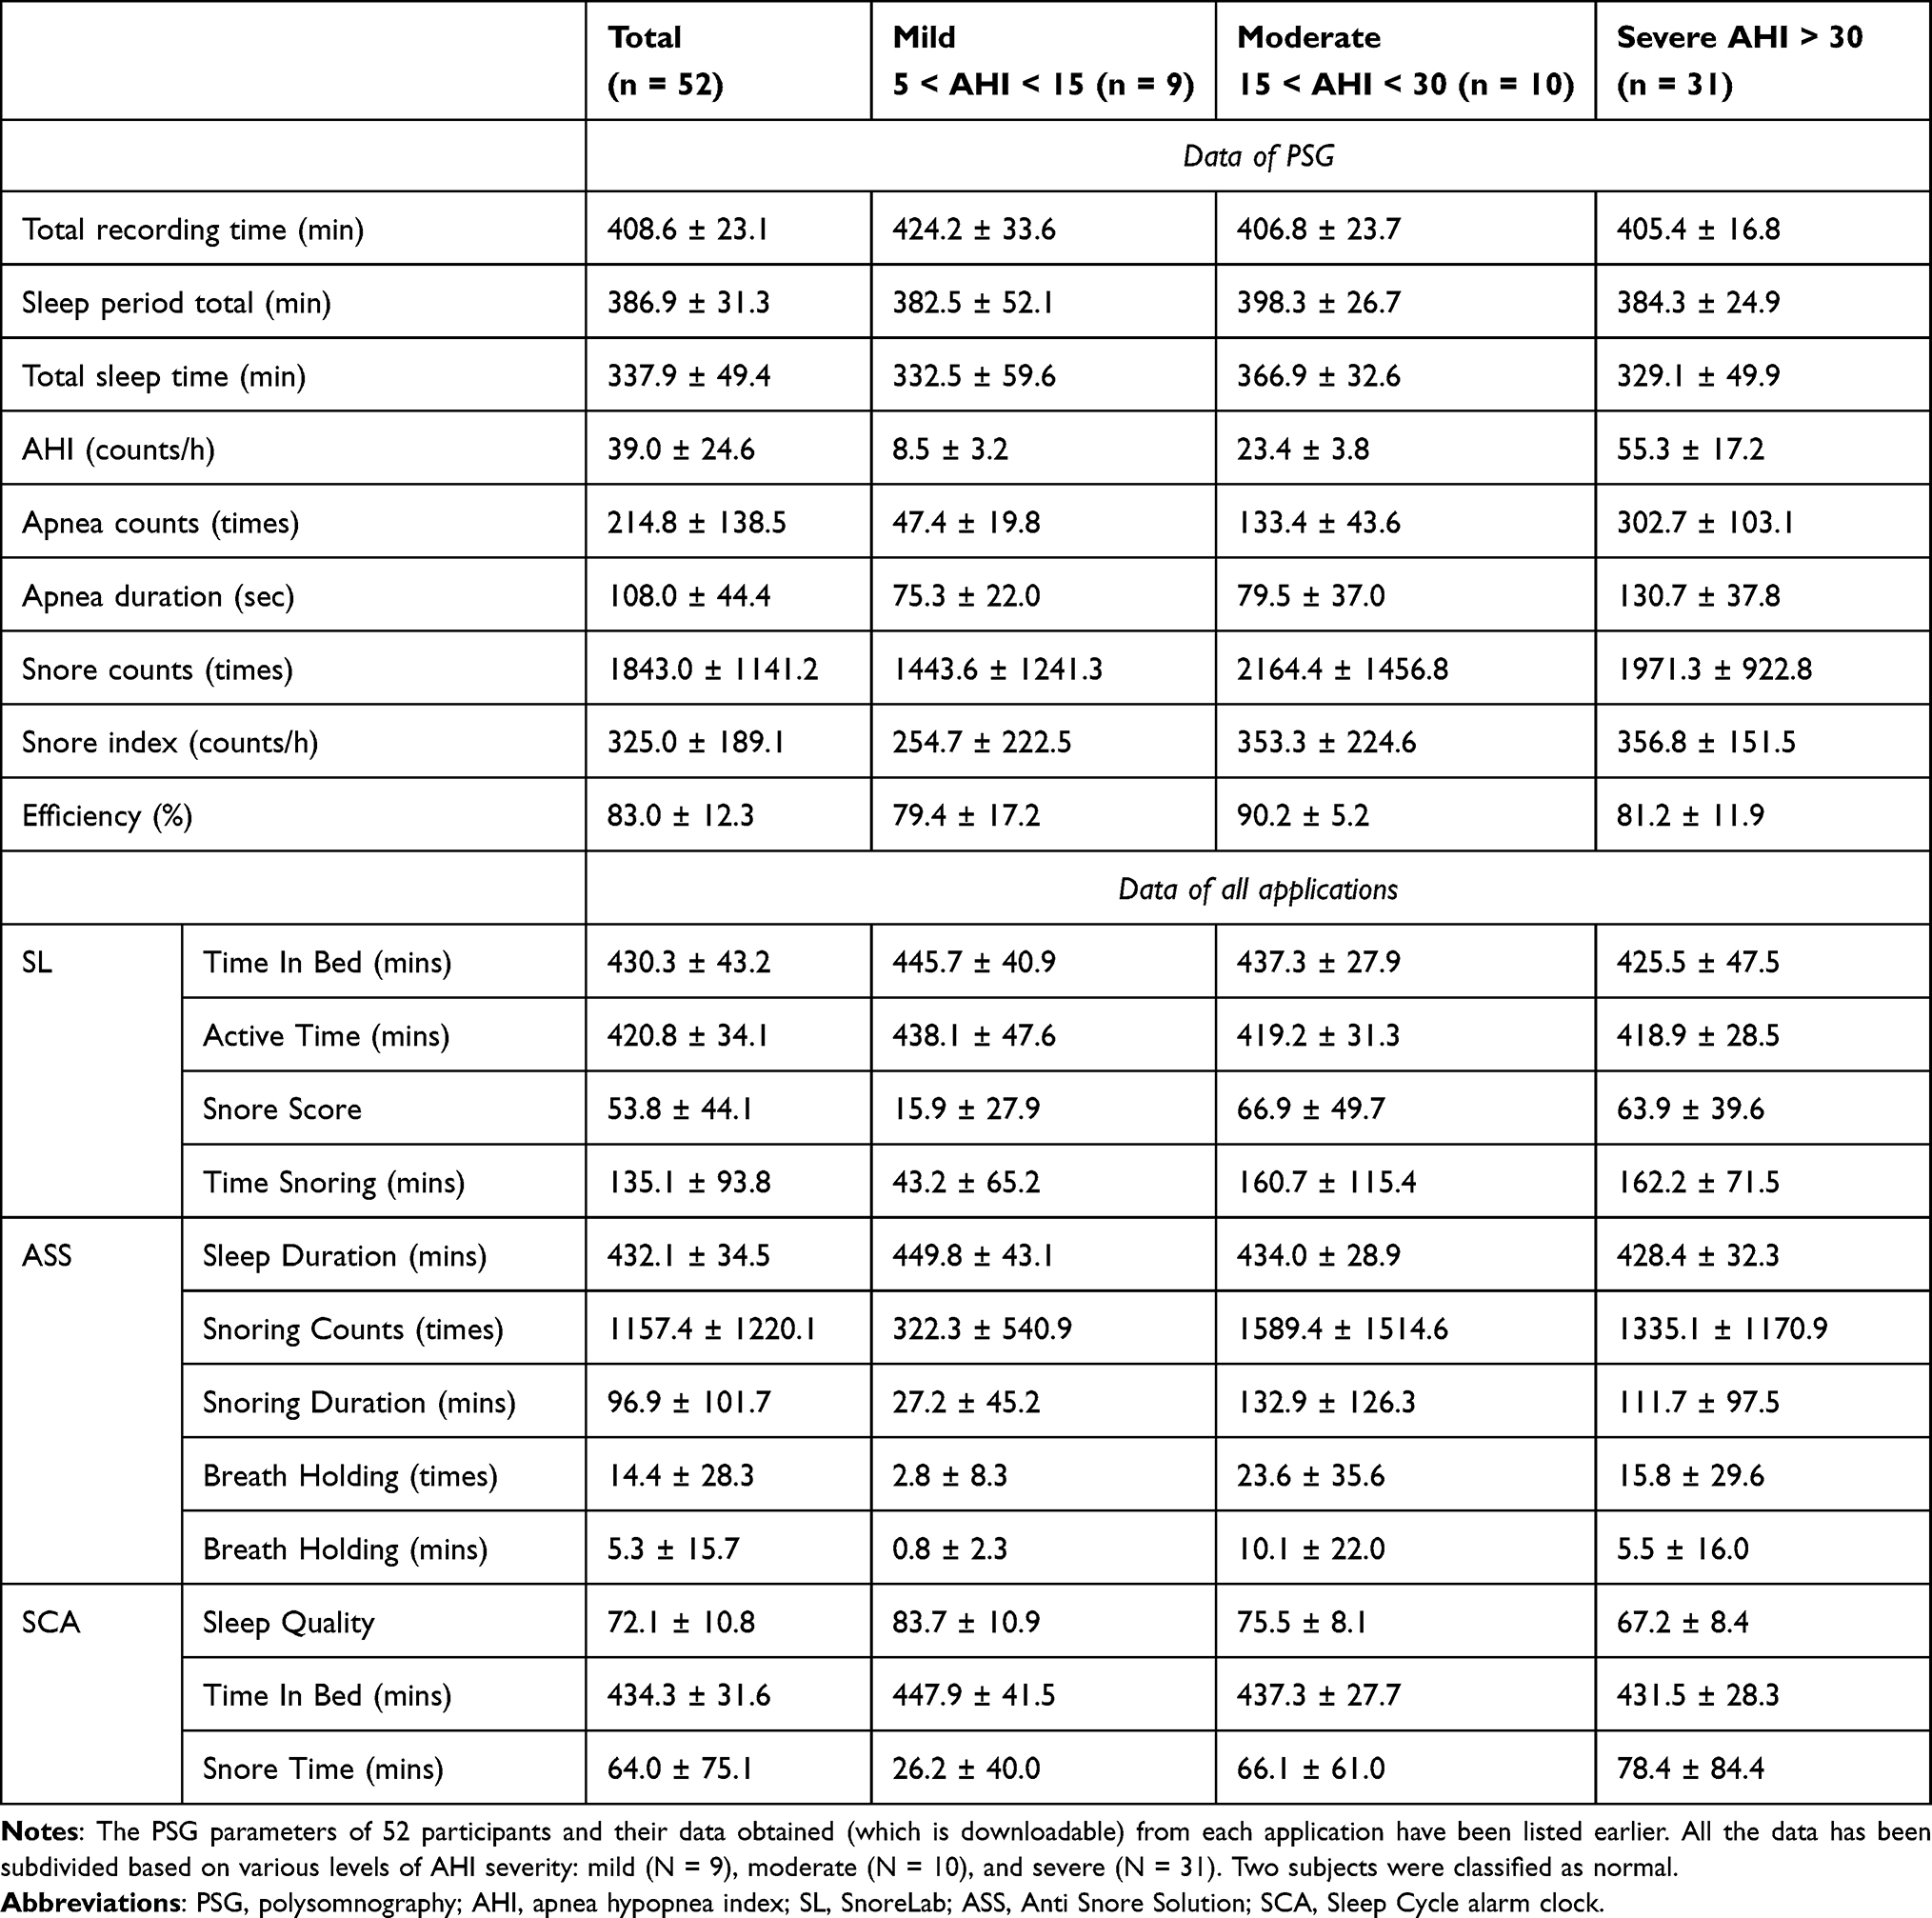 |
Table 3 All Acquired Data from PSG and Applications of Participants, Subgrouping According to the Severity of AHI |
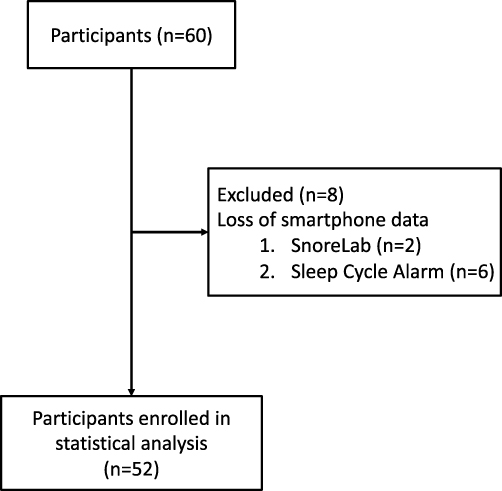 |
Figure 1 Flow diagram of recruitment of participants. From April 2019 to August 2020, 60 participants were enrolled with their informed consent. 8 participants were excluded due to technical issues, specifically the loss of smartphone data. Consequently, a total of 52 participants were included in the subsequent statistical analysis. |
PSG Derived AHI is Correlated to “Snore Score and Time Snoring” of SL, “Snoring Counts and Snoring Duration” of ASS, and “Sleep Quality” of SCA
We evaluated the correlation of various snore apps by comparing their similar sleep parameters with those of PSG. Positive correlations were observed among parameters associated with snore counts and sleep duration recorded by three snore apps and polysomnography (PSG), with the exception of Breath Holding Times and Breath Holding Time of Anti Snore Solution (ASS) (Table 4). Nevertheless, ICC analysis demonstrated notable agreement for sleep duration recording across all apps, and Snoring Counts of ASS with PSG (Table 4). We noted that there was a moderate correlation between the Snore Score of SL and AHI (Spearman rs = 0.370, p < 0.001). Therefore, we compared all parameters with lnAHI. The Snore Score of SL (rs = 0.370, p = 0.007), Time Snoring (minutes) of SL (rs = 0.380, p = 0.005), Snoring Counts of ASS (rs = 0.339, p = 0.014), and Snoring Duration of ASS (rs = 0.370, p = 0.013) showed positive correlations with lnAHI, while Sleep Quality of SCA revealed a significant reverse correlation with lnAHI (rs = −0.486, p < 0.001) (Table 5). Subsequently, Bland-Altman plots were employed to assess the consistency between the standardized AHI of PSG and the other standardized parameters of each aforementioned app. The figure displays the mean difference along with the lower and upper limits of agreement (95% confidence interval = mean difference ± 2SD), as illustrated in Figure 2A-E. With the exception of the standardized Sleep Quality parameter in SCA, 3.8% of standardized Snore Score records in SL exceed the 95% limits of agreement, 1.9% of Standardized Time Snoring records in SL surpass the 95% limits of agreement, along with 7.7% of records for Snoring Counts in ASS and 7.7% for Snoring Duration in ASS, both exceeding the 95% limits of agreement.
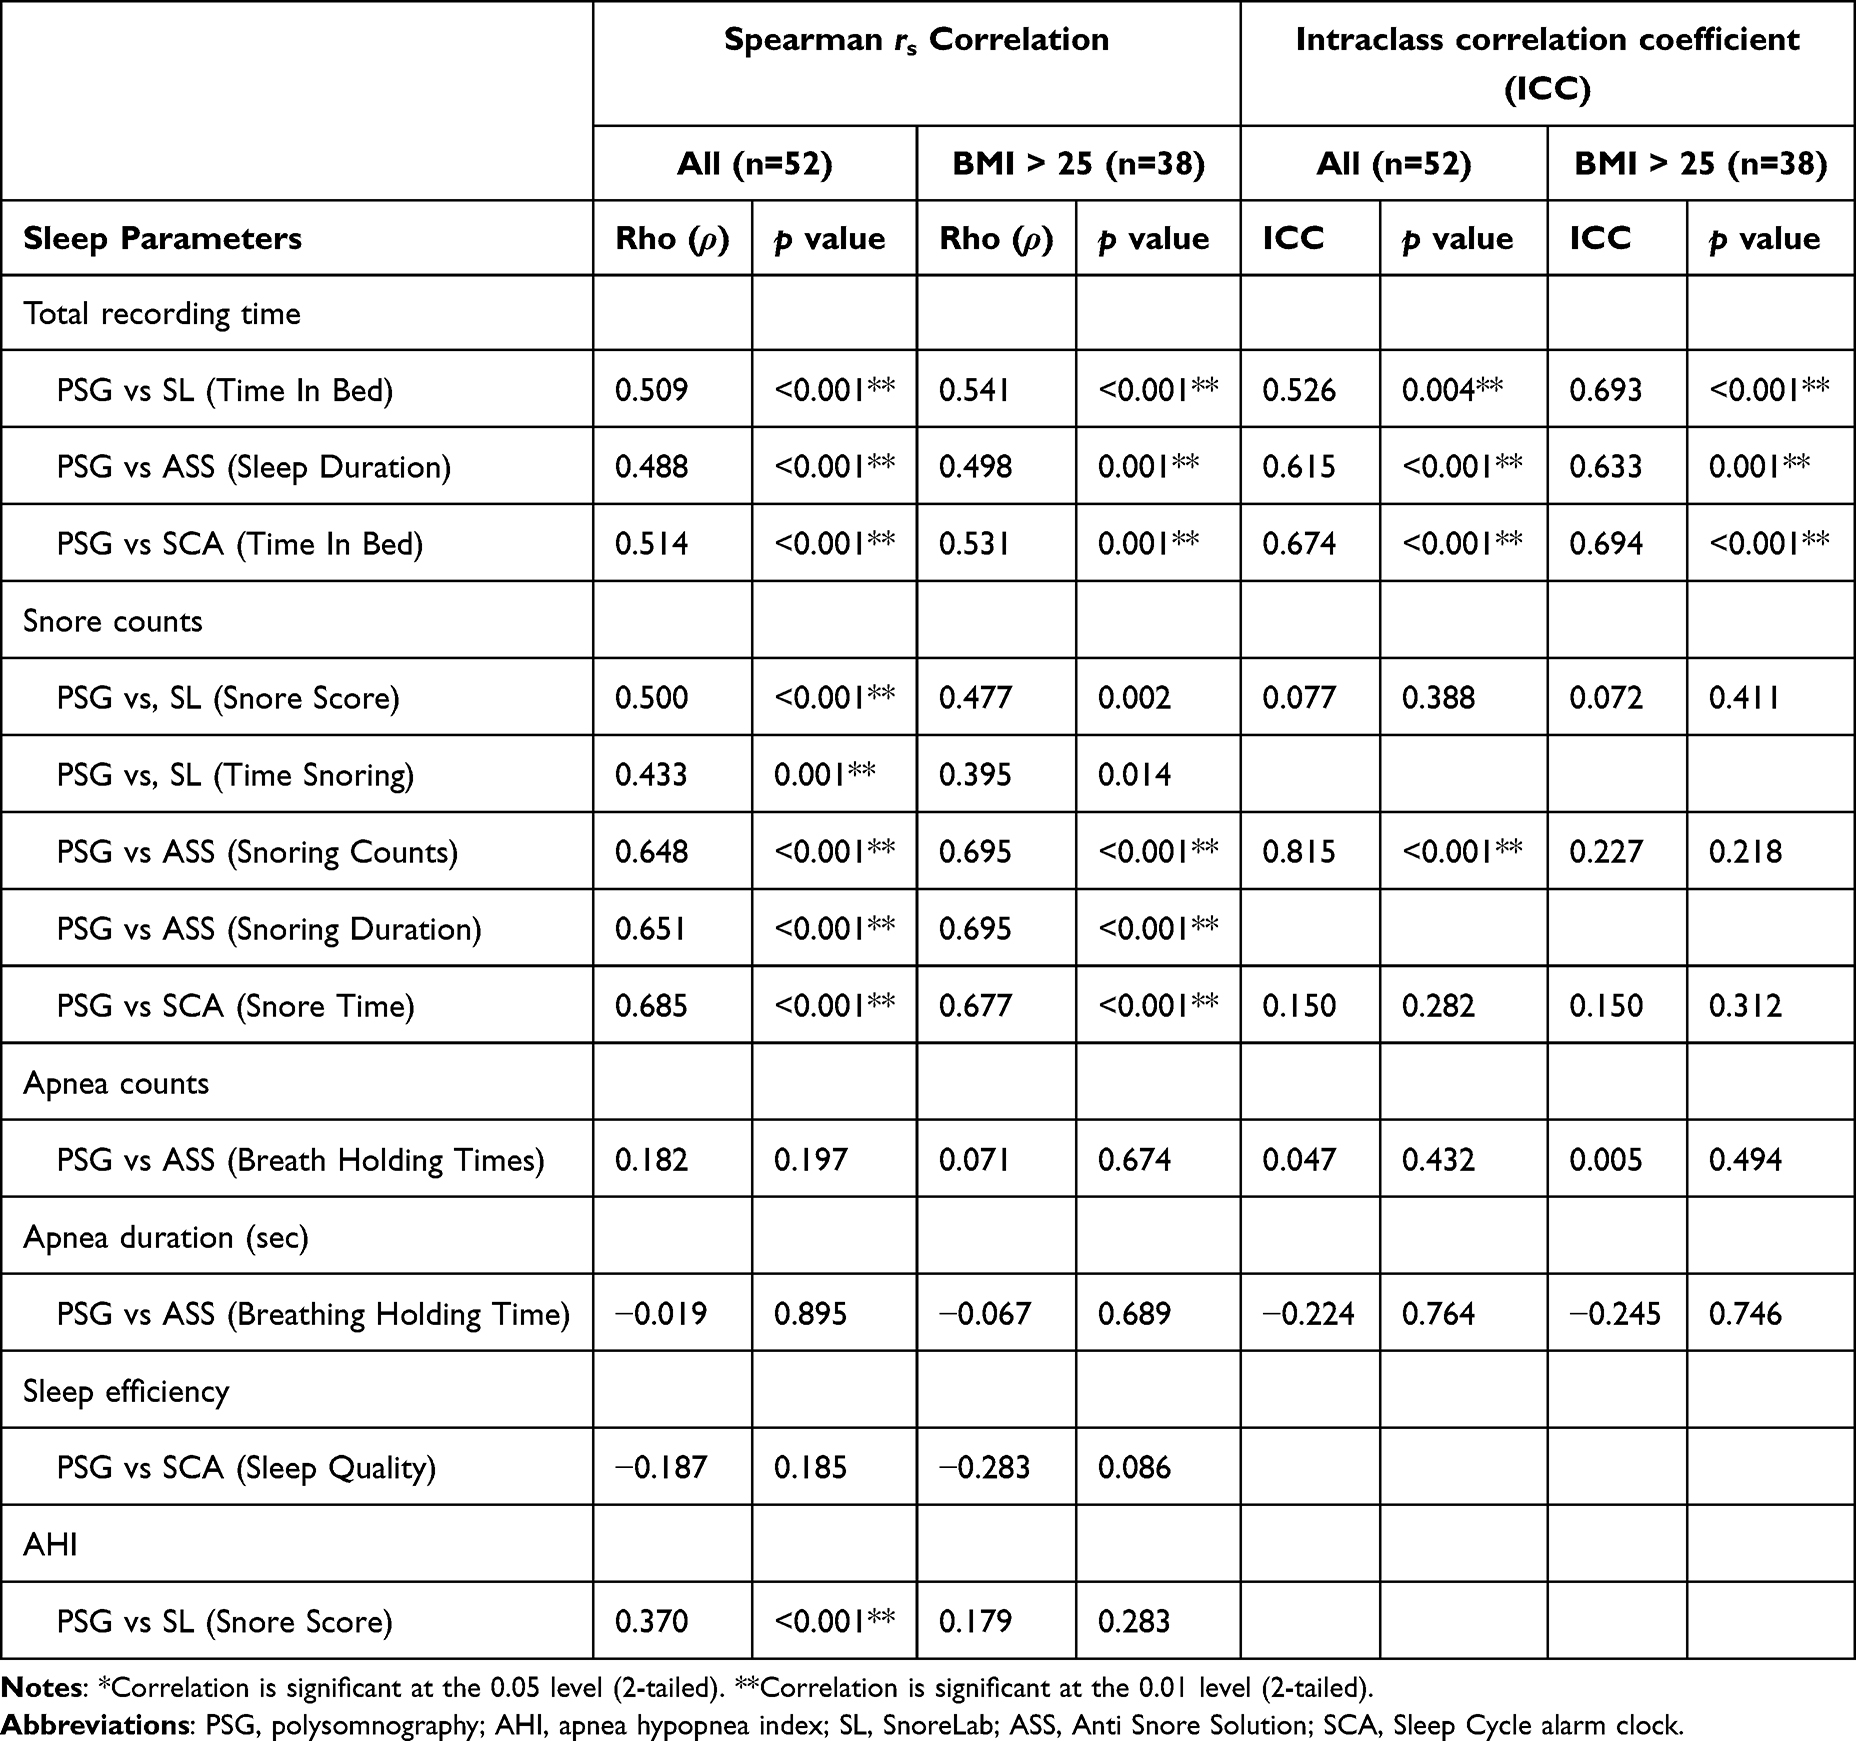 |
Table 4 Spearman Rs Correlation and Intraclass Correlations Coefficient (ICC) Between PSG and Apps’ Sleep Parameters |
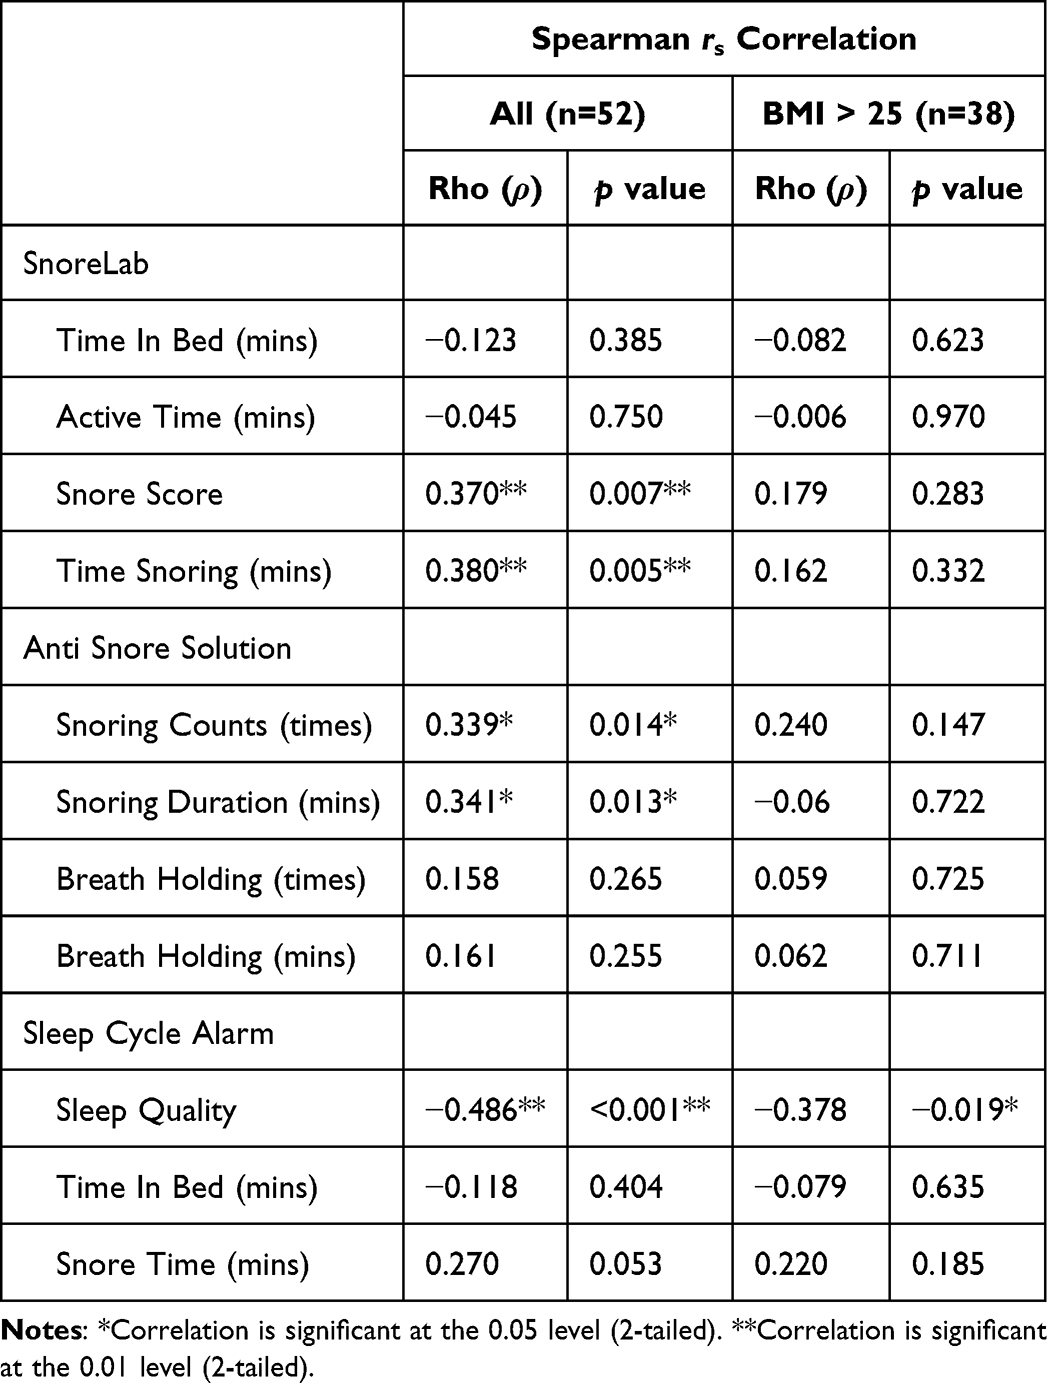 |
Table 5 Correlation Indices (Spearman Rs) Between Natural Logarithm of AHI of PSG and Apps’ Sleep Parameters |
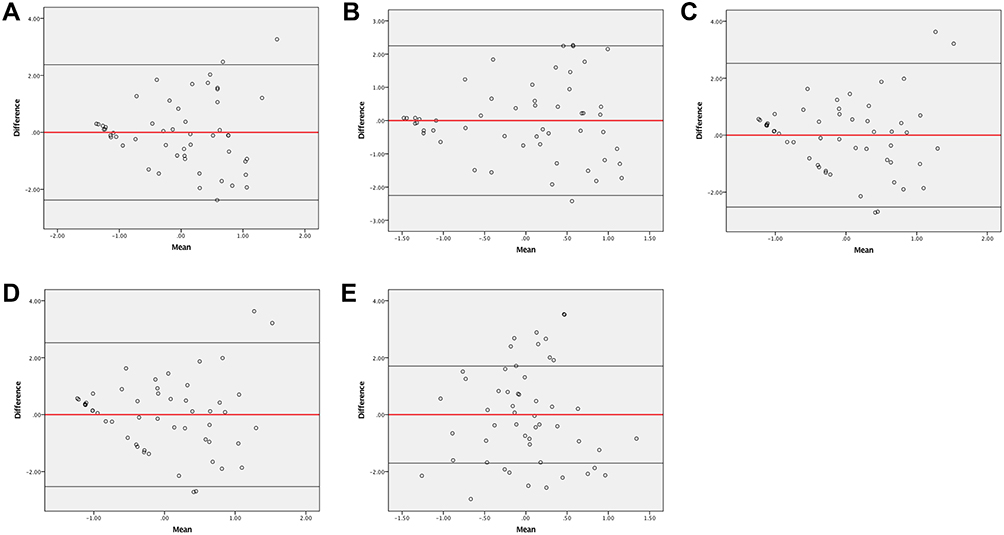 |
Figure 2 Bland−Altman plots for standardized AHI of PSG versus several standardized parameters of sleep applications. (A) Standardized Snore Score of SL vs Standardized AHI of PSG. (B) Standardized Time Snoring of SL vs Standardized AHI of PSG. (C) Standardized Snoring Counts of ASS vs Standardized AHI of PSG. (D) Standardized Snoring Duration of ASS vs Standardized AHI of PSG. (E) Standardized Sleep Quality of SCA vs Standardized AHI of PSG. The red line indicates the mean of the differences or bias, and the black lines indicate the limits of agreement (mean difference ± 2 standard deviation) or random fluctuation around the mean. Abbreviations: AHI, apnea hypopnea index; PSG: polysomnography; SL, SnoreLab: ASS, Anti Snore Solution; SCA: Sleep Cycle Alarm. |
Several Cutoff Values of Applications’ Parameters Could Be Used to Identify the Severity of PSG Derived AHI
To assess whether the mobile applications could serve as alternative diagnostic tools to standardized PSG, we employed Spearman’s coefficient analysis to determine the optimal parameters of the apps corresponding to varying levels of OSA severity. The results of Spearman’s coefficient analysis suggest that certain parameters not only indicate the presence of snoring but also the severity of OSA. To determine the optimal cutoff value for each parameter, we analyzed the receiver operating characteristic (ROC) curve at different stages of OSA.
Firstly, we sub-grouped OSA based on AHI ≥ 5, ≥ 15, and ≥ 30 (Supplementary Table S1). Our findings indicate that the following cutoff points were most useful in indicating AHI ≥ 15 with Snore Score > 5.5 (AUC = 0.881, p < 0.001), Time Snoring > 44.5 mins (AUC = 0.896, p < 0.001) of SL; Snoring Counts > 972 times (AUC = 0.853, p < 0.001), Snoring Duration > 81.5 mins (AUC = 0.854, p < 0.001) of ASS (Figure 3A), Sleep Quality < 82.5 of SCA (AUC = 0.827, p < 0.001) (Table 6, Figure 3B).
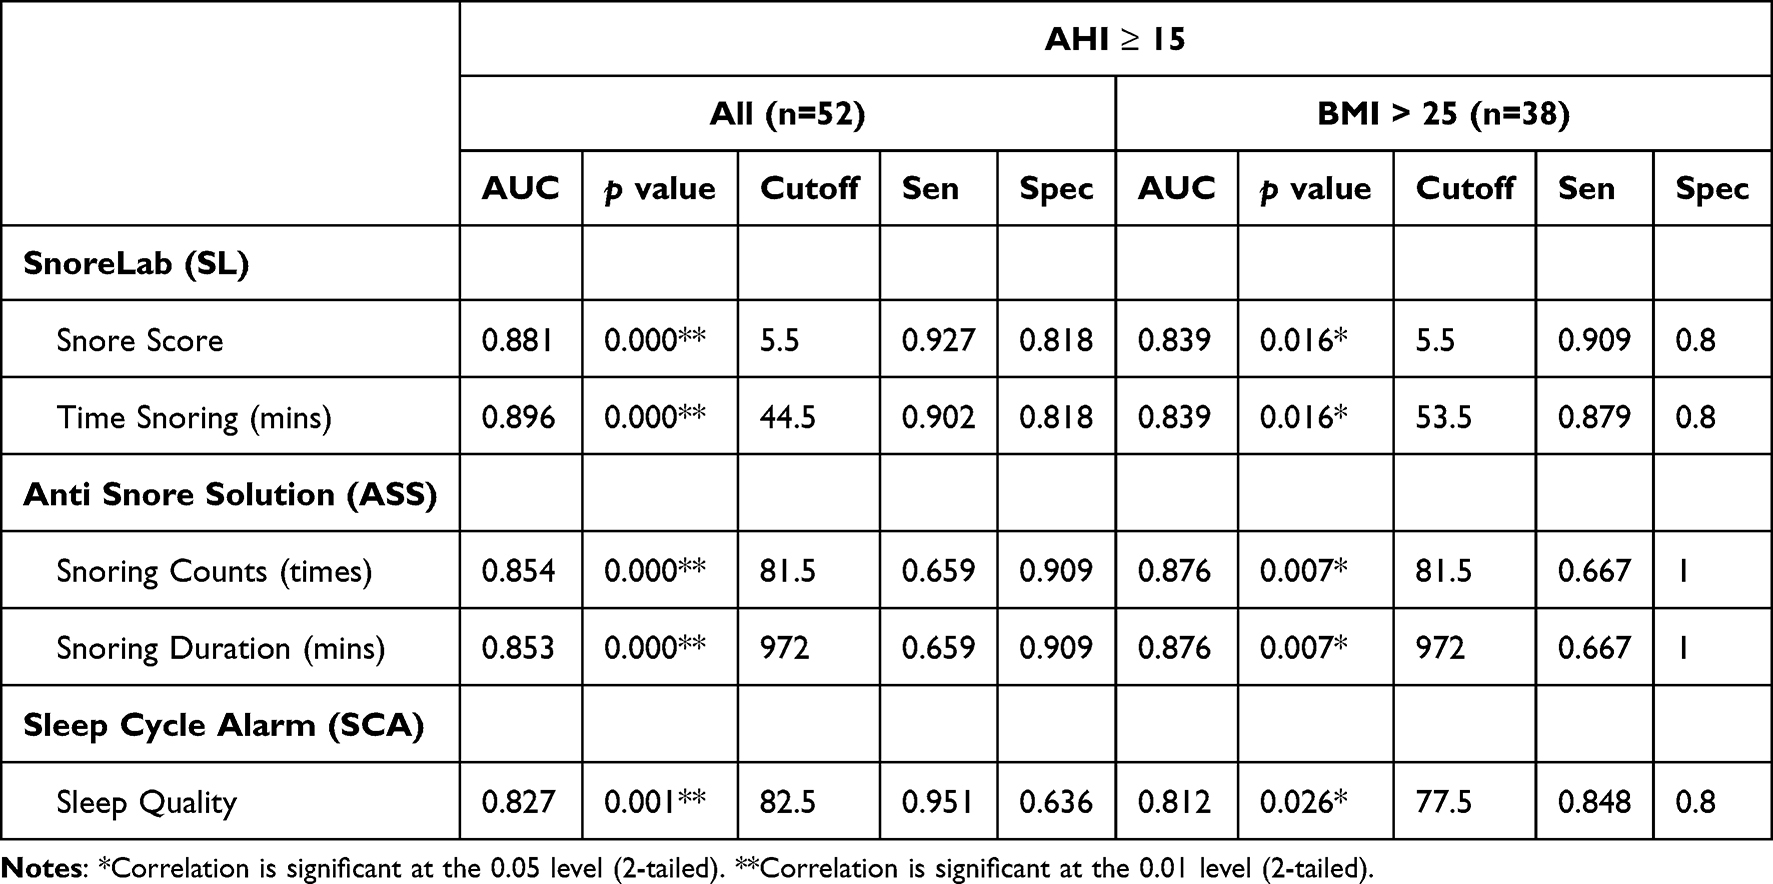 |
Table 6 Areas Under the ROC Curves for All Parameters of Applications, Subgrouping by AHI ≥ 15 |
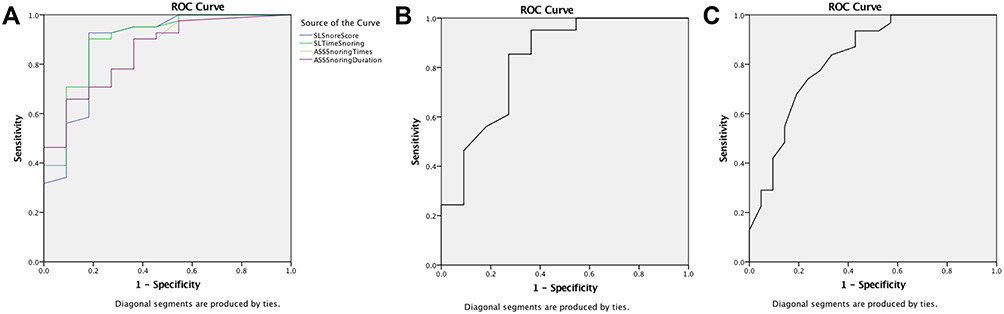 |
Figure 3 (A) ROC curve for different parameters of applications versus AHI ≧ 15. Snore score (AUC = 0.881, p < 0.001) and Time snoring (AUC = 0.896, p < 0.001) of SL, Snoring times (AUC = 0. 853, p < 0.001) and Snoring duration (AUC = 0.854, p < 0.001) of ASS versus AHI ≧ 15. (B) ROC curve for Sleep quality of SCA versus AHI ≥ 15 (AUC = 0.827, p = 0.001). (C) ROC curve for Sleep quality of SCA versus AHI ≥ 30 (AUC = 0.826, p < 0.001). Abbreviations: ROC, curve, receiver operating characteristic curve; AHI, apnea hypopnea index; AUC, area under the curve; SL, SnoreLab; ASS, Anti Snore Solution; SCA, Sleep Cycle alarm clock. |
Secondly, we conducted a similar analysis by sub-grouping OSA cases into mild (5 < AHI < 15, n = 9), moderate (15 < AHI < 30, n = 10), and severe (AHI > 30, n = 31) categories. As a result, a Sleep Quality score of < 74.5 on the SCA was useful in indicating the presence of severe OSA (AUC = 0.826, p < 0.001) (Table 7, Figure 3C).
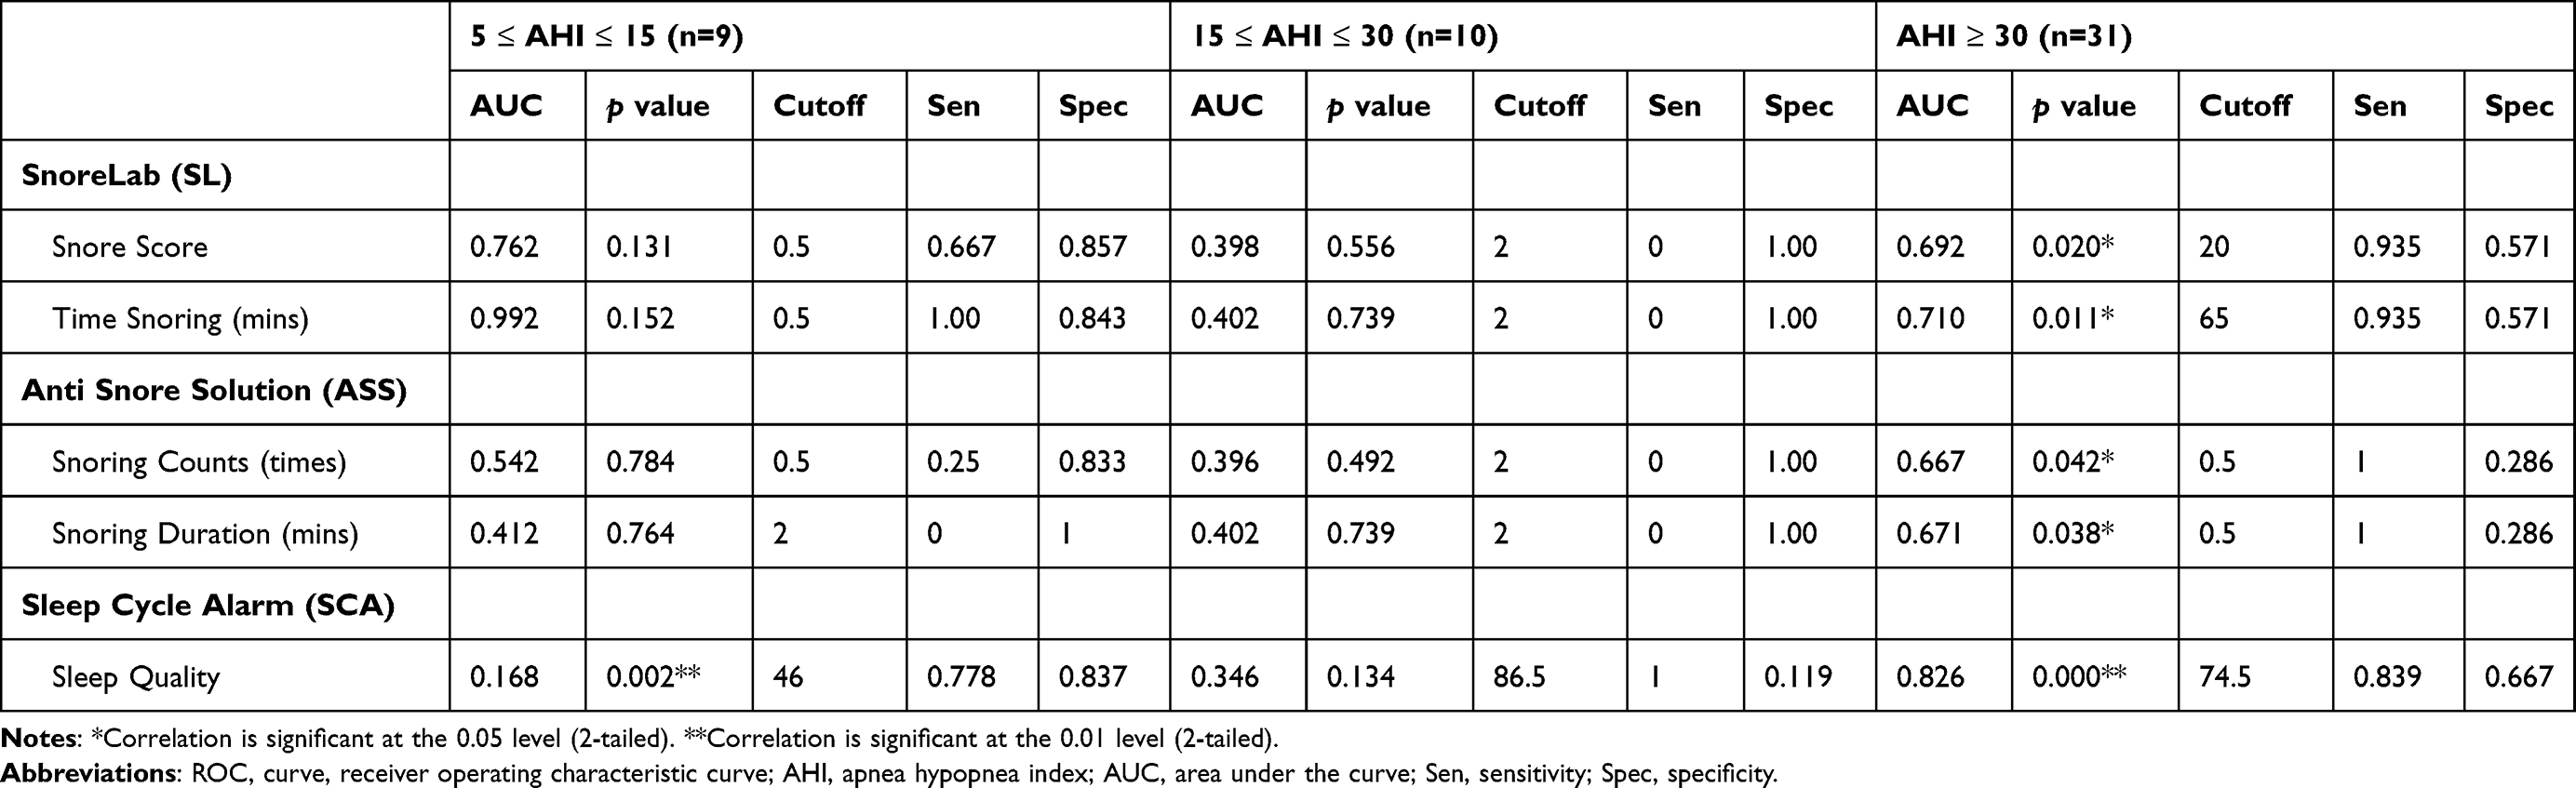 |
Table 7 Areas Under the ROC Curves for All Parameters of Applications, Subgrouping by AHI Cutoff Value of 5, 15, 30 |
Exploring Correlations Between Sleep Applications and Establishing Practical Cutoff Values for Assessing OSA Severity in Obese Subgroups
Obese individuals constitute a significant subset of patients with OSA, and the pathophysiology of OSA in this population differs from that in the general population. Consequently, individuals with a BMI > 25 were specifically examined across all sleep application parameters. Following correlation analysis, it was observed that the recorded sleep duration in all apps exhibited a positive correlation with PSG (Table 4). Additionally, there was a positive correlation between snore counts in PSG and Snoring Counts, Snoring duration in ASS, and Snore Time in SCA (Table 4). However, no significant agreement was found between snore counts and apnea counts in apps with PSG, except for the recorded sleep duration of sleep apps and Sleep Quality parameter in SCA (Table 4). Furthermore, lnAHI did not exhibit a significant correlation with apps among obese subjects except Sleep Quality parameter in SCA (Table 5). Through ROC analysis, it was determined that obese subjects had similar cutoff values for diagnosing moderate to severe OSA (Table 6).
Discussion
The aim of this study was to assess the reliability of snore applications that rank higher than others. Our findings indicate that certain parameters of these applications can provide valuable information to both physicians and patients. Specifically, the sleep time recording and snore detection features of all tested applications exhibited a strong correlation with PSG. Additionally, the Snoring Counts of ASS demonstrated positive agreement with PSG, making it a suitable biomarker for daily monitoring of snore state at home. The Snore Score and Time Snoring of SL, as well as the Sleep Quality of SCA, showed a positive correlation with lnAHI. However, each app demonstrates its own set of strengths and weaknesses. SL stands out with a more balanced performance, showcasing commendable sensitivity and specificity. This indicates that SL could be a more reliable option for both initial screening and confirmatory testing, offering a comprehensive overview of a user’s sleep patterns and potential OSA symptoms. Conversely, the lower sensitivity values observed for ASS suggest a higher potential for false negatives, making it less reliable for the initial screening of OSA. On the flip side, the lower specificity values for SCA suggest a greater likelihood of false positives. Consequently, it may not be the optimal choice for confirmatory or diagnostic purposes, as it could misclassify individuals as having OSA when they do not.
Although snoring is not commonly used as a predictor of obstructive sleep apnea (OSA).13 It is a prevalent symptom that has been linked to the severity of the condition.4 Researchers have identified the loudness of snoring as a potential indicator of OSA severity,14 leading to the development of numerous software applications designed to monitor sleep and snoring. These apps often include specialized parameters to measure snore conditions, such as the Snore Score of SL and the Sleep Quality of SCA. Both of these measures were developed using program calculations for snoring detection and are protected by intellectual property rights. The Snore Score, as defined by the developer of SL, considers the duration and loudness of detected snoring events to provide a measurement of snoring intensity. Similarly, the Sleep Quality of SCA is used to assess snore condition based on snoring detection. Based on our data, it is evident that the severity of snoring can be used to predict the severity of AHI.
According to our findings, it appears that the AHI is more strongly correlated with snoring severity parameters such as Snore Score of SL and Sleep Quality of SCA, rather than snore counts. Despite attempts by the ASS developer to distinguish between apnea and hypopnea through smartphone applications, our research suggests that the app underestimates actual apnea counts. These results align with prior studies that have shown a weak correlation between snore index and AHI, although the correlation remains statistically significant (r = 0.32, p < 0.0001).15 However, our study also indicates that current smartphone snore apps face significant challenges in accurately monitoring apnea counts and duration. Future iterations of these apps offer an opportunity to improve detection of these important parameters.
The study identified several clinically useful parameters of snore apps that can help users monitor the severity of their OSA. However, due to the fact that most of the study’s subjects were diagnosed with moderate to severe OSA (41/52), the only solid cutoff value used to indicate OSA was AHI > 15. Only one-fifth of the subjects had normal or mild OSA, making it difficult to find an appropriate cutoff value to diagnose OSA (AHI > 5). Nonetheless, the study found that the Snoring Counts of ASS, the Snore Score and Time Snoring of SL, and the Sleep Quality of SCA can be used to detect moderate to severe OSA.
In recent times, a diverse range of consumer sleep technologies, including sleep wearable tracking devices, wearable devices, bed sensors, and artificial intelligence-designed sleep analytic systems, has emerged for monitoring sleep-disordered breathing. Despite these advancements, the diagnostic accuracy of these devices remains inadequate. There are ongoing efforts to develop protocols for evaluating the diagnostic test accuracy of screening consumer sleep technology for obstructive sleep apnea and snoring.16 The lack of standardized methods for assessing the performance of these technologies has spurred sleep scientists to champion an interdisciplinary initiative. Their goal is to establish a comprehensive framework for the rigorous, standardized, and prompt evaluation of emerging sleep disorder-related technologies. The Sleep Health Expert Task Force has identified key priorities in the assessment of sleep technology performance. These priorities encompass critical aspects, including defining sleep metrics, specifying sleep variables and stages, selecting study populations that include young healthy adults as a control group or subgroups with cardiovascular, physical, mental, or sleep disorders. Additionally, considerations extend to characteristics such as sex, age, environment, and confounding factors like caffeine or alcohol consumption. Importantly, there is an emphasis on utilizing data sources from sensors rather than relying solely on summarized signals.17
The development of snore applications has been a topic of research, and studies have shown that smartphones can be used to monitor snoring and OSA within laboratory settings.18 However, the problem with audio recording by smartphones is the difficulty in distinguishing between snoring and other noises in the bedroom, which can be influenced by environmental factors and device variability.19 Although many snore applications are available in app stores, few studies have focused on their validation against PSG.20 Some researchers have emphasized the validation of newly developed snore applications, such as the snoring sound monitor developed by the Nakano group, which has a high correlation of snoring time to PSG and respiratory disturbance index (RDI) with AHI.18 The Shin group has also developed an unconstrained snoring detection system with high accuracy, sensitivity, and specificity but with lower positive predictivity (70.38%).21 Other researchers have validated downloadable applications against PSG. The Camacho group compared 13 snoring apps with PSG and found that the snoring sensitivities and positive predictive values ranged widely.22 Chiang et al compared one paid application called “Snore Clock” with PSG and found a high predictive value of snore detection.23 Baptista et al study conducted a comprehensive scientific literature review on consumer-directed apps and devices, assessing smartphone applications and devices designed for obstructive sleep apnea. The findings revealed that only 10 smartphone apps had robust scientific data with accompanying publications related to sleep monitoring, adjunct monitoring of continuous positive airway pressure (CPAP) use, and OSA treatment.24 However, the validated applications may not be popular among smartphone users due to interface, function, payment, and other factors. The primary aim of this study is to identify a validated snore application that is user-friendly and popular among users. To achieve this goal, we collected a list of the top snore applications and performed a validation process. The selected applications demonstrated certain functions that could be adopted by physicians to monitor daily snore and sleep conditions of their patients. By identifying a validated snore application that is both user-friendly and popular among users, we hope to improve the monitoring and management of snoring and sleep-related conditions.
Although we aimed to conduct a rigorous study, there were several limitations to our research. Firstly, many experts emphasize that simple correlation analyses currently do not ensure the reflection of every event in PSG within sleep-tracking apps. They advocate for analytical guidelines to evaluate the performance of sleep-tracking technology, covering aspects like raw data organization and critical analytical procedures such as discrepancy analysis, Bland–Altman plots, and epoch-by-epoch analysis, providing ready-to-use applications to researchers and clinicians.25 Nevertheless, lacking additional parameters to utilize, we solely conducted several correlation analyses and Bland–Altman plots without employing alternative assessment methods. Secondly, the study was conducted at a single sleep center with a relatively small sample size, which may limit the generalizability of our findings. Thirdly, the use of different hardware and microphones in smartphones from different brands may have had an impact on our results, and it was not feasible to validate each new version of the application immediately. Lastly, our subject recruitment process did not result in a normal distribution, with a limited number of subjects with normal and mild OSA included in the study. Despite these limitations, our study provides valuable insights into the use of smartphone apps for snore monitoring, and future research can build upon our findings to further improve the accuracy and applicability of these apps.
Conclusion
In summary, this study is the first attempt to evaluate the validity of freely available, highly rated snore and sleep applications against PSG. Our results suggest that the Snore Score feature of the SL app and the Sleep Quality metric of the SCA app may be useful for evaluating snore severity and for pre-diagnosing or predicting OSA beyond moderate levels. Furthermore, the Snoring Counts features of the ASS app may be helpful for recording snore counts and duration. Despite these promising findings, larger-scale studies are needed to confirm the validity of these applications, and to further investigate the potential of smartphone-based sleep monitoring in the diagnosis and management of sleep-related conditions.
Data Sharing Statement
The authors declare that no further data will be shared.
Acknowledgments
The authors express their gratitude to SnoreLab and Sleep Cycle Alarm for providing detailed explanations of the sleep parameters used in their smartphone applications. Additionally, the authors are thankful to Chang Gung Memorial Hospital for their financial support (CMRPG2L0241, CMRPG2L0242, CMRPG2N0391, CMRPG2L0291, CMRPG2J0201, and CMRPG2K0431).
Author Contributions
All authors made a significant contribution to the work reported, whether that is in the conception, study design, execution, acquisition of data, analysis and interpretation, or in all these areas; took part in drafting, revising or critically reviewing the article; gave final approval of the version to be published; have agreed on the journal to which the article has been submitted; and agree to be accountable for all aspects of the work.
Disclosure
The authors report no conflicts of interest in this work.
References
1. Harding SM. Complications and consequences of obstructive sleep apnea. Curr Opin Pulm Med. 2000;6(6):485–489. doi:10.1097/00063198-200011000-00004
2. Benjafield AV, Ayas NT, Eastwood PR, et al. Estimation of the global prevalence and burden of obstructive sleep apnoea: a literature-based analysis. Lancet Respir Med. 2019;7(8):687–698. doi:10.1016/S2213-2600(19)30198-5
3. Franklin KA, Lindberg E. Obstructive sleep apnea is a common disorder in the population-a review on the epidemiology of sleep apnea. J Thorac Dis. 2015;7(8):1311–1322. doi:10.3978/j.issn.2072-1439.2015.06.11
4. Maimon N, Hanly PJ. Does snoring intensity correlate with the severity of obstructive sleep apnea? J Clin Sleep Med. 2010;6(5):475–478.
5. Chuang LP, Hsu SC, Lin SW, Ko WS, Chen NH, Tsai YH. Prevalence of snoring and witnessed apnea in Taiwanese adults. Chang Gung Med J. 2008;31(2):175–181.
6. Kapur VK, Auckley DH, Chowdhuri S, et al. Clinical Practice Guideline for Diagnostic Testing for Adult Obstructive Sleep Apnea: an American Academy of Sleep Medicine Clinical Practice Guideline. J Clin Sleep Med. 2017;13(3):479–504. doi:10.5664/jcsm.6506
7. Ong AA, Gillespie MB. Overview of smartphone applications for sleep analysis. World J Otorhinolaryngol Head Neck Surg. 2016;2(1):45–49. doi:10.1016/j.wjorl.2016.02.001
8. Johns MW. A new method for measuring daytime sleepiness: the Epworth sleepiness scale. Sleep. 1991;14(6):540–545. doi:10.1093/sleep/14.6.540
9. Koo TK, Li MY. A Guideline of Selecting and Reporting Intraclass Correlation Coefficients for Reliability Research. J Chiropr Med. 2016;15(2):155–163. doi:10.1016/j.jcm.2016.02.012
10. Feng C, Wang H, Lu N, et al. Log-transformation and its implications for data analysis. Shanghai Arch Psychiatry. 2014;26(2):105–109. doi:10.3969/j.issn.1002-0829.2014.02.009
11. Nieto FJ, Young TB, Lind BK, et al. Association of sleep-disordered breathing, sleep apnea, and hypertension in a large community-based study. Sleep Heart Health Study. JAMA. 2000;283(14):1829–1836. doi:10.1001/jama.283.14.1829
12. Bland JM, Altman DG. Comparing methods of measurement: why plotting difference against standard method is misleading. Lancet. 1995;346(8982):1085–1087. doi:10.1016/s0140-6736(95)91748-9
13. Flemons WW, Whitelaw WA, Brant R, Remmers JE. Likelihood ratios for a sleep apnea clinical prediction rule. Am J Respir Crit Care Med. 1994;150(5 Pt 1):1279–1285. doi:10.1164/ajrccm.150.5.7952553
14. Kim JW, Lee CH, Rhee CS, Mo JH. Relationship Between Snoring Intensity and Severity of Obstructive Sleep Apnea. Clin Exp Otorhinolaryngol. 2015;8(4):376–380. doi:10.3342/ceo.2015.8.4.376
15. Alshaer H, Hummel R, Mendelson M, Marshal T, Bradley TD. Objective Relationship Between Sleep Apnea and Frequency of Snoring Assessed by Machine Learning. J Clin Sleep Med. 2019;15(3):463–470. doi:10.5664/jcsm.7676
16. Pires GN, Arnardottir ES, Islind AS, Leppanen T, McNicholas WT. Consumer sleep technology for the screening of obstructive sleep apnea and snoring: current status and a protocol for a systematic review and meta-analysis of diagnostic test accuracy. J Sleep Res. 2023;32(4):e13819. doi:10.1111/jsr.13819
17. de Zambotti M, Menghini L, Grandner MA, et al. Rigorous performance evaluation (previously, “validation”) for informed use of new technologies for sleep health measurement. Sleep Health. 2022;8(3):263–269. doi:10.1016/j.sleh.2022.02.006
18. Nakano H, Hirayama K, Sadamitsu Y, et al. Monitoring sound to quantify snoring and sleep apnea severity using a smartphone: proof of concept. J Clin Sleep Med. 2014;10(1):73–78. doi:10.5664/jcsm.3364
19. Stippig A, Hubers U, Emerich M. Apps in sleep medicine. Sleep Breath. 2015;19(1):411–417. doi:10.1007/s11325-014-1009-6
20. Lorenz CP, Williams AJ. Sleep apps: what role do they play in clinical medicine? Curr Opin Pulm Med. 2017;23(6):512–516. doi:10.1097/MCP.0000000000000425
21. Shin H, Cho J. Unconstrained snoring detection using a smartphone during ordinary sleep. Biomed Eng Online. 2014;13:116. doi:10.1186/1475-925X-13-116
22. Camacho M, Robertson M, Abdullatif J, et al. Smartphone apps for snoring. J Laryngol Otol. 2015;129(10):974–979. doi:10.1017/S0022215115001978
23. Chiang JK, Lin YC, Lin CW, Ting CS, Chiang YY, Kao YH. Validation of snoring detection using a smartphone app. Sleep Breath. 2021. doi:10.1007/s11325-021-02359-3
24. Baptista PM, Martin F, Ross H. A systematic review of smartphone applications and devices for obstructive sleep apnea. Braz J Otorhinolaryngol. 2022;88 Suppl 5(Suppl 5):S188–S197. doi:10.1016/j.bjorl.2022.01.004
25. Menghini L, Cellini N, Goldstone A, Baker FC, de Zambotti M. A standardized framework for testing the performance of sleep-tracking technology: step-by-step guidelines and open-source code. Sleep. 2021;44(2):657. doi:10.1093/sleep/zsaa170
 © 2024 The Author(s). This work is published and licensed by Dove Medical Press Limited. The
full terms of this license are available at https://www.dovepress.com/terms
and incorporate the Creative Commons Attribution
- Non Commercial (unported, 3.0) License.
By accessing the work you hereby accept the Terms. Non-commercial uses of the work are permitted
without any further permission from Dove Medical Press Limited, provided the work is properly
attributed. For permission for commercial use of this work, please see paragraphs 4.2 and 5 of our Terms.
© 2024 The Author(s). This work is published and licensed by Dove Medical Press Limited. The
full terms of this license are available at https://www.dovepress.com/terms
and incorporate the Creative Commons Attribution
- Non Commercial (unported, 3.0) License.
By accessing the work you hereby accept the Terms. Non-commercial uses of the work are permitted
without any further permission from Dove Medical Press Limited, provided the work is properly
attributed. For permission for commercial use of this work, please see paragraphs 4.2 and 5 of our Terms.