Back to Journals » Neuropsychiatric Disease and Treatment » Volume 22
Validation and Functional Exploration of Exosome-Derived ITGA9-AS1 and WNT5A-AS1 as Candidate Diagnostic Biomarkers for Schizophrenia
Authors Xu Y, Wang Y, Qin F, Yu L, Li W, You X, Guo L, Liu Y ![]() , Zeng Y
, Zeng Y ![]()
Received 1 February 2026
Accepted for publication 9 June 2026
Published 15 June 2026 Volume 2026:22 600571
DOI https://doi.org/10.2147/NDT.S600571
Checked for plagiarism Yes
Review by Single anonymous peer review
Peer reviewer comments 2
Editor who approved publication: Professor Taro Kishi
Yangyang Xu,1,2,* Yan Wang,3,* Fuyi Qin,4 Ling Yu,1 Weihao Li,1 Xu You,5 Li Guo,5 Yilin Liu,1 Yong Zeng1
1Key Laboratory of Neurological and Psychiatric Disease Research of Yunnan Province, The Second Affiliated Hospital of Kunming Medical University, Kunming, Yunnan, People’s Republic of China; 2Department of Mental Health, Sichuan Rehabilitation Hospital, Chengdu, Sichuan, People’s Republic of China; 3Psychology Department, Sichuan Jinxin Xinan Women & Children’s Hospital (Jingxiu Campus), Chengdu, Sichuan, People’s Republic of China; 4Department of Mental Health Center, Taihe Hospital, Hubei University of Medicine, Shiyan, Hubei, People’s Republic of China; 5Psychiatry Department, Honghe Hani and Yi Autonomous Prefecture No. 2 People’s Hospital, Honghe, Yunnan, People’s Republic of China
*These authors contributed equally to this work
Correspondence: Yilin Liu, Email [email protected] Yong Zeng, Email [email protected]
Objective: Schizophrenia lacks objective biomarkers, and its complex aetiology demands epigenetic insight. Given the regulatory roles of long non-coding RNAs (lncRNAs) in the nervous system and brain-relevant signals in peripheral exosomes, we evaluated lncRNA expression in patient blood cells and plasma exosomes, assessed their diagnostic value, and explored potential functions and mechanisms.
Methods: Differentially expressed lncRNAs in schizophrenia-related exosomes were identified from GEO (GSE228881), and 15 candidates were selected for validation. In a clinical cohort, RT-qPCR assessed their expression in peripheral blood cells and plasma exosomes. Diagnostic accuracy was evaluated by ROC analysis. Top dysregulated lncRNAs underwent bioinformatic analyses: subcellular localization, evolutionary conservation, ceRNA network construction, and GO/KEGG enrichment.
Results: ITGA9-AS1 and WNT5A-AS1 were significantly upregulated in both peripheral blood cells and plasma exosomes from patients. Both showed favorable diagnostic potential, with AUC values of 0.8422 and 0.8073, respectively, in peripheral blood; their combination yielded an AUC of 0.9180. Bioinformatics analysis revealed that ITGA9-AS1 primarily localizes to the cytoplasm, whereas WNT5A-AS1 is enriched in exosomes, with both exhibiting high evolutionary conservation. Functional predictions suggest ITGA9-AS1 may regulate neuroplasticity-related pathways such as “long-term potentiation” and “cAMP signaling pathway” via a ceRNA mechanism. WNT5A-AS1 may mediate intercellular communication through exosomes, influencing developmental and metabolic pathways, including the “Notch signaling pathway” and “cysteine and methionine metabolism”.
Conclusion: Our findings suggest that ITGA9-AS1 and WNT5A-AS1 are highly promising biomarker candidates for schizophrenia. They may be involved in the disease process through distinct mechanisms (intracellular regulation and intercellular communication), thus providing a new theoretical framework and suggesting potential therapeutic targets.
Keywords: schizophrenia, long non-coding RNA, biomarker, ITGA9-AS1, WNT5A-AS1
Introduction
Schizophrenia (SZ) is a severe mental disorder with a complex etiology and has long been in want of objective biological diagnostic criteria.1 Currently, its clinical diagnosis mainly depends on symptomatologic evaluations outlined in The Diagnostic and Statistical Manual of Mental Disorders (DSM) or the International Classification of Diseases (ICD), showing strong subjectivity and poor diagnostic consistency. This presents substantial challenges for early detection and personalized treatment.2 Globally, the prevalence of this condition stands at approximately 1%, with onset usually happening in late adolescence or early adulthood, placing a heavy burden on affected families and society as a whole.3 Thus, the identification of objective biomarkers capable of reflecting the intrinsic pathophysiological mechanisms of the disease has turned into a crucial matter demanding urgent attention in this field. Traditional genetic investigations have identified some risk genes, but they find it tough to fully clarify the complex etiology of schizophrenia.4 In recent years, epigenetics has come to the fore as a vital link connecting genetic makeup to environmental risks, opening up fresh paths for probing into the disease’s mechanisms.5 Among a host of epigenetic regulatory factors, long non-coding RNAs (lncRNAs) have drawn considerable interest because of their key roles in essential processes like neurodevelopment, synaptic plasticity, and inflammatory regulation.6 Previous studies have shown that abnormal expression of several lncRNAs (such as GOMAFU) in the central nervous system is closely tied to the pathological progression of schizophrenia.7 Nevertheless, the difficulty still lies in acquiring stable, peripheral biomarkers that precisely mirror brain states. Peripheral blood samples, though easily accessible, have complex compositions. In these samples, RNA signaling is susceptible to interference from systemic metabolic factors and other influences.8 In recent years, exosomes—nanoscale vesicles that can cross the blood-brain barrier9—have provided a new way to tackle these challenges. Exosomes can carry specific molecular “cargo” from source cells (such as neurons and glial cells) and release it steadily into the peripheral circulation. As a result, they can, to a large extent, reflect pathological changes within the brain.10 Compared to whole blood samples, lncRNAs in plasma exosomes not only show greater stability but also have improved tissue specificity, rendering them an ideal option for exploring biomarkers of psychiatric disorders.11
Long non-coding RNAs (lncRNAs) have emerged as crucial epigenetic regulators implicated in neurodevelopmental disorders, including schizophrenia. Moreover, lncRNAs encapsulated within plasma exosomes represent promising stable, peripheral biomarkers that may reflect brain pathophysiology due to the ability of exosomes to cross the blood-brain barrier. Against this background, we hypothesized that plasma exosomes from schizophrenia patients carry a distinct lncRNA signature, and that specific components of this signature could serve as both diagnostic biomarkers and functional regulators. To identify such candidates in an unbiased manner, we first performed a bioinformatics screening of a published exosomal RNA-seq dataset (GSE228881) from schizophrenia.12 Applying stringent thresholds (|log2FC|≥ 5, P < 0.05), we identified a substantial set of dysregulated lncRNAs. Guided by the working hypothesis that upregulated transcripts may be more directly linked to active disease processes, we focused our initial validation efforts on the subset of significantly upregulated lncRNAs. From this set, to ensure a representative and unbiased selection for downstream validation, we employed a stratified random sampling method to select a manageable number of initial candidates lncRNAs for preliminary assessment. This approach was designed to minimize selection bias and to test whether signals from a high-throughput discovery cohort could be replicated in an independent clinical sample.
Among the candidates meeting these criteria, ITGA9-AS1 and WNT5A-AS1 emerged as particularly promising due to the magnitude of their dysregulation. Therefore, we designed the present study not as an unbiased discovery effort, but as a focused, hypothesis-driven validation of these two lncRNAs. This approach allowed us to prioritize depth over breadth, conducting an in-depth, multi-level analysis. Specifically, our objectives were: (1) to confirm the differential expression of ITGA9-AS1 and WNT5A-AS1 in both peripheral blood cells and plasma exosomes from an independent cohort of patients with schizophrenia using RT-qPCR; (2) to evaluate their individual and combined diagnostic performance using receiver operating characteristic (ROC) curve analysis; and (3) to utilize bioinformatics tools to generate testable hypotheses regarding their potential biological functions and mechanisms of action. Through this work, we aim to provide evidence for novel candidate biomarkers and to offer initial insights into their possible roles in the disease.
Methods
Materials
All chemical reagents and antibodies used in this study are listed in Table S1.
Participants
This study comprised 52 hospitalized patients with schizophrenia and 53 age and gender matched healthy controls. The patient cohort, aged 19–59 years, was recruited from the inpatient unit of Honghe Hani and Yi Autonomous Prefecture No. 2 People’s Hospital. The diagnosis of schizophrenia for each patient was independently confirmed by two board-certified psychiatrists in accordance with the Diagnostic and Statistical Manual of Mental Disorders, Fifth Edition (DSM-5) criteria. At the time of enrollment, all patients were receiving standard inpatient psychiatric care yet presented with clinically significant residual symptoms. Healthy controls were recruited from the Physical Examination Center of The Second Affiliated Hospital of Kunming Medical University and were screened using a structured health questionnaire to exclude any personal or family history (among first-degree relatives) of major psychiatric disorders. The study protocol was approved by the Ethics Committee of The Second Affiliated Hospital of Kunming Medical University. Written informed consent was obtained from all participants prior to any study procedures.
Screening lncRNAs via Public Databases
To pinpoint lncRNAs with differential expression in SZ patients compared to healthy controls, our study first turned to the Gene Expression Omnibus (GEO) database. We carried out searches employing keywords like “schizophrenia”, “Homo sapiens”, “exosome”, and “lncRNA”. Drawing on the search outcomes, we performed a screening process that incorporated lncRNA-related data from the published article titled “Plasma exosomes lncRNA-miRNA-mRNA network construction and its diagnostic efficacy identification in first-episode schizophrenia”.12
Collection and Processing of Peripheral Blood and Plasma Samples
Fasting venous blood samples were drawn from all participants in the morning and placed into EDTA anticoagulant tubes. The collected peripheral blood samples were divided into smaller portions for simultaneous processing. One portion of whole blood was mixed with red cell lysis buffer at 4°C to eliminate erythrocytes, leaving behind the nucleated cell fraction. Another portion of whole blood was centrifuged to isolate plasma. Both processed samples were then stored at −80°C. Next, exosomes were extracted from the plasma using size-exclusion chromatography and concentrated to 50 μL with ultrafiltration tubes. These processed exosome samples were also stored at −80°C. Finally, total RNA was isolated from both the nucleated cell pellet and the concentrated exosome sample using the TRIzol method.
Extraction and Identification of Plasma Exosomes
We used Size Exclusion Chromatography (SEC) to isolate exosomes from plasma. Here’s a brief overview of the procedure: Frozen plasma samples were thawed at 4°C and then centrifuged at 12,000 g for 30 minutes to get rid of cellular debris and large particles. A volume of 500 µL of the clear supernatant was loaded onto a qEV Prime SEC column (Izon Science, New Zealand), eluted with phosphate-buffered saline (PBS) as per the manufacturer’s instructions, and the exosome-rich eluate (approximately 1.6mL) was collected. To get a high enough exosome concentration for the subsequent RNA extraction, we concentrated the collected eluate (around 1.6 mL) down to about 50 µL using an ultrafiltration centrifuge tube (Vivaspin®2, 30 kDa MWCO, PES membrane, Sartorius, VS0221) at 4°C and 4000 g. We characterized the extracted exosomes using the following three methods: Nanoparticle tracking analysis (NTA). We used a nanoparticle flow cytometer (NanoFCM N30E, China) to analyze the size distribution and particle concentration of the extracted exosomes. The samples were measured after being properly diluted in PBS. Transmission electron microscopy (TEM): We placed a small amount of the exosome suspension on a copper grid. After negative staining with 2% uranyl acetate, we observed the typical vesicular shape of exosomes under a transmission electron microscope. Protein immunoblotting (Western Blot): We detected the expression of exosome-specific marker proteins (such as CD63 and TSG101) to confirm that the isolated structures were indeed exosomes. This is a standard qualitative assay wherein conventional loading controls are typically omitted, as the protein composition of exosomes differs significantly from that of parent cells, making traditional reference proteins unreliable for normalization.13 A pre-stained protein marker (10–180 kDa) was used for molecular weight calibration, and its electrophoresis and transfer performance is shown in Figure S1.
RNA Extraction and cDNA Synthesis
Total RNA was isolated from two sources: exosome samples derived from peripheral blood leukocyte sedimentation and concentrated plasma. RNA extraction was carried out using TRIzol reagent (Thermo Fisher Scientific, USA), following the manufacturer’s instructions precisely. The concentration and purity (A260/A280 ratio) of the extracted RNA were determined using a micro-volume spectrophotometer (Thermo Scientific). All RNA samples were either promptly utilized for reverse transcription or stored at −80°C for future use. Genomic DNA was removed, and cDNA synthesis was conducted using the PrimeScript RT Reagent Kit with gDNA Eraser (YUNBIO, China), with reaction conditions strictly in line with the kit’s guidelines.
RT-qPCR
Detection was performed using 2×Universal SYBR qPCR Master Mix (YUNBIO, China) on a real-time fluorescent quantitative PCR instrument (BIO-RAD, USA). The reaction mixture had a total volume of 20μL, comprising SYBR Green Mix, forward and reverse primers, and the cDNA template. Each sample was run in triplicate. The reaction programmed was as follows: An initial pre-denaturation step at 95°C for 30 seconds was performed. This was followed by 40 cycles, each cycle comprising a 5-second denaturation step at 95°C and a 30-second annealing/extension step at 60°C. β-Actin served as the housekeeping gene. The relative expression levels of the target long non-coding RNAs (lncRNAs), namely ITGA9-AS1 and WNT5A-AS1, were calculated using the 2^-ΔΔCt method. Gene expression levels were normalized to β-actin using the comparative 2^−ΔΔCt method. The primer sequences employed are detailed in Table 1.
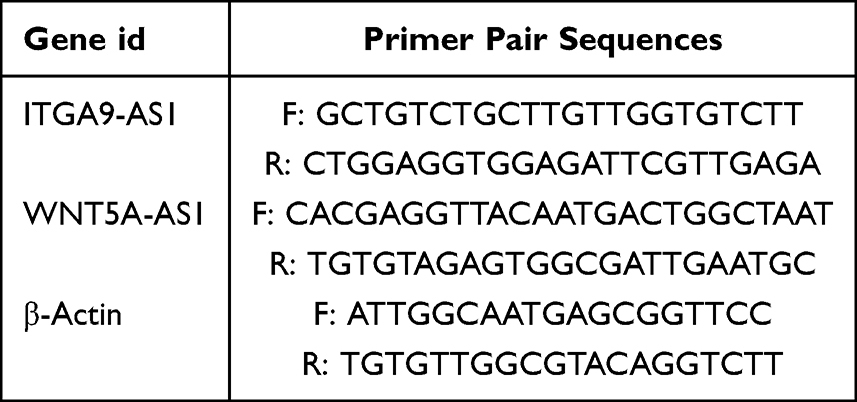 |
Table 1 Sequences of Primers Used for RT-qPCR Analysis |
Bioinformatics Analysis
In this study, we adopted a sequential analytical approach for the functional prediction of target long non-coding RNAs (lncRNAs). All analyses were conducted using the human reference genome version GRCh38/hg38. First, we retrieved official annotations, genomic coordinates, and sequence information for the target lncRNA from the GENCODE database (version 44). Next, we used the iLoc-LncRNA online tool to predict its subcellular localization. To verify its non-coding property, we carried out coding potential analysis through the PhyloCSF track in the UCSC Genome Browser. We evaluated the evolutionary conservation of this lncRNA using the UCSC phastCons 100 Vertebrates track. Conservation data were processed using R (version 4.5.1) along with the rtracklayer and GenomicRanges packages. Conservation scores were then calculated for specific regions. Based on its subcellular localization, we made predictions about its potential function as a competitive endogenous RNA (ceRNA). We integrated predictions from the ENCORI (starBase), TargetScan, and miRDB databases to identify potential ceRNA interaction pairs. Finally, we performed Gene Ontology (GO) and Kyoto Encyclopedia of Genes and Genomes (KEGG) pathway enrichment analyses on the target mRNAs using the website https://www.bioinformatics.com.cn. We set the significance threshold at a false discovery rate (FDR) < 0.05.
Statistical Analysis
Statistical analyses were carried out utilizing SPSS 26.0 software and GraphPad Prism 9.0. For quantitative data, we first checked if they met the requirements of the Shapiro–Wilk normality test. Data that conformed to normality were presented as mean ± standard deviation, and independent samples tests were used for comparisons between groups. Categorical data were expressed as counts (percentages), and chi-square tests were used to compare differences between groups. We evaluated the diagnostic performance of lncRNAs through receiver operating characteristic (ROC) curve analysis and calculated the area under the curve (AUC). All statistical tests were two-tailed, and a P-value less than 0.05 was regarded as statistically significant.
Results
Screening for Differentially Expressed lncRNAs and Candidate Gene Acquisition Based on GEO Database Resources
The GSE228881 dataset from the GEO database was chosen for differential expression analysis (Figure 1). By applying the screening criteria of “|log2FC| ≥ 5” and “P < 0.05”, we ultimately identified 2225 significantly upregulated lncRNAs. To guarantee representativeness and scientific rigor in subsequent validation experiments, we selected 15 genes from the aforementioned upregulated lncRNAs through stratified random sampling (Table 2). Stratification was carried out based on log2FC differential fold-change gradients, and the sampling methodology is detailed as follows: From the log2FC range of 5.0–10.0 (1,978 genes), we randomly picked 12; from 10.1–15.0 (222 genes), we randomly picked 2; and from 15.1–21.24 (25 genes), we randomly picked 1. This sampling approach strictly follows the proportion of genes within each differential fold change interval. It comprehensively encompasses genes displaying varying intensities of moderate-to-high, high, and extremely high-fold upregulation while effectively reducing sampling bias. This ensures that the selected genes objectively mirror the overall expression characteristics of upregulated lncRNAs, providing a dependable candidate gene set for subsequent functional validation and mechanistic studies. Differential expression analysis was performed on the GSE228881 dataset from GEO using the Wei Sheng Xin platform (https://www.bioinformatics.com.cn). The dataset included schizophrenia patient plasma exosome samples (n = 10) and healthy control samples (n = 10). Each point represents a lncRNA.
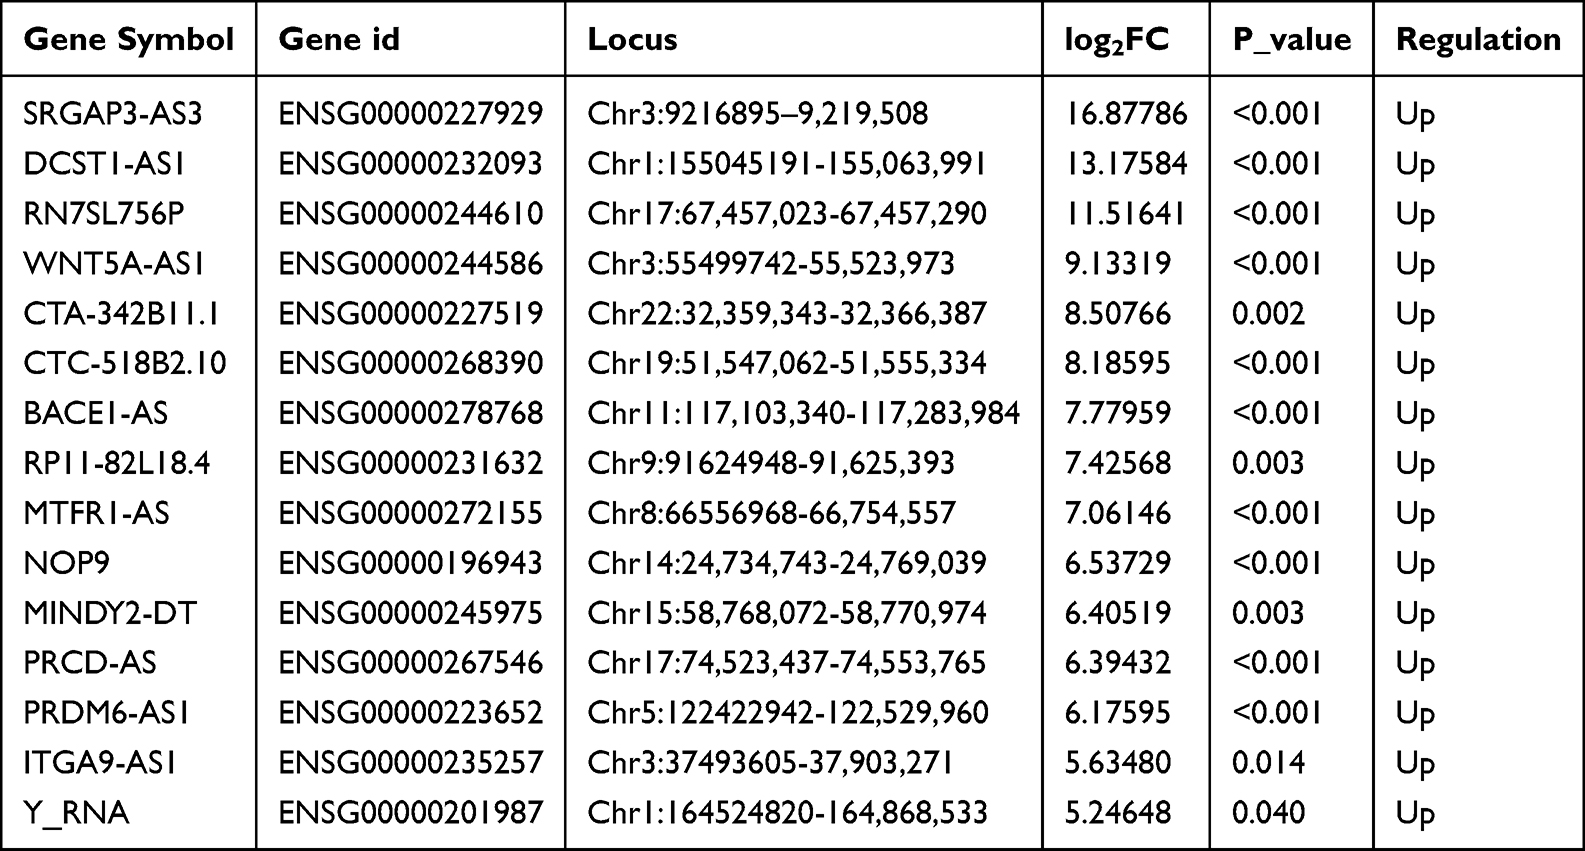 |
Table 2 Candidate Upregulated Differentially Expressed Genes Selected From GSE228881 Dataset |
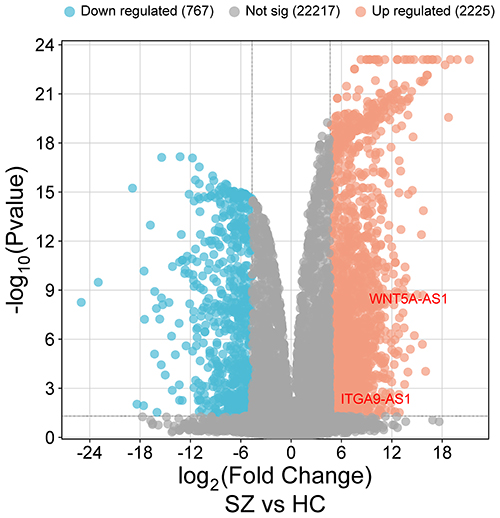 |
Figure 1 Volcano plot of differentially expressed lncRNAs in plasma exosomes of schizophrenia patients. |
Sample Characteristic
This study ultimately recruited 52 patients diagnosed with schizophrenia and 53 healthy control individuals. Peripheral blood was collected from these participants (Table 3). Additionally, plasma exosomes were isolated and used as samples, obtained from 62 schizophrenia patients and 60 healthy controls (Table 4). The Shapiro–Wilk normality test indicated that the age distribution of participants in both groups conformed to a normal distribution (peripheral blood cohort: W = 0.967, P = 0.161 for patients, W = 0.970, P = 0.210 for controls; plasma exosome cohort: W = 0.978, P = 0.313 for patients, W = 0.964, P = 0.078 for controls). Hence, as indicated in Tables 2 and 3, parametric tests confirmed no statistically significant differences between the two groups in terms of age or gender distribution (all P > 0.05).
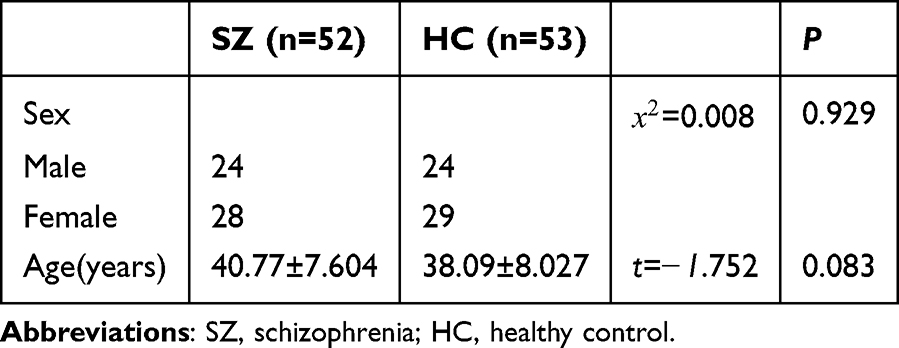 |
Table 3 Comparison of Demographic Characteristics Between Schizophrenia Patients and Healthy Controls Based on Peripheral Blood Samples |
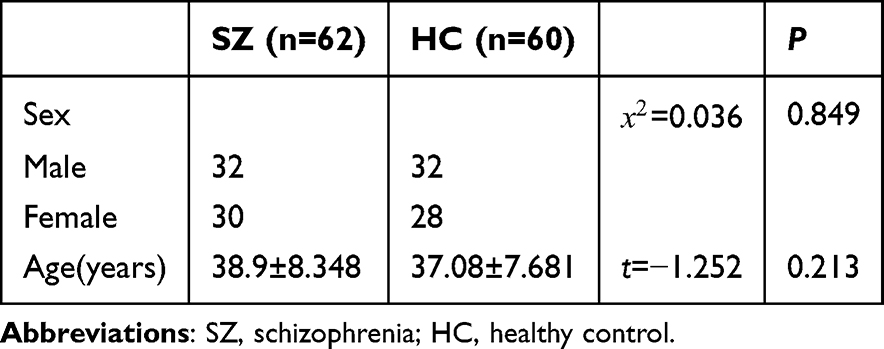 |
Table 4 Comparison of Demographic Characteristics Between Schizophrenia Patients and Healthy Controls Based on Exosome Samples |
Identification of Plasma-Derived Exosomes
To verify the successful isolation of exosomes from plasma, we carried out a series of characterization experiments. Transmission electron microscopy (TEM) observations confirmed that the extracted material consisted of typical cup-shaped or spherical membrane-bound vesicular structures (Figure 2A). Nanoparticle tracking analysis (NTA) revealed that the extracted particles exhibited a peak size distribution primarily within the 100–150 nm range (Figure 2B), consistent with the typical size features of exosomes. Moreover, Western blot analysis detected positive expression of the exosome-specific marker proteins CD63 and TSG101 (Figure 2C). Taken together, these results demonstrate that the extracted particles are indeed exosomes.
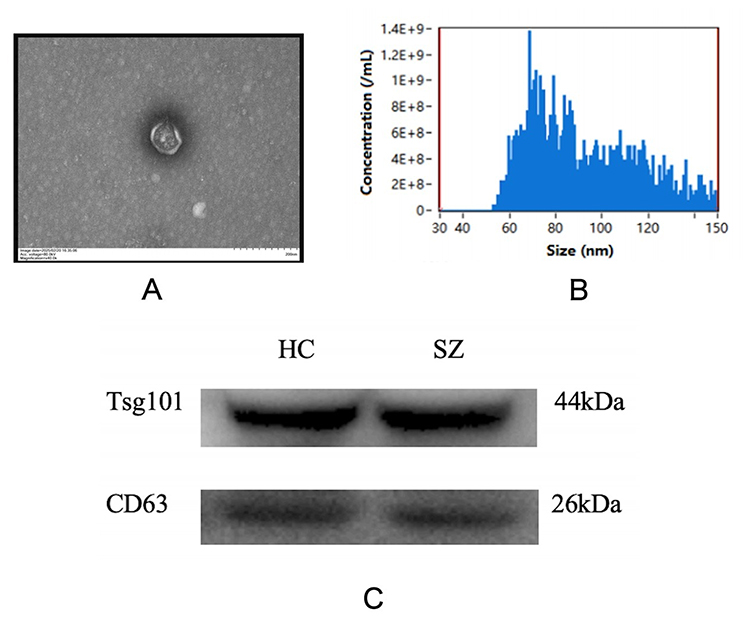 |
Figure 2 Identification of plasma exosomes. (A) Representative TEM image of exosomes. (B) Size distribution of exosomes analyzed by NTA. (C) Western blot analysis of exosomal markers CD63 and TSG101. |
Expression Levels in Blood and Plasma Exosomes
We employed RT-qPCR to detect the relative expression levels of ITGA9-AS1 (ENSG00000235257) and WNT5A-AS1 (ENSG00000244586) in peripheral blood and plasma exosomes obtained from schizophrenia patients and healthy controls. The results revealed that, in comparison with healthy controls, the expression levels of both ITGA9-AS1 and WNT5A-AS1 were markedly elevated in peripheral blood and plasma exosomes from schizophrenia patients (P < 0.001) (Figures 3 and 4).
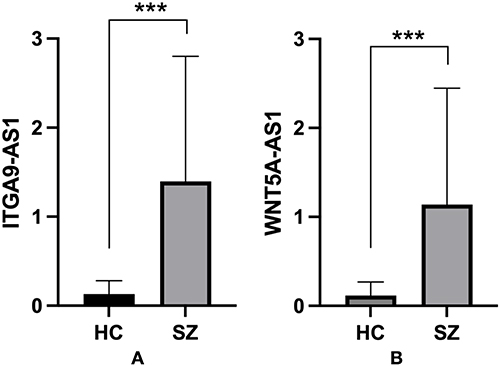 |
Figure 3 The expression levels of candidate lncRNAs ITGA9-AS1. (A) and WNT5A-AS1 (B) are significantly upregulated in the peripheral blood of patients with schizophrenia with statistical significance indicated by ***P < 0.001 compared to the healthy control (HC) group. Data are shown as mean ± SD. |
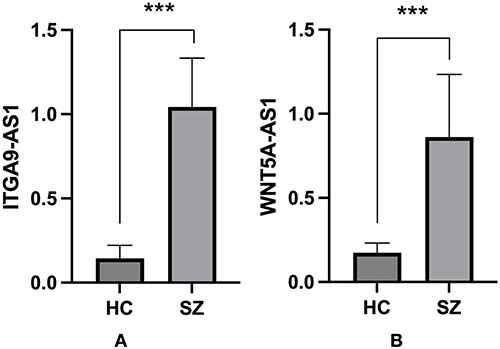 |
Figure 4 The expression levels of candidate lncRNAs ITGA9-AS1 (A) and WNT5A-AS1 (B) were significantly upregulated in plasma exosomes from patients with schizophrenia, with statistical significance indicated by ***P < 0.001 compared to the healthy control (HC) group. Data are shown as mean ± SD. |
To evaluate the diagnostic potential of these two lncRNAs, we performed ROC curve analyses on subjects’ peripheral blood. ITGA9-AS1 exhibited an AUC of 0.8422 (95% CI: 0.799 to 0.885; Table 5) for differentiating schizophrenia patients from healthy controls (Figure 5A). WNT5A-AS1 showed an AUC of 0.8073 (95% CI: 0.731 to 0.834; Table 5 and Figure 5B). When both lncRNAs were combined to establish a diagnostic model, the diagnostic performance was further improved, reaching an AUC of 0.918 (95% CI: 0.886 to 0.949; Table 5 and Figure 5C), which indicated remarkable diagnostic potential.
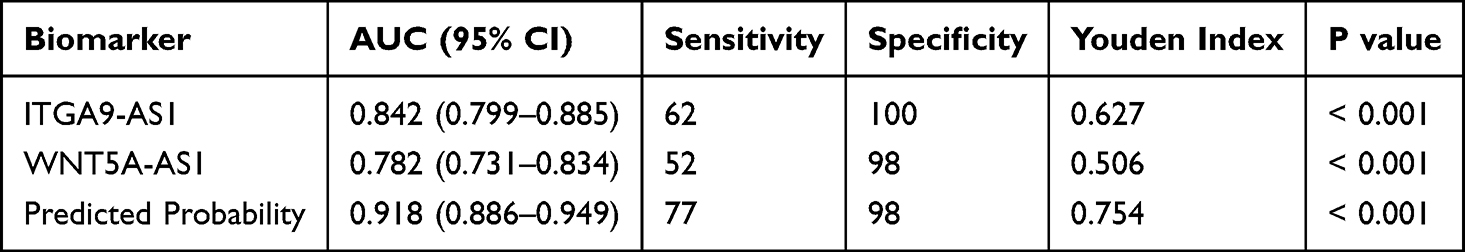 |
Table 5 Diagnostic Efficacy of Candidate lncRNAs and Their Combined Model for Schizophrenia |
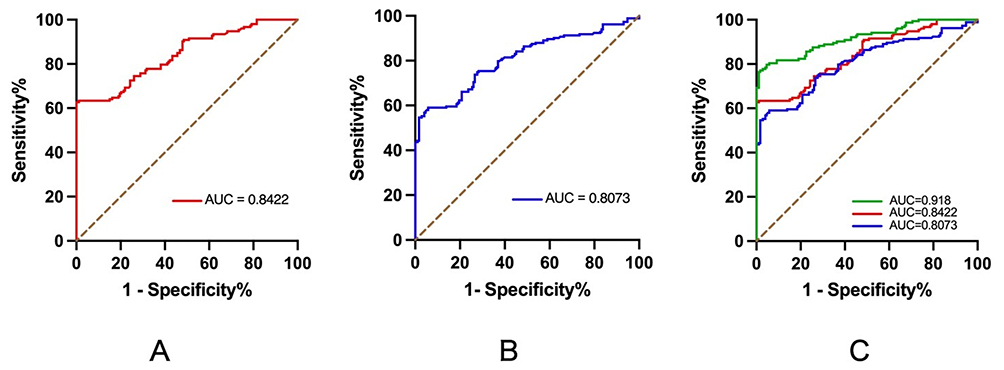 |
Figure 5 Diagnostic performance of lncRNAs in peripheral blood. (A) ROC curve for ITGA9-AS1. (B) ROC curve for WNT5A-AS1. (C) ROC curve for the combined model of ITGA9-AS1 and WNT5A-AS1. The area under the curve (AUC) is indicated. |
Bioinformatics Analysis Predicts the Potential Functions of lncRNAs
To understand the biological characteristics of ITGA9-AS1 and WNT5A-AS1, which exhibit relatively elevated expression in schizophrenia, we initially analyzed their basic genomic features. Bioinformatics analysis showed that ITGA9-AS1 is situated on chromosome 3 (chr3:37,754,307–37,794,806), while WNT5A-AS1 is located in a separate region of chromosome 3 (chr3:55,487,618–55,488,308) (Figure 6A and B).
 |
Figure 6 Coding potential and cross-species conservation analysis of ITGA9-AS1 (A) and WNT5A-AS1 (B). |
We next employed the PhyloCSF algorithm to evaluate their protein-coding potential. The analysis revealed that the PhyloCSF scores across the entire regions of both transcripts were predominantly negative in all six reading frames (Figure 6A and B), confirming their identities as bona fide long non-coding RNAs.
Subcellular localization prediction further suggested distinct functional mechanisms for the two lncRNAs. Using the iLoc-LncRNA tool (http://lin-group.cn/server/iLoc-LncRNA), ITGA9-AS1 was predicted to primarily localize to the cytoplasm (probability = 0.752) (Figure S2A), whereas WNT5A-AS1 showed a high propensity for enrichment in exosomes (probability = 0.844) (Figure S2B). This differential subcellular localization hints at their potentially distinct modes of action.
We performed an evolutionary conservation analysis on two long non - coding RNAs. Through PhastCons analysis, we identified 131 conserved elements within the ITGA9 - AS1 genomic region, and the top 10 are presented in Table 6. The most conserved element had a Mean phastCons score of 0.997. When analyzing WNT5A-AS1, we found 11 conserved signals, and the most prominent one reached a Mean phastCons score of 0.975 (Table 7). These results imply that specific sequences within both lncRNAs, especially ITGA9 - AS1, have been subject to evolutionary constraint, hinting at the possibility that they may carry important biological functions.
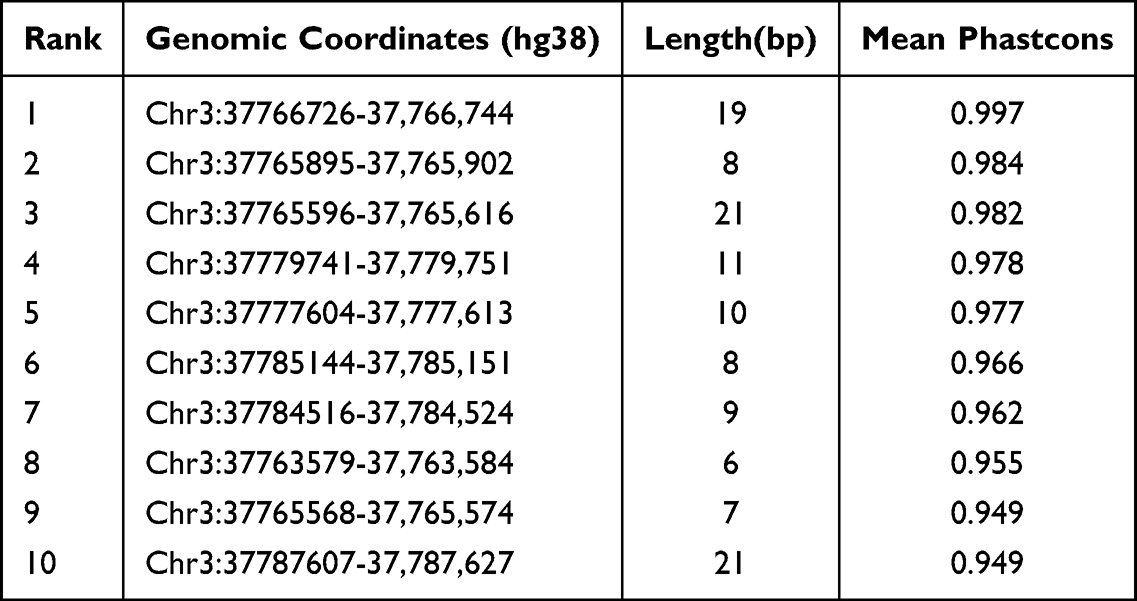 |
Table 6 Top Ten Conserved Elements Within the ITGA9-AS1 Locus Identified by phastCons Analysis |
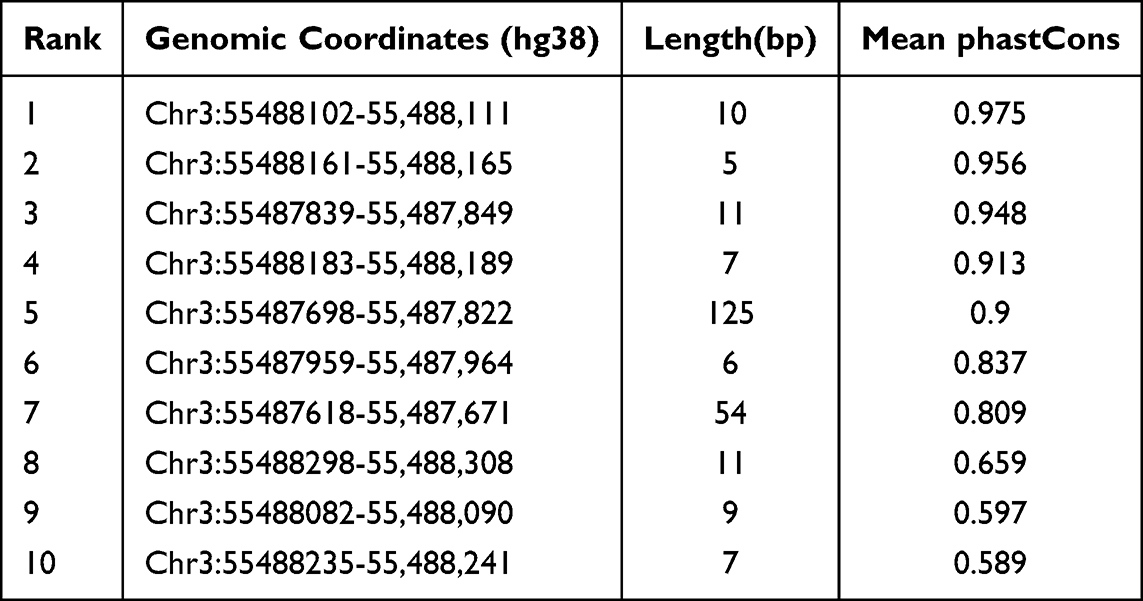 |
Table 7 Top ten Conserved Elements Within the WNT5A-AS1 Locus Identified by phastCons Analysis |
ITGA9-AS1 and WNT5A-AS1 Participate in Distinct Biological Pathways
Based on subcellular localization predictions (ITGA9-AS1 is mainly localized in the cytoplasm, while WNT5A-AS1 is enriched in exosomes), we propose that these two lncRNAs may act as competitive endogenous RNAs (ceRNAs), regulating downstream gene expression by sequestering miRNAs. To test this proposal, we constructed ceRNA regulatory networks for ITGA9-AS1 and WNT5A-AS1 separately. For ITGA9 - AS1, we first predicted its potential binding miRNAs using the lncBase v.3 and starBase databases. Then, we screened the target mRNAs of these miRNAs by taking the intersection of data from the miRDB, TargetScan, and starBase databases. Ultimately, we identified 41 high-confidence target genes (Figure 7A). These target genes form the core downstream components of the ITGA9-AS1-mediated ceRNA regulatory network. For WNT5A-AS1, we adopted a similar approach: predicting interacting miRNAs via lncBase v.3 and starBase, and then determining target mRNAs based on the intersection of data from the miRDB and starBase databases (leaving out TargetScan data due to its exosome localization characteristics). This led to the identification of 34 high-confidence target genes (Figure 7B). These genes may be involved in WNT5A-AS1-mediated cross-cell-cell regulatory processes through the exosome pathway.
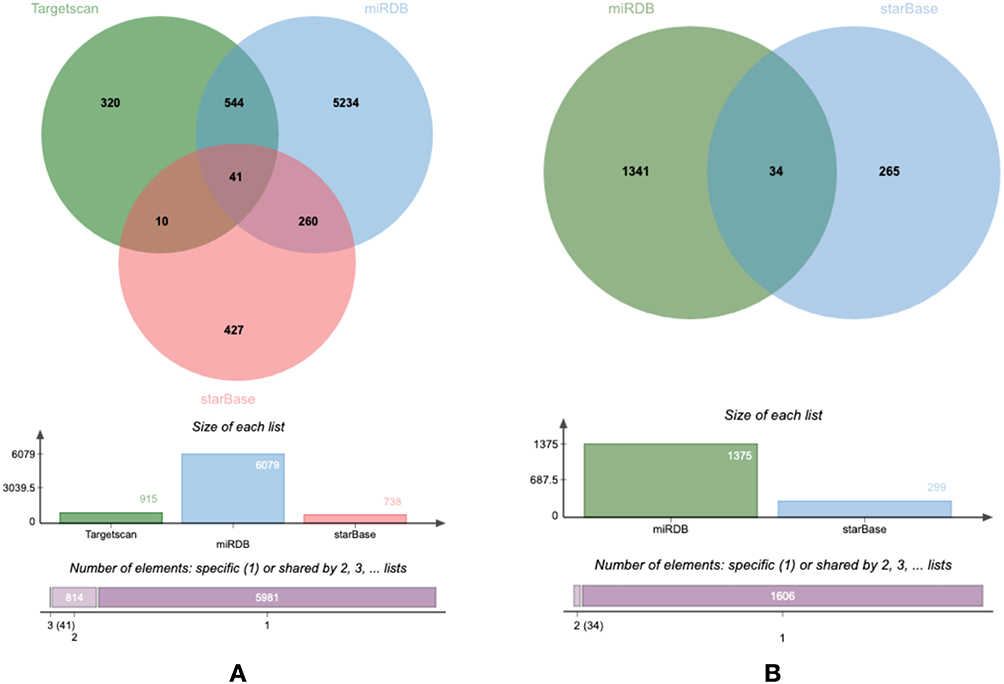 |
Figure 7 Venn diagrams illustrating the screening strategy for identifying high-confidence target genes in the ITGA9-AS1 (A) and WNT5A-AS1 (B) mediated ceRNA networks. |
To gain a deeper understanding of the potential functions of these two ceRNA networks, we carried out GO and KEGG pathway enrichment analyses on the aforementioned target genes. The results show that the target genes linked to ITGA9-AS1 (Figure 8A–D) and WNT5A-AS1 (Figure 8E–H) display distinct functional pathways, indicating they may be involved in the pathological processes of schizophrenia through different molecular mechanisms. For ITGA9-AS1, the enrichment results highlighted core pathways related to neuronal function. KEGG pathway analysis revealed that its target genes were most significantly enriched in the “Long-term potentiation” pathway, a key synaptic plasticity pathway closely tied to learning and memory. At the same time, they also showed notable enrichment in the “cAMP signalling pathway”. GO analysis further enriched this functional picture, revealing significant participation of its target genes in molecular functions such as “SMAD binding” and “DNA-binding transcription factor binding”, as well as biological processes including “negative regulation of ubiquitin-dependent protein catabolic process”. Taken together, these findings strongly imply that ITGA9-AS1 may play a vital role in regulating synaptic plasticity and intracellular signal transduction. In contrast, the target genes of WNT5A-AS1 show enrichment across a different set of biological categories. Their target genes display significant enrichment in the molecular function category of “protein serine/threonine kinase inhibitor activity”. They mainly take part in the biological process “positive regulation of nucleotide biosynthetic process” and show enrichment in the cellular component “histone methyltransferase complex”. KEGG pathway analysis further connects WNT5A-AS1 to “Cysteine and methionine metabolism” and the “Notch signaling pathway”. These results suggest that the function of WNT5A-AS1 is more closely related to fundamental metabolic regulation and development-associated signaling pathways.
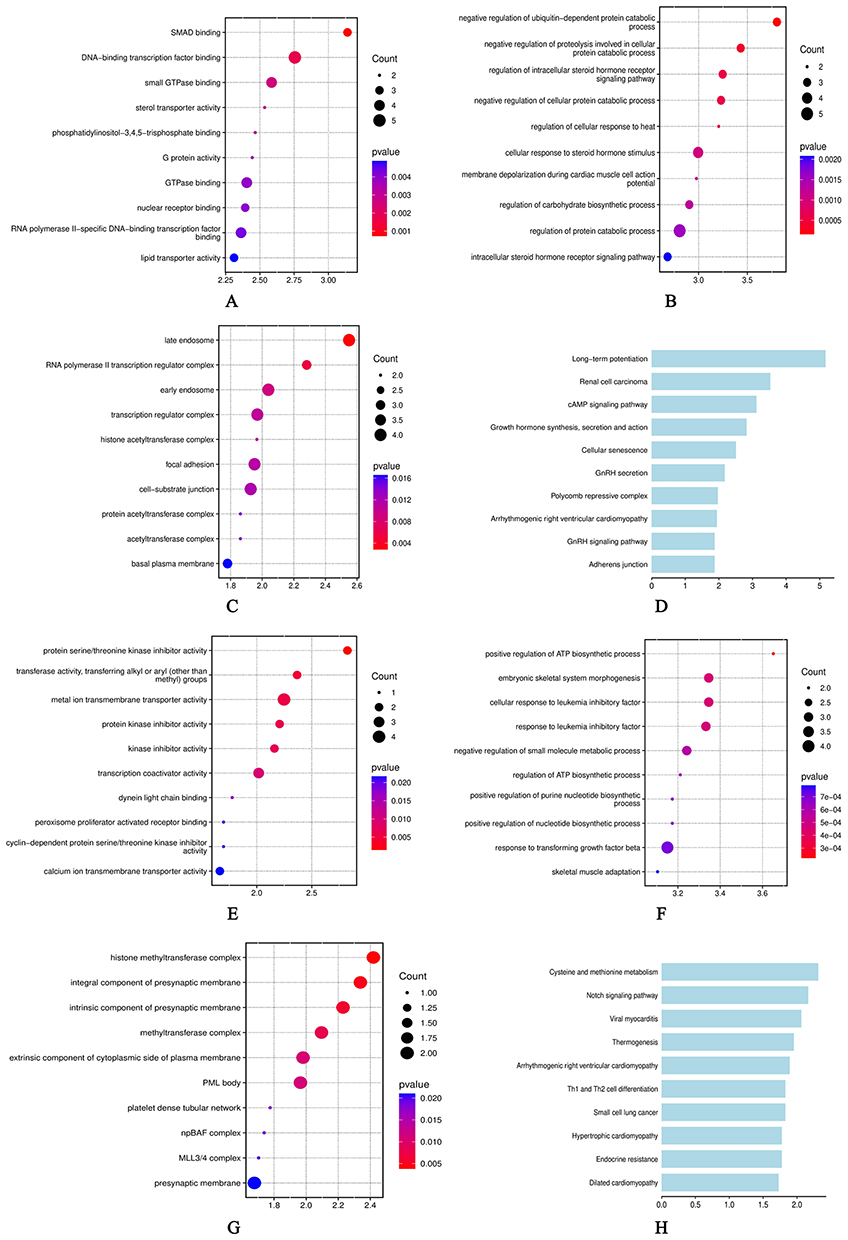 |
Figure 8 GO and KEGG enrichment analyses of potential target genes. (A–D) Analyses for ITGA9-AS1. (E–H) Analyses for WNT5A-AS1. (A–E) Dot plot of Gene Ontology (GO) Molecular Function enrichment analysis. (B–F) Dot plot of GO Biological Process enrichment analysis. (C–G) Dot plot of GO Cellular Component enrichment analysis. (D–H) Bar chart of KEGG pathway analysis. In the dot plots (A–C and E–G), the size of the dots represents the number of enriched genes, and the color gradient indicates the statistical significance (Enrichment Score, -log10(p-value)). In the bar charts (D–H), the x-axis represents the Enrichment Score. |
Discussion
Schizophrenia is a complicated neurodevelopmental disorder,14 and the long-term lack of objective diagnostic biomarkers has hampered clinical diagnosis and treatment.15 This study focused on two plasma-derived lncRNAs, ITGA9-AS1 and WNT5A-AS1, in schizophrenia, investigating their expression patterns, diagnostic potential, and possible biological functions. We found consistent upregulation of both lncRNAs in patient samples. Based on their distinct predicted subcellular localizations, we further propose a working hypothesis that they might contribute to disease-associated processes via two different putative pathways: “intracellular regulation” and “intercellular communication”. This preliminary model could provide a new framework for exploring the epigenetic mechanisms of schizophrenia.
One of the central findings of our work is the reproducible upregulation of ITGA9-AS1 and WNT5A-AS1 observed in schizophrenia patients’ peripheral blood and plasma exosomes. This consistent dysregulation across two biologically distinct compartments significantly strengthens their candidacy as disease-associated biomarkers and merits further investigation. The detection of these lncRNAs in plasma exosomes is of particular interest. Exosomes are known to carry molecular cargo from their cell of origin and can cross the blood-brain barrier, entering the peripheral circulation.9 Consequently, RNA signals within plasma exosomes are thought to provide a more refined reflection of pathological changes in the brain compared to the complex mixture of RNAs in whole blood.16 Our results, therefore, support a plausible hypothesis that the detected lncRNA signals may, at least in part, originate from the central nervous system. This lends support to the promising strategy of using accessible peripheral blood exosomes to glean insights into brain pathology.
However, a critical methodological consideration must be highlighted when evaluating the diagnostic potential of these exosomal lncRNAs. Due to the extremely low yield of exosomal RNA, we were compelled to pool samples from multiple individuals (every 20 subjects) to obtain sufficient material for analysis. This necessary step meant that we lacked individual-level expression data for the exosomal fraction. Since receiver operating characteristic (ROC) curve analysis fundamentally requires one data point per subject to correlate with disease status, we could not validly assess the diagnostic performance of ITGA9-AS1 or WNT5A-AS1 based on exosomal samples alone. For this analysis, we focused on peripheral blood samples, where individual-level quantification was feasible.
In peripheral blood, both lncRNAs demonstrated strong individual discriminatory ability, with AUC values exceeding 0.80. More importantly, when combined into a diagnostic model, their efficacy was significantly enhanced, achieving an AUC of 0.918. This synergistic effect, where the combination outperforms either molecule alone, is consistent with the concept that the multifaceted pathology of schizophrenia may be better captured by a panel of biomarkers acting through complementary pathways. A multi-molecule approach could potentially address the inherent heterogeneity of the disease and overcome limitations of single biomarkers, such as constrained sensitivity or specificity.
Bioinformatics analysis offered crucial insights for generating mechanistic hypotheses, centering on the divergent predicted subcellular localizations of ITGA9-AS1 and WNT5A-AS1. Initial analysis using the PhyloCSF algorithm confirmed their non-coding nature (Figure 6A and B), a prerequisite for their regulatory roles. Subsequent subcellular localization predictions revealed a fundamental dichotomy: ITGA9 - AS1 is predominantly predicted to reside in the cytoplasm (probability = 0.752). Whereas WNT5A - AS1 shows a high predicted enrichment within exosomes (probability = 0.844). This stark contrast led us to hypothesize that they might operate through fundamentally distinct cellular mechanisms.
For ITGA9-AS1, its predicted cytoplasmic localization suggests a potential role in intracellular regulation, possibly as a competitive endogenous RNA (ceRNA).17,18 To explore this possibility, we constructed a putative ceRNA network. Functional enrichment analysis of the genes within this predicted network revealed significant associations with pathways critically involved in neural plasticity, namely “Long-term potentiation (LTP)” and the “cAMP signaling pathway”.19,20 Because synaptic dysfunction is a core pathology in schizophrenia,21,22 we speculate that ITGA9-AS1,by acting as a molecular sponge for specific miRNAs, could contribute to these processes. This could, in theory, alleviate post-transcriptional repression of key genes within these plasticity-related pathways, thereby potentially contributing to the fin-tuning of synaptic function. The high evolutionary conservation observed in its genomic region lends further, albeit indirect, support to its potential importance in nervous system biology.
For WNT5A-AS1, its strong predicted association with exosomes aligns with our experimental detection of it in plasma exosomes and points towards a potential role in intercellular communication.23 Analysis of its putative target genes highlighted enrichment in the “Notch signaling pathway”—a key mediator of cell-cell communication involved in neurodevelopment,24,25 “cysteine and methionine metabolism”, a central metabolic axis governing antioxidant defense and epigenetic regulation,26 processes implicated in schizophrenia pathology,27 Building on these predictions, we hypothesize a more complex, spatially extended role for WNT5A-AS1. It might be selectively packaged into exosomes by neural or glial cells and delivered to recipient cells. In this scenario, it could act as a novel exosomal “signal” that may concurrently modulate target cell processes such as Notch signaling (influencing development/fate) and metabolic homeostasis, thereby potentially intervening at a critical “neuro-metabolic” interface relevant to schizophrenia.
In summary, this study demonstrates that ITGA9-AS1 and WNT5A-AS1 are consistently upregulated in the peripheral blood and plasma exosomes of patients with schizophrenia, and they exhibit promising diagnostic potential, particularly when combined. Based on these correlative findings, our bioinformatic analyses have led us to formulate specific, testable hypotheses regarding their distinct functional roles: ITGA9-AS1, predicted to be cytoplasmic, may influence synaptic plasticity pathways through a ceRNA mechanism, whereas WNT5A-AS1, predicted to be exosome-enriched, may participate in intercellular communication by modulating pathways such as Notch signaling and cellular metabolism. Taken together, our work advances the study of these lncRNAs from correlation to a framework for mechanism. It thereby provides a foundation for future experimental studies to define the precise roles of ITGA9-AS1 and WNT5A-AS1 in the pathogenesis of schizophrenia. These interpretations, however, must be considered within the context of several study limitations.
First, our clinical cohort and study design present inherent constraints. Patients (hospitalized, with residual symptoms and varied medications) and controls were recruited from different settings. This, along with the moderate sample size and cross-sectional design, complicates the attribution of lncRNA changes solely to disease pathology and precludes longitudinal analysis. Second, the mechanistic insights are primarily predictive. The proposed functions of ITGA9-AS1 and WNT5A-AS1 rely on computational models. While they offer strong, testable hypotheses, direct experimental validation is required. The cellular origin of the exosomes carrying WNT5A-AS1 also remains unknown. Third, a potential selection bias arises from our focused validation of upregulated lncRNAs only, which means down-regulated species were not investigated. Therefore, future studies must prioritize experimental validation of these mechanisms and subsequent confirmation in larger, prospective cohorts. Ideally, such cohorts would include first-episode, medication-naïve patients to clarify disease-specific changes and trace exosomal origins.
Conclusion
This study provides preliminary evidence supporting the potential of ITGA9-AS1 and WNT5A-AS1 as candidate diagnostic biomarkers for schizophrenia. Their consistent upregulation in peripheral blood and plasma exosomes, along with their favorable diagnostic performance, warrants further investigation. Furthermore, our multi-level analyses, including bioinformatic predictions of their subcellular localization and function, lead us to hypothesize that they may have distinct roles in disease-related processes through distinct modes of action—potentially encompassing intracellular regulation and intercellular communication. Based on these correlative findings, we provide a new perspective on the epigenetic complexity of schizophrenia and highlight promising avenues for developing non-invasive diagnostic strategies based on plasma exosome lncRNAs.
Data Sharing Statement
The data that support the findings of this study are available from the corresponding author, Yong Zeng, upon reasonable request. Requests for data should be directed to [email protected]. The original Western blot data are provided in the Appendix (Table S2 and Figure S3–S8).
Ethics Approval and Consent to Participate
All procedures performed in studies involving human participants were in accordance with the ethical standards of the institutional and/or national research committee and with the 1964 Helsinki declaration and its later amendments or comparable ethical standards. Informed consent forms were obtained from all study participants. The study protocol was approved by the ethical committee of the Second Affiliated Hospital of Kunming Medical University. Ethical review approval number: audit-PJ-Co-2023-244.
Consent for Publication
All participants or their legal guardians signed an informed consent form.
Author Contributions
All authors made a significant contribution to the work reported, whether that is in the conception, study design, execution, acquisition of data, analysis and interpretation, or in all these areas; took part in drafting, revising or critically reviewing the article; gave final approval of the version to be published; have agreed on the journal to which the article has been submitted; and agree to be accountable for all aspects of the work.
Funding
The current study was supported by The Funding Project of National Natural Science Foundation of China (grant no. 82260276). Key Laboratory of Neurological and Psychiatric Disease Research of Yunnan Province (No. 202449CE340017).
Disclosure
The authors declare no conflicts of interest in this work.
References
1. Kraguljac NV, McDonald WM, Widge AS, Rodriguez CI, Tohen M, Nemeroff CB. Neuroimaging biomarkers in schizophrenia. Am J Psychiatry. 2021;178(6):509–16. doi:10.1176/appi.ajp.2020.20030340
2. Berdeville C, Silva-Amaral D, Dalgalarrondo P, Banzato CEM, Martins-de-Souza D. A scoping review of protein biomarkers for schizophrenia: state of progress, underlying biology, and methodological considerations. Neurosci Biobehav Rev. 2025;168:105949. doi:10.1016/j.neubiorev.2024.105949
3. Dubonyte U, Asenjo-Martinez A, Werge T, Lage K, Kirkeby A. Current advancements of modelling schizophrenia using patient-derived induced pluripotent stem cells. Acta Neuropathol. Commun. 2022;10(1):183. doi:10.1186/s40478-022-01460-2
4. Sullivan PF, Yao S, Hjerling-Leffler J. Schizophrenia genomics: genetic complexity and functional insights. Nat Rev Neurosci. 2024;25(9):611–624. doi:10.1038/s41583-024-00837-7
5. Kiltschewskij DJ, Reay WR, Cairns MJ. Schizophrenia is associated with altered DNA methylation variance. Mol Psychiatry. 2025;30(4):1383–1395. doi:10.1038/s41380-024-02749-5
6. Roy B, Verma AK, Funahashi Y, Dwivedi Y. Deciphering the epigenetic role of long non-coding RNAs in mood disorders: focus on human brain studies. Clin transl med. 2025;15(3):e70135. doi:10.1002/ctm2.70135
7. Teng P, Li Y, Ku L, et al. The human lncRNA GOMAFU suppresses neuronal interferon response pathways affected in neuropsychiatric diseases. Brain Behav. Immun. 2023;112:175–187. doi:10.1016/j.bbi.2023.06.009
8. Ueno M, Iwata S, Yamagata K, et al. Induction of interleukin 21 receptor expression via enhanced intracellular metabolism in B cells and its relevance to the disease activity in systemic lupus erythematosus. RMD Open. 2024;10(4). doi:10.1136/rmdopen-2024-004567
9. Han W, Zhang H, Feng L, et al. The emerging role of exosomes in communication between the periphery and the central nervous system. MedComm. 2023;4(6):e410. doi:10.1002/mco2.410
10. Jang YO, Ahn HS, Dao TNT, et al. Magnetic transferrin nanoparticles (MTNs) assay as a novel isolation approach for exosomal biomarkers in neurological diseases. Biomater Res. 2023;27(1):12. doi:10.1186/s40824-023-00353-2
11. Shin H, Kang Y, Choi KW, Kim S, Ham BJ, Choi Y. Artificial Intelligence-Based Major Depressive Disorder (MDD) diagnosis using raman spectroscopic features of plasma exosomes. Anal. Chem. 2023;95(15):6410–6416. doi:10.1021/acs.analchem.3c00215
12. Du X, Lv J, Feng J, et al. Plasma exosomes lncRNA-miRNA-mRNA network construction and its diagnostic efficacy identification in first-episode schizophrenia. BMC Psychiatry. 2023;23(1):611. doi:10.1186/s12888-023-05052-9
13. Jalaludin I, Lubman DM, Kim J. A guide to mass spectrometric analysis of extracellular vesicle proteins for biomarker discovery. Mass Spectrom Rev. 2023;42(2):844–872. doi:10.1002/mas.21749
14. Birnbaum R, Weinberger DR. The genesis of schizophrenia: an origin story. Am J Psychiatry. 2024;181(6):482–492. doi:10.1176/appi.ajp.20240305
15. Dolz M, Tor J, Puig O, et al. Clinical and neurodevelopmental predictors of psychotic disorders in children and adolescents at clinical high risk for psychosis: the CAPRIS study. Eur Child Adolesc Psychiatry. 2024;33(11):3925–3935. doi:10.1007/s00787-024-02436-4
16. Jang YO, Roh Y, Shin W, et al. Transferrin-conjugated magnetic nanoparticles for the isolation of brain-derived blood exosomal MicroRNAs: a novel approach for Parkinson’s disease diagnosis. Anal. Chim. Acta. 2024;1306:342623. doi:10.1016/j.aca.2024.342623
17. Bridges MC, Daulagala AC, Kourtidis A. LNCcation: lncRNA localization and function. J Cell Biol. 2021;220(2). doi:10.1083/jcb.202009045
18. Yu Y, Wang H, You C, Chen X. Plant microRNA maturation and function. Nat Rev Mol Cell Biol. 2025;27:55–70. doi:10.1038/s41580-025-00871-y
19. Dong Y, Wang S, Liu X, Wang Y, Song Y, Wang Y. Transcranial near-infrared therapy restores synaptic resilience by reshaping signaling landscapes in sleep-deprived tauopathy. Neurotherapeutics. 2025;23:e00780. doi:10.1016/j.neurot.2025.e00780
20. Watanabe K, Maruyama Y, Iwashita H, Kato H, Hirayama J, Hattori A. N1-Acetyl-5-methoxykynuramine, which decreases in the hippocampus with aging, improves long-term memory via CaMKII/CREB phosphorylation. J. Pineal Res. 2024;76(1):e12934. doi:10.1111/jpi.12934
21. Ma Y, Gao K, Sun X, et al. STON2 variations are involved in synaptic dysfunction and schizophrenia-like behaviors by regulating Syt1 trafficking. Sci Bull. 2024;69(10):1458–1471. doi:10.1016/j.scib.2024.02.013
22. Morén C, Treder N, Martínez-Pinteño A, et al.systematic review of the therapeutic role of apoptotic inhibitors in neurodegeneration and their potential use in schizophrenia.Antioxidants.11;11. doi:10.3390/antiox11112275
23. Huang M, Ji J, Xu X, et al. Known and unknown: exosome secretion in tumor microenvironment needs more exploration. Genes Dis. 2025;12(1):101175. doi:10.1016/j.gendis.2023.101175
24. Erofeeva N, Galstyan DS, Yang L, et al. Developing zebrafish models of Notch-related CNS pathologies. Neurosci Biobehav Rev. 2025;170:106059. doi:10.1016/j.neubiorev.2025.106059
25. Gonzalez R, Reinberg D. The Notch pathway: a guardian of cell fate during neurogenesis. Curr. Opin. Cell Biol. 2025;95:102543. doi:10.1016/j.ceb.2025.102543
26. Tassinari V, Jia W, Chen WL, Candi E, Melino G. The methionine cycle and its cancer implications. Oncogene. 2024;43(48):3483–3488. doi:10.1038/s41388-024-03122-0
27. Li Z, Wang F, Liang B, et al. Methionine metabolism in chronic liver diseases: an update on molecular mechanism and therapeutic implication. Signal Transduct Target Ther . 2020;5(1):280. doi:10.1038/s41392-020-00349-7
 © 2026 The Author(s). This work is published and licensed by Dove Medical Press Limited. The
full terms of this license are available at https://www.dovepress.com/terms
and incorporate the Creative Commons Attribution
- Non Commercial (unported, 4.0) License.
By accessing the work you hereby accept the Terms. Non-commercial uses of the work are permitted
without any further permission from Dove Medical Press Limited, provided the work is properly
attributed. For permission for commercial use of this work, please see paragraphs 4.2 and 5 of our Terms.
© 2026 The Author(s). This work is published and licensed by Dove Medical Press Limited. The
full terms of this license are available at https://www.dovepress.com/terms
and incorporate the Creative Commons Attribution
- Non Commercial (unported, 4.0) License.
By accessing the work you hereby accept the Terms. Non-commercial uses of the work are permitted
without any further permission from Dove Medical Press Limited, provided the work is properly
attributed. For permission for commercial use of this work, please see paragraphs 4.2 and 5 of our Terms.
Recommended articles
Peripheral Complement Factor-Based Biomarkers for Patients with First-Episode Schizophrenia
Cao Y, Xu Y, Xia Q, Shan F, Liang J
Neuropsychiatric Disease and Treatment 2023, 19:1455-1462
Published Date: 23 June 2023
Identification of Plasma Biomarkers in Untreated Schizophrenia Patients Using Untargeted Lipid Metabolomics
Wang Z, Wang Y, Jiang H, Chen L, Zhang X
Neuropsychiatric Disease and Treatment 2025, 21:2721-2732
Published Date: 3 December 2025
The Effect of miR-1273d Between Chronic Childhood Stress and Positive Symptoms in Schizophrenia: A Preliminary Mediation Analysis
Kong L, Zheng J, Qiang L, Chen S
Neuropsychiatric Disease and Treatment 2026, 22:562131
Published Date: 31 January 2026