Back to Journals » Diabetes, Metabolic Syndrome and Obesity » Volume 15
Utility of Non-High-Density Lipoprotein Cholesterol to High-Density Lipoprotein Cholesterol Ratio in Evaluating Incident Diabetes Risk
Authors Sheng G ![]() , Liu D, Kuang M, Zhong Y, Zhang S, Zou Y
, Liu D, Kuang M, Zhong Y, Zhang S, Zou Y ![]()
Received 7 January 2022
Accepted for publication 25 May 2022
Published 31 May 2022 Volume 2022:15 Pages 1677—1686
DOI https://doi.org/10.2147/DMSO.S355980
Checked for plagiarism Yes
Review by Single anonymous peer review
Peer reviewer comments 3
Editor who approved publication: Prof. Dr. Antonio Brunetti
Guotai Sheng,1,* Dingyang Liu,1,* Maobin Kuang,1,* Yanjia Zhong,2 Shuhua Zhang,3 Yang Zou3
1Cardiology Department, Jiangxi Provincial People’s Hospital, Nanchang, Jiangxi Provincial, 330006, People’s Republic of China; 2Endocrinology Department, Jiangxi Provincial People’s Hospital, Nanchang, Jiangxi Province, 330006, People’s Republic of China; 3Jiangxi Cardiovascular Research Institute, Jiangxi Provincial People’s Hospital, Nanchang, Jiangxi Provincial, People’s Republic of China
*These authors have contributed equally to this work
Correspondence: Yang Zou, Jiangxi Cardiovascular Research Institute, Jiangxi Provincial People’s Hospital, Nanchang, Jiangxi Provincial, People’s Republic of China, Email [email protected]
Purpose: Diabetes is one of the most prevalent chronic diseases in the world, and its prevalence is expected to rise further. To help understand the utility of the ratio of non-high-density lipoprotein cholesterol to high-density lipoprotein cholesterol (NHHR) in diabetes prevention, this large-scale longitudinal cohort study aims to explore the association of NHHR with diabetes risk and compare it as a risk predictor with conventional lipid parameters.
Patients and Methods: This observational study extracted data from the NAGALA longitudinal cohort study conducted in Japan between 2004 and 2015. Multivariate Cox regression analysis was used to evaluate the association between NHHR and the risk of diabetes. The dose–response relationship was analyzed by restricted cubic spline (RCS) regression and the potential risk threshold was estimated. The receiver operator characteristic curve (ROC) was used to analyze and calculate the predictive value and optimal threshold of NHHR and other conventional lipids for new-onset diabetes.
Results: Of the 15,464 people aged 18– 79, 373 (2.41%) were diagnosed with new-onset diabetes during the study period, with a median age of 46 years. The sensitivity analysis based on multivariate adjustment showed that the independent positive correlation between diabetes and NHHR was stable in different populations. RCS and ROC analysis indicated that the association between NHHR and diabetes was non-linear, and the NHHR was a better marker for predicting diabetes risk than other conventional lipid parameters; Additionally, it is worth noting that an NHHR of approximately 2.74 may be the optimal threshold for intervention in diabetes risk.
Conclusion: In the general population, NHHR is a better marker for predicting diabetes risk than conventional lipid parameters, and an NHHR of about 2.74 may be the optimal threshold for assessing diabetes risk.
Keywords: non-high-density lipoprotein cholesterol to high-density lipoprotein cholesterol, diabetes, longitudinal cohort, operator characteristic curve
Introduction
Diabetes is one of the most prevalent chronic diseases in the world and is characterized by a chronic hyperglycemic state caused by defective glucose metabolism.1,2 According to the latest survey report of the International Diabetes Federation (IDF), about 463 million people (9.3%) with diabetes have been recorded and diagnosed worldwide, and this number may reach 700 million (10.9%) by 2045.3 Additionally, IDF also pointed out that nearly half of the patients with diabetes have not been recorded and diagnosed, which will bring a huge burden of disease.4 Compared with people without diabetes, diabetic patients will have a variety of acute and chronic complications, resulting in debilitated and increasing the hospitalization rate and economic burden. In addition, this chronic hyperglycemia state also significantly increases the risk of cerebrovascular and cardiovascular diseases and malignant tumors in patients with diabetes,1,5,6 which is the main cause of death and shortening of life expectancy.7,8 Therefore, early identification of individuals at high risk of developing diabetes is of great significance to reduce the incidence and related complications of diabetes.
In addition to obvious disorders of blood glucose metabolism, diabetic patients are often accompanied by atherosclerotic lipid abnormalities, which are characterized by increased levels of non-high-density lipoprotein cholesterol (non-HDL-C), triglycerides (TG) and decreased levels of high-density lipoprotein cholesterol (HDL-C) concentration.9,10 Observational evidence further confirmed that atherosclerotic lipid abnormalities were independent risk factors for diabetes.10–12 The ratio of non-HDL-C to HDL-C (NHHR) is a newly developed combination indicator of atherogenic lipids, which collects information on all atherogenic and anti-atherogenic lipid particles.13 Some published studies have also shown that NHHR was significantly better than traditional lipid parameters in evaluating coronary atherosclerosis, intracranial atherosclerosis and arterial stiffness. NHHR was a good lipid parameter for evaluating the risk of cardiovascular and cerebrovascular diseases;13–15 Additionally, further studies in recent years have found that this parameter can be used to independently assess the risk of nonalcoholic fatty liver disease (NAFLD), chronic kidney disease, and metabolic syndrome.16–18 These findings suggested that NHHR may be a useful parameter for evaluating metabolism-related diseases. Considering the extensive impact of diabetes on the body’s metabolism, it may be very meaningful to further study the value of NHHR in predicting the risk of diabetes, which remains unknown. For the purpose of clarifying the answer to this question, this study investigated the association between NHHR and diabetes based on the NAGALA longitudinal cohort dataset, and evaluated the predictive value of NHHR for the future risk of diabetes and the related optimal threshold.
Materials and Methods
Study Population and Design
This study was a post-hoc analysis of the NAGALA longitudinal cohort to evaluate the value and threshold of NHHR in predicting diabetes risk and the correlation between them. The NAGALA longitudinal cohort was established by Murakami Memorial Hospital in Japan in 1994 and continued to include the general population who received health screening at the hospital’s physical examination center. Considering that about 60% of these participants attended 1–2 medical checkups every year at Murakami Memorial Hospital and repeated examinations, the NAGALA longitudinal cohort was established to assess common risk factors for chronic diseases such as diabetes and NAFLD.19 The detailed study design has been described elsewhere, and the available NAGALA cohort data and its ownership have been transferred to the Dryad public database by Okamura et al.19 The Dryad database allows different researchers to make more full use of the dataset based on different assumptions without infringing on the author’s rights. In the previous study of Okamura et al, they discussed the relationship between ectopic adiposity and diabetes.19 As a post-hoc analysis of the NAGALA longitudinal cohort, this study aimed to explore the association of NHHR with diabetes. According to the purpose of the study, we extracted the data of 15,464 participants in the NAGALA cohort from 2004 to 2015, excluding the miss of baseline covariates (n=863), excessive drinking (n=739, alcohol consumption over 60 g/day for men and 40 g/day for women),20 drug use (n=2321), liver disease (n=416), confirmed impaired fasting glucose or diabetes (n=1131), and 10 subjects not enrolled in the study for an unknown reason. Informed consent for the use of study data has been authorized by the participants in previous studies, and the initial study protocol was approved by the Ethics Committee of Murakami Memorial Hospital.19 As a post-hoc analysis of the NAGALA cohort study, the institutional Ethics Committee of Jiangxi Provincial People’s Hospital reviewed the current research scheme and exempted the need for repeated ethical approval and informed consent (review No: 2021–066). All procedures conformed to standards set forth in the Declaration of Helsinki.
Data Collection
Baseline data were collected at the Murakami Memorial Hospital physical examination center. In short, trained researchers use standardized self-management questionnaires to collect information about demographic characteristics [age, blood pressure, sex, body mass index (BMI), weight and waist circumference (WC)], lifestyle factors (smoking status, drinking status and habit of exercise), disease history and medication history of the participants. Smoking status was classified as non-smoking, past smoking, and current smoking based on the time at which baseline data were first obtained. Drinking status was classified as non or small drinking, light drinking, moderate drinking, and heavy drinking by the amount of alcohol consumed per week in the past month.21
Blood samples were taken at least 8 hours after fasting. Biochemical indexes such as alanine aminotransferase (ALT), hemoglobin A1c (HbA1c), total cholesterol (TC), gamma-glutamyl transferase (GGT), fasting plasma glucose (FPG), TG, aspartate aminotransferase (AST) and HDL-C were measured by the standard automatic analyzer. Low-density lipoprotein cholesterol (LDL-C) concentration was calculated by a modified Friedewald equation.22 Non-HDL-C = TC - HDL-C.22
Definition of Diabetes
During the observation period, diabetes was defined as HbA1c ≥ 6.5%, FPG ≥ 7.0mmol/L, self-reported diabetes diagnosed by a physician, or having started diabetes medication.23
Statistical Analysis
The baseline characteristics of study participants were described below: According to the type of data distribution, continuous variables were summarized as median (quartile 1-quartile 3) or mean ± standard deviation, and categorical variables were described as n (%). Differences between baseline data were assessed using the Mann–Whitney test, Chi-square test or t-test.
To understand the relationship between diabetes and NHHR, we constructed 4 Cox proportional hazard regression models based on varying degrees of adjustment, and calculated the hazard ratio (HR) and 95% confidence interval (CI) of NHHR corresponding to diabetes risk.24 All the covariates adjusted in the model have passed the collinearity test (Supplementary Table 1),25 in which model 1 adjusted BMI, sex and age. Model 2 further adjusted the related variables of glucose and lipid metabolism on the basis of model 1. Model 3 further adjusted the related variables of liver enzyme metabolism based on model 2. Model 4 was a fully adjusted model in which all non-collinear covariates were regarded as confounding factors. To further test the stability of the main analysis results, we performed six sensitivity analyses:26 (1) To avoid confusion in the prediction of diabetes caused by lipid abnormalities due to baseline fatty liver, we excluded people with baseline fatty liver. (2) In an effort to reduce the effect of exercise as an intervention on blood lipids, we limited the study population to those who were not exercising. (3) Considering that the incidence of diabetes is closely related to the higher age, we further verified the predictive value of NHHR in the risk of diabetes in young and middle-aged people. (4) With the intention of verifying the stability of this conclusion in non-hypertensive people, we excluded people with baseline hypertension. (5 and 6) Obesity is an important risk factor for dyslipidemia and diabetes. In order to verify the association between NHHR and diabetes in non-obese people, we limited the study population to non-central obesity or BMI less than 25 kg/m2 in the new analysis.
We also used a restricted cubic spline (RCS) of 5 knots at the 5th, 35th, 50th, 65th, and 95th percentiles to flexibly model the association of NHHR with diabetes and preliminarily assess the threshold of NHHR for predicting the risk of diabetes.
To further evaluate the value of NHHR in predicting diabetes, we constructed a receiver operating characteristic (ROC) curve to evaluate the predictive ability of NHHR and other lipid parameters to the future occurrence of diabetes, and compared the difference in area under the curve with different parameters by DeLong test.27
Analyses were performed in Empower Stats (R) version 2.0. and R software version 3.4.3. All P values are 2-sided and a P value of <0.05 was considered statistically significant.
Results
A total of 15,464 healthy adults with normal baseline glucose were included in the study (mean age was 43.71 years, and 54.51% were men). During a mean observation period of 6.13 years, diabetes was diagnosed in 373 participants (286 men and 87 women), with an incidence of 2.41%. Table 1 summarizes the general characteristics of participants’ initial registration physical examination information based on whether diabetes was diagnosed during the follow-up. It can be seen that in people with diabetes, their age, ALT, TG, weight, non-HDL-C, WC, HbA1c, GGT, BMI, NHHR, AST, TC, FPG and blood pressure levels were significantly higher at the time of early physical examination (all P < 0.05). Additionally, this group of people was significantly more likely to have fatty liver and to continue smoking and drinking, while fewer people had exercise habits.
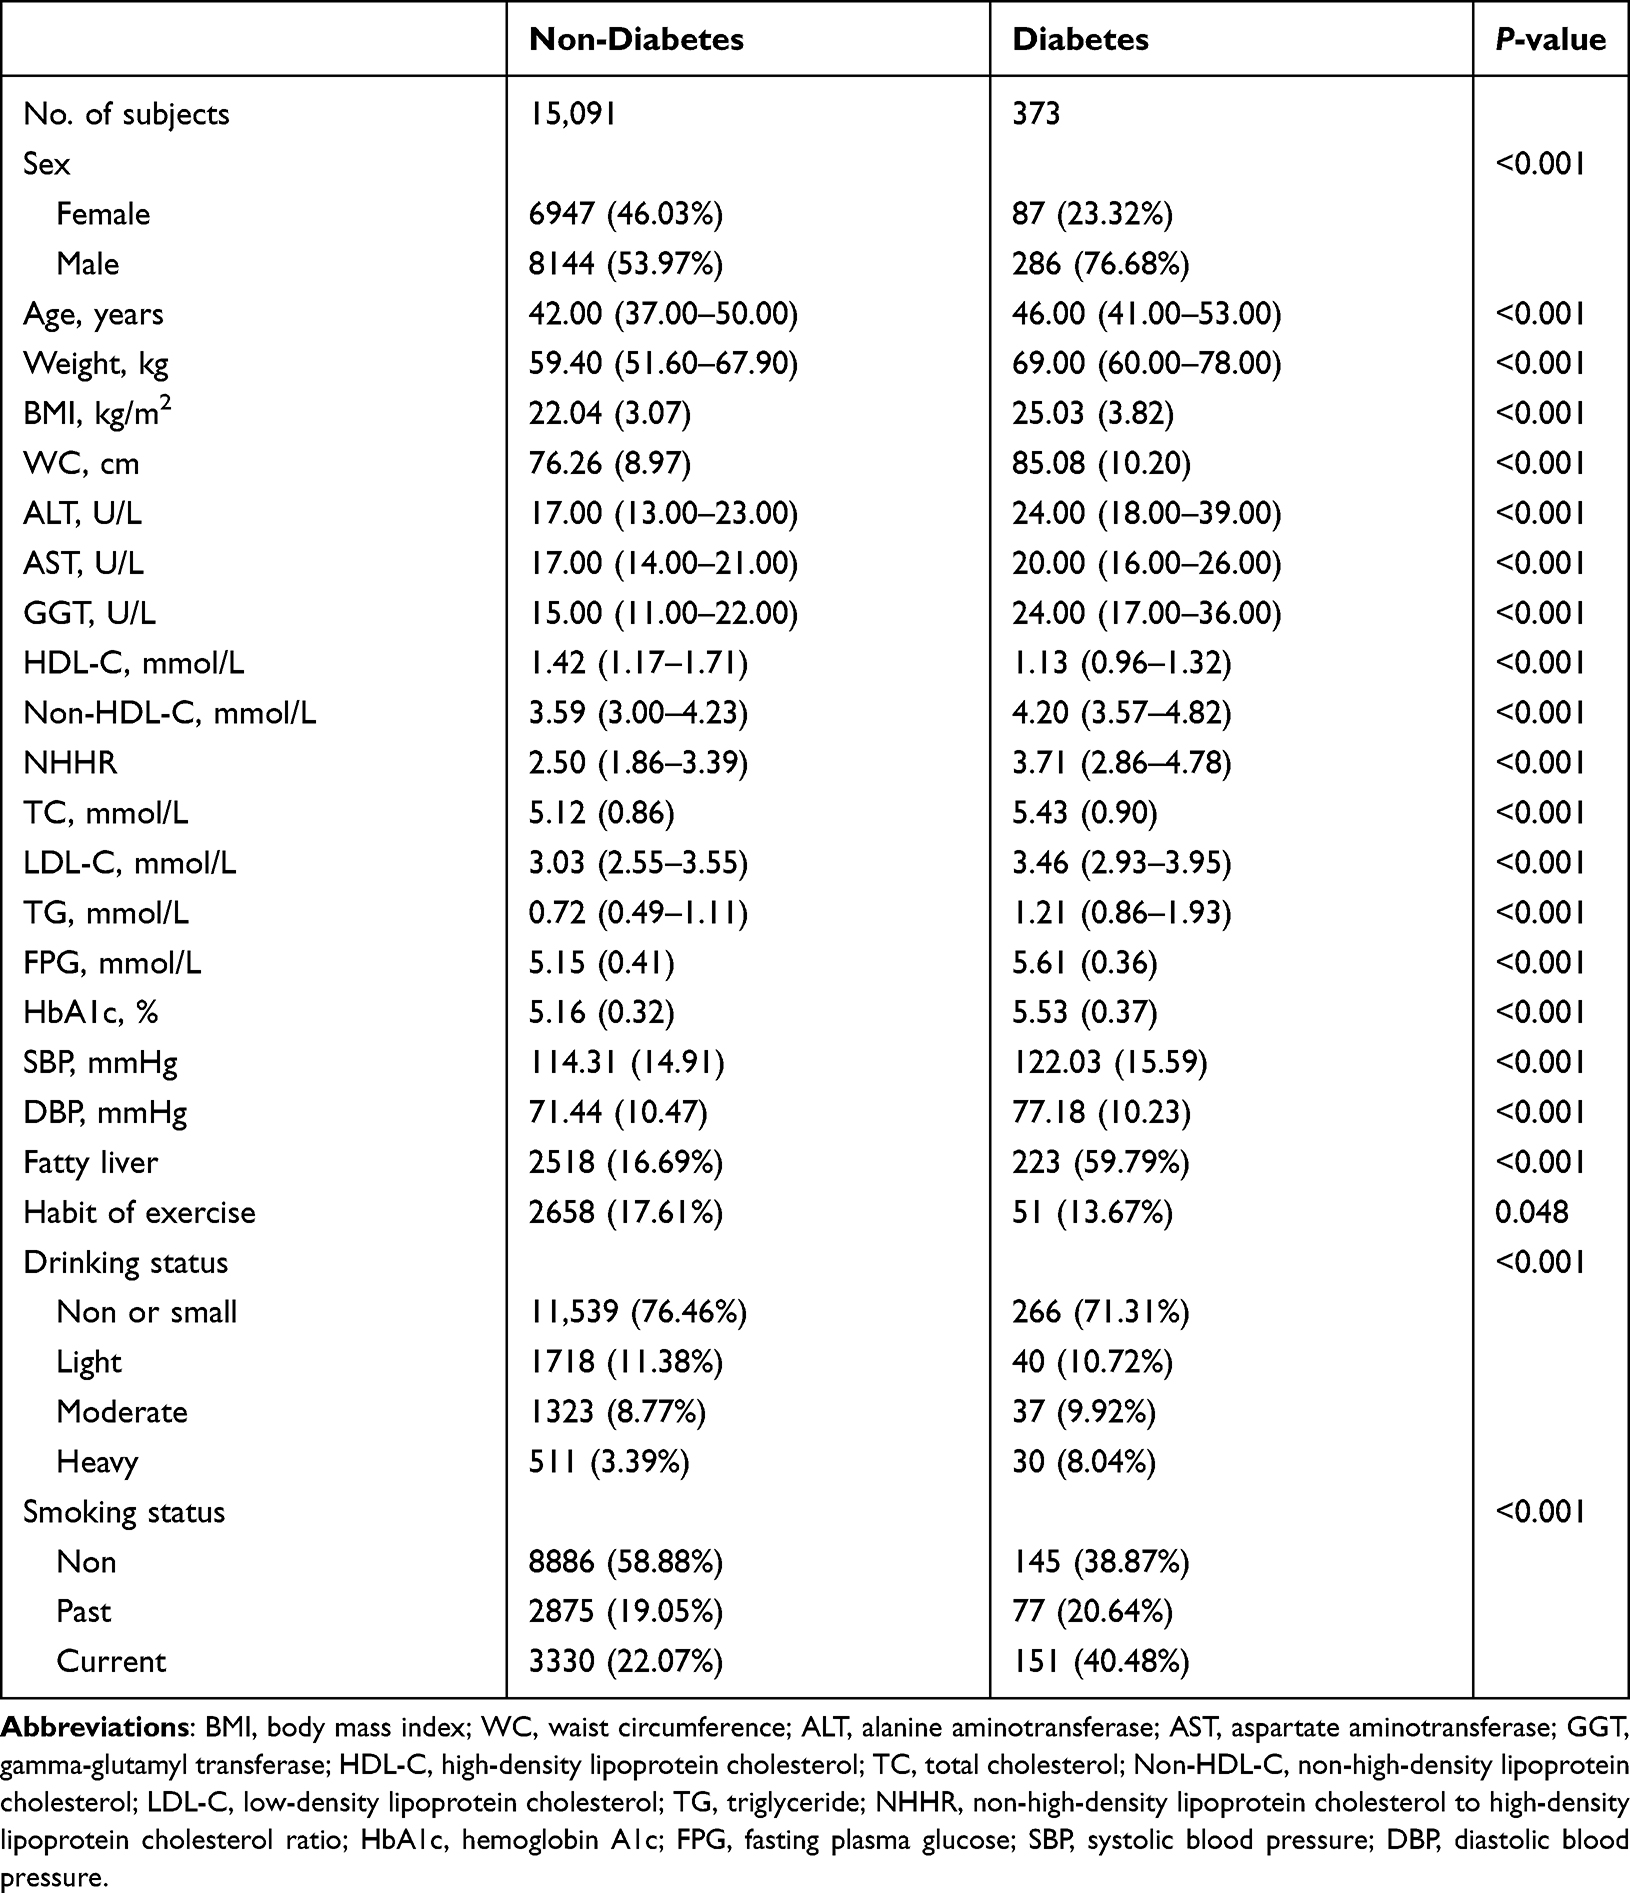 |
Table 1 Baseline Characteristics of Diabetes and Non-Diabetes Groups |
Table 2 shows the relationship of NHHR with new-onset diabetes in the general population. It can be seen that from the unadjusted model to the fully adjusted model, NHHR has always maintained a positive correlation with diabetes. In the fully adjusted model (Model 4), the risk of developing diabetes increased by 18% (95% CI: 1.07–1.30) for each 1 unit increase in NHHR. Further sensitivity analysis showed that the positive correlation between NHHR and new-onset diabetes was stable in people without fatty liver, people without exercise habits, young and middle-aged people, people with normal blood pressure, people without central obesity and non-obese people. In summary, NHHR was a stable independent predictor of emerging diabetes.
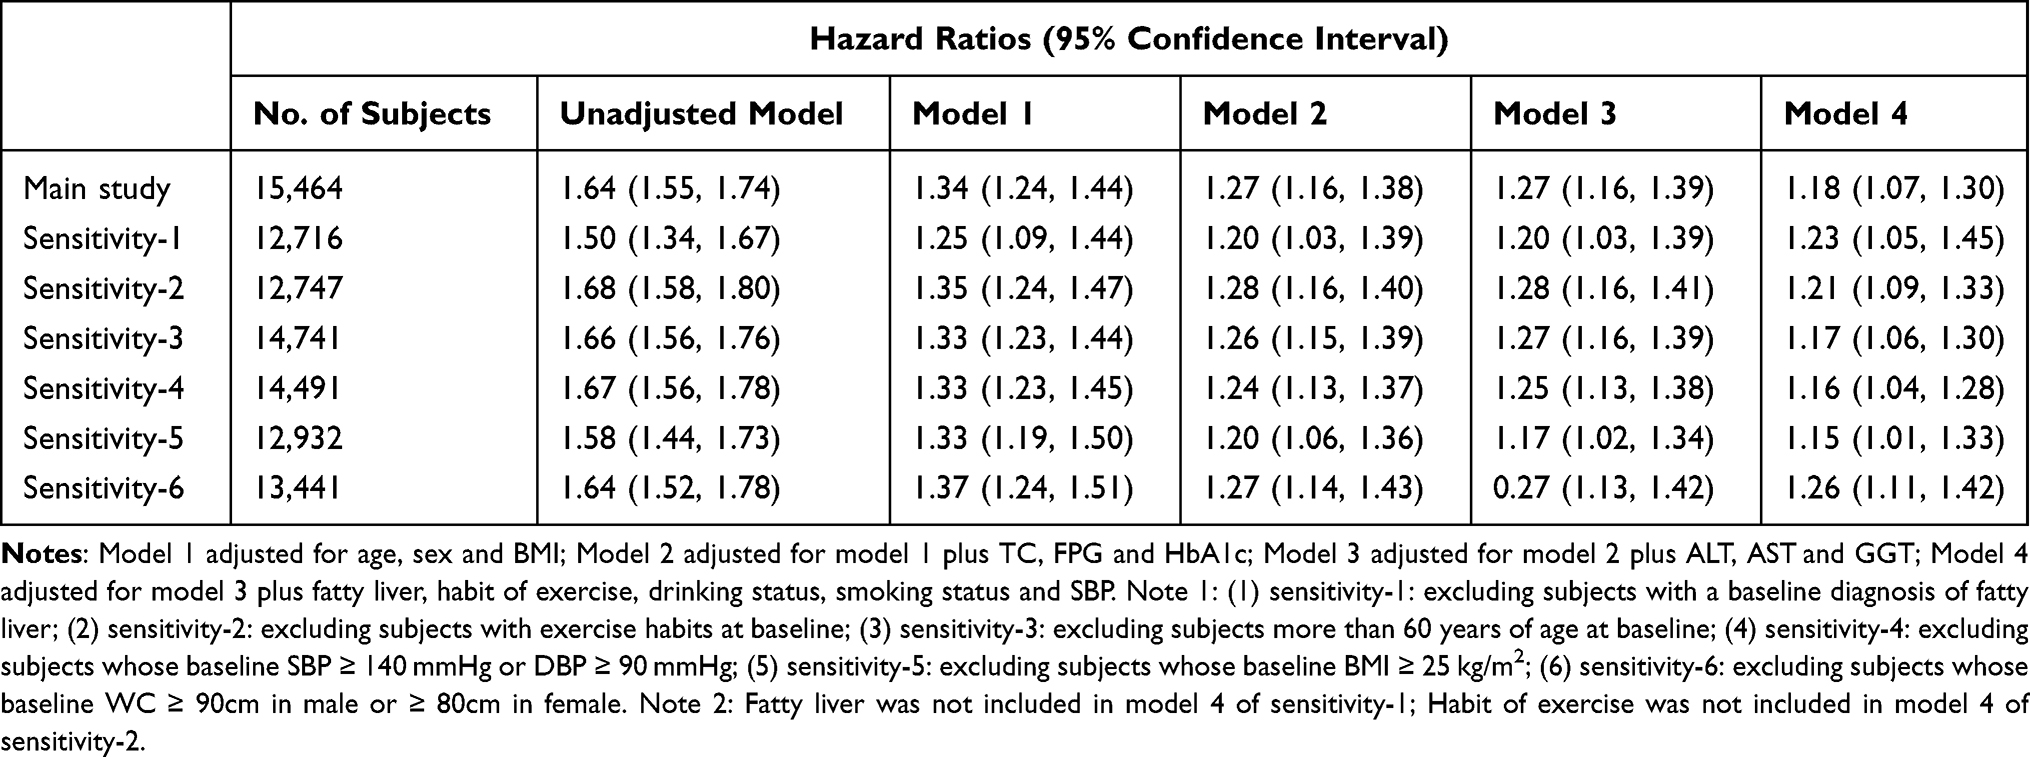 |
Table 2 Cox Regression Analyses for the Association Between the Non-High-Density Lipoprotein Cholesterol to High-Density Lipoprotein Cholesterol Ratio and Incident Diabetes in Different Models |
To detect any possible linear or non-linear dependence in the regression model, we also used 5-knots RCS to study the shape of the dose–response relationship between NHHR and diabetes risk. As can be seen in Figure 1, the correlation between NHHR and diabetes risk was not a one-way linear relationship, and we found that when NHHR was about 2.74, the HR corresponding to the risk of diabetes was about 1; when NHHR was greater than 2.74, the risk of diabetes increased gradually.
 |
Figure 1 Hazard ratios (95% confidence intervals) for the non-linear relationship between NHHR and the risk of diabetes. Abbreviation: NHHR, non-high-density lipoprotein cholesterol to high-density lipoprotein cholesterol ratio. |
Using ROC curve analysis, we assessed the accuracy of NHHR and other conventional lipid parameters for predicting future diabetes events (Table 3). As shown in Figure 2, NHHR showed moderate accuracy in predicting future diabetes events in the general population, and NHHR was a better lipid-related parameter for predicting diabetes risk than conventional lipid parameters (all DeLong P < 0.05). Also, to be mentioned that in the ROC analysis, we determined that the optimal threshold for predicting diabetes risk by NHHR was 2.7367, a finding similar to the threshold estimated in the RCS regression analysis.
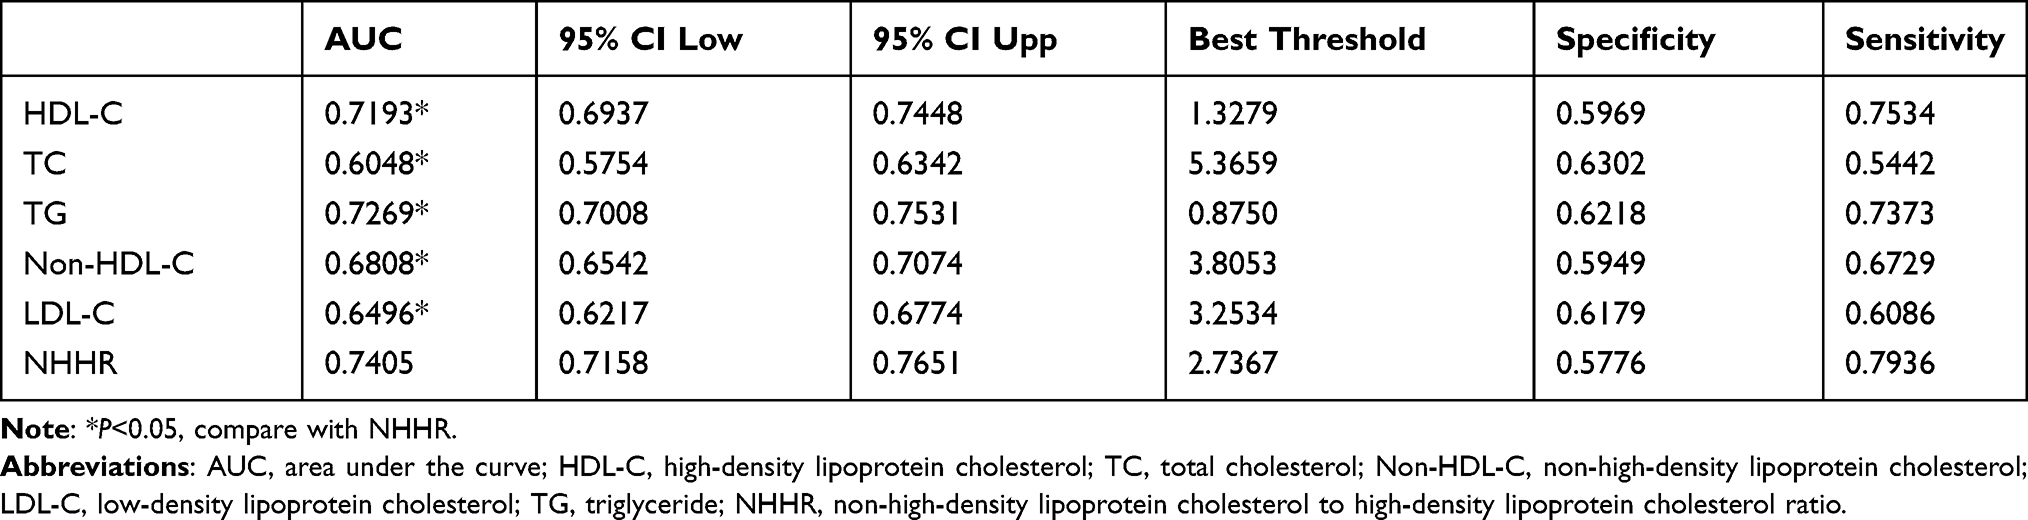 |
Table 3 Areas Under the Receiver Operating Characteristic Curves for Each Lipid Parameter in Identifying Diabetes |
 |
Figure 2 Receiver operating characteristic curve analysis of diabetes-related lipid parameters. Abbreviations: NHHR, non-high-density lipoprotein cholesterol to high-density lipoprotein cholesterol ratio; HDL-C, high-density lipoprotein cholesterol; non-HDL-C, non-high-density lipoprotein cholesterol; TC, total cholesterol; TG, triglyceride; LDL-C, low-density lipoprotein cholesterol. |
Discussion
Our post-hoc analysis of the NAGALA longitudinal cohort dataset showed an independent positive correlation between NHHR and diabetes risk, and sensitivity analysis further suggested that such an independent positive correlation was stable ROC analysis results suggested that NHHR had better accuracy in predicting future diabetes risk than other conventional lipid parameters, and the optimal threshold of NHHR was calculated to be 2.7367. Additionally, we further found through RCS that NHHR was not a one-way linear relationship with diabetes; when NHHR was about 2.74, the HR of diabetes risk was about 1.
Atherosclerotic lipid abnormality is a very common metabolic disorder in patients with diabetes, and the prevalence rate is about 72–85%.28,29 These lipid abnormalities usually indicate an increased risk of cardiovascular disease in patients with diabetes.9 In addition, atherosclerotic lipid abnormalities (high non-HDL-C, TG level and low HDL-C level) are strong independent risk factors for developing diabetes in non-diabetic populations,10–12 and appropriate lipid-lowering treatment can effectively reduce the risk of diabetes.9,30 Recently, some studies have pointed out that the combination of non-HDL-C and HDL-C was significantly better than conventional lipid parameters in predicting atherosclerosis-related diseases.13–15 Given that NHHR contains all the information about atherogenic and anti-atherosclerotic lipid particles, this parameter may better represent the balance between atherogenic and anti-atherosclerotic lipoproteins. Additionally, in an observational study in South Korea, Kim et al also found that NHHR also has good diagnostic performance in identifying insulin resistance.18 These findings strongly suggested that NHHR may be used not only to assess the risk of atherosclerosis but also to assess the risk of glucose metabolic disorders.
Although the relationship of NHHR with vascular disease has been fully studied,10–12 the data on the association of NHHR with diabetes is limited. In this study, we found that NHHR was an independent risk factor for diabetes, a finding that is similar to several previous studies.31–33 It is worth mentioning that in a recent study by Han et al, they also found that the dynamic changes of NHHR were also closely related to diabetes,33 suggesting that NHHR may be a relatively stable indicator for assessing the risk of diabetes. To further verify the stability of the relationship of NHHR with diabetes, six sensitivity analyses were performed in the present study, and the results showed that the relationship of NHHR with diabetes remained stable in different populations.
To further explore the value and optimal threshold of NHHR in predicting diabetes, we also constructed the ROC curve and RCS regression model. The results showed that NHHR was more accurate in predicting the future risk of diabetes than other conventional lipid parameters, and 2.74 may be a potential intervention threshold for diabetes risk. As far as we know, this study proved for the first time that the accuracy of NHHR in predicting the risk of diabetes was better than other lipid parameters, and the optimal threshold of NHHR for predicting the risk of diabetes was determined for the first time by RCS regression model and ROC analysis.
Diabetes is one of the most common chronic diseases in the world, and its prevalence is increasing rapidly due to significant lifestyle changes and an aging population.1,34,35 It is estimated that the number of people suffering from diabetes worldwide is about 463 million, and 60% of them live in Asia.3,36 Therefore, it is necessary to identify the risk of diabetes through reliable markers at an early stage. It is very easy to obtain serum lipid parameters in the clinic, and calculating NHHR is also relatively simple.22 Considering that this parameter was superior to other lipid parameters in predicting future diabetes risk and had high accuracy, we suggest that more attention should be paid to the evaluation of NHHR, and that NHHR should be directly displayed in the biochemical analysis report like other lipid parameters.
The current study has some limitations: (1) Due to the difficulty of conducting oral glucose tolerance tests widely in the general population, a 2-hour oral glucose tolerance test was not performed in this study to detect diabetes cases, which may have led to an underestimate of the actual incidence of diabetes.37 However, from the perspective of the reverse argument, the independent positive correlation between diabetes and NHHR was still stable after strict statistical adjustment in the case of lower incidence, which further suggested that the relationship between the two was very stable and credible. (2) Type of diabetes was not distinguished in the current study, which may limit the extrapolation of the results. However, based on previous epidemiological studies, the current findings may be more applicable to patients with type 2 diabetes, since the prevalence of type 1 diabetes is extremely low.38 (3) Admittedly, there were still some covariables that have not been recorded or measured in the dataset of this study, so the possibility of unmeasured or unknown confounders cannot be completely excluded. (4) This study mainly analyzed the predictive value of baseline NHHR recorded during the initial physical examination for future diabetes events. However, it is not clear whether the dynamic change of NHHR during follow-up is better than NHHR alone at baseline. To be sure, the single lipid measurement information recorded for the first physical examination has a good predictive value for assessing the risk of future diabetic events, and is acceptable from an economic point of view. (5) The current research population is mainly Japanese, so the results of this study should be used cautiously in other races, and more studies from different races are needed.
In addition to the limitations, there are several advantages worth mentioning in the current research: (1) This study confirmed for the first time that NHHR was superior to other conventional lipid parameters in predicting the risk of diabetes. (2) For the first time, this study found that the association between NHHR and the risk of diabetes was non-linear, and NHHR was about 2.74 may be the best threshold for assessing diabetes risk. (3) The sample size of this study is larger than that of similar studies, and the follow-up time is longer. Further sensitivity analysis suggested that the independent positive correlation between NHHR and diabetes risk has good stability.
Conclusion
In conclusion, the current study has found that NHHR was a stable independent predictor of future diabetes events, and that NHHR was more accurate in predicting future diabetes risk than other conventional lipid parameters. Additionally, it is worth noting that 2.74 may be the optimal threshold for NHHR to assess the risk of diabetes. Our study provides useful evidence for primary prevention in patients with a high risk of diabetes, and it may be of great significance to include NHHR in the assessment of diabetes risk in the clinic.
Abbreviations
non-HDL-C/HDL-C, Non-high-density lipoprotein cholesterol to high-density lipoprotein cholesterol ratio; RCS, restricted cubic spline; ROC, receiver operating characteristic curve; IDF, International Diabetes Federation; HDL-C, high-density lipoprotein cholesterol; non-HDL-C, non-high-density lipoprotein cholesterol; TG, triglycerides; NAFLD, nonalcoholic fatty liver disease; WC, waist circumference; BMI, body mass index; AST, aspartate aminotransferase; FPG, fasting plasma glucose; TC, total cholesterol; GGT, gamma-glutamyl transferase; HbA1c, hemoglobin A1c; ALT, alanine aminotransferase; LDL-C, low-density lipid cholesterol; HR, hazard ratio; CI, confidence interval.
Data Sharing Statement
The datasets that support the conclusions of this article can be found in the Dryad repository (https://doi.org/10.5061/dryad.1n6c4).
Ethics Approval and Informed Consent
Informed consent for the use of study data has been authorized by the participants in previous studies, and the initial study protocol was approved by the Ethics Committee of Murakami Memorial Hospital.19 As a post-hoc analysis of the NAGALA cohort study, the institutional Ethics Committee of Jiangxi Provincial People’s Hospital reviewed the current research scheme and exempted the need for repeated ethical approval and informed consent (review No: 2021-066).
Ethics Statement
We confirm that the data accessed in this study complies with relevant data protection and privacy legislation.
Acknowledgments
We sincerely thank the teachers of the Jiangxi Cardiovascular Research Institute for their help with the study.
Author Contributions
All authors made a significant contribution to the work reported, whether that is in the conception, study design, execution, acquisition of data, analysis and interpretation, or in all these areas; took part in drafting, revising or critically reviewing the article; gave final approval of the version to be published; have agreed on the journal to which the article has been submitted; and agree to be accountable for all aspects of the work.
Funding
This study was funded by the Natural Science Foundation of Jiangxi Province [No. 20192BAB205007].
Disclosure
The authors report no conflicts of interest in this work.
References
1. Chan JC, Malik V, Jia W, et al. Diabetes in Asia: epidemiology, risk factors, and pathophysiology. JAMA. 2009;301(20):2129–2140. doi:10.1001/jama.2009.726
2. Skyler JS, Bakris GL, Bonifacio E, et al. Differentiation of diabetes by pathophysiology, natural history, and prognosis. Diabetes. 2017;66(2):241–255. doi:10.2337/db16-0806
3. Saeedi P, Petersohn I, Salpea P, et al. Global and regional diabetes prevalence estimates for 2019 and projections for 2030 and 2045: results from the international diabetes federation diabetes Atlas, 9th edition. Diabetes Res Clin Pract. 2019;157:107843. doi:10.1016/j.diabres.2019.107843
4. International Diabetes Federation. IDF Diabetes Atlas.
5. Strain WD, Paldánius PM. Diabetes, cardiovascular disease and the microcirculation. Cardiovasc Diabetol. 2018;17:57. doi:10.1186/s12933-018-0703-2
6. Suh S, Kim KW. Diabetes and cancer: cancer should be screened in routine diabetes assessment. Diabetes Metab J. 2019;43(6):733–743. doi:10.4093/dmj.2019.0177
7. GBD 2017 Disease and Injury Incidence and Prevalence Collaborators. Global, regional, and national incidence, prevalence, and years lived with disability for 354 diseases and injuries for 195 countries and territories, 1990–2017: a systematic analysis for the global burden of disease study 2017. Lancet. 2018;392(10159):1789–1858. doi:10.1016/S0140-6736(18)32279-7
8. Lin X, Xu Y, Pan X, et al. Global, regional, and national burden and trend of diabetes in 195 countries and territories: an analysis from 1990 to 2025. Sci Rep. 2020;10(1):14790. doi:10.1038/s41598-020-71908-9
9. Taskinen MR. Diabetic dyslipidaemia: from basic research to clinical practice. Diabetologia. 2003;46(6):733–749. doi:10.1007/s00125-003-1111-y
10. Ley SH, Harris SB, Connelly PW, et al. Utility of non-high-density lipoprotein cholesterol in assessing incident type 2 diabetes risk. Diabetes Obes Metab. 2012;14(9):821–825. doi:10.1111/j.1463-1326.2012.01607.x
11. Wu L, Parhofer KG. Diabetic dyslipidemia. Metabolism. 2014;63(12):1469–1479. doi:10.1016/j.metabol.2014.08.010
12. Xie G, Zhong Y, Yang S, Zou Y. Remnant cholesterol is an independent predictor of new-onset diabetes: a single-center cohort study. Diabetes Metab Syndr Obes. 2021;14:4735–4745. doi:10.2147/DMSO.S341285
13. Zhu L, Lu Z, Zhu L, et al. Lipoprotein ratios are better than conventional lipid parameters in predicting coronary heart disease in Chinese Han people. Kardiol Pol. 2015;73(10):931–938. doi:10.5603/KP.a2015.0086
14. Yang WS, Li R, Shen YQ, et al. Importance of lipid ratios for predicting intracranial atherosclerotic stenosis. Lipids Health Dis. 2020;19(1):160. doi:10.1186/s12944-020-01336-1
15. Wen J, Zhong Y, Kuang C, Liao J, Chen Z, Yang Q. Lipoprotein ratios are better than conventional lipid parameters in predicting arterial stiffness in young men. J Clin Hypertens. 2017;19(8):771–776. doi:10.1111/jch.13038
16. Wang D, Wang L, Wang Z, Chen S, Ni Y, Jiang D. Higher non-HDL-cholesterol to HDL-cholesterol ratio linked with increased nonalcoholic steatohepatitis. Lipids Health Dis. 2018;17(1):67. doi:10.1186/s12944-018-0720-x
17. Zuo PY, Chen XL, Liu YW, Zhang R, He XX, Liu CY. Non-HDL-cholesterol to HDL-cholesterol ratio as an independent risk factor for the development of chronic kidney disease. Nutr Metab Cardiovasc Dis. 2015;25(6):582–587. doi:10.1016/j.numecd.2015.03.003
18. Kim SW, Jee JH, Kim HJ, et al. Non-HDL-cholesterol/HDL-cholesterol is a better predictor of metabolic syndrome and insulin resistance than apolipoprotein B/apolipoprotein A1. Int J Cardiol. 2013;168(3):2678–2683. doi:10.1016/j.ijcard.2013.03.027
19. Okamura T, Hashimoto Y, Hamaguchi M, Obora A, Kojima T, Fukui M. Data from: Ectopic fat obesity presents the greatest risk for incident type 2 diabetes: a population-based longitudinal study, Dryad, Dataset. Int J Obes. 2019;43(1):139–148. https://doi.org/10.5061/dryad.8q0p192
20. Hashimoto Y, Hamaguchi M, Kojima T, et al. Modest alcohol consumption reduces the incidence of fatty liver in men: a population-based large-scale cohort study. J Gastroenterol Hepatol. 2015;30(3):546–552. doi:10.1111/jgh.12786
21. Hamaguchi M, Kojima T, Itoh Y, et al. The severity of ultrasonographic findings in nonalcoholic fatty liver disease reflects the metabolic syndrome and visceral fat accumulation. Am J Gastroenterol Am J Gastroenterol. 2007;102(12):2708–2715. doi:10.1111/j.1572-0241.2007.01526.x
22. Chen Y, Zhang X, Pan B, et al. A modified formula for calculating low-density lipoprotein cholesterol values. Lipids Health Dis. 2010;9:52. doi:10.1186/1476-511X-9-52
23. American Diabetes Association. Standards of medical care in diabetes–2011. Diabetes Care. 2011;34(Suppl 1)):S11–S61. doi:10.2337/dc11-S011
24. Fitchett EJA, Seale AC, Vergnano S, et al. Strengthening the reporting of observational studies in epidemiology for newborn infection (STROBE-NI): an extension of the STROBE statement for neonatal infection research. Lancet Infect Dis. 2016;16(10):e202–e213. doi:10.1016/S1473-3099(16)30082-2
25. Wax Y. Collinearity diagnosis for a relative risk regression analysis: an application to assessment of diet-cancer relationship in epidemiological studies. Stat Med. 1992;11(10):1273–1287. doi:10.1002/sim.4780111003
26. Misra A, Vikram NK, Gupta R, Pandey RM, Wasir JS, Gupta VP. Waist circumference cutoff points and action levels for Asian Indians for identification of abdominal obesity. Int J Obes. 2006;30(1):106–111. doi:10.1038/sj.ijo.0803111
27. DeLong ER, DeLong DM, Clarke-Pearson DL, DeLong ER, DeLong DM, Clarke-Pearson DL. Comparing the areas under two or more correlated receiver operating characteristic curves: a nonparametric approach. Biometrics. 1988;44(3):837–845.
28. Turner RC, Millns H, Neil HA, et al. Risk factors for coronary artery disease in non-insulin dependent diabetes mellitus: United Kingdom Prospective Diabetes Study (UKPDS: 23). BMJ. 1998;316(7134):823–828. doi:10.1136/bmj.316.7134.823
29. Doucet J, Le Floch JP, Bauduceau B, Verny C; SFD/SFGG Intergroup. GERODIAB: glycaemic control and 5-year morbidity/mortality of type 2 diabetic patients aged 70 years and older: 1. Description of the population at inclusion. Diabetes Metab. 2012;38(6):523–530. doi:10.1016/j.diabet.2012.07.001
30. Axsom K, Berger JS, Schwartzbard AZ. Statins and diabetes: the good, the bad, and the unknown. Curr Atheroscler Rep. 2013;15(2):299. doi:10.1007/s11883-012-0299-z
31. Lin D, Qi Y, Huang C, et al. Associations of lipid parameters with insulin resistance and diabetes: a population-based study. Clin Nutr. 2018;37(4):1423–1429. doi:10.1016/j.clnu.2017.06.018
32. Zhang N, Hu X, Zhang Q, et al. Non-high-density lipoprotein cholesterol: high-density lipoprotein cholesterol ratio is an independent risk factor for diabetes mellitus: results from a population-based cohort study. J Diabetes. 2018;10(9):708–714. doi:10.1111/1753-0407.12650
33. Han M, Li Q, Qie R, et al. Association of non-HDL-C/HDL-C ratio and its dynamic changes with incident type 2 diabetes mellitus: the Rural Chinese Cohort study. J Diabetes Complications. 2020;34(12):107712. doi:10.1016/j.jdiacomp.2020.107712
34. Caspersen CJ, Thomas GD, Boseman LA, Beckles GL, Albright AL. Aging, diabetes, and the public health system in the United States. Am J Public Health. 2012;102(8):1482–1497. doi:10.2105/AJPH.2011.300616
35. Pandey A, Chawla S, Guchhait P. Type-2 diabetes: current understanding and future perspectives. IUBMB Life. 2015;67(7):506–513. doi:10.1002/iub.1396
36. Nanditha A, Ma RC, Ramachandran A, et al. Diabetes in Asia and the pacific: implications for the global epidemic. Diabetes Care. 2016;39(3):472–485. doi:10.2337/dc15-1536
37. Mannucci E, Ognibene A, Sposato I, et al. Fasting plasma glucose and glycated haemoglobin in the screening of diabetes and impaired glucose tolerance. Acta Diabetol. 2003;40(4):181–186. doi:10.1007/s00592-003-0109-8
38. Neville SE, Boye KS, Montgomery WS, Iwamoto K, Okamura M, Hayes RP. Diabetes in Japan: a review of disease burden and approaches to treatment. Diabetes Metab Res Rev. 2009;25(8):705–716. doi:10.1002/dmrr.1012
 © 2022 The Author(s). This work is published and licensed by Dove Medical Press Limited. The
full terms of this license are available at https://www.dovepress.com/terms
and incorporate the Creative Commons Attribution
- Non Commercial (unported, 3.0) License.
By accessing the work you hereby accept the Terms. Non-commercial uses of the work are permitted
without any further permission from Dove Medical Press Limited, provided the work is properly
attributed. For permission for commercial use of this work, please see paragraphs 4.2 and 5 of our Terms.
© 2022 The Author(s). This work is published and licensed by Dove Medical Press Limited. The
full terms of this license are available at https://www.dovepress.com/terms
and incorporate the Creative Commons Attribution
- Non Commercial (unported, 3.0) License.
By accessing the work you hereby accept the Terms. Non-commercial uses of the work are permitted
without any further permission from Dove Medical Press Limited, provided the work is properly
attributed. For permission for commercial use of this work, please see paragraphs 4.2 and 5 of our Terms.