")
Back to Journals » Diabetes, Metabolic Syndrome and Obesity » Volume 15
Utility of Adipokines and IL-10 in Association with Anthropometry in Prediction of Insulin Resistance in Obese Children
Authors El Sehmawy AA , Diab FEA, Hassan DA, Mohammed DS, Gamal El Din Al Anany M, Eldesoky NA, Elamir RY
Received 9 June 2022
Accepted for publication 2 September 2022
Published 21 October 2022 Volume 2022:15 Pages 3231—3241
DOI https://doi.org/10.2147/DMSO.S377072
Checked for plagiarism Yes
Review by Single anonymous peer review
Peer reviewer comments 3
Editor who approved publication: Prof. Dr. Antonio Brunetti
Asmaa A El Sehmawy1 *, Fatma Elzhraa Ahmed Diab2 *, Donia Ahmed Hassan2 *, Doaa Sayed Mohammed3 *, Mona Gamal El Din Al Anany4 *, Noha A Eldesoky5 *, Reham Yousri Elamir6 *
1Pediatrics Department, Faculty of Medicine, Al-Azhar University, Cairo, Egypt; 2Clinical PAthology Department, Faculty of Medicine, Al-Azhar University, Cairo, Egypt; 3Endocrinology Department, Faculty of Medicine, Al-Azhar University, Cairo, Egypt; 4Physiology Department, Faculty of Medicine, Al-Azhar University, Cairo, Egypt; 5Biochemistry and Molecular Biology, Faculty of Pharmacy (Girls), Al-Azhar University, Cairo, Egypt; 6Public Health and COmmunity Medicine Department, Faculty of Medicine, Cairo University, Cairo, Egypt
*These authors contributed equally to this work
Correspondence: Asmaa A El Sehmawy, Al-Azhar University, Faculty of Medicine, Pediatric Department, Elbehira, Al-Khalifa -Elmamoon street, Cairo, Egypt, Tel +2 01063752905, Fax +0453407042, Email [email protected]
Aim: This is a case-controlled study, with two hundred children enrolled. They were divided into an obese group of 100 children who had BMI ≥ 95th percentile according to CDC criteria and a group of 100 children with normal weight. All enrolled children were subjected to detailed medical history and clinical examination, in addition to measuring fasting blood sugar, fasting serum insulin, HOMA-IR calculation, lipid profile analysis, total serum cholesterol, low- and high-density lipoproteins (LDL and HDL), and serum triglyceride (TG). Two adipokines (lipocalin-2 and adipsin) serum levels plus IL-10 serum level were assessed.
Results: Higher Z score of weight, MI, and waist/height ratio and high serum cholesterol, LDL, TG, and low HDL were observed in obese children. Higher levels of serum lipocalin-2 and adipsin and lower IL-10 blood level were observed in the obese group in comparison with the normal weight children. Higher insulin resistance index was observed in the obese group, with positive correlation of HOMA-IR with the anthropometric measurements and lipocalin serum level, while negative correlation was observed between IL-10 and fasting insulin in obese children.
Conclusion: Simple measurement of general and central adiposity markers and serum lipocalin-2 can predict insulin resistance in obese children while serum adipsin and IL-10 had no association with insulin resistance.
Keywords: adipokines, IL10, insulin resistance, obesity
Introduction
Obesity and overweight have become a serious global dietary concern in recent years, and they are now recognized as risk factors for developing the metabolic syndrome in both children and adults in both high- and low-income nations. Lack of physical exercise, consumption of high-calorie foods and sugary beverages, and a more sedentary lifestyle have all contributed to the rapid rise in obesity rates worldwide.1
During childhood and adolescence, obesity is a key risk factor for the development of insulin resistance. Insulin resistance is defined as a reduction in the capacity of insulin to increase glucose consumption by muscles and adipose tissue while suppressing hepatic glucose synthesis and output. It also accounts for insulin resistance in protein and lipid metabolism, as well as vascular endothelial function and gene expression. Insulin resistance could be owing to beta cell malfunction produced by ectopic fat deposition. However, beta cell dysfunction can occur before fasting glucose levels become compromised.2
Adipocytes perform a critical function in regulating metabolism and energy homeostasis as the endocrine organs. They have a relationship between normal immune system function and metabolism. Nevertheless, in obesity, their dysregulation contributes to chronic low-grade inflammation and disease pathology.3
Adipsin is produced primarily in adipose tissue, and it has a lipogenic property by activating alternative pathways of the complement through its unique factor D and inducing triglyceride synthesis and adipocyte differentiation.4
Adipocytes and immune cells including neutrophils and macrophages release lipocalin-2, which was first thought to have a function in innate immunity. Lipocalin-2 levels are linked to inflammatory markers such as high-sensitivity C-reactive protein. Lipocalin-2 has been thought to act as a potential link between obesity, inflammation, cardiovascular illness, and obesity-associated metabolic dysfunction, such as insulin resistance (IR).5
Insulin resistance can be caused by proinflammatory cytokines blocking insulin signal transduction in adipose tissue, skeletal muscle, and the liver. IL-10 is a key player in immune response regulation and inflammation control. IL-10 down regulates the inflammation via inhibiting the synthesis of proinflammatory cytokines including IL-12 and TNF-α or via physical interactions with T lymphocytes and enhances regulatory T cell function; it also promotes activation and proliferation of CD8+ T cells, NK cells, mast cells and B cells.6
The down regulation of reactive oxygen and nitrogen intermediates, the regulation of antigen presentation capacity and immunological tolerance, and the suppression of proliferative and cytotoxic T cell responses are all significant functions of IL-10.6
Th17 cells have been identified as the IL-10 cellular source. In various metabolic organs, Th17 cells are expected to play a substantial role in the propagation of inflammation and immune metabolism, which can be easily altered with a hyper caloric diet that increases the enrichment of pathogenic Th17 cells.7
The present work aimed to assess the levels of serum adipsin and lipocalin-2 in addition to serum level of IL-10 in obese children and their relation to insulin resistance in those children.
Subjects and Methods
Participants
A case-control study was conducted on 200 Egyptian children who were chosen randomly from Al-Azhar University Hospital during the period from August 2021 to May 2022. According to the Centers for Disease Control and Prevention (CDC)8 standards, children were divided into two groups based on their BMI percentile. One hundred children with BMI ≥ 95th percentile (obesity group) were compared to 100 children with BMI ≥5th and <85th percentiles (control group). Age and sex were matched to the obese group. Children with chronic diseases, congenital anomalies, or genetic diseases were excluded from the study.
Sample Size
Based on evidence from Hung et al9 and by considering the mean IL10 comparison between normal and severely obese children as primary outcome measure, G Power program 3.1.9.4 was used to calculate the sample size with independent t test comparison between the two groups. Assuming 80% power, effect size is mean difference 0.4, 0.05 level of significance and median and IQR of IL10 was 6.14 (1.23–8.66) in normal weight and 11.67 (2.23–25.67) in obese children and after transformation of median and IQR to mean and SD and with ratio of 1:1. The minimum required sample size to detect statistical significance difference will be = 186 participants (93 in each group); as this is the minimum required number needed for this study, so the researcher decides to include 100 in each group of the study.
Design
During a hospital visit, participants were assessed for family medical history, dietary history, medication usage, and demographic information. Physical examinations, including height and weight measures, as well as BMI (body mass index), were also required.
For weight measurement, after emptying the urine and gastrointestinal systems, the body weight was measured on a Seca scale to the nearest 0.1 kg, with the children barefoot and in light clothing (Seca Model 770, Hamburg, Germany). Waist circumference was measured using a plastic tape wrapped around the body in a horizontal position. It was measured midway between the lower rib edge and the iliac crest.
Blood Pressure Measurements
A mercury sphygmomanometer with an adequate cuff size was utilized for measuring systolic and diastolic blood pressure readings, with the patient sitting in the proper position. Three measurements were taken from all the participants at 2 min intervals, and the average of the last two measurements was recorded. According to the American Academy of Pediatrics for SBP and DBP in the pediatric population, values >95th percentile are considered elevated.10
Laboratory Analysis
Blood sample was obtained after fasting for 10 hours in order to measure fasting blood sugar (FBS), lipid profile, uric acid, adipsin, lipocalin-2, IL-10, fasting insulin and HOMA-IR.
Six mL of venous blood was withdrawn and divided into two serum-separator tubes and centrifuged at 3500 rpm for 10 min. 3 mL serum was used for the measurement of fasting blood glucose, total cholesterol, triglycerides, high-density lipoprotein (HDL), low-density lipoprotein (LDL), and uric acid. The remaining three mL serum was frozen at −20°C for analyzing adipsin, lipocalin-2, IL-10, and fasting insulin. Measurement of lipid profile and uric acid were performed using Cobas C311 (Germany) and kits of Roche (Germany). The following measures were considered lipid profile abnormalities: total cholesterol ≥170 mg/dL, LDL-C ≥130 mg/dL, HDL-C ≤45 mg/dL, and triglycerides ≥130 mg/dL.11
Measurement of Serum Adipsin, Lipocalin-2, and IL-10
Measurement was done through the use of the quantitative double-antibody sandwich ELISA kit, supplied by Sun Red Biotechnology Company, Shanghai, with lot no. 202201. ELISA reader 1851 Das: Italy and Bio Tek: USA washer was used. The assay range was 0.5–100 ng/mL, 12–3000 ng/mL, and 0.10–3000 pg/mL for Adipsin, lipocalin-2, and IL-10, respectively.
Measurement of Serum Fasting Insulin and Calculation of HOMA-IR
Measurement of serum fasting insulin was conducted through the use of the quantitative double-antibody sandwich ELISA kit, supplied by DiaMetra Company, Italy, with lot no. 5626A. ELISA reader 1851 Das: Italy and Bio Tek: USA washer were used. The assay range was 3–200 IU/mL.
HOMA-IR was calculated using fasting blood sugar and fasting insulin through the following formula: HOMA-IR = FBS × fasting insulin ⁄ 405.12
Ethical Approval
The parents of each child signed a written informed consent form. Approval to the study protocol was obtained from the Local Ethics Committee at Al-Azhar University, Faculty of Medicine for Girls (council number 202,106,969). All procedures were carried out in line with the Helsinki Declaration.
Statistical Analysis
Data were collected, revised, coded and entered to the Statistical Package for Social Science (Released 2015. IBM SPSS Statistics for Windows, Version 23.0. Armonk, New York: IBM Corporation). The normality of distribution of quantitative parameters was assessed using Kolmogorov–Smirnov test. The quantitative data were presented as mean, standard deviations and ranges when parametric and median, inter-quartile range (IQR) when data found non-parametric. Also, qualitative variables were presented as number and percentages. The comparison between groups with qualitative data was done by using Chi-square test. The comparison between two groups with quantitative data and parametric distribution was done by using independent t-test while the comparison between two groups with quantitative data and non-parametric distribution was done by using Mann–Whitney test. Receiver operating characteristic curve (ROC) was used to assess the best cut-off point with its sensitivity, specificity, positive predictive value (PPV), negative predictive value (NPV) and area under curve (AUC). The confidence interval was set to 95% and the margin of error accepted was set to 5%. So, the p-value was considered significant at the level of <0.05.
Results
The descriptive statistics of the study groups are illustrated in Table 1. Both groups were matched for the mean of both age and gender with significant increase in BMI Z score, waist circumference, and waist/height ratio in obese children. 84% of them had waist circumference above 90th centile.
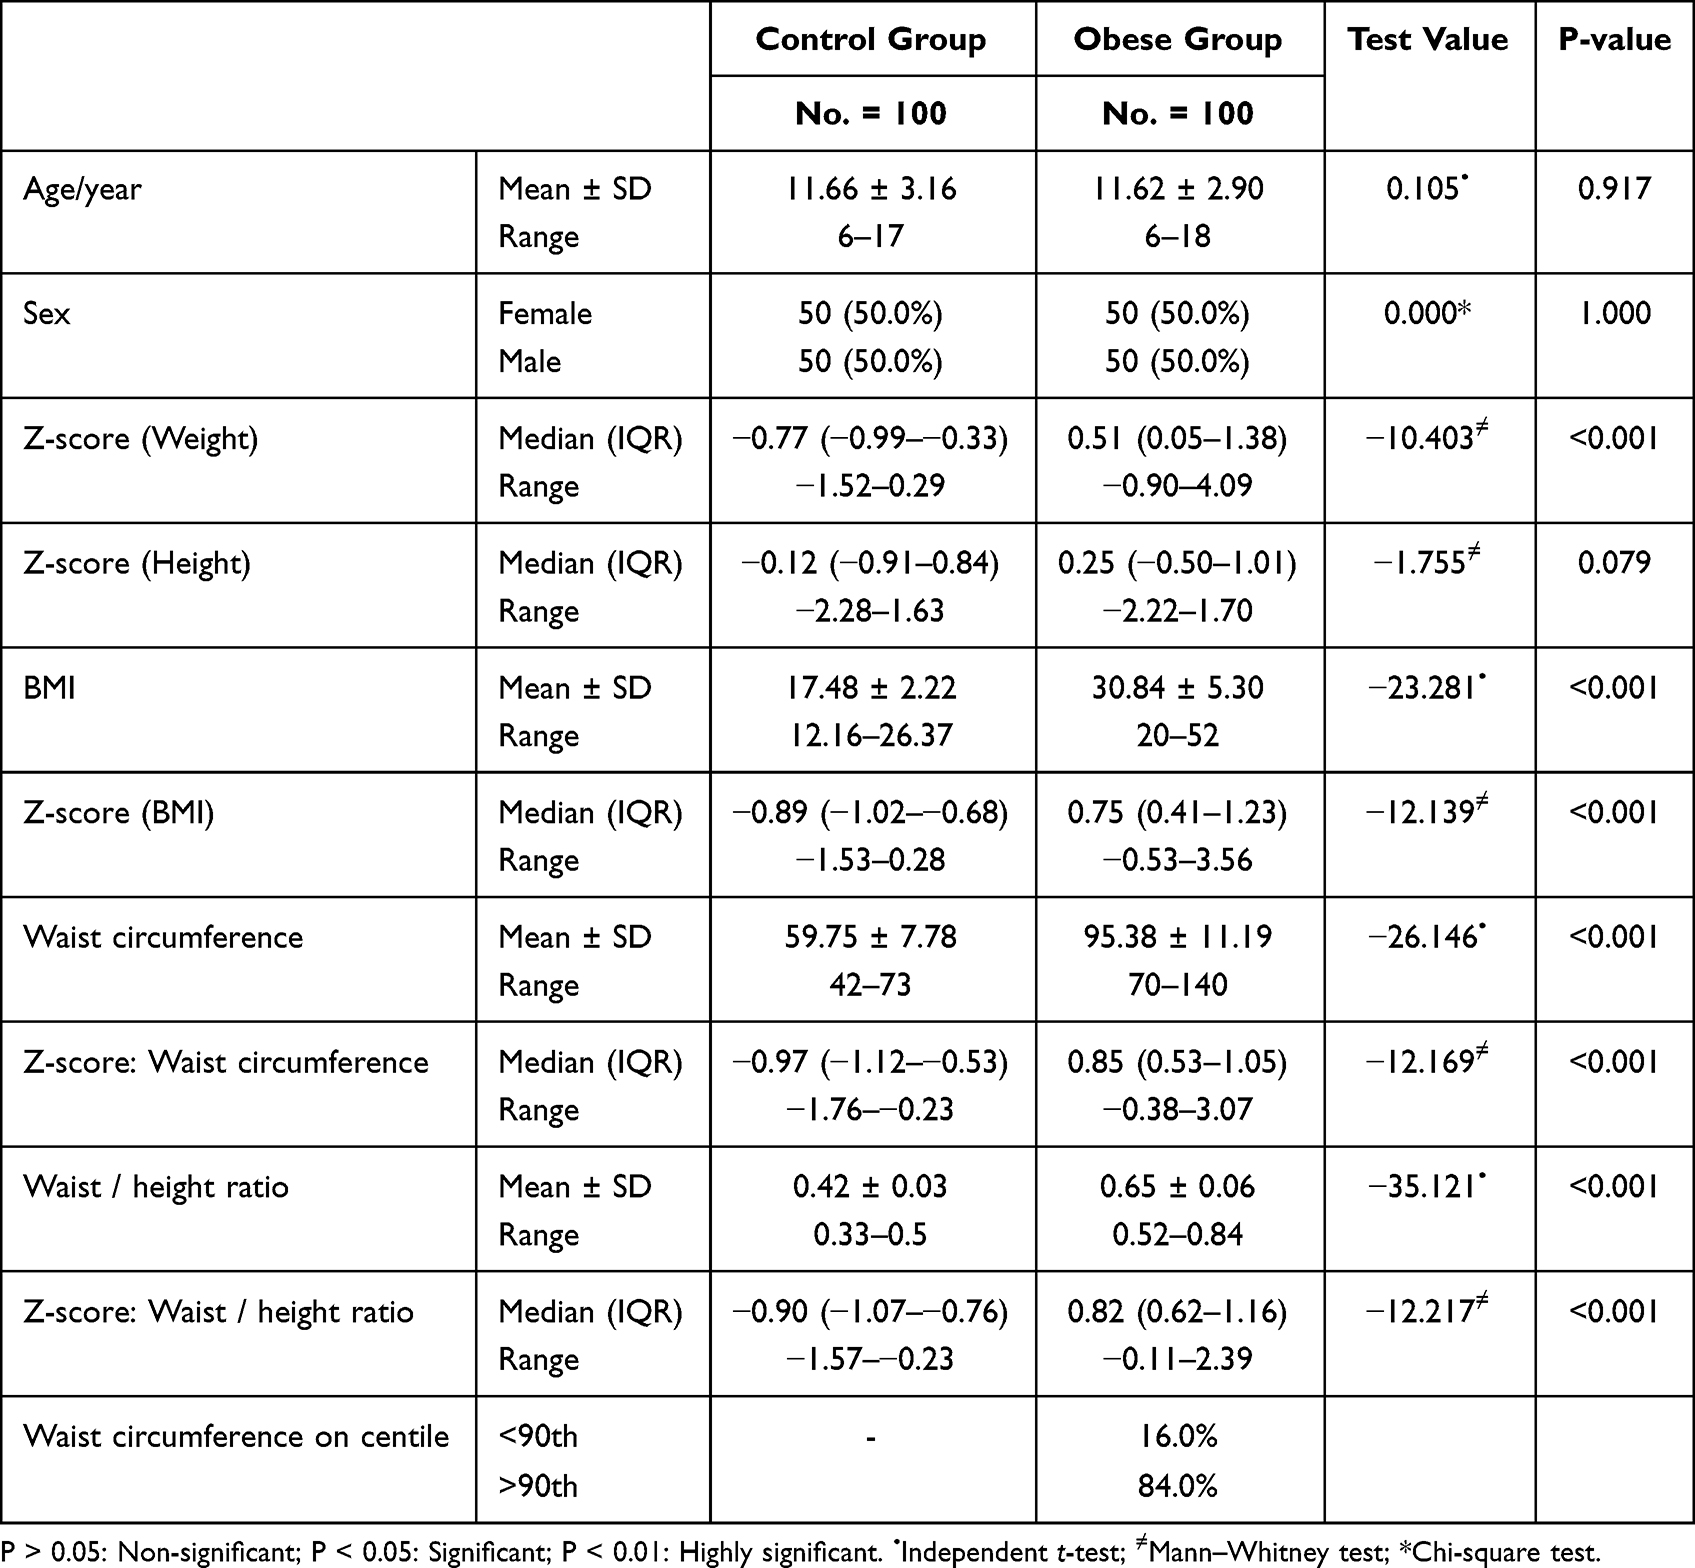 |
Table 1 Demographic and Anthropometric Data of the Studied Groups |
There was a significant increase in blood pressure in obese children in comparison with the control group. In obese children, 57% and 38% had blood pressure above 95th centile for systole and diastole, respectively (Table 2).
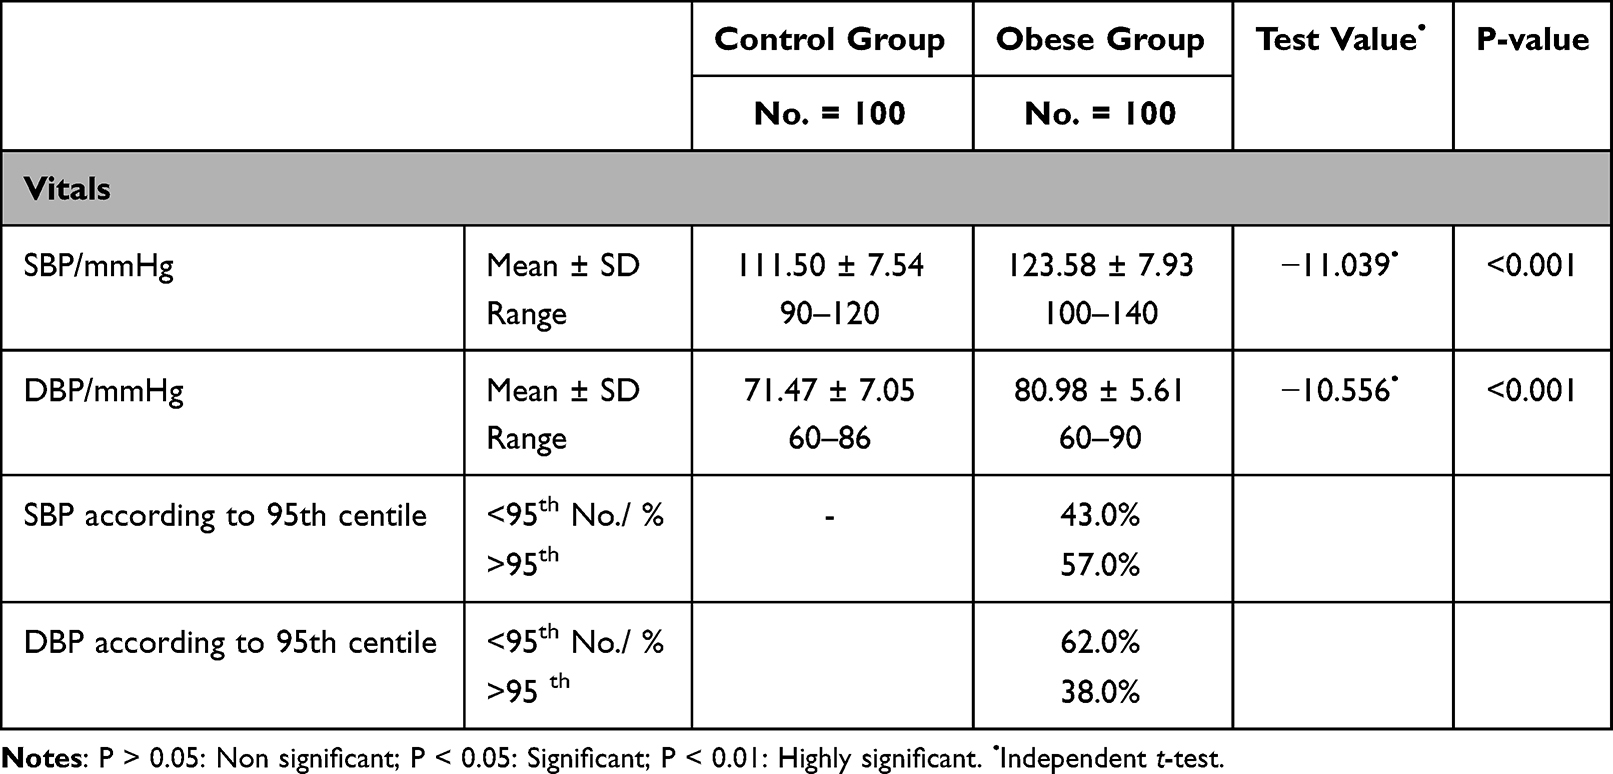 |
Table 2 Blood Pressure Measurements in the Two Studied Groups |
Compared to the normal weight children, obese children had a significant increase in serum blood level of adipsin, lipocalin-2, cholesterol, triglyceride, and LDL. There was also a significant increase in fasting blood glucose, fasting insulin, and insulin resistance index (HOMA-IR) in obese children versus the control. A significant decrease in serum blood level of IL-10 and HDL was observed in obese children in comparison with the controls (Table 3).
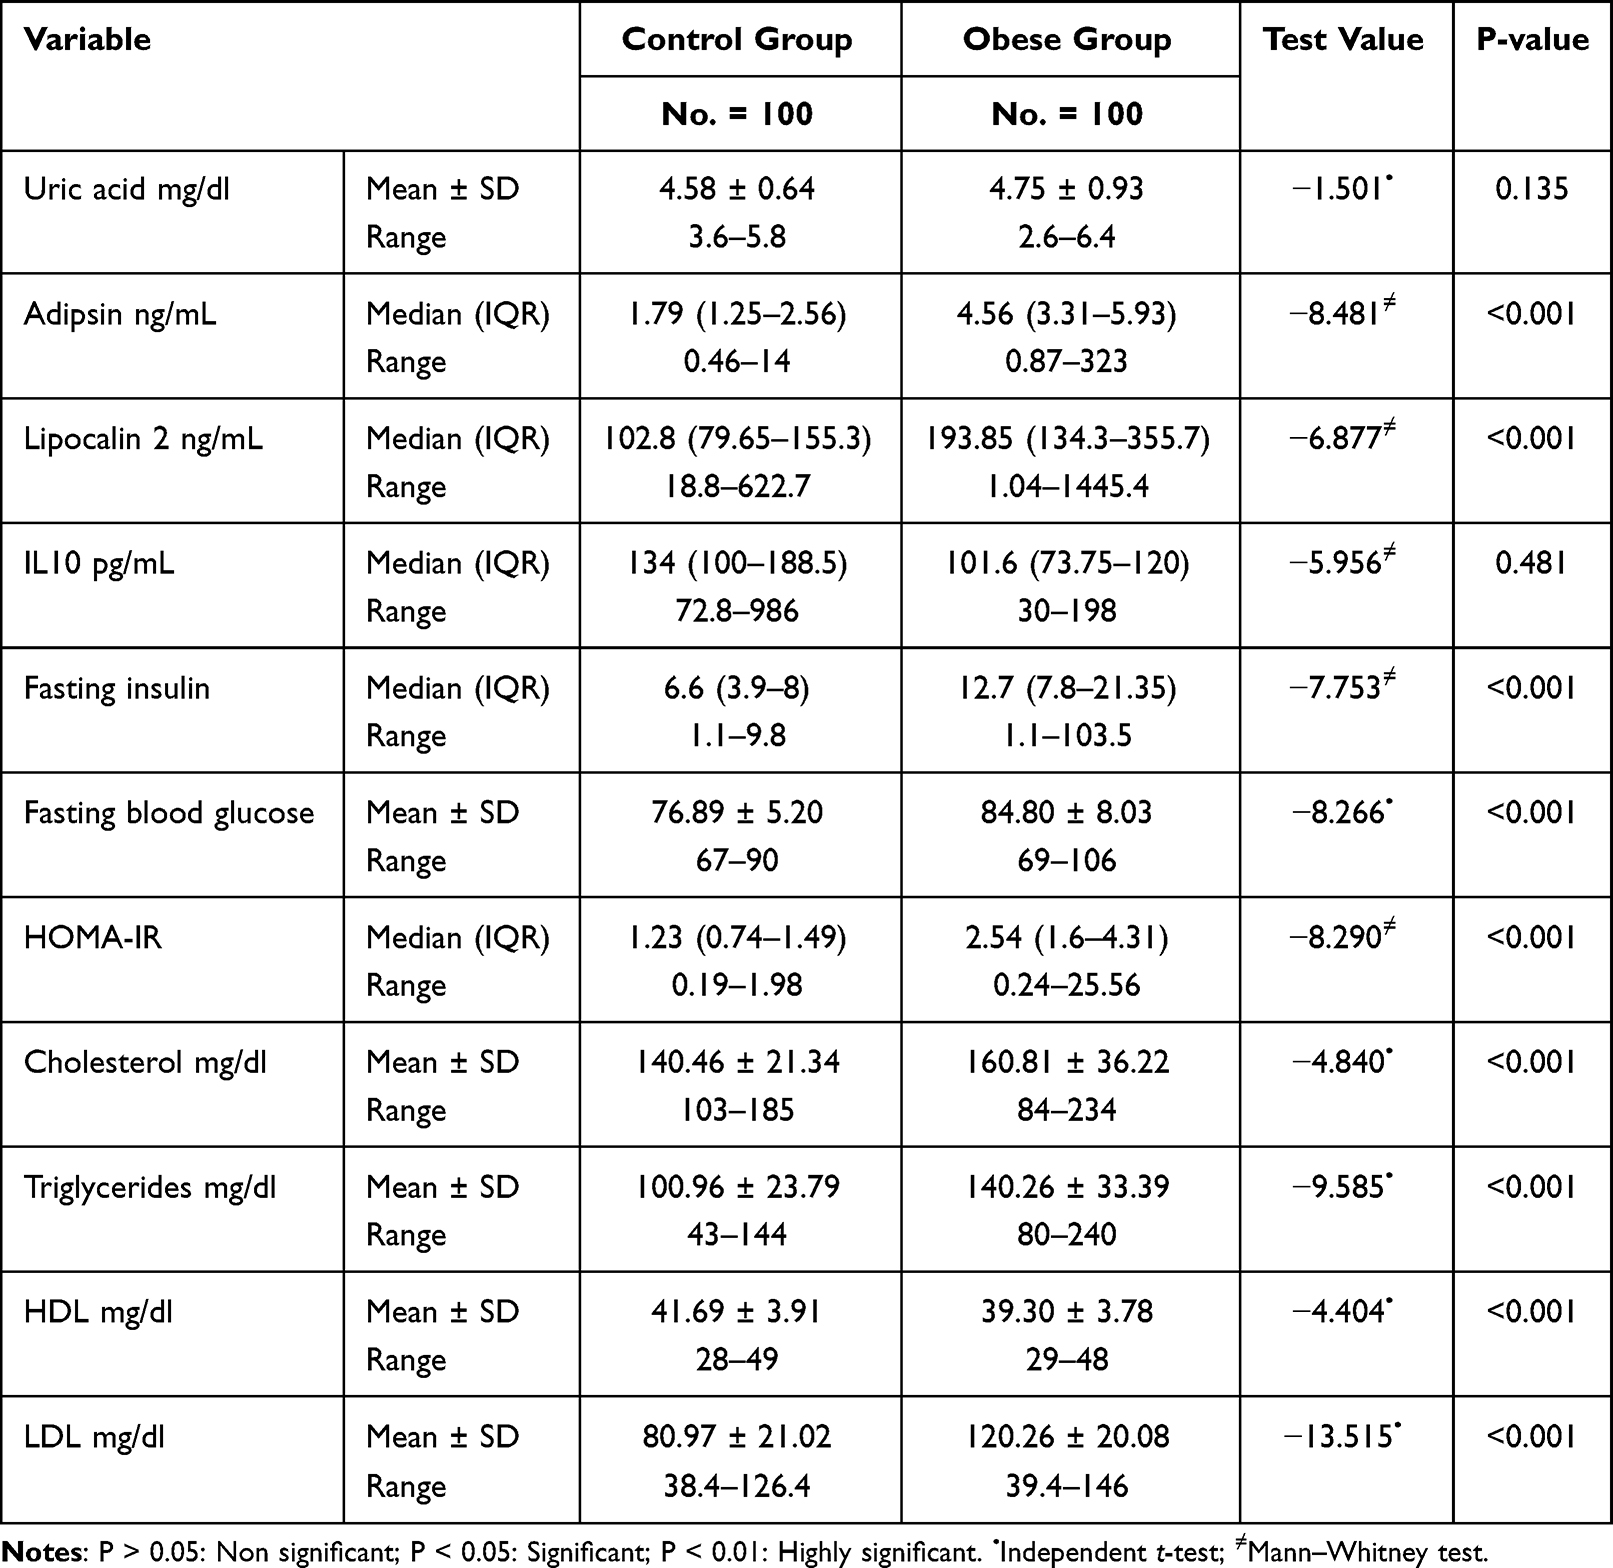 |
Table 3 Chemical Data of the Two Studied Groups |
In obese children, 47%, 96%, and 36% had high cholesterol, triglycerides, and LDL levels, respectively, while 35% of them had low HDL (Table 4).
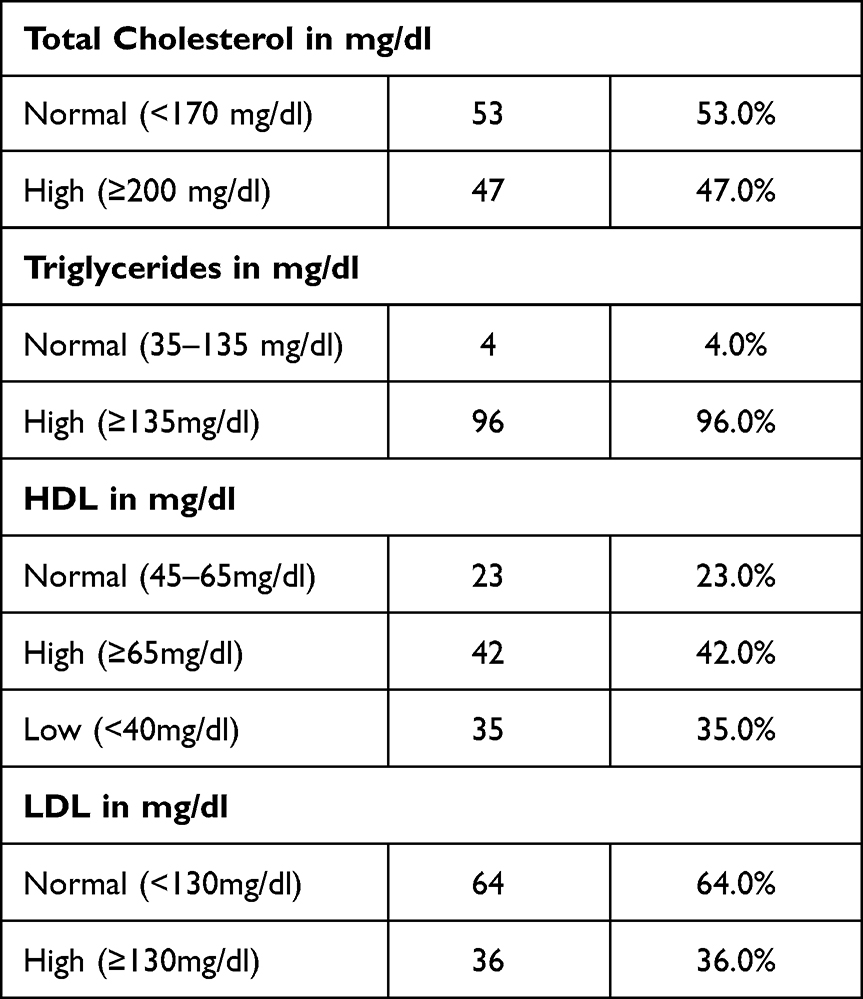 |
Table 4 Distribution of Abnormal Lipoproteins Levels in Obese Children |
Looking to the correlation of the studied markers with the other variables, serum adipsin level was positively correlated with the triglyceride level while IL-10 was negatively correlated with the triglyceride level. Lipocalin-2, serum insulin, and HOMA-IR were positively correlated with Z score of the weight, BMI, and waist circumference (Table 5).
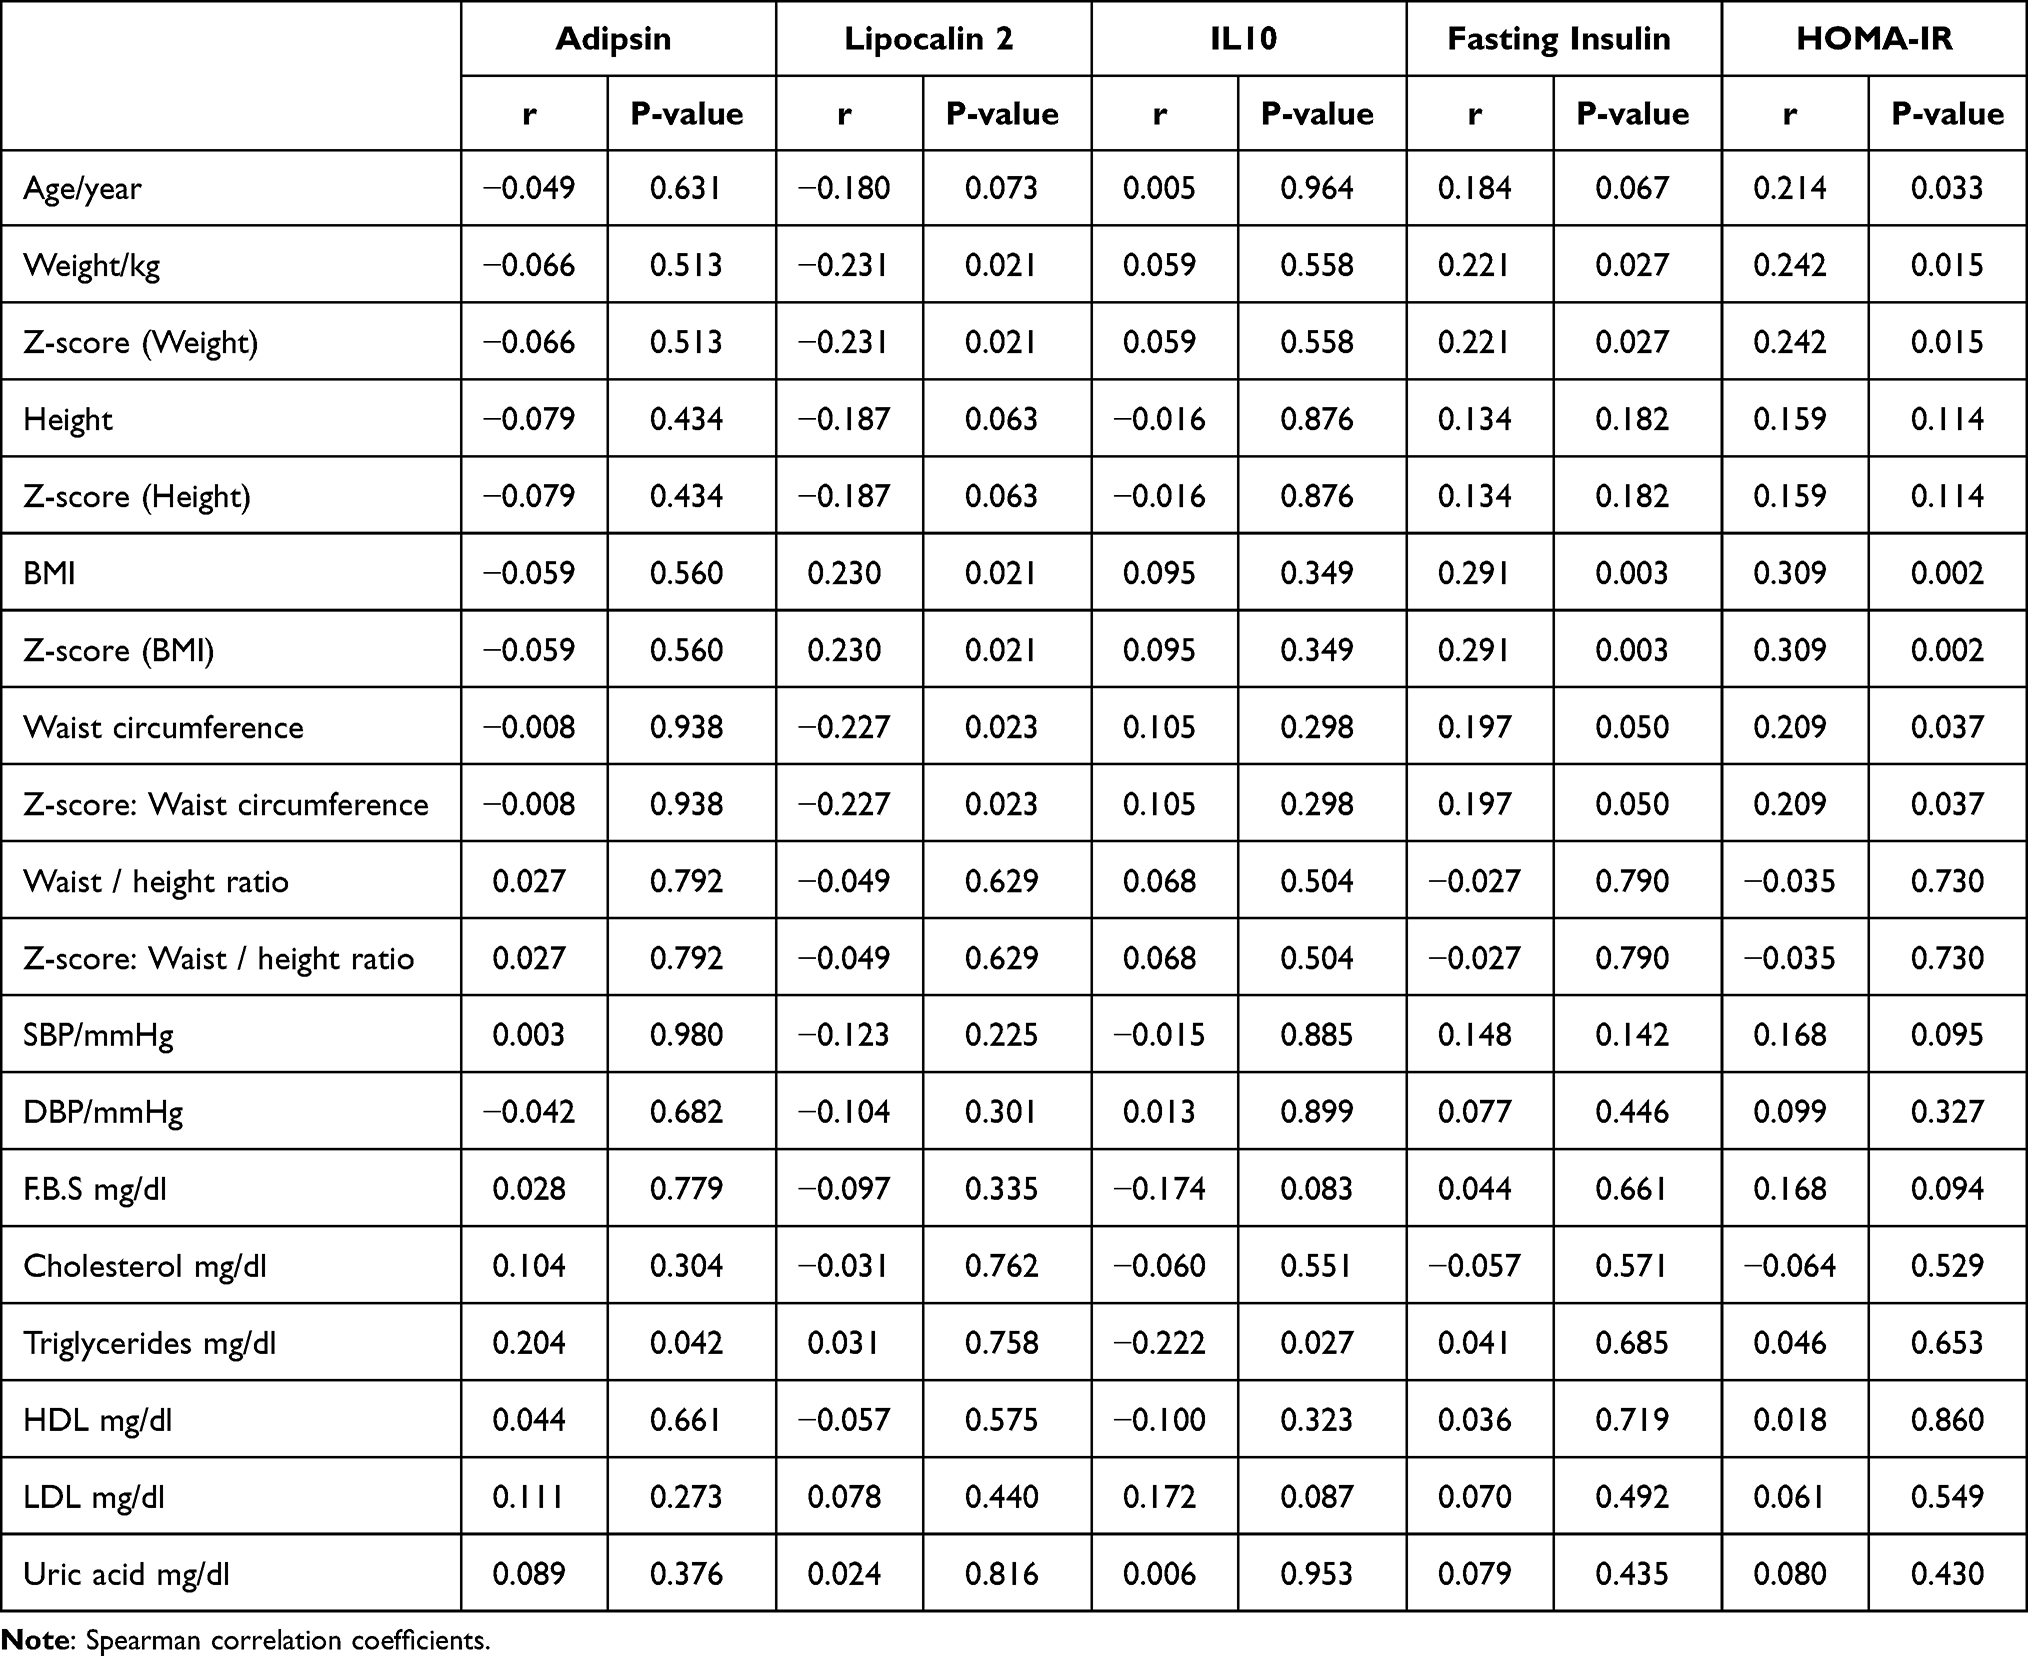 |
Table 5 Correlation Between the Studied Variables |
Lipocalin-2 was positively correlated with fasting insulin and insulin resistance index while IL-10 was negatively correlated with fasting insulin level only. Serum adipsin level had no association with fasting insulin or insulin resistance index (Table 6).
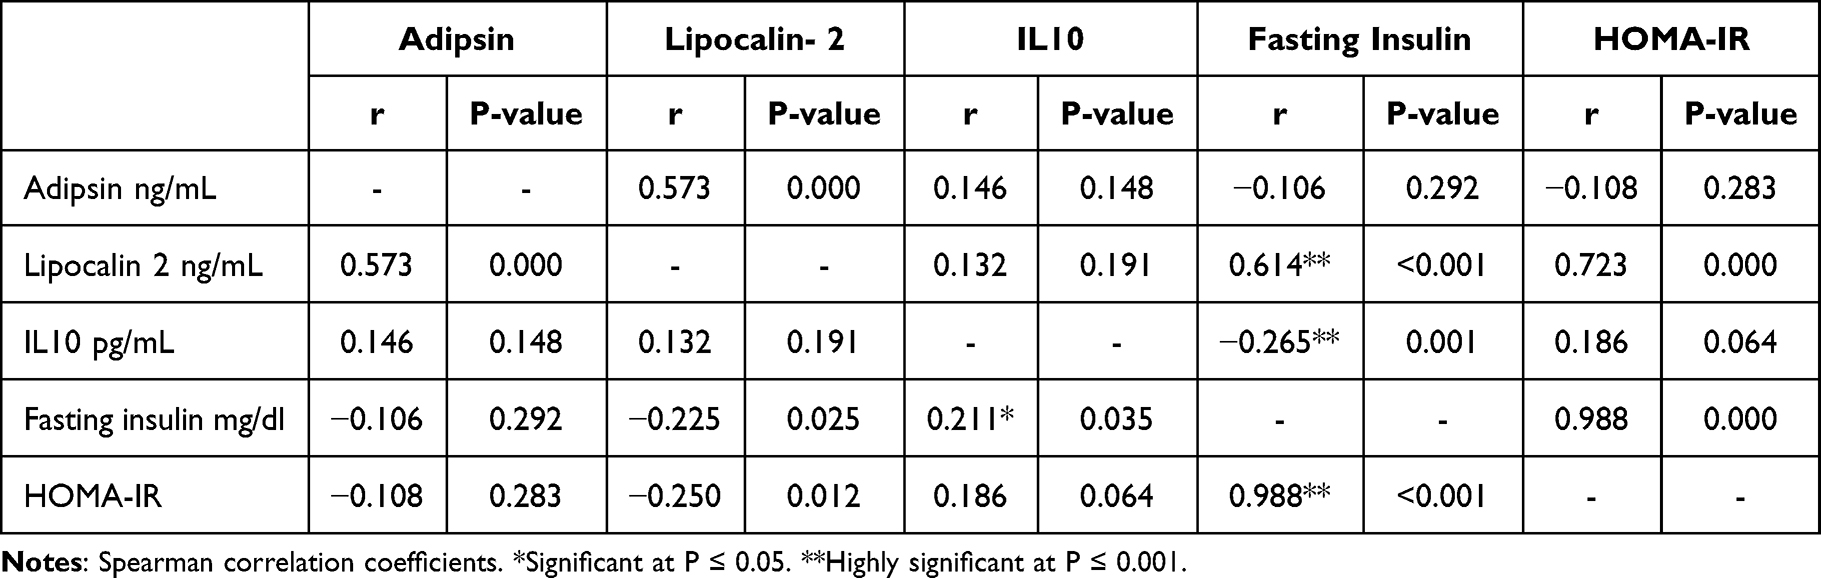 |
Table 6 Correlation Between the Studied Adipokines and IL10 with the Serum Fasting Insulin and HOMA-IR |
Table SI: the cut-off level of serum adipsin, lipocalin 2, IL10, and HOMA index discriminating the two studied groups.
Discussion
A case-control study was conducted on 200 children who were divided into two groups: 100 obese children with body weights ≥95th centile based on CDC criteria and 100 healthy children as a control group. They were matched in age and gender.
The present study aimed to assess the serum level of two adipokines (adipsin and lipocalin-2), besides; the cytokine IL-10, to evaluate the insulin resistance in those children, and explore the relation between the measured markers and insulin resistance in those children.
The waist/height ratio has been promoted as a useful and simple measure of central adiposity that may be more accurate than BMI alone in predicting cardio metabolic risk.13
In the current study, obese children exhibited a substantial rise in Z score waist-to-height ratio, with 84% having waist circumferences above the 90th centile. Similar results were reported in previous studies, such as Soliman et al14 who stated that waist-to-height ratio was considered as a reliable clinical predictor for cardiovascular risk in obese children and adolescents.
Excess weight in childhood and adolescence is one of the commonest causes of hypertension.15 We recorded a significant increase in blood pressure in obese children with 57% and 38% of the studied children having blood pressure above 95th centile for systole and diastole, respectively. Elevated blood pressure in obese children was previously reported by Rosaneli et al.15
On the evaluation of lipid abnormality in the studied obese children, 47%, 96%, and 36% had high cholesterol, triglycerides, and LDL levels, respectively, while 35% of them had low HDL. Dyslipidemia among overweight, obese children, and adolescents was previously recorded in many studies.16,17
The role of IL-10 in the pathophysiology of pediatric obesity and associated disorders is still unclear.18 In the present study, low serum level of IL-10 was observed in obese children in comparison with the normal weight children. A previous study by Chang et al19 reported that low IL-10 concentration was associated with overweight and obesity in young adolescents.
Abdelhamid et al7 also demonstrated that overweight and obese diabetic children had a lower level of IL-10 than non-obese diabetic children. Lauridsen et al20 stated that down regulation of mRNA expression of the anti-inflammatory cytokine IL-10 occurred with a gradual increase in BMI. Abnormal low IL-10 concentrations associated with autoimmune and inflammatory disorders were reported by Yao et al.21 Another study by Kupèa et al22 reported that high level of IL-10 was observed in obese children and adolescents. These discrepancies may be explained as IL-10 may play a dual role in inflammations.
In the present work, we observed a negative correlation of IL-10 with serum triglyceride level and cholesterol blood level. Liu et al23 reported that obese children with hypertriglyceridemia had lower serum IL-10 than obese children without hypertriglyceridemia and non-obese children. Moreover, Calcaterra et al24 found no association between IL-10 and HDL cholesterol or the triglycerides. The mechanism by which elevated IL-10 modulates lipoprotein levels is not clear, but could be explained by the non-hepatocyte liver cells that do express IL10R1, such as tissue macrophages, endothelial cells, and hepatic stellate cells, could potentially interact with canonical IL-10 receptors in vivo and signal to hepatocytes and modulate the lipoprotein synthesis.25
No significant correlation was observed for IL-10 with the anthropometry in the present work. Similar finding was observed by Kupèa et al.22 Abdelhamid et al7 stated that low serum level of IL-10 had a significant association with high BMI in diabetic obese children.
Lipocalin-2 acts as an acute phase protein, which can be induced by proinflammatory processes produced predominantly from enlarged adipocytes and activated macrophages in adipose tissue and liver.26
Results showed high serum lipocalin-2 in obese children in comparison with the normal weight control. Previous studies mentioned that obese children had significantly high serum concentration of lipocalin-2.27,28
We demonstrated that lipocalin-2 was associated with the general adiposity as it was positively correlated with BMI Z score. This raises the possibility that different amounts of lipocalin-2 were secreted from different body fat compartments. Furthermore, Wang et al29 reported that lipocalin-2 concentrations were positively correlated with BMI and waist circumference.
We observed that lipocalin-2 was not associated with the studied lipoproteins or the measured blood pressure, while Zaki et al27 reported a positive correlation of lipocalin-2 with blood pressure in obese children.
Adipsin was considered as a complement factor D playing an essential role in alternative pathway activation of the complement. It is primarily produced in adipose tissue, in the liver, and other soluble complement components are mostly made.2
High serum adipsin level was observed in the studied obese children compared to the normal weight control, and high adipsin level in obese children was observed previously by Gonzalez‑Gil et al,30 as well as in adult obesity.31
We demonstrated that serum adipsin was positively correlated with serum triglyceride, but not associated with the central or general adiposity markers (WC and BMI). Gonzalez‑Gil et al30 found that serum adipsin was positively correlated with triglyceride in obese children and BMI Z score.
Early detection of insulin resistance is important to prevent obesity complications. HOMA-IR was found to be a much more reliable and easily applicable parameter in clinical research in determining insulin resistance in obese children.32
Elevated fasting blood glucose level and hyperinsulinemia were observed in the studied obese children in comparison with the normal weight control. HOMA-IR cutoff values for insulin resistance were calculated to be >1.98 (sensitivity 66.0%, specificity 100%).
There was a positive correlation of HOMA-IR and fasting insulin with the Z score (weight, BMI, and waist circumference). These findings suggested that obesity-related insulin resistance in children can be predicted by simple anthropometric measurements of general obesity and central obesity, and this was previously reported by Lim et al33 in study of obesity indices and insulin resistance among the healthy Korean adolescents.
We observed no association of insulin resistance with the studied lipoproteins or the recorded blood pressure, while a positive correlation of HOMA-IR with low level of HDL was reported by Romualdo et al.34
Furthermore, there was an association between increased lipocalin-2 blood level and insulin resistance in the studied obese children. Zhang et al35 stated that, in adipocytes, lipocalin-2 expression and secretion are stimulated by insulin, while Liu et al36 demonstrated that lipocalin-2 was not correlated with insulin resistance.
In the present work, we observed that serum level of IL-10 was negatively correlated with fasting serum insulin level but not with the HOMA-IR. Han et al37 concluded that, in experimental study on obesity, the effect of hyperinsulinemia on T-regulatory cells was remarkable by inhibiting IL-10 production. While Acosta et al6 observed that IL-10 was up regulated in obesity and insulin resistance, Charles et al38 and Calcaterra et al24 indicated that IL-10 had no association with insulin resistance.
No association was observed in the present study between serum adipsin and insulin resistance. While Zhang et al4 reported that circulating adipsin had a negative association with HOMA-IR in non-alcoholic fatty liver obese adults, Taşdemir et al4 showed that plasma adipsin level was negatively correlated with insulin resistance in diabetic rats.
In conclusion, simple measurement of general and central adiposity markers and serum lipocalin-2 can predict insulin resistance in obese children while serum adipsin and IL-10 had no association with insulin resistance.
Data Availability Statement
The datasets generated during and/or analyzed during the current study are available from the corresponding author on reasonable request.
Ethical Approval
Written informed consent was completed by each child’s parents. The study protocol was approved by AL-Azhar University Local Ethics Committee, Faculty of Medicine (for Girls), the council number is 202106969 and all procedures were in accordance with the Helsinki Declaration.
Acknowledgment
The authors are grateful to the patients’ families for their participation in this work.
Author Contributions
El Sehmawy A.A, Diab F.A, Hassan D.A, Mohammed D.S, Al Anany M.G.E, Eldesoky N.A, Elamir R.Y: All authors made a significant contribution to the work reported, whether that is in the conception, study design, execution, acquisition of data, analysis and interpretation, or in all these areas; took part in drafting, revising or critically reviewing the article; gave final approval of the version to be published; have agreed on the journal to which the article has been submitted; and agree to be accountable for all aspects of the work.
Funding
There is no funding to report.
Disclosure
The authors have no conflict of interest to declare.
References
1. Gregory JW. Prevention of obesity and metabolic syndrome in children. Front Endocrinol. 2019;10:669. doi:10.3389/fendo.2019.00669
2. Taylor EB. The complex role of adipokines in obesity, inflammation, and autoimmunity. Clin Sci. 2021;135:731–752. doi:10.1042/CS20200895
3. Lo JC, Ljubicic S, Leibiger B, et al. Adipsin is an adipokine that improves beta cell function in diabetes. Cell. 2014;158:41–53. doi:10.1016/j.cell.2014.06.005
4. Zhang J, Li K, Pan L, et al. Association of circulating adipsin with nonalcoholic fatty liver disease in obese adults: a cross-sectional study. BMC Gastroenterol. 2021;21:131. doi:10.1186/s12876-021-01721-9
5. Nicholson T, Church C, Baker DJ, Jones SW. The role of adipokines in skeletal muscle inflammation and insulin sensitivity. J Inflamm. 2018;15:9. doi:10.1186/s12950-018-0185-8
6. Acosta JR, Tavira B, Douagi I, et al. Human-specific function of IL-10 in adipose tissue linked to insulin resistance. J Clin Endocrinol Met. 2019;104(10):4552–4562. doi:10.1210/jc.2019-00341
7. Abdelhamid ER, Kamhawy AH, Ahmed HH, et al. Role of inflammatory cytokines in obese and nonobese diabetic children. Open Access Maced J Med Sci. 2020;8(B):858–865. doi:10.3889/oamjms.2020.4982
8. Hung J, McQuillan BM, Thompson PL, Beilby JP. Circulating adiponectin levels associate with inflammatory markers, insulin resistance and metabolic syndrome independent of obesity. Int J Obes. 2008;32(5):772–779. doi:10.1038/sj.ijo.0803793
9. CDC. About child & teen BMI; division of nutrition, physical activity, and obesity; 2021. Available from: https://www.cdc.gov/healthyweight/assessing/BMI/childrens_BMI/about_childrens_BMI.html.
10. Flynn JT, Kaelber DC, Baker-Smith CM, et al. Clinical practice guideline for screening and management of high blood pressure in children and adolescents. Pediatrics. 2017;140(3):e20171904. doi:10.1542/peds.2017-1904
11. Uniyal A, Narang M. Dyslipidemia in children. Indian J Medical Spe. 2021;12(3):116–121. doi:10.4103/injms.injms_17_21
12. Matthews DR, Hosker JP, Rudenski AS, Naylor BA, Treacher DF, Turner RC. Homeostasis model assessment: insulin resistance and beta-cell function from fasting plasma glucose and insulin concentrations in man. Diabetologia. 1985;28:412–419. doi:10.1007/BF00280883
13. Irenewati S, Arkhaesi N, Wistiani W. Association of BMI measurements to waist circumference and waist-to-height ratio in overweight and obese children. Paediatr Indones. 2020;60(3):131–136. doi:10.14238/pi60
14. Soliman H, Ahmed S, Ibrahim A. Waist-to-height ratio as a clinical predictor for cardiovascular risks and insulin resistance in children and adolescents with exogenous obesity. Egypt Paediatr Assoc Gaz. 2021;69(1):1–6. doi:10.1186/s43054-021-00085-9
15. Rosaneli CF, Baena CP, Auler F, et al. Elevated blood pressure and obesity in childhood: a cross-sectional evaluation of 4609 Schoolchildren. Arq Bras Cardiol. 2014;103(3):238–244. doi:10.5935/abc.20140104
16. Reuter CP, da Silva PT, Renner JDP, et al. Dyslipidemia is associated with unfit and overweight-obese children and adolescents. Arq Bras Cardio. 2016;106(3):188–193. doi:10.5935/abc.20160025
17. Wang PG, Gong J, Wang SQ, Talbott EO, Zhang B, He QQ. Relationship of body fat and cardiorespiratory fitness with cardiovascular risk in Chinese children. PLoS One. 2011;6(11):e27896. doi:10.1371/journal.pone.0027896
18. Medeiros NI, Mattos RT, Menezes CA, et al. IL-10 and TGF-beta unbalanced levels in neutrophils contribute to increase inflammatory cytokine expression in childhood obesity. Eur J Nutr. 2018;57(7):2421–2430. doi:10.1007/s00394-017-1515-y
19. Chang J, Chang C, Chien EY, et al. Association between interleukin 1β and interleukin 10 concentrations: a cross-sectional study in young adolescents in Taiwan. BMC Pediatr. 2013;13:123. doi:10.1186/1471-2431-13-123
20. Lauridsen JK, Olesen RH, Vendelbo J, et al. High BMI levels associate with reduced mRNA expression of IL10 and increased mRNA expression of iNOS (NOS2) in human frontal cortex. Transl Psychiatry. 2017;7(2):e1044. doi:10.1038/tp.2016.259
21. Yao C, Du W, Chen H, Xiao S, Wang C-H, Fan Z-L. Associations of IL-10 gene polymorphisms with acute myeloid leukemia in Hunan, China. Asian Pac J Cancer Prev. 2013;14(4):2439–2442. doi:10.7314/APJCP
22. Kupèa S, Jurka A, Marksa I, Rinkuþa I, Sipols AJ, Rumba-Rozenfelde I. Inflammatory cytokine IFN, IL-6, and IL-10 association with childhood obesity. Proc Latv Acad Sci. 2021;5(734):387–391. doi:10.2478/prolas-2021-0056
23. Liu Y, Xu D, Yin C, Wang S, Wang M, Xiao Y. IL-10/STAT3 is reduced in childhood obesity with hypertriglyceridemia and is related to triglyceride level in diet-induced obese rats. BMC Endocr Disord. 2018;18:39. doi:10.1186/s12902-018-0265-z-
24. Calcaterra V, De Amici M, Klersy C, et al. Adiponectin, IL-10 and metabolic syndrome in obese children and adolescents. ACTA BIOMED. 2009;80:117–123.
25. Moraitis AG, Freeman LA, Shamburek RD, et al. Elevated interleukin-10: a new cause of dyslipidemia leading to severe HDL deficiency. J Clin Lipidol. 2015;9(1):81–90. doi:10.1016/j.jacl.2014.09.014
26. Schroll A, Eller K, Feistritzer C, et al. Lipocalin 2 ameliorates granulocyte functionality. Eur J Immunol. 2012;42(12):3346–3357. doi:10.1002/eji.201142351
27. Zaki ME, El-Bassyouni H, Youness E, Mohamed N. Lipocalin-2 is an inflammatory biomarker associated with metabolic abnormalities in Egyptian obese children. J Appl Pharm Sci. 2015;5(05):007–012. doi:10.7324/JAPS.2015.50502
28. Kanaka-Gantenbein C, Margeli A, Pervanidou P, et al. Retinol-binding protein 4 and lipocalin-2 in childhood and adolescent obesity: when children are not just “small adults. Clin Chem. 2008;54:1176–1182. doi:10.1373/clinchem.2007.099002
29. Wang Y, Lam KS, Kraegen EW, et al. Lipocalin-2 is an inflammatory marker closely associated with obesity, insulin resistance, and hyperglycemia in humans. Clin Chem. 2007;53:34–41. doi:10.1373/clinchem.2006.075614
30. Gonzalez‑Gil AM, Peschard‑Franco M, Castillo EC, et al. Myokine–adipokine cross‑talk: potential mechanisms for the association between plasma irisin and adipokines and cardiometabolic risk factors in Mexican children with obesity and the metabolic syndrome. Diabetol Metab Syndr. 2019;11:63. doi:10.1186/s13098-019-0458-2
31. Vasilenkoa MA, Kirienkovaa EV, Skuratovskaiaa DA, Zatolokina PA, Mironyukb NI, Litvinova LS. The role of production of adipsin and leptin in the development of insulin resistance in patients with abdominal obesity. Prog Biophys Mol Bio. 2017;475:271–276. doi:10.1134/S160767291704010X
32. Czech MP. Insulin action and resistance in obesity and type 2 diabetes. Nat Med. 2017;23:804–814. doi:10.1038/nm.4350
33. Lim SM, Choi DP, Rhee Y, Kim HC. Association between obesity indices and insulin resistance among healthy Korean adolescents: the JS High School Study. PLoS One. 2015. doi:10.1371/journal.pone.0125238
34. Romualdoa MC, Nóbregab FJ, Escrivão MAMS. Insulin resistance in obese children and adolescents. J Pediatr. 2014;90(6):600–607. doi:10.1016/j.jped.2014.03.005
35. Zhang Y, Foncea R, Deis JA, Guo H, Bernlohr DA, Chen X. Lipocalin 2 expression and secretion is highly regulated by metabolic stress, cytokines, and nutrients in adipocytes. PLoS One. 2014;9(5):e96997. doi:10.1371/journal.pone.0096997
36. Liu X, Hamnvik OP, Petrou M, et al. Circulating lipocalin 2 is associated with body fat distribution at baseline but is not an independent predictor of insulin resistance: the prospective Cyprus Metabolism Study. Eur J Endocrinol. 2011;165:805–812. doi:10.1530/EJE-11-0660
37. Han JM, Patterson SJ, Speck M, Ehses JA, Levings MK. Insulin inhibits IL-10–mediated regulatory T cell function: implications for obesity. J Immunology. 2014;192(2):623–629. doi:10.4049/jimmunol.1302181
38. Charles BA, Doumatey A, Huang H, et al. The roles of IL-6, IL-10, and IL-1RA in obesity and insulin resistance in African-Americans. J Clin Endocrinol Metab. 2011;96(12):E2018–E2022. doi:10.1210/jc.2011-1497
 © 2022 The Author(s). This work is published and licensed by Dove Medical Press Limited. The full terms of this license are available at https://www.dovepress.com/terms.php and incorporate the Creative Commons Attribution - Non Commercial (unported, v3.0) License.
By accessing the work you hereby accept the Terms. Non-commercial uses of the work are permitted without any further permission from Dove Medical Press Limited, provided the work is properly attributed. For permission for commercial use of this work, please see paragraphs 4.2 and 5 of our Terms.
© 2022 The Author(s). This work is published and licensed by Dove Medical Press Limited. The full terms of this license are available at https://www.dovepress.com/terms.php and incorporate the Creative Commons Attribution - Non Commercial (unported, v3.0) License.
By accessing the work you hereby accept the Terms. Non-commercial uses of the work are permitted without any further permission from Dove Medical Press Limited, provided the work is properly attributed. For permission for commercial use of this work, please see paragraphs 4.2 and 5 of our Terms.