Back to Archived Journals » Open Access Journal of Sports Medicine » Volume 9
Using a site-specific technical error to establish training responsiveness: a preliminary explorative study
Authors Weatherwax RM, Harris NK ![]() , Kilding AE, Dalleck LC
, Kilding AE, Dalleck LC
Received 28 October 2017
Accepted for publication 11 January 2018
Published 8 March 2018 Volume 2018:9 Pages 47—53
DOI https://doi.org/10.2147/OAJSM.S155440
Checked for plagiarism Yes
Review by Single anonymous peer review
Peer reviewer comments 2
Editor who approved publication: Prof. Dr. Andreas Imhoff
Ryan M Weatherwax,1,2 Nigel K Harris,1 Andrew E Kilding,3 Lance C Dalleck2
1Auckland University of Technology, Human Potential Center, Auckland, New Zealand; 2Western State Colorado University, Recreation and Exercise & Sport Science, Gunnison, CO, USA; 3Auckland University of Technology, Sports Performance Research Institute New Zealand, Auckland, New Zealand
Background: Even though cardiorespiratory fitness (CRF) training elicits numerous health benefits, not all individuals have positive training responses following a structured CRF intervention. It has been suggested that the technical error (TE), a combination of biological variability and measurement error, should be used to establish specific training responsiveness criteria to gain further insight on the effectiveness of the training program. To date, most training interventions use an absolute change or a TE from previous findings, which do not take into consideration the training site and equipment used to establish training outcomes or the specific cohort being evaluated. The purpose of this investigation was to retrospectively analyze training responsiveness of two CRF training interventions using two common criteria and a site-specific TE.
Methods: Sixteen men and women completed two maximal graded exercise tests and verification bouts to identify maximal oxygen consumption (VO2max) and establish a site-specific TE. The TE was then used to retrospectively analyze training responsiveness in comparison to commonly used criteria: percent change of >0% and >+5.6% in VO2max.
Results: The TE was found to be 7.7% for relative VO2max. χ2 testing showed significant differences in all training criteria for each intervention and pooled data from both interventions, except between %Δ >0 and %Δ >+7.7% in one of the investigations. Training nonresponsiveness ranged from 11.5% to 34.6%.
Conclusion: Findings from the present study support the utility of site-specific TE criterion to quantify training responsiveness. A similar methodology of establishing a site-specific and even cohort specific TE should be considered to establish when true cardiorespiratory training adaptations occur.
Keywords: training responders, training nonresponders, cardiorespiratory fitness, exercise training
Introduction
It is well established that regular physical activity and cardiorespiratory fitness (CRF) training confers numerous health benefits1,2 and that a low level of CRF is a risk factor for coronary heart disease and cardiovascular disease mortality.3–6 It is generally accepted that CRF can be improved with the implementation of a regular aerobic exercise training program following standardized guidelines.7 However, it has also been shown that not all individuals respond positively to such exercise, and evidence of considerable individual variability in training adaptations has been found, including so-termed “nonresponders”8–13 and, in some instances, “adverse responders”14 in regard to changes in maximal oxygen consumption (VO2max) and cardiometabolic factors (lipid levels, fasting blood glucose, and resting blood pressure). Training nonresponse is often defined as a response that does not exceed a set criterion in a favorable direction (usually a percent change greater than 0), whereas an adverse response is a change in an opposite and unfavorable direction compared to the expected positive adaptations. This variability in training responsiveness is not well understood and may be attributable to various factors including genetics, sociocultural aspects, and a lack of a set definition in the literature for incidence of response. It has been common practice to quantify training responsiveness based on absolute changes, but this method fails to take into consideration biological variability (normal day-to-day biological fluctuations) and measurement error of the equipment.11,14,15 Consequently, currently, there is not a clear consensus on best practice to prescribe a customized exercise intervention that takes into consideration individual characteristics and diagnostic information.
Identification of different training responsiveness categories requires specific criteria. For instance, in recent years, various investigators have used technical error (TE) to distinguish training responsiveness,9,13,14 which is comprised of measurement error and biological variability. Interindividual differences in daily environment, disease, genetics, and lifestyle are all possible modulators of biological variability. Nevertheless, it is not uncommon in the literature for a uniform biological variability metric to be incorporated into the TE definition for categorizing training responsiveness. For example, two recent investigations of exercise training in untrained participants11,13 sourced biological variability data for maximal oxygen consumption from an early 1980s investigation of aerobic power.16 Such application of identical group TE criteria (ie, one based on a uniform biological variability metric) for the categorization of responders and nonresponders disregards individuality. Recently, it has been identified that a more nuanced, individualized, and evidence-based approach to exercise prescription is needed to enhance training efficacy and limit training unresponsiveness.13 Therefore, we propose a more personalized approach is also required to more accurately identify “true” individual responders and nonresponders to regular exercise training. Accordingly, the purpose of the present study was to establish a site-specific TE and retrospectively analyze previously published CRF training interventions, specifically addressing training responsiveness to investigate differences in sourced (ie, from the literature and what was previously used) compared to site-specific responsiveness criteria and to highlight the possibility of reporting false-positive CRF training adaptations.
Methods
The current investigation involved the development of a site-specific TE. It also retrospectively analyzed the training responsiveness of two previously published investigations.9,13 All of the investigations were conducted in the same laboratory and with a similar population.
Development of site-specific TE
Sixteen men and women were sampled from a randomized control trial being conducted in a community exercise program17 and were included if they were currently sedentary (participating in no more than 30 min/d of physical activity on 3 days a week), between the ages of 30 and 75, and no medical contraindications as per the exclusion criteria. Exclusion criteria included signs or symptoms suggestive of pulmonary, cardiovascular, or metabolic conditions as determined by a standard medical history questionnaire. The Western State Colorado University Human Research Committee approved this study (HRC2016-01-90R6). Each participant signed an informed consent prior to participation.
Participants were asked to complete two testing sessions (no sooner than 24 hours from each other, but within a 1-week period) while maintaining their regular daily habits and prior to starting an exercise intervention. During each testing session, participants were weighed to the nearest 0.1 kg and height was measured to the nearest 0.5 cm on a medical-grade scale and stadiometer (Tanita Corporation WB-3000, Tokyo, Japan), respectively. Following basic anthropometric measurements, a graded exercise test (GXT) and verification bout were completed.
The GXT and verification testing to confirm attainment of VO2max were completed using protocols previously published.17 In summary, participants completed a modified-Balke, pseudo-ramp protocol on a motorized treadmill (Powerjog, GX200, Portland, ME, USA) until volitional fatigue. Following a 4 minute warm-up, participants ran or walked at a self-selected pace, and the grade increased by 1% each minute. Expired air and gas exchange data were monitored continuously with a metabolic analyzer (Parvo Medics TrueOne 2.0, Salt Lake City, UT, USA). Twenty minutes following the GXT, a verification bout was performed at a workload 5% higher than the last completed state of the GXT. Participants were encouraged to maintain the verification bout workload until volitional fatigue. Gas exchange data were averaged for every 15 seconds, and VO2max for the GXT and verification bout were determined by averaging the last two 15 second samples. VO2max was confirmed if the GXT and verification bout were within ±3.0%, based on previous methods.18,19
Retrospective analyses of training responsiveness
Data on 52 adults from two studies were available for analysis. These studies are briefly described and were chosen due to the uniqueness of taking place in a laboratory that resides at ~2,350 m and the same laboratory in which the site-specific TE was developed as well as a similar training methodology. The basic descriptive, baseline, and posttraining data are highlighted in Table 1. For each investigation, baseline and posttraining VO2max were determined based on the same aforementioned protocol using a modified-Balke, pseudo-ramp GXT on a motorized treadmill. The two final 15 second time intervals were averaged for the two ending data points during the GXT. These two processed data points were then averaged to establish VO2max. Participants did not complete a verification protocol at baseline or posttraining.
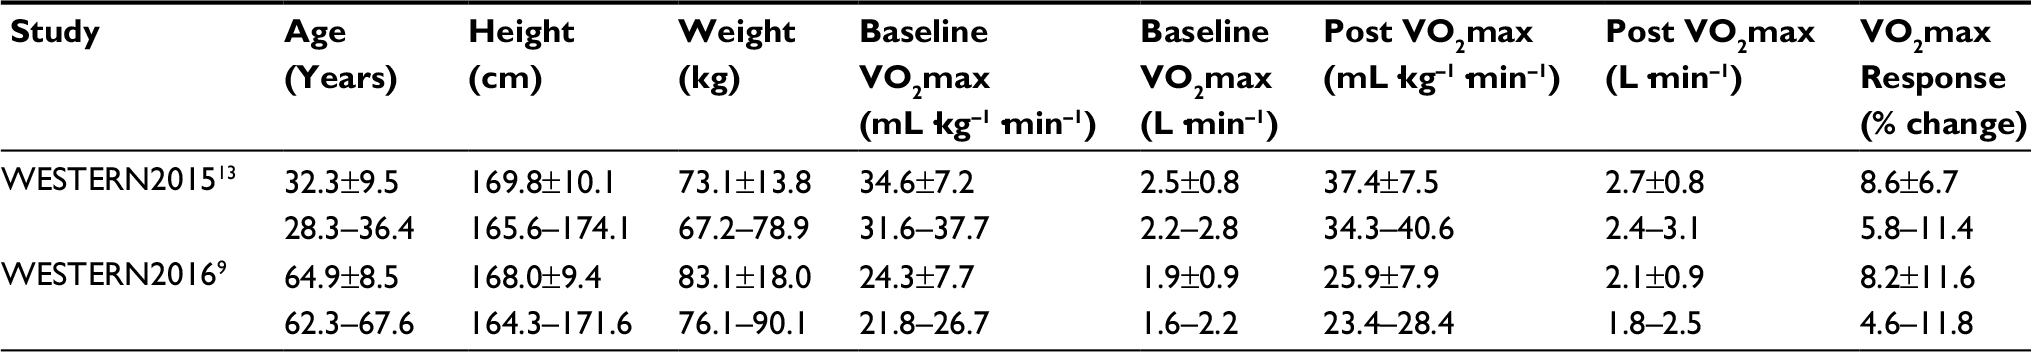 | Table 1 Descriptive, baseline, and response to training data for two cohorts with CRF training interventions Notes: Descriptive statistics are reported as mean ± standard deviation and 95% confidence interval. Abbreviations: CRF, cardiorespiratory fitness; VO2max, maximal oxygen consumption. |
Western State Colorado University threshold study (WESTERN2015)
In summary, sedentary men and women between the ages of 18 and 54 were randomized to a nonexercise control group or one of two exercise interventions.13 For those participants randomized to the exercise groups, they performed 30 min, 5 days a week for 12 weeks of exercise training with a progressive increase of intensity based on percentage of heart rate reserve or a threshold based model using the first and second ventilatory thresholds.
Western State Colorado University ACE IFT study (WESTERN2016)
Nonsmoking men and women between the ages of 44 and 83 were randomized to a personalized or standardized training group and completed both CRF and resistance training throughout a 13 week intervention.9 The CRF training occurred 3 days a week with a progressive increase in intensity and duration. Resistance training commenced at week 4 and was done for 3 days a week with progressive increases throughout the intervention.
Statistical analysis
Site-specific TE
All statistical analyses were performed using SPSS Version 22.0 (Chicago, IL, USA). Sex differences were determined based on an independent-samples t-test with p≤0.05. Intraclass correlation (ICC) of variation, typical error, and coefficient of variation (CV) for VO2max were calculated as previously described.20 The calculated CV was used in combination with the measurement error of the metabolic analyzer, as previously established,21 to determine the TE. Therefore, any participant with a VO2max training response in a positive direction that exceeds the TE (CV + measurement error) value was considered a “responder” to the training intervention.
Training responsiveness
To determine the individual training responsiveness from WESTERN2015 and WESTERN2016, the absolute and percentage change in VO2max (mL·kg–1·min–1) from baseline to posttesting was calculated. Delta values (Δ) were calculated (postprogram minus baseline value divided by baseline value) to establish the percent change in VO2max. The change in VO2max was compared using three methods of establishing training responsiveness: 1) whether or not participants had a training response greater than 0.0 (ie, %Δ >0), since this has been commonly reported in the literature;12,22,23 2) whether or not they exceeded a positive change greater than 5.6% (ie, %Δ >+5.6%) which was established by Katch et al16 in the early 1980s and has been a method, more recently, to establish responsiveness;9,11,13 and 3) based on the calculated site-specific TE (ie, %Δ > CV + measurement error). For each of the methods, participants were categorized as “1” = responder if their %Δ was greater than the specified criteria or “0” = nonresponder if the %Δ failed to exceed the criteria.
Pearson’s χ2 were used to stratify the incidence of response separated by the responsiveness criteria following the training intervention with a subsequent Cramer’s V test to determine effect size. The probability of making a Type I error was set at p<0.05 for all statistical analyses. Where significance was shown in the 3×2 χ2 testing, a subsequent post hoc analysis was performed to compare between responsiveness criteria using a Bonferroni adjustment to protect against type 1 error with an established p-value of p<0.05/3 or 0.017.
Results
Establishment of site-specific TE
Table 2 shows the individual sex and group demographics, mean ± standard deviation of the averaged samples for each participant, and confidence intervals from an independent-samples t-test. Only height and absolute VO2max values were significantly different (p≤0.05) between men and women.
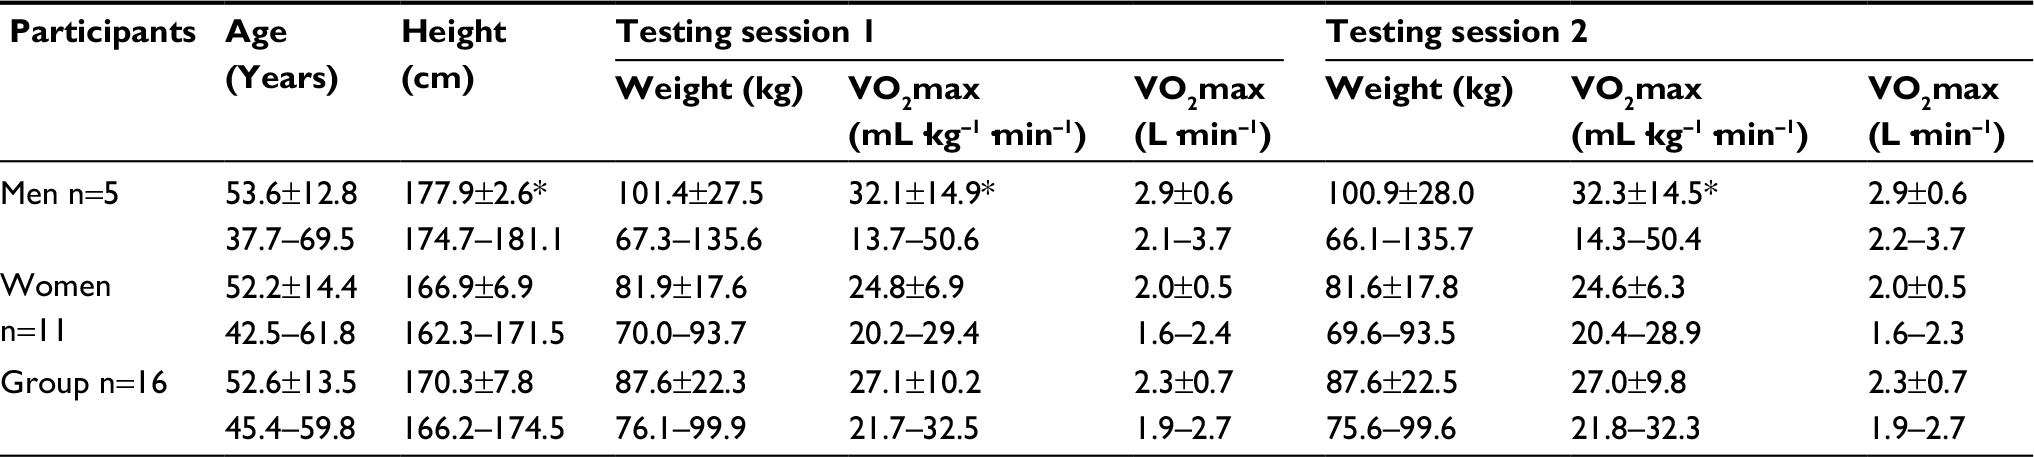 | Table 2 Participant demographics for anthropometric and CRF measurements for the development of a site-specific TE Notes: Descriptive statistics are reported as mean ± standard deviation and 95% confidence interval. *p≤0.05, significantly higher in men when compared to women. Abbreviations: CRF, cardiorespiratory fitness; TE, technical error; VO2max, maximal oxygen consumption. |
The typical error, ICC, and CV for relative VO2max were 1.12 mL·kg–1·min–1, 0.99, and 4.7%, respectively. The measurement error was 3.0% based on the manufacturer specifications (Parvo Medics) and a previous investigation comparing the aforementioned metabolic cart compared to the gold standard.21 TE was subsequently calculated by summing measurement error and biological variability:
TE = measurement error (3.0%) + biological variability (4.7%) TE =7.7%
A summary of the retrospective analysis of training responsiveness findings based on %Δ >0, %Δ > +5.6%, and the laboratory-specific TE (%Δ >+7.7%) can be found in Figure 1.
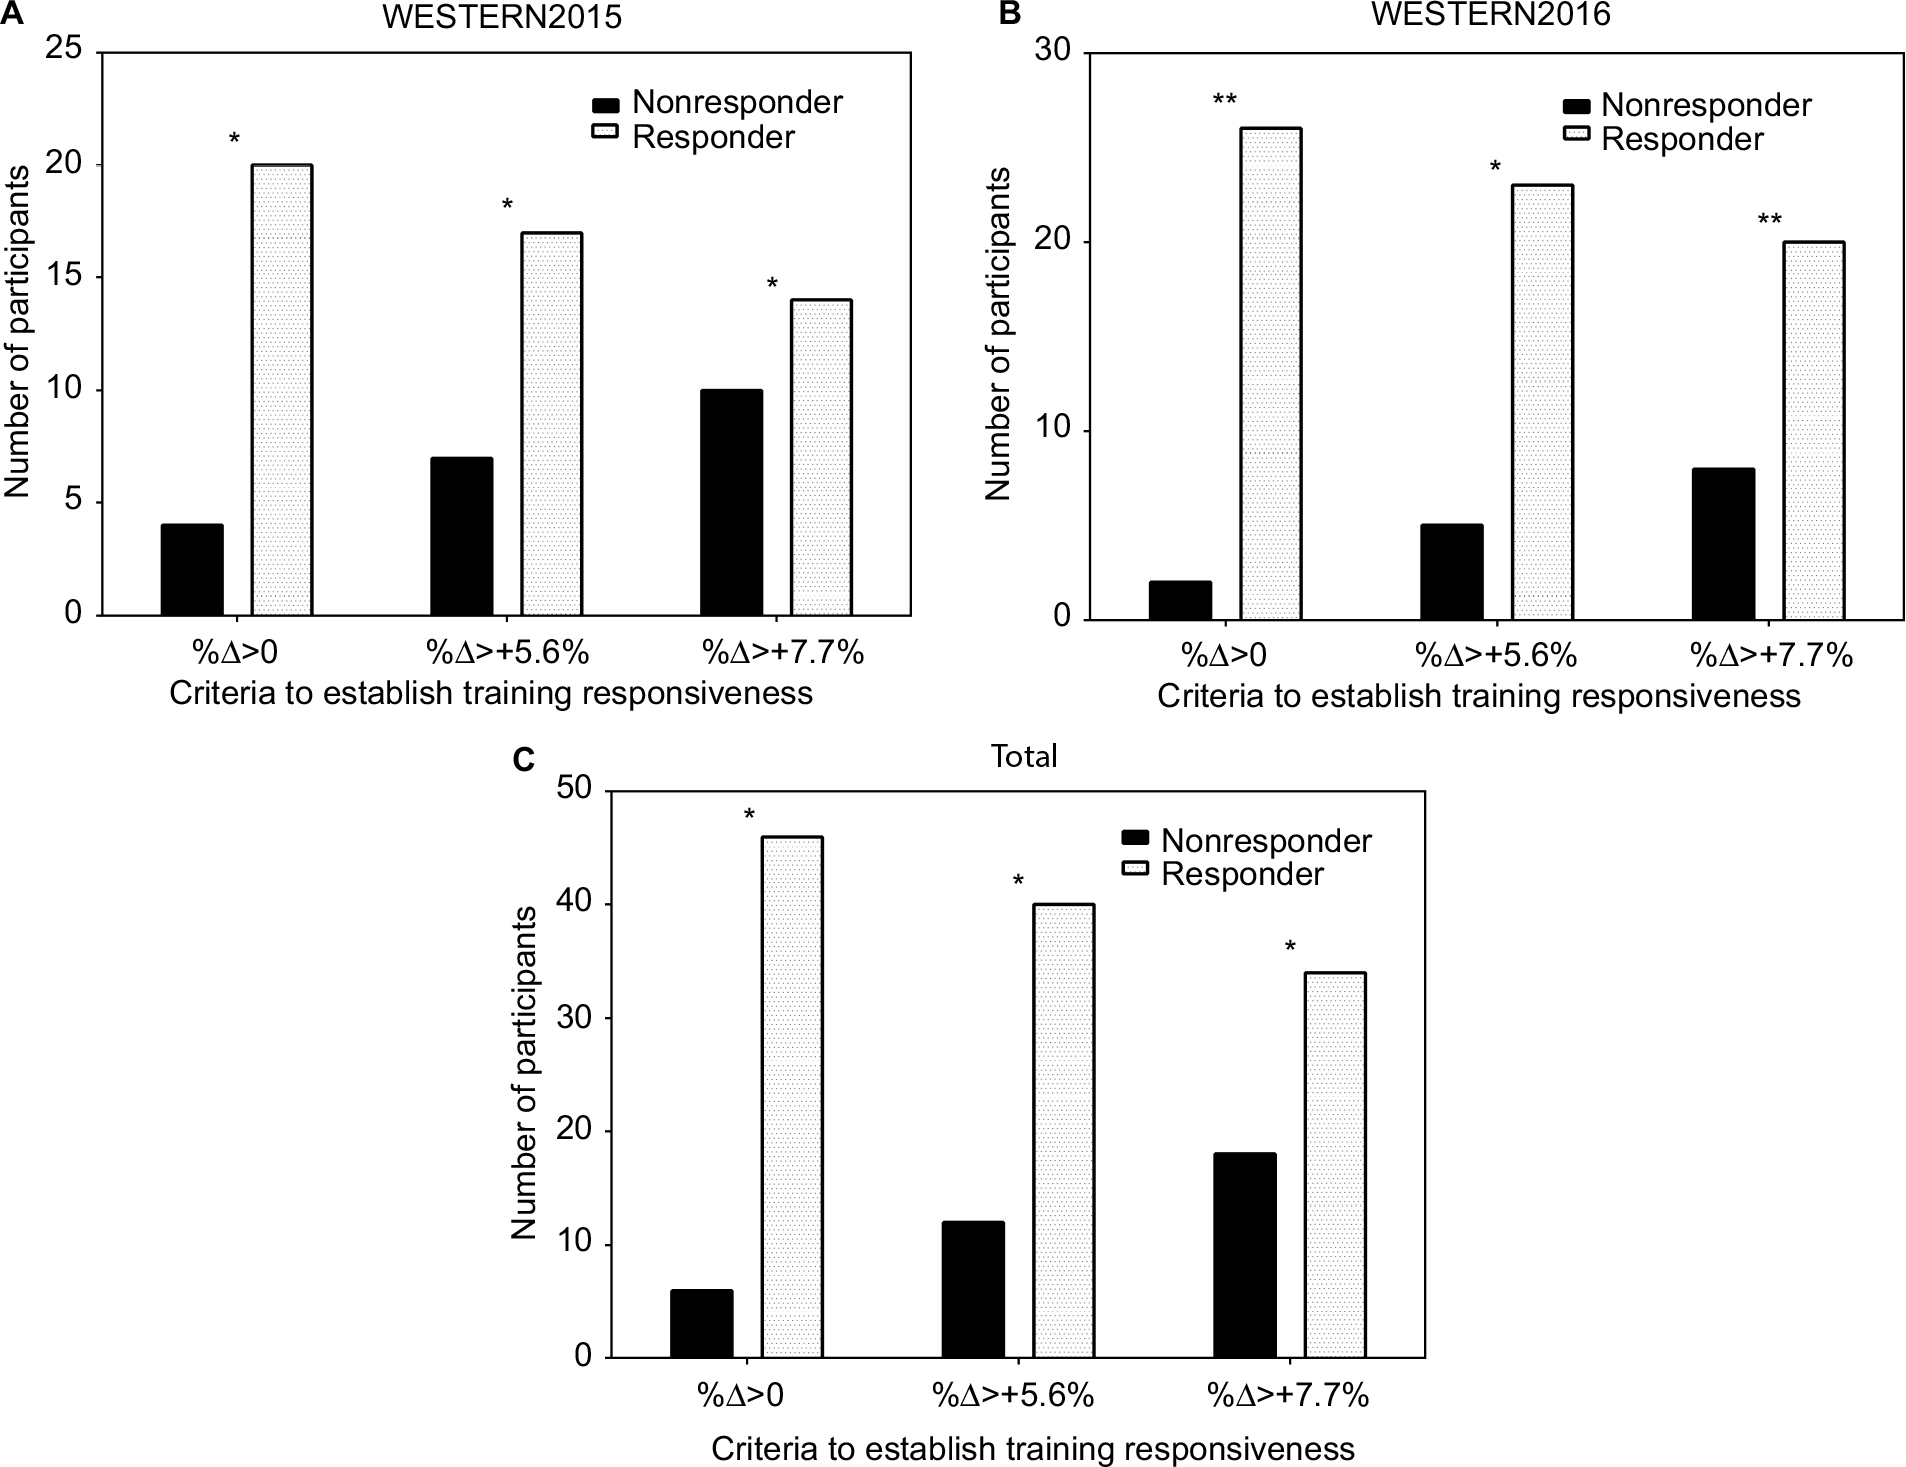 | Figure 1 Training responsiveness for two retrospectively analyzed interventions and combined analysis of interventions based on two commonly used criteria and a site-specific criterion (%Δ >+7.7%). Notes: (A) and (B) show retrospective data analysis of Wolpern et al13 and Dalleck et al,9 respectively, and (C) highlights the combined data pool from both investigations. Significant differences (p<0.017) were observed in all groups with an *representing significant difference between all criteria and **indicating only a significant difference between %Δ >+5.6% criteria, but not statistically different from %Δ >0% or %Δ >+7.7%. |
WESTERN2015 and WESTERN2016
The incidence of nonresponse for WESTERN2015 ranged from 16.7% to 41.7% depending on the criteria used. For each criteria, there was a nonresponse rate of 16.7%, 29.2%, and 41.7% for %Δ >0, %Δ >+5.6%, and %Δ >+7.7%, respectively. There was a significant interaction based on training responsiveness and the criteria used based on χ2 difference testing (p<0.05) with an effect size of 0.70. Based on the post hoc analysis, statistical significance (p<0.017) was shown between all groups: %Δ >0 and %Δ >+5.6% (p=0.001); %Δ >0 and %Δ >+7.7% (p=0.010); and %Δ >+5.6% and %Δ >+7.7% (p=2.0×10⁻⁴).
Similar results were found in the WESTERN2016 group with a range of nonresponse of 7.1% to 28.6% and a significant interaction based on the χ2 difference testing (p<0.05) and an effect size of 0.60. Specifically, there was a nonresponse rate of 7.1%, 17.9%, and 28.6% for %Δ >0, %Δ >+5.6%, and %Δ >+7.7%, respectively. The post hoc analysis showed statistical significance (p<0.017) between two of three groups: %Δ >0 and %Δ >+5.6% (p=0.002); and %Δ >+5.6% and %Δ >+7.7% (p=9.6×10⁻⁵). There was no statistically significant difference between %Δ >0 and %Δ >+7.7% (p=0.020).
Total
When evaluating responders and nonresponders of the combined interventions retrospectively analyzed according to the specific responsiveness criteria using χ2 difference testing, there were significant differences (p<0.05) in all responsiveness criteria with a large effect size of 0.66. The overall nonresponse rate of the combined interventions was 11.5%, 23.1%, and 34.6% for %Δ >0, %Δ >+5.6%, and %Δ >+7.7%, respectively. Statistical significance (p<0.017) was shown in the matched post hoc analyses between all groups: %Δ >0 and %Δ >+5.6% (p=0.001); %Δ >0 and %Δ >+7.7% (p=0.001); and %Δ >+5.6% and %Δ >+7.7% (p=0.001).
Discussion
The main purpose of this investigation was to establish a site-specific TE to identify training responsiveness and retrospectively analyze two previous investigations that used a sourced measurement to determine training responders and nonresponders and compare the results with the site-specific TE. Indeed, there were statistically significant differences between the percentage of training responders and nonresponders of two previously reported interventions depending on the responsiveness criteria used. This information provides further evidence of the need to establish guidelines for understanding the individual variability in training responsiveness. Our findings are also testimony to our conjecture on the importance of site-specific responsiveness criteria determination for greater sensitivity and specificity of the quantification of training induced adaptations. Such detail will provide better discriminative data and attenuate false-positive reporting.
We determined a site-specific TE for VO2max to establish the positive percent change needed to consider an exercise intervention as meaningful, or exceeding the biological variability and measurement error, which has recently become a method for reporting responsiveness.11,13 In the current investigation, there was a CV of 4.7% and a TE of 7.7% for VO2max between the two assessment occasions. Previously, Katch et al16 found a ±5.6% variance with 90% of the variation due to biological variability and 10% due to technological error. Similarly, Shephard et al24 found a 2 day CV for VO2max of 4.3% and a CV of 5.5% when measurement error was included from the HERITAGE study. Thus, the CV we found for VO2max was comparable to those previously reported. However, it is important to note that if the CV is used to establish criteria for responders and nonresponders in a training study, even a small difference might account for meaningfully different training responsiveness rates (ie, 4.7% compared to 4.3%). Therefore, we believe it is critical to establish a site-specific CV and TE whenever categorizing response rate in a training study rather than sourcing information from previous studies that may not directly reflect the specific environment of training and testing. Furthermore, this was the first investigation of biological variability, measurement error, and quantifying a TE for VO2max with the use of a verification protocol to confirm the attainment of VO2max. Verification testing is critical in establishing a “true” VO2max since the most commonly used criteria has been a plateau in VO2 with increasing intensity, but there is not a universally accepted criteria for a plateau.25 Therefore, the use of a verification bout confirms VO2max, which can then be used to determine true exercise intervention induced adaptations.
A recent investigation has implemented the use of TE to quantify response rate.26 However, the authors used the maximal wattage (Wmax) gained in a cycling test to volitional fatigue at baseline rather than VO2max to determine a TE threshold for responsiveness criteria. They ultimately found that CRF nonresponse could be mitigated if the exercise dose is increased. However, it should be noted that if they were to use VO2max and the associated TE rather than the TE of the Wmax, the results might have been interpreted differently. For example, they found that one group who exercised 4 days a week were all responders based on the TE of Wmax, but when analyzing the data based on the standard TE of 5% previously reported,24 3 of the 17 participants would have been categorized as nonresponders, which is comparable to previous rates of nonresponse.27 Furthermore, had Montero and Lundby26 calculated the specific cohort TE for VO2max, this value may have been higher than previous findings, similar to the results of the current investigation. Consequently, the incidence of nonresponse may have been even higher and included participants in the higher dose group, suggesting that in addition to exercise dose, responsiveness may also be partially influenced by the TE criterion.
In a recent review on the topic,28 a theoretical framework has been established to evaluate training responsiveness, but the methodology must include a comparator arm (ie, control group). With regular exercise having numerous health benefits, the use of a control group where exercise is either limited or prevented, may raise moral and ethical considerations. Therefore, the current study may provide a standard protocol to follow for future investigations that would be easy to administer and remove any ethical considerations of a control group being withheld from a known positive stimulus. Similarly, we believe that two baseline measurements are sufficient to calculate a TE and address the phenomenon of regression to the mean, which has been of high concern when calculating TEs, since the first two measurements (ie, two baseline measurements) have been shown to have the greatest effect in reducing the regression to the mean.29 Future research should investigate the efficacy of the current proposed development of the individualized TE compared to those outlined by Atkinson and Batterham.28
Limitations and strengths
The current study involved participants with a large age range (30–70 years) and may have possible heterogeneity due to age alone. However, the data may be more representative to a “real-world” scenario. Furthermore, a priori power calculation was not performed to ensure a sufficient amount of participants were included due to the preliminary and explorative nature of the study and the limited amount of previous research on the topic. Next, the population used to calculate the site-specific TE was not the same population in WESTERN2015 and WESTERN2016. However, all three of the groups were close in individual characteristics, and all participants completed the exercise testing/interventions in the same laboratory. Lastly, this investigation assumes that the site-specific TE is the same at baseline as it is at posttesting. Future research should aim to investigate whether or not TE remains consistent throughout the entirety of a training intervention.
Conclusion
The current study is the first to calculate a TE for VO2max with a verification bout and establish a site-specific TE to use as a metric to quantify training responsiveness. The methods of this study are both novel and timely to implement at baseline of an exercise intervention. Therefore, we recommend future investigations incorporate two or more baseline measurements to develop a site-specific TE to use when quantifying training responsiveness. Similar to an exercise prescription, methods to quantify training response must be individualized based on the cohort and laboratory and not follow a ‘one-size fits all’ model. Furthermore, future research should investigate the use of a truly individualized TE to establish responsiveness (ie, each participant would have a unique TE based on their multiple baseline testing measurements).
Author contributions
All authors contributed toward data analysis, drafting and revising the paper and agree to be accountable for all aspects of the work.
Disclosure
The authors report no conflicts of interest in this work.
References
Chau JY, Grunseit AC, Chey T, et al. Daily sitting time and all-cause mortality: a meta-analysis. PLoS One. 2013;8(11):e80000. | ||
Lavie CJ, Arena R, Swift DL, et al. Exercise and the cardiovascular system: clinical science and cardiovascular outcomes. Circ Res. 2015;117(2):207–219. | ||
Barry VW, Baruth M, Beets MW, Durstine JL, Liu J, Blair SN. Fitness vs. fatness on all-cause mortality: a meta-analysis. Prog Cardiovasc Dis. 2014;56(4):382–390. | ||
Franklin BA, Lavie CJ, Squires RW, Milani RV. Exercise-based cardiac rehabilitation and improvements in cardiorespiratory fitness: implications regarding patient benefit. Mayo Clin Proc. 2013;88(5):431–437. | ||
Swift DL, Lavie CJ, Johannsen NM, et al. Physical activity, cardiorespiratory fitness, and exercise training in primary and secondary coronary prevention. Circ J. 2013;77(2):281–292. | ||
Vuori IM, Lavie CJ, Blair SN. Physical activity promotion in the health care system. Mayo Clin Proc. 2013;88(12):1446–1461. | ||
Garber CE, Blissmer B, Deschenes MR, et al. Quantity and quality of exercise for developing and maintaining cardiorespiratory, musculoskeletal, and neuromotor fitness in apparently healthy adults: guidance for prescribing exercise. Med Sci Sports Exerc. 2011;43(7):1334–1359. | ||
Bouchard C, Rankinen T. Individual differences in response to regular physical activity. Med Sci Sports Exerc. 2001;33(S6):S446–S451. | ||
Dalleck LC, Haney DE, Buchanan CA, Weatherwax RM. Does a personalised exercise prescription enhance training efficacy and limit training unresponsiveness? A randomised controlled trial. J Fit Res. 2016;5(3):15–27. | ||
Lortie G, Simoneau J, Hamel P, Boulay M, Landry F, Bouchard C. Responses of maximal aerobic power and capacity to aerobic training. Int J Sports Med. 1984;5(5):232–236. | ||
Scharhag-Rosenberger F, Walitzek S, Kindermann W, Meyer T. Differences in adaptations to 1 year of aerobic endurance training: individual patterns of nonresponse. Scand J Med Sci Sports. 2012;22(1):113–118. | ||
Sisson SB, Katzmarzyk PT, Earnest CP, Bouchard C, Blair SN, Church TS. Volume of exercise and fitness non-response in sedentary, postmenopausal women. Med Sci Sports Exerc. 2009;41(3):539–545. | ||
Wolpern AE, Burgos DJ, Janot JM, Dalleck LC. Is a threshold-based model a superior method to the relative percent concept for establishing individual exercise intensity? A randomized controlled trial. BMC Sports Sci Med Rehab. 2015;7(1):1–9. | ||
Bouchard C, Blair SN, Church TS, et al. Adverse metabolic response to regular exercise: is it a rare or common occurrence? PLoS One. 2012;7(5):e37887. | ||
Mann TN, Lamberts RP, Lambert MI. High responders and low responders: factors associated with individual variation in response to standardized training. Sports Med. 2014;44(8):1113–1124. | ||
Katch VL, Sady SS, Freedson P. Biological variability in maximum aerobic power. Med Sci Sports Exerc. 1982;14(1):21–25. | ||
Weatherwax RM, Harris NK, Kilding AE, Dalleck LC. The incidence of training responsiveness to cardiorespiratory fitness and cardiometabolic measurements following individualized and standardized exercise prescription: study protocol for a randomized controlled trial. Trials. 2016;17(1):601. | ||
Dalleck LC, Astorino TA, Erickson RM, McCarthy CM, Beadell AA, Botten BH. Suitability of verification testing to confirm attainment of VO2max in middle-aged and older adults. Res Sports Med. 2012;20(2):118–128. | ||
Weatherwax R, Richardson T, Beltz N, Nolan P, Dalleck L. Verification testing to confirm VO2max in altitude-residing, endurance-trained runners. Int J Sports Med. 2016;37(7):525–530. | ||
Hopkins WG. Measures of reliability in sports medicine and science. Sports Med. 2000;30(1):1–15. | ||
Bassett DR, Howley ET, Thompson DL, et al. Validity of inspiratory and expiratory methods measuring gas exchange with a computerized system. J Appl Physiol. 2001;91(1):218–224. | ||
Chmelo EA, Crotts CI, Newman JC, et al. Heterogeneity of physical function responses to exercise training in older adults. J Am Geriatr Soc. 2015;63(3):462–469. | ||
Hautala AJ, Kiviniemi AM, Mäkikallio TH, et al. Individual differences in the responses to endurance and resistance training. Eur J Appl Physiol. 2006;96(5):535–542. | ||
Shephard RJ, Rankinen T, Bouchard C. Test-retest errors and the apparent heterogeneity of training response. Eur J Appl Physiol. 2004;91(2):199–203. | ||
Astorino T, White A, Dalleck L. Supramaximal testing to confirm attainment of VO2max in sedentary men and women. Int J Sports Med. 2009;30(4):279–284. | ||
Montero D, Lundby C. Refuting the myth of non-response to exercise training: “non-responders” do respond to higher dose of training. J Physiol. 2017;595(11):3377–3387. | ||
Timmons JA, Knudsen S, Rankinen T, et al. Using molecular classification to predict gains in maximal aerobic capacity following endurance exercise training in humans. J Appl Physiol. 2010;108(6):1487–1496. | ||
Atkinson G, Batterham AM. True and false interindividual differences in the physiological response to an intervention. Exp Physiol. 2015;100(6):577–588. | ||
Barnett AG, van der Pols JC, Dobson AJ. Regression to the mean: what it is and how to deal with it. Int J Epidemiol. 2005;34(1):215–220. |
 © 2018 The Author(s). This work is published and licensed by Dove Medical Press Limited. The
full terms of this license are available at https://www.dovepress.com/terms
and incorporate the Creative Commons Attribution
- Non Commercial (unported, 3.0) License.
By accessing the work you hereby accept the Terms. Non-commercial uses of the work are permitted
without any further permission from Dove Medical Press Limited, provided the work is properly
attributed. For permission for commercial use of this work, please see paragraphs 4.2 and 5 of our Terms.
© 2018 The Author(s). This work is published and licensed by Dove Medical Press Limited. The
full terms of this license are available at https://www.dovepress.com/terms
and incorporate the Creative Commons Attribution
- Non Commercial (unported, 3.0) License.
By accessing the work you hereby accept the Terms. Non-commercial uses of the work are permitted
without any further permission from Dove Medical Press Limited, provided the work is properly
attributed. For permission for commercial use of this work, please see paragraphs 4.2 and 5 of our Terms.