Back to Journals » International Journal of General Medicine » Volume 15
Using a Machine Learning Approach to Identify Key Biomarkers for Renal Clear Cell Carcinoma
Received 16 December 2021
Accepted for publication 15 March 2022
Published 30 March 2022 Volume 2022:15 Pages 3541—3558
DOI https://doi.org/10.2147/IJGM.S351168
Checked for plagiarism Yes
Review by Single anonymous peer review
Peer reviewer comments 2
Editor who approved publication: Dr Scott Fraser
Xiaying Han,1,2 Dianwen Song1
1Department of Orthopedics, Shanghai General Hospital, Shanghai Jiaotong University School of Medicine, Shanghai, 200080, People’s Republic of China; 2Shanghai Bone Tumor Institution, Shanghai General Hospital, Shanghai Jiaotong University School of Medicine, Shanghai, 200080, People’s Republic of China
Correspondence: Dianwen Song, Email [email protected]
Background: The most common and deadly subtype of renal carcinoma is kidney renal clear cell carcinoma (KIRC), which accounts for approximately 75% of renal carcinoma. However, the main cause of death in KIRC patients is tumor metastasis. There are no obvious clinical features in the early stage of kidney cancer, and 25– 30% of patients have already metastasized when they are first diagnosed. Moreover, KIRC patients whose local tumors have been removed by nephrectomy are still at high risk of metastasis and recurrence and are not sensitive to chemotherapy and radiotherapy, leading to poor prognosis. Therefore, early diagnosis and treatment of this disease are very important.
Methods: KIRC-related patient datasets were downloaded from the GEO database and TCGA database. DEG screening and GO, KEGG, and GSEA enrichment analysis was firstly conducted and then the LASSO and support vector machine (SVM) RFE algorithms were adopted to identify KIRC-associated key genes in training sets and validate them in the test set. The clinical prognostic analysis including the association between the expression of key genes and the overall survival, stage, grade across KIRC, the immune infiltration difference between normal samples and cancer samples, the correlation between the key genes and immune cells, immunomodulator, immune subtypes of KIRC were investigated in this research.
Results: We finally screened out 4 key genes, including ACPP, ANGPTL4, SCNN1G, SLC22A7. The expression of key genes show difference among normal samples and tumor samples, SCNN1G and SLC22A7 could be predictor of prognosis of patients. The expression of key genes was related with the abundance of tumor infiltration immune cells and the gene expression of immune checkpoint.
Conclusion: This study screened the 4 key genes, which contributed to early diagnosis, prognosis assessment and immune target treatment of patients with KIRC.
Keywords: renal clear cell carcinoma, machine learning, biomarkers, prognosis, treatment
Introduction
The incidence of kidney cancer is increasing year by year, and it has reached 0.149% (95% CI: 0.144–0.153%) in 2018. The 5-year conditional relative survival rates were only 75.8% (95% CI: 75.5–76%), indicating a high mortality rate from this disease (SEER http://seer.cancer.gov/statfacts/html/kidrp.html). The most common and deadly subtype of renal carcinoma is KIRC, which accounts for approximately 75% of renal carcinoma.1,2 The main cause of death in patients with KIRC is tumor metastasis.3 There are no obvious clinical features in the early stage of kidney cancer, and 25–30% of patients have already metastasized when they are first diagnosed.4–6 KIRC patients whose local tumors have been removed by nephrectomy are still at high risk of metastasis and recurrence and are not sensitive to chemotherapy and radiotherapy, leading to poor prognosis.7–9 Therefore, early diagnosis and treatment of this disease are very important. Besides, understanding key genetic drivers for progression can help to develop new treatments.10
The rapid development of bioinformatics helps to screen out the characteristic genes of diseases using data from public databases.11–13 However, few studies have used two well-known machine learning algorithms at the same time, LASSO model and SVM-RFE algorithms, to identify biomarkers of KIRC. LASSO analysis, as regression analysis method, was to perform variable selection and regularization while fitting a generalized linear model, the variable selection was to selectively put variables into the model to get better performance parameters and selectively put variables into the model to get better performance parameters, regularization refers to controlling the complexity of the model through a series of parameters λ to avoid overfitting.14,15 SVM was a generalized linear classifier (generalized linear classifier) that performed binary classification of data in a supervised learning manner, which maximized the margin between different classes in a high-dimensional space.13,16 Here, the two machine learning algorithms were used to recognize diagnostic biomarkers data of KIRC and predicted the accurately and interpretable models.
Herein, four open access KIRC-related patient datasets from the GEO database and one dataset from TCGA dataset were downloaded. DEG screening and GO, KEGG, DO and GSEA enrichment analysis was firstly conducted and then LASSO and SVM-RFE algorithms were adopted to identify KIRC-associated key genes in training sets and validate them in the test set. The clinical prognostic analysis including the association between the expression of key genes and the overall survival, stage, grade across KIRC, the immune infiltration difference between normal samples and cancer samples, the correlation between the key genes and immune cells, immunomodulator, immune subtypes of KIRC were investigated in this research, which could provide new guidance for cancer diagnosis.
Materials and Methods
Data Collection and Download
The data sets were collected using the search term “clear cell renal cell carcinoma” as the keyword, with the search scope limited to “Homo sapiens” in GEO (Gene Expression Omnibus) database (http://www.ncbi.nlm.nih.gov/geo/),17 including KIRC samples and normal samples. After exclusion and screening, GSE6344, GSE40435, GSE781, GSE53757 datasets were included in the study. Besides, for screening biomarkers of early stages of patients with KIRC, another dataset of KIRC was obtained from TCGA datasets (The Cancer Genome Atlas, https://portal.gdc.cancer.gov/) called TCGA_KIRC. Among them, samples of patient with KIRC in early stage (including stage I and II) have been preserved and both normal and cancer samples of patients with KIRC in advanced stages (including stage III and IV) were removed. The basic clinical information has been collected. Log2 in the R software was used to correct and normalize the original data of the datasets.18–21
Data Preprocessing and DEG Screening
The dataset format from TCGA was adjusted from fpkm to tpm which was more similar to the format of GEO chip data. The original datasets were corrected, including probe matrix and human genome array. The expression matrix was extracted using perl software and the expression matrix of GSE6344, GSE40435, GSE781, TCGA_KIRC datasets was merged using Limma and sva software package.22 And the Limma software package was also used to eliminate the differences between batches. The differences of gene expression profiles among GSE6344, GSE40435, GSE781, TCGA_KIRC datasets were analyzed by using dplyr, ggplot2, ggrepel.21 The genes with too low expression value were deleted and the expression profile value was converted to log2-counts per million (logCPM), and the comparison matrix was constructed by performing linear regression. Where each row represented the gene names and each column represented the sample name of this study. The eligible differential genes were screened for |log2(FC)| > 2 and P value < 0.05 based on Bayesian calculation of T-values, F-values and log-odds, and volcano plots was plotted by using the ggplot2 program package to visualize the data.22,23
GO, KEGG and GSEA Enrichment Analysis
Gene Ontology (GO) analysis, Kyoto Encyclopedia of Genes and Genomes (KEGG) analysis, Disease Oncology (DO) analysis and Gene Set Enrichment Analysis (GSEA) were calculated by using the R package Clusterprofiler program.24 P value < 0.05 was considered significant, and gene counting the identified significant analysis were classified.
Screening and Identification of Gene Prediction Model for Early Diagnosis
The data of GSE6344, GSE40435, GSE781, TCGA_KIRC were selected as the training set, GSE53757 data was used as the test set. The glmnet package was used as the binomial LASSO model of the training set.25 The operating characteristic curve of the recipient was plotted and its AUC was calculated. The pROC software package in R was used to evaluate the diagnostic value of hub genes.26 SVM is a generalized linear classifier (generalized linear classifier) that performs binary classification of data in a supervised learning manner, which maximized the margin between different classes in a high-dimensional space.27 The e1071, kernlab and caret package were used to eliminate the recursive features of the difference genes obtained, and data calculation, finally the best gene signature was obtained. The two machine learning algorithms were used to screen the hub genes of KIRC at the same time and the same key genes were obtained by using venn package of R. Then difference analysis of key genes was performed in the test set using limma package of R. Besides, a receiver operating characteristic (ROC) curve was constructed, and AUC value was calculated to estimate the predictive value of the model both in the training set and test set.
Clinical Prognostic Analysis
The TISIDB website (http://cis.hku.hk/TISIDB/) was used to analyze associations between key genes expression overall survival, stage, grade across KIRC.
The Analysis of Immune Cell Infiltration
We conducted the correlation analysis of immune cells, assessed the proportion of immune cells in renal clear cell carcinoma tissues and normal tissues by Cibersort analysis.22,28–32 This revealed the characteristics of renal clear cell carcinoma immune cell infiltration by heat mapping using ggplot2. Among them, we conducted a correlation analysis between the hub genes that were screened out and immune cells.
Immune Subtype Analysis
Tumor microenvironment (TME) had importantly therapeutic and prognostic significance in antitumor therapy. Based on five representative immune signals, the researchers identified six immune subtypes of TCGA tumors, which provided resources for the analysis of TME in some specific tumors. Six stable and repeatable immune subtypes were classified according to five immune expression characteristics:33 macrophages/monocytes,34 total lymphocyte infiltration (mainly T and B cells),35 TGF-β response,36 IFN-γ response37 and wound healing.38 And the six subtypes may play a key role in predicting disease outcomes, rather than relying solely on the characteristics of individual cancer types.33 In order to detect the mRNA expression levels of key genes of six different immune subtypes in TCGA tumor types, we used Kruskal test for differential expression analysis.
Immune Checkpoint Gene Analysis
The TISIDB website (http://cis.hku.hk/TISIDB/) was used to analyze associations between key genes expression and the gene expression of the immune checkpoint.
Result
Data Preprocessing and the Screening of Differential Genes
The flowchart of this study was shown in Figure 1. After gene annotation and standardization of the data, GSE40435 dataset contains 138 samples (31,280 genes), GSE6344 dataset contains 40 samples (GSE6344_GPL96 contains 12,548 genes, GSE6344_GPL97 contains 10,603 genes), GSE781 data set contains 29 samples (GSE781_GPL96 contains 12,548 genes, GSE781_GPL97 contains 10,603 genes), GSE53757 dataset contains 86 samples (20,109 genes). TCGA_KIRC dataset contains 583 samples (56,536 genes). The basic clinical information was shown in Table 1. People diagnosed with age over 60 accounted for 52.08% of the total, people diagnosed with age over 60 accounted for 52.08% of the total. A whole-gene expression profile analysis of the combined data was shown in Figure 2A which was the differentially expressed genes (DEGs) expression heat map. Figure 2B showed the subsequent differential analysis and volcano mapping of counts genes in patient tissue and normal tissue samples. A total of 25 DEGs were screened out, including 1 upregulated gene and 24 down-regulated genes.
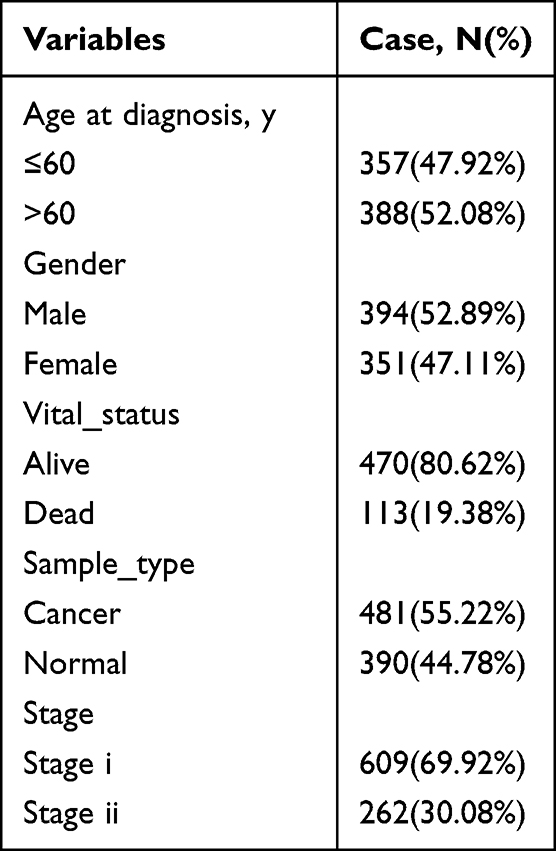 |
Table 1 The Basic Clinical Information of Included Studies |
 |
Figure 1 The flowchart of this study. |
 |
Figure 2 The gene differential expression analysis of GSE6344, GSE40435, GSE781, TCGA_KIRC data set. (A) Whole gene expression heat map of normal tissues and cancer tissues with high expression in red and low expression in blue, with clinical information (B) the DEG Volcano map shows upregulated genes in red and down-regulated genes in green. |
GO, KEGG and GSEA Enrichment Analysis of Differential Genes
GO, KEGG, DO and GSEA enrichment analysis were carried out based on the obtained DEGs using the clusterProfiler package. The results showed that the biological processes (BP) of DEGs were mainly related to organic anion transport, dicarboxylic acid transport, sodium ion transport, vascular process in circulatory system and other pathways. In terms of cell composition (CC), it was mainly related to basolateral plasma membrane, basal plasma membrane, basal part of cell, collagen−containing extracellular matrix and so on. In terms of molecular function (MF), it was mainly related to active ion transmembrane transporter activity, secondary active transmembrane transporter activity, anion transmembrane transporter activity, sodium ion transmembrane transporter activity and so on (Figure 3A and B). The DEGs were mainly concentrated in neuroactive ligand−receptor interaction, complement and coagulation cascades, bile secretion, influenza A in the KEGG pathway rich concentration (Figure 4A and B). The GSEA enrichment analysis showed that organic acid catabolic process, organic acid metabolic process, small molecule metabolic process, transmembrane transport, ion transmembrane transporter activity, cell activation, lymphocyte activation, response to virus, T cell activation were mainly active in cancer samples (Figure 5A and B).
 |
Figure 3 Barplot (A) and bubble plot (B) figures of GO enrichment analysis of 25 differential genes gotten from DEG screening. |
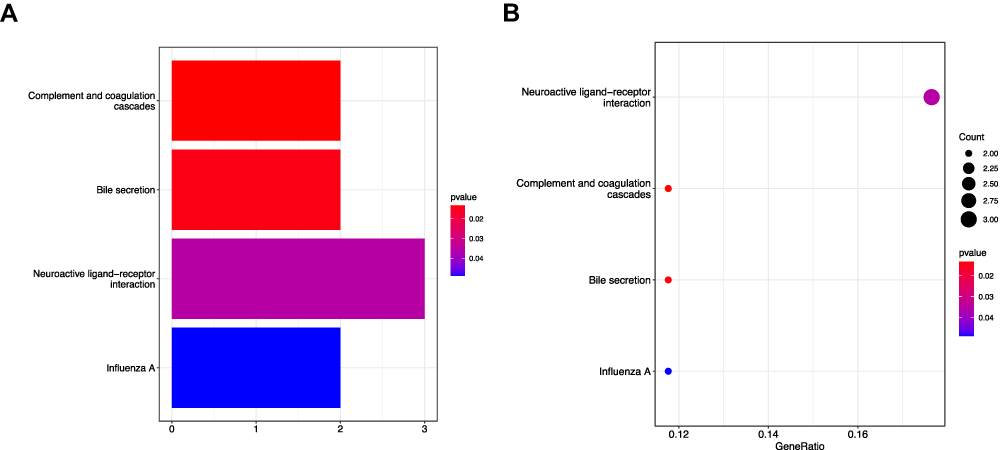 |
Figure 4 Barplot (A) and bubble plot (B) figures of KEGG enrichment analysis of 25 differential genes gotten from DEG screening. |
 |
Figure 5 Figures of GSEA enrichment analysis in normal tissues (A) and cancer tissues (B). |
Screening and Identification of Gene Prediction Model for Early Diagnosis
The data of GSE6344, GSE40435, GSE781, TCGA_KIRC were selected as the training set, GSE53757 data was used as the test set. The hub genes that can predict early KIRC accurately was obtained by constructing the LASSO model in the training set and selecting the min valve to screen (Figure 6A). At the same time, we used SVM-RFE algorithm to screen 25 different genes and obtained 8 hub genes (Figure 6B). Then we got four key genes by taking the intersection of the genes obtained by these two algorithms, including ACPP, SCNN1G, ANGPTL4, SLC22A7 (Figure 7A). We performed difference analysis of key genes in the test set, it suggested that the expression of ANGPTL was higher in cancer samples compared to normal samples, the expression of ACPP, SCNN1G, SLC22A7 was lower in cancer samples compared to normal samples, which was consistent with the expression pattern of the training set (Figure 7B–E). A receiver operating characteristic (ROC) curve was constructed, and AUC value was calculated to evaluate the predictive value of the model both in the training set and test set. The results showed that the AUC of ACPP, ANGPTL4, SCNN1G, SLC22A7 in the training set respectively are 0.937, 0.947, 0.923, 0.839 (Figure 8A–D), and the AUC of ACPP, ANGPTL4, SCNN1G, SLC22A7 in the test set is 0.965, 0.983, 0.961, 0.957, indicating that the built model owned excellent verification performance (Figure 8E–H).
 |
Figure 6 The potential key genes of KIRC were screened by LASSO regression model and SVM-RFE using training set. (A) LASSO regression model screened the potential key genes of KIRC. The X-axis represented the λ value, the Y-axis represented the cross-validation error. N=10 represented that 10 key genes were screened. (B) SVM-RFE algorithm screened the potential key genes. The X-axis represented the λ value, the Y-axis represented the cross-validation error. N=8 represented that 8 key genes were screened. |
 |
Figure 7 The intersection hub genes of the two algorithm (A) and each gene differential analysis in normal and cancer tissues, including ACPP (B), ANGPTL4 (C), SCNN1G (D), SLC22A7 (E). |
 |
Figure 8 ROC curves of training set and test set for gene signature. ACPP (A), ANGPTL4 (B), SCNN1G (C), SLC22A7 (D) in training set, ACPP (E), ANGPTL4 (F), SCNN1G (G), SLC22A7 (H) in test set. |
Clinical Prognostic Analysis
The clinical prognostic analysis showed that patient with low SCNN1G expression had higher overall survival and the higher the tumor stage and grade, the higher SCNN1G expression level (p<0.05). Patient with high SLC22A7 expression had higher overall survival and the higher the tumor stage, the lower SCNN1G expression level (p<0.05). The expression of other genes has no obvious relationship with the prognosis (Figure 9).
 |
Figure 9 Clinical prognostic analysis including the association between the expression of key genes including ACPP, ANGPTL4, SCNN1G, SLC22A7 and the overall survival, stage, grade across KIRC. |
The Analysis of Immune Cell Infiltration
The correlation analysis of immune cells showed that NK cells resting had a negative correlation with NK cells activated (R=−0.34), Monocyte had a negative correlation with macrophage M2 (R=−0.63), neutrophils (R=−0.34), plasma cells had a negative correlation with dendritic cells resting (R=−0.3), macrophage M2 (R=−0.3), T cells CD4 memory activated had a negative correlation with T cells regulatory (Treg) (R=−0.43), NK cells activated (R=−0.4), T cells CD4 memory resting (R=−0.33), had a positive correlation with dendritic cells activated (R=0.33), macrophage M0 had a negative correlation with dendritic cells resting (R=−0.44) (Figure 10A). The relative percentage of 22 immune cell subsets result showed that macrophages M2, NK cells, T cells accounted for the most whether in tumor samples nor normal samples (Figure 10B). The result of immune infiltration difference between normal samples and cancer samples showed that normal samples had more neutrophils, T cells CD4 memory resting (P<0.05) (Figure 10C). The correlation analysis result between the key genes and immune cells showed that the expression of ACPP had a positive correlation with eosinophils (R=0.33, P<0.05), macrophage M2 (R=0.26, P<0.05), had a negative correlation with NK cells resting (R=−0.25, P<0.05), the expression of ANGPTL4 had a positive correlation with monocytes (R=0.28, P<0.05), plasma cells (R=0.2, P<0.05), had a negative correlation with macrophages M2 (R=−0.31, P<0.05), neutrophils (R=−0.2, P<0.05), the expression of SCNN1G had a positive correlation with neutrophils (R=0.2, P<0.05), the expression of SLC22A7 had a positive correlation with T cells CD4 memory resting (R=0.2, P<0.05) (Figures 11 and 12).
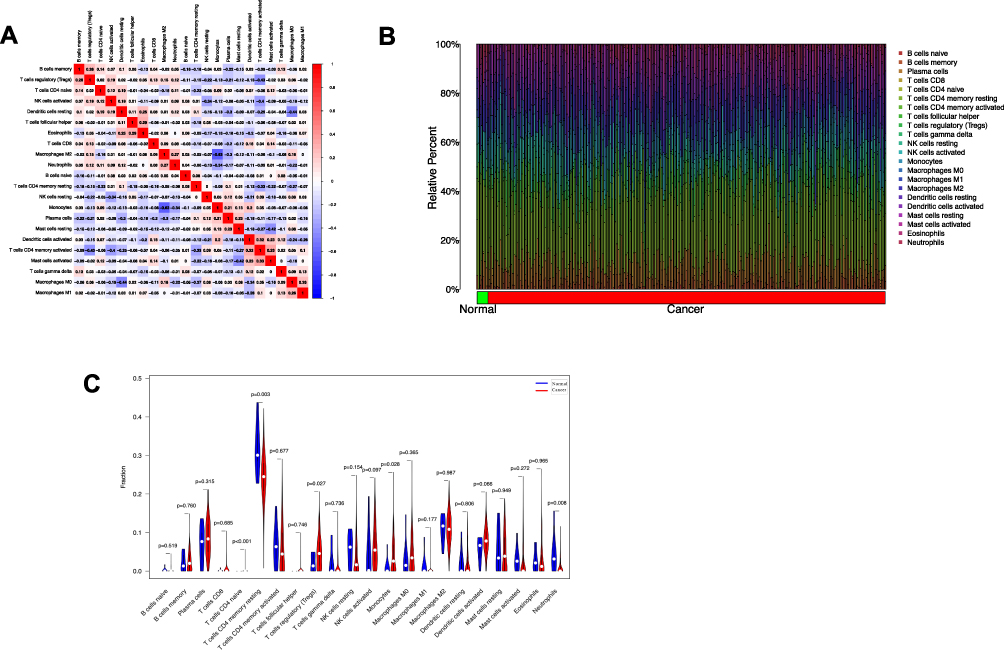 |
Figure 10 (A) The correlation among immune cells of the samples in the training set. (B) Relative percentage of 22 immune cell subsets in normal samples and cancer samples. (C) Vioplot diagram of immune infiltration difference between normal samples and cancer samples, green as normal samples, red as cancer samples. |
 |
Figure 11 Lollipop figures of the correlation between the key genes including ACPP (A), ANGPTL4 (B), SCNN1G (C), SLC22A7 (D) and immune cells using the training set. The P value in Y-axis <0.05 was marked in red. |
 |
Figure 12 Scatter plot of the correlation between key gene expressions and immune cells using the training set. |
The Immune Subtype Analysis
We used Kruskal–Wallis test to analyze the mRNA expression of key genes in 6 immune subtypes of KIRC. The expression levels in C1-C6 of ACPP (p<0.05), ANGPTL4 (p<0.05), SLC22A7 (p<0.05), SCNN1G (p<0.05) were with significant statistical difference (Figure 13). Obviously, the expression of ANGPTL4 ranked the first among the five groups and was the lowest in the C5 subtype among the six subtypes (p<0.05). The expression of ACPP was the highest in the C5 subtype among the six subtypes (p<0.05). The expression of SLC22A7 and SCNN1G were the lowest in the C5 subtype among the six subtypes (p<0.05).
 |
Figure 13 Kruskal test analysis of key gene expression levels in immune subtypes of KIRC using TISIDB website. |
The Immune Checkpoint Related Genes Analysis
The results of the immune checkpoint related genes analysis were shown in Figure 14 and 15. The gene expression of ACPP was positively correlated with the expression of most immune checkpoint genes such as BTLA (R=0.333, p<0.05), IL10 (R=0.373, p<0.05), CSF1R (R=0.535, p<0.05), PDCD1LG2 (R=0.355, p<0.05), TGFBR1 (R=0.33, p<0.05), TNFRSF8 (R=0.322, p<0.05), TNFSF13B (R=0.473, p<0.05), CD80 (R=0.369, p<0.05), CD86 (R=0.502, p<0.05), CD48 (R=0.311, p<0.05), CD28 (R=0.35, p<0.05), HLA_DPA1 (R=0.368, p<0.05), HLA_DPB1 (R=0.355, p<0.05), HLA_DQA1 (R=0.311, p<0.05), HLA_DRA (R=0.401, p<0.05). The gene expression of ANGPTL4 was positively correlated with the expression of most immune checkpoint genes such as PTNFRSF4 (R=0.383, p<0.05), TNFRSF14 (R=0.315, p<0.05), CD40 (R=0.327, p<0.05), CD70 (R=0.354, p<0.05), negatively correlated with the expression of some immune checkpoint genes such as TGFBR1 (R=−0.307, p<0.05), TNFSF15 (R=−0.453, p<0.05). The gene expression of SLC22A7 was positively correlated with the expression of most immune checkpoint genes such as HHLA2 (R=0.599, p<0.05). The gene expression of SCNN1G was positively correlated with the expression of most immune checkpoint genes.
 |
Figure 14 The correlation analysis between key genes expression and immune checkpoint genes’ expression using TISIDB website. |
 |
Figure 15 The scatter plots of key genes expression and immune checkpoint genes’ expression using TISIDB website. |
Discussion
In this study, DEG screening and GO, KEGG and GSEA enrichment analysis was firstly conducted and then the LASSO and SVM-RFE algorithms were further employed to screen out KIRC-associated hub genes in the training set and validate them in the test set. As we know, this was the first study combining LASSO and SVM-RFE algorithm to identify key biomarkers of KIRC. A total of 25 DEGs were screened out, including 1 upregulated gene and 24 downregulated genes. KEGG pathway analysis showed that 25 DEGs were significantly associated with complement and coagulation cascades. Complement and coagulation cascades were vicious cycle which were mutually induced and they can prevent immune cells from attacking cancer cells, promote immune escape, thus inducing tumor progression and metastasis.39,40 GSEA enrichment analysis showed that lymphocyte activation and T cell activation was active in cancer group, suggesting that immune treatment might be effective.
In this study, we finally screened out 4 key genes, including ACPP, ANGPTL4, SCNN1G, SLC22A7. The AUC values of the 4 key genes in the test set were >0.95 but could only reach about 0.9 in the training set, indicating that the built model had excellent verification performance but generalization performance need to be perfected. ACPP, the prostatic acid phosphatase, was capable of dephosphorylating substrates including alkyl, aryl, and acyl orthophosphate monoesters and phosphorylated proteins when the pH of the conditions was 4–6. It dephosphorylated ERBB2 and deactivated MAPK-mediated signaling to act as the tumor suppressor of prostate cancer (http://cis.hku.hk/TISIDB/browse.php?gene=ACPP). Its expression was downloaded in the tumor samples compared to the normal samples in our study. And its expression was positively correlated with expressions of most immune checkpoint gene expression. Novel immune checkpoints, including CTLA-4, PD-1, and their ligands, programmed death-ligand 1 (PD-L1 (CD274)) and PD-L2 (CD273), provided more therapeutic options for cancer treatment,41 and their inhibitors significantly prolonged the overall survival (OS) of cancer patients.42 However, the objective response rate of ICIs therapy was only ~17%, indicating that a majority of patients fail to benefit from ICIs treatment.43,44 Thus, there was a large unmet clinical need to identify the appropriate patients who may respond to ICIs therapy. Therefore, patients with high expression of ACPP might be more sensitivity to ICIs. The expression of ACPP was positively correlated the abundance of tumor-infiltrating cells such as eosinophils. The malignancy of tumor was related to several factors, including genomic instability, heterogeneity (cells types such as fibroblasts, endothelial cells, pericytes, and immune cells), and composition of the microenvironment.45 Therefore, tumors’ heterogeneity could be changed by regulating genes’ expression, to further reduce the malignant degree of the tumor. The angiopoietin-like 4 (ANGPTL4) protein, as a member of secreted proteins superfamily, whose structure was related to factors modulating angiogenesis known as angiopoietins,45 was involved in regulation of angiogenesis, lipid metabolism and glucose and energy homeostasis.46–51 The overexpression of ANGPTL4 could promote tumorigenesis, angiogenesis, tumor invasion, and metastasis,52–56 were also capable of inhibiting tumor metastasis via inhibiting vascular permeability, motility, and invasiveness57 or via attenuating endothelial cell adhesion, migration, and sprouting.58,59 ANGPTL4 had been reported as a potential biomarker in renal cell carcinoma,56,59 the expression level of which would increase in KIRC. The gene expression of ANGPTL4 was negatively correlated with the expression of some immune checkpoint genes such as TGFBR1, CD274, TNFSF15, positively correlated with the expression of some immune checkpoint genes such as PDCD1, TNFRSF4, TNFRSF14, CD40, CD70, which might provide thoughts on immune checkpoint inhibitors. SCNN1G encoded one of subunits, γ subunit, which combined with α subunit and β subunit to form a nonvoltage-gated, amiloride-sensitive, sodium channels controlling fluid and electrolyte transport across epithelia in many organs. The expression of SCNN1G upregulated in Ewing’s sarcoma and fibromatosis samples compared to normal samples.60 In our study, although the expression of SCNN1G was low in cancer samples of KIRC compared to normal samples, the survival analysis showed that the high expression group had lower survival rate. As the tumor progressed, the expression increased, indicating that elevated expression meant tumor progression and poor prognosis. Thus, high expression of SCNN1G of patients meant poor prognosis. SLC22A7 could mediate sodium-independent multispecific organic anion transport, including prostaglandin E2, prostaglandin F2, tetracycline, bumetanide, estrone sulfate, glutarate,61 dehydroepiandrosterone sulfate, allopurinol, 5-fluorouracil, paclitaxel, L-ascorbic acid, salicylate, ethotrexate, and alpha-ketoglutarate.62,63 It was also reported that its expression was low in KIRC compared to normal samples using different dataset, which was consistent with our analysis result.63 The survival analysis showed that high expression of SLC22A7 had higher survival analysis, and the more severe the disease, the lower the expression level. It indicated that high expression level was a sign of early stage of disease and better prognosis of patients.
The clinical prognostic analysis including the association between the expression of key genes and the overall survival, stage, grade across KIRC, the immune infiltration difference between normal samples and cancer samples, the correlation between the key genes and immune cells, immunemodulator, immune subtypes of KIRC were investigated in this research, which could provide new guidance for cancer diagnosis. The study had limitations. Firstly, the data in our study may be limited to the country, region, race of included research objects. Secondly, due to the data limitations, the molecular subtypes of KIRC have not been further classified. Last, our analysis needs further clinical validation.
Conclusion
This study screened the 4 key genes, including ACPP, ANGPTL4, SCNN1G, SLC22A7, whose expression showed difference among normal samples and tumor samples. Patients with higher expression of SCNN1G have a lower survival rate, the more severe the disease, the higher the expression level. Patients with higher expression of SLC22A7 have a higher survival rate, the more severe the disease, the lower the expression level. Meanwhile, the expression of key genes was related with the abundance of tumor infiltration immune cells and the expression of immune checkpoint, which could provide guidance for immunotherapy.
Data Sharing Statement
We would like to thank GEO (Gene Expression Omnibus) database (http://www.ncbi.nlm.nih.gov/geo/), TCGA (The Cancer Genome Atlas) database (https://portal.gdc.cancer.gov/), TISIDB website (http://cis.hku.hk/TISIDB/), and SEER (http://seer.cancer.gov/statfacts/html/kidrp.html) for using their data.
Ethics Approval and Informed Consent
Ethics approval waived has been approved by Medical Ethics Committee of Shanghai First People’s Hospital, the ethics approval number is 2021KY114.
Acknowledgments
This literature was supported by National Natural Science Foundation of China (82073207).
Author Contributions
All authors made a significant contribution to the work reported, whether that is in the conception, study design, execution, acquisition of data, analysis and interpretation, or in all these areas; took part in drafting, revising or critically reviewing the article; gave final approval of the version to be published; have agreed on the journal to which the article has been submitted; and agree to be accountable for all aspects of the work.
Disclosure
The authors declared that they have no conflicts of interest for this work.
References
1. Moch H, Cubilla AL, Humphrey PA, Reuter VE, Ulbright TM. The 2016 WHO classification of tumours of the urinary system and male genital organs-part a: renal, penile, and testicular tumours. Eur Urol. 2016;70(1):93–105. doi:10.1016/j.eururo.2016.02.029
2. Zhan C, Wang Z, Xu C, et al. Development and validation of a prognostic gene signature in clear cell renal cell carcinoma. Front Mol Biosci. 2021;8(45). doi:10.3389/fmolb.2021.609865
3. Li Y, Gong Y, Ning X, et al. Downregulation of CLDN7 due to promoter hypermethylation is associated with human clear cell renal cell carcinoma progression and poor prognosis. J Exp Clin Cancer Res. 2018;37(1):276. doi:10.1186/s13046-018-0924-y
4. Motzer RJ, Bander NH, Nanus DM. Renal-cell carcinoma. N Engl J Med. 1996;335(12):865–875. doi:10.1056/NEJM199609193351207
5. Liu H, Yang Y. Identification of mast cell-based molecular subtypes and a predictive signature in clear cell renal cell carcinoma. Front Mol Biosci. 2021;8(927). doi:10.3389/fmolb.2021.719982
6. Karakiewicz PI, Briganti A, Chun FK, et al. Multi-institutional validation of a new renal cancer-specific survival nomogram. J Clin Oncol. 2007;25(11):1316–1322. doi:10.1200/jco.2006.06.1218
7. Pantuck AJ, Zisman A, Belldegrun AS. The changing natural history of renal cell carcinoma. J Urol. 2001;166(5):1611–1623. doi:10.1016/S0022-5347(05)65640-6
8. Wood CG. Multimodal approaches in the management of locally advanced and metastatic renal cell carcinoma: combining surgery and systemic therapies to improve patient outcome. Clin Cancer Res. 2007;13(2 Pt 2):697s–702s. doi:10.1158/1078-0432.Ccr-06-2109
9. Muselaers CH, Boerman OC, Oosterwijk E, Langenhuijsen JF, Oyen WJ, Mulders PF. Indium-111-labeled girentuximab immunoSPECT as a diagnostic tool in clear cell renal cell carcinoma. Eur Urol. 2013;63(6):1101–1106. doi:10.1016/j.eururo.2013.02.022
10. Li F, Yang M, Li Y, et al. An improved clear cell renal cell carcinoma stage prediction model based on gene sets. BMC Bioinform. 2020;21(1):232. doi:10.1186/s12859-020-03543-0
11. Cai W, Li H, Zhang Y, Han G. Identification of key biomarkers and immune infiltration in the synovial tissue of osteoarthritis by bioinformatics analysis. PeerJ. 2020;8:e8390. doi:10.7717/peerj.8390
12. Huang Y, Zheng S, Wang R, Tang C, Zhu J, Li J. CCL5 and related genes might be the potential diagnostic biomarkers for the therapeutic strategies of rheumatoid arthritis. Clin Rheumatol. 2019;38(9):2629–2635. doi:10.1007/s10067-019-04533-1
13. Chen Y, Liao R, Yao Y, Wang Q, Fu L. Machine learning to identify immune-related biomarkers of rheumatoid arthritis based on WGCNA network. Clin Rheumatol. 2021. doi:10.1007/s10067-021-05960-9
14. Tibshirani R. Regression shrinkage and selection via the lasso. J Royal Stat Soc Series B. 1996;58(1):267–288.
15. Suzuki T, Kano S, Suzuki M, et al. Enhanced angiogenesis in salivary duct carcinoma ex-pleomorphic adenoma. Front Oncol. 2020;10:603717. doi:10.3389/fonc.2020.603717
16. Gutiérrez-Gómez L, Vohryzek J, Chiêm B, et al. Stable biomarker identification for predicting schizophrenia in the human connectome. Neuroimage Clin. 2020;27:102316. doi:10.1016/j.nicl.2020.102316
17. Barrett T, Wilhite SE, Ledoux P, et al. NCBI GEO: archive for functional genomics data sets–update. Nucleic Acids Res. 2013;41(D1):D991–5. doi:10.1093/nar/gks1193
18. Gumz ML, Zou H, Kreinest PA, et al. Secreted frizzled-related protein 1 loss contributes to tumor phenotype of clear cell renal cell carcinoma. Clin Cancer Res. 2007;13(16):4740–4749. doi:10.1158/1078-0432.Ccr-07-0143
19. Lenburg ME, Liou LS, Gerry NP, Frampton GM, Cohen HT, Christman MF. Previously unidentified changes in renal cell carcinoma gene expression identified by parametric analysis of microarray data. BMC Cancer. 2003;3:31. doi:10.1186/1471-2407-3-31
20. von Roemeling CA, Radisky DC, Marlow LA, et al. Neuronal pentraxin 2 supports clear cell renal cell carcinoma by activating the AMPA-selective glutamate receptor-4. Cancer Res. 2014;74(17):4796–4810. doi:10.1158/0008-5472.Can-14-0210
21. Wozniak MB, Le Calvez-kelm F, Abedi-Ardekani B, et al. Integrative genome-wide gene expression profiling of clear cell renal cell carcinoma in Czech Republic and in the United States. PLoS One. 2013;8(3):e57886. doi:10.1371/journal.pone.0057886
22. Zhu YX, Huang JQ, Ming YY, Zhuang Z, Xia H. Screening of key biomarkers of tendinopathy based on bioinformatics and machine learning algorithms. PLoS One. 2021;16(10):e0259475. doi:10.1371/journal.pone.0259475
23. Ritchie ME, Phipson B, Wu D, et al. limma powers differential expression analyses for RNA-sequencing and microarray studies. Nucleic Acids Res. 2015;43(7):e47. doi:10.1093/nar/gkv007
24. Yu G, Wang LG, Han Y, He QY. clusterProfiler: an R package for comparing biological themes among gene clusters. Omics. 2012;16(5):284–287. doi:10.1089/omi.2011.0118
25. Antonacci Y, Toppi J, Mattia D, Pietrabissa A, Astolfi L. Single-trial connectivity estimation through the least absolute shrinkage and selection operator. Annu Int Conf IEEE Eng Med Biol Soc. 2019;2019:6422–6425. doi:10.1109/embc.2019.8857909
26. Robin X, Turck N, Hainard A, et al. pROC: an open-source package for R and S+ to analyze and compare ROC curves. BMC Bioinform. 2011;12:77. doi:10.1186/1471-2105-12-77
27. Sanz H, Valim C, Vegas E, Oller JM, Reverter F. SVM-RFE: selection and visualization of the most relevant features through non-linear kernels. BMC Bioinform. 2018;19(1). doi:10.1186/s12859-018-2451-4
28. Deng YJ, Ren E, Yuan WH, Zhang GZ, Xie QQ, Xie -Q-Q. GRB10 and E2F3 as diagnostic markers of osteoarthritis and their correlation with immune infiltration. Diagnostics. 2020;10(3):171. doi:10.3390/diagnostics10030171
29. Cao Y, Tang W, Tang W. Immune cell infiltration characteristics and related core genes in lupus nephritis: results from bioinformatic analysis. BMC Immunol. 2019;20. doi:10.1186/s12865-019-0316-x
30. Garza Z, Lenz M, Liebmann J, et al. Characterization of disease-specific cellular abundance profiles of chronic inflammatory skin conditions from deconvolution of biopsy samples. BMC Med Genomics. 2019;12:1–4.
31. Yang L, Shou YH, Yang YS, Xu JH. Elucidating the immune infiltration in acne and its comparison with rosacea by integrated bioinformatics analysis. PLoS One. 2021;16(3):e0248650. doi:10.1371/journal.pone.0248650
32. Newman AM, Liu CL, Green MR, et al. Robust enumeration of cell subsets from tissue expression profiles. Nat Methods. 2015;12(5):453–457. doi:10.1038/nmeth.3337
33. Thorsson V, Gibbs DL, Brown SD, et al. The immune landscape of cancer. Immunity. 2018;48(4):812–830.e14. doi:10.1016/j.immuni.2018.03.023
34. Beck AH, Espinosa I, Edris B, et al. The macrophage colony-stimulating factor 1 response signature in breast carcinoma. Clin Cancer Res. 2009;15(3):778–787. doi:10.1158/1078-0432.Ccr-08-1283
35. Calabrò A, Beissbarth T, Kuner R, et al. Effects of infiltrating lymphocytes and estrogen receptor on gene expression and prognosis in breast cancer. Breast Cancer Res Treat. 2009;116(1):69–77. doi:10.1007/s10549-008-0105-3
36. Teschendorff AE, Gomez S, Arenas A, et al. Improved prognostic classification of breast cancer defined by antagonistic activation patterns of immune response pathway modules. BMC Cancer. 2010;10:604. doi:10.1186/1471-2407-10-604
37. Wolf DM, Lenburg ME, Yau C, Boudreau A, van ‘t Veer LJ. Gene co-expression modules as clinically relevant hallmarks of breast cancer diversity. PLoS One. 2014;9(2):e88309. doi:10.1371/journal.pone.0088309
38. Chang HY, Sneddon JB, Alizadeh AA, et al. Gene expression signature of fibroblast serum response predicts human cancer progression: similarities between tumors and wounds. PLoS Biol. 2004;2(2):E7. doi:10.1371/journal.pbio.0020007
39. Castiblanco-Valencia MM, Fraga TR, Pagotto AH, et al. Plasmin cleaves fibrinogen and the human complement proteins C3b and C5 in the presence of Leptospira interrogans proteins: a new role of LigA and LigB in invasion and complement immune evasion. Immunobiology. 2016;221(5):679–689. doi:10.1016/j.imbio.2016.01.001
40. Guglietta S, Rescigno M. Hypercoagulation and complement: connected players in tumor development and metastases. Semin Immunol. 2016;28(6):578–586. doi:10.1016/j.smim.2016.10.011
41. Singh S, Hassan D, Aldawsari HM, Molugulu N, Shukla R, Kesharwani P. Immune checkpoint inhibitors: a promising anticancer therapy. Drug Discov Today. 2020;25(1):223–229. doi:10.1016/j.drudis.2019.11.003
42. Li J, Wang G, Zhang W, et al.Graphene film-functionalized germanium as a chemically stable, electrically conductive, and biologically active substrate. J Mater Chem B Mater Biol Med. 2015;3:1544–1555.
43. Young-Jun P, Da-sol K, Yeonseok C. Future prospects of immune checkpoint blockade in cancer: from response prediction to overcoming resistance. Exp Mol Med. 2018;50(8):109.
44. Brahmer JR, Tykodi SS, Chow LQM, et al. Safety and activity of anti-PD-L1 antibody in patients with advanced cancer. J Urol. 2012;188(6):2148–2149. doi:10.1016/j.juro.2012.08.169
45. La Paglia L, Listì A, Caruso S, et al. Potential role of ANGPTL4 in the cross talk between metabolism and cancer through PPAR signaling pathway. PPAR Res. 2017;2017:8187235. doi:10.1155/2017/8187235
46. Oike Y, Yasunaga K, Ito Y, et al. Angiopoietin-related growth factor (AGF) promotes epidermal proliferation, remodeling, and regeneration. Proc Natl Acad Sci. 2003;100(16):9494–9499. doi:10.1073/pnas.1531901100
47. Oike Y, Ito Y, Maekawa H. Angiopoietin-related growth factor (AGF) promotes angiogenesis. Blood. 2004;103(10):3760–3765. doi:10.1182/blood-2003-04-1272
48. Wang Y, Lam KS, Lam JB, et al.Overexpression of angiopoietin-like protein 4 alters mitochondria activities and modulates methionine metabolic cycle in the liver tissues of db/db diabetic mice. Chin Biol Abstract. 2007;21(11):1.
49. Oike Y, Akao M, Yasunaga K, et al. Angiopoietin-related growth factor antagonizes obesity and insulin resistance. Nat Med. 2005;11(43):400–408. doi:10.1038/nm1214
50. Ge H, Cha J-Y, Gopal H, et al. Differential regulation and properties of angiopoietin-like proteins 3 and 4. J Lipid Res. 2005;46(7):1484–1490. doi:10.1194/jlr.M500005-JLR200
51. Xu A, Lam MC, Chan KW, et al. Angiopoietin-like protein 4 decreases blood glucose and improves glucose tolerance but induces hyperlipidemia and hepatic steatosis in mice. Proc Natl Acad Sci. 2005;102(17):6086–6091. doi:10.1073/pnas.0408452102
52. Li H, Ge C, Zhao F, et al.Hypoxia‐inducible factor 1 alpha–activated angiopoietin‐like protein 4 contributes to tumor metastasis via vascular cell adhesion molecule‐1/integrin β1 signaling in human hepatocellular carcinoma. Hepatology. 2011;54(3):910–919.
53. Kim SH, Park YY, Kim SW, Lee JS, Wang D, Dubois RN. ANGPTL4 induction by prostaglandin E2 under hypoxic conditions promotes colorectal cancer progression. Cancer Res. 2011;71(22):7010. doi:10.1158/0008-5472.CAN-11-1262
54. Zhang H, Wong C, Wei H, et al. HIF-1-dependent expression of angiopoietin-like 4 and L1CAM mediates vascular metastasis of hypoxic breast cancer cells to the lungs. Oncogene. 2012;31(14):1757–1770. doi:10.1038/onc.2011.365
55. Jan SL, Amy C, Cazes A, et al. Angiopoietin-like 4 is a proangiogenic factor produced during ischemia and in conventional renal cell carcinoma. Am J Pathol. 2003;162(5):1521–1528. doi:10.1016/S0002-9440(10)64285-X
56. Verine J, Lehmann-Che J, Soliman H, et al. Determination of Angptl4 mRNA as a diagnostic marker of primary and metastatic clear cell renal-cell carcinoma. PLoS One. 2010;5:e10421. doi:10.1371/journal.pone.0010421
57. Galaup A, Cazes A, Le jan S, et al. Angiopoietin-like 4 prevents metastasis through inhibition of vascular permeability and tumor cell motility and invasiveness. Proc Natl Acad Sci USA. 2006;103(49):18721–18726. doi:10.1073/pnas.0609025103
58. Cazes A, Galaup A, Chomel C. Extracellular matrix-bound angiopoietin-like 4 inhibits endothelial cell adhesion, migration, and sprouting and alters actin cytoskeleton. Circ Res. 2006;99(11):1207–1215. doi:10.1161/01.RES.0000250758.63358.91
59. Dong D, Jia L, Zhou Y, Ren L, Li J, Zhang J. Serum level of ANGPTL4 as a potential biomarker in renal cell carcinoma. Urol Oncol. 2017;35(5):279–285. doi:10.1016/j.urolonc.2016.12.017
60. Sarver AE, Sarver AL, Thayanithy V, Subramanian S. Identification, by systematic RNA sequencing, of novel candidate biomarkers and therapeutic targets in human soft tissue tumors. Lab Invest. 2015;95(9):1077–1088. doi:10.1038/labinvest.2015.80
61. Sato M, Mamada H, Anzai N, Shirasaka Y, Nakanishi T, Tamai I. Renal secretion of uric acid by organic anion transporter 2 (OAT2/SLC22A7) in human. Biol Pharm Bull. 2010;33(3):498–503. doi:10.1248/bpb.33.498
62. Srimaroeng C, Perry JL, Pritchard JB. Physiology, structure, and regulation of the cloned organic anion transporters. Xenobiotica. 2008;38(7–8):889–935. doi:10.1080/00498250801927435
63. Kang W, Zhang M, Wang Q, et al. The SLC family are candidate diagnostic and prognostic biomarkers in clear cell renal cell carcinoma. Biomed Res Int. 2020;2020:1932948. doi:10.1155/2020/1932948
 © 2022 The Author(s). This work is published and licensed by Dove Medical Press Limited. The
full terms of this license are available at https://www.dovepress.com/terms
and incorporate the Creative Commons Attribution
- Non Commercial (unported, 3.0) License.
By accessing the work you hereby accept the Terms. Non-commercial uses of the work are permitted
without any further permission from Dove Medical Press Limited, provided the work is properly
attributed. For permission for commercial use of this work, please see paragraphs 4.2 and 5 of our Terms.
© 2022 The Author(s). This work is published and licensed by Dove Medical Press Limited. The
full terms of this license are available at https://www.dovepress.com/terms
and incorporate the Creative Commons Attribution
- Non Commercial (unported, 3.0) License.
By accessing the work you hereby accept the Terms. Non-commercial uses of the work are permitted
without any further permission from Dove Medical Press Limited, provided the work is properly
attributed. For permission for commercial use of this work, please see paragraphs 4.2 and 5 of our Terms.