Back to Journals » Risk Management and Healthcare Policy » Volume 16
Using a Decision Tree Algorithm Predictive Model for Sperm Count Assessment and Risk Factors in Health Screening Population
Authors Huang HH, Lu CJ, Jhou MJ ![]() , Liu TC, Yang CT
, Liu TC, Yang CT ![]() , Hsieh SJ, Yang WJ, Chang HC, Chen MS
, Hsieh SJ, Yang WJ, Chang HC, Chen MS ![]()
Received 31 July 2023
Accepted for publication 1 November 2023
Published 16 November 2023 Volume 2023:16 Pages 2469—2478
DOI https://doi.org/10.2147/RMHP.S433193
Checked for plagiarism Yes
Review by Single anonymous peer review
Peer reviewer comments 2
Editor who approved publication: Dr Jongwha Chang
Hung-Hsiang Huang,1,* Chi-Jie Lu,2– 4,* Mao-Jhen Jhou,4 Tzu-Chi Liu,4 Chih-Te Yang,5 Shang-Ju Hsieh,1 Wen-Jen Yang,6 Hsiao-Chun Chang,1 Ming-Shu Chen7
1Department of Urology, Surgery, Far Eastern Memorial Hospital, New Taipei City, 220, Taiwan; 2Artificial Intelligence Development Center, Fu Jen Catholic University, New Taipei City, 242, Taiwan; 3Department of Information Management, Fu Jen Catholic University, New Taipei City, 242, Taiwan; 4Graduate Institute of Business Administration, Fu Jen Catholic University, New Taipei City, 242, Taiwan; 5Department of Business Administration, Tamkang University, New Taipei City, 251, Taiwan; 6Health Screening Center, Chi Hsin Clinic, Taipei City, 104, Taiwan; 7Department of Healthcare Administration, Asia Eastern University of Science and Technology, New Taipei City, 220, Taiwan
*These authors contributed equally to this work
Correspondence: Ming-Shu Chen; Hsiao-Chun Chang, Email [email protected]; [email protected]
Purpose: Approximately 20% of couples face infertility challenges and struggle to conceive naturally. Despite advances in artificial reproduction, its success hinges on sperm quality. Our previous study used five machine learning (ML) algorithms, random forest, stochastic gradient boosting, least absolute shrinkage and selection operator regression, ridge regression, and extreme gradient boosting, to model health data from 1375 Taiwanese males and identified ten risk factors affecting sperm count.
Methods: We employed the CART algorithm to generate decision trees using identified risk factors to predict healthy sperm counts. Four error metrics, SMAPE, RAE, RRSE, and RMSE, were used to evaluate the decision trees. We identified the top five decision trees based on their low errors and discussed in detail the tree with the least error.
Results: The decision tree featuring the least error, comprising BMI, UA, ST, T-Cho/HDL-C ratio, and BUN, corroborated the negative impacts of metabolic syndrome, particularly high BMI, on sperm count, while emphasizing the link between good sleep and male fertility. Our study also sheds light on the potentially significant influence of high BUN on spermatogenesis. Two novel risk factors, T-Cho/HDL-C and UA, warrant further investigation.
Conclusion: The ML algorithm established a predictive model for healthcare personnel to assess low sperm counts. Refinement of the model using additional data is crucial for improved precision. The risk factors identified offer avenues for future investigations.
Keywords: sperm count, metabolic syndrome, sleep time, food metabolite, decision tree
Introduction
Taiwan, like many other developed countries, is experiencing a persistent decline in fertility and birth rates.1 Economic pressures have become a significant factor contributing to couples postponing their plans for starting a family. In addition, as individuals age, the risk of developing metabolic syndrome increases. Metabolic syndrome has been identified as potentially influencing the quality of male and female gametes.2,3 However, it is important to note that previous studies predominantly concentrated on infertile individuals who might not fully represent the general population. Therefore, there is a need to explore and understand the impact of metabolic syndrome and other risk factors on gamete quality of the general population to gain a comprehensive understanding of fertility-related implications for aging individuals. Furthermore, sperm count and other sperm parameters significantly affect the success of assisted reproductive techniques. Healthcare providers can potentially improve a patient’s sperm count by addressing risk factors that might predict it.
Machine learning (ML) methods are powerful tools that exploit data-driven algorithms to construct predictive models and uncover complex interactions and non-linear relationships between variables.4,5 These techniques are widely applied in healthcare and medical informatics, demonstrating their potential for improving diagnostics, treatment, and patient outcomes.6–8 Despite the extensive use of ML in various medical domains, there is a notable lack of research using ML methods to specifically explore sperm count-related problems.9,10 In a previous study of sperm count, we used five predictive ML algorithms, namely random forest, stochastic gradient boosting, least absolute shrinkage and selection operator regression, ridge regression, and extreme gradient boosting. The data for the study were sourced from the MJ Group, a prominent health screening center in Taiwan.11 The main objective of the study was to use a feature selection (FS) method to identify significant risk factors influencing sperm count in a healthy male population. FS is popular in many clinical studies because it can provide valuable information that may be helpful to clinicians when interpreting risk factors.12–14 It has three common approaches: wrapper, filtering, and embedded.15,16 The embedded approach was used in a previous study. Embedded refers to a built-in mechanism of an ML model that enables it to select features during construction. Models adopting the embedded approach are more efficient and perform well when making predictions.14–16 Moreover, because models with the embedded approach can effectively handle data with complex features and extract helpful information, they can improve clinicians’ interpretation of risk factors during diagnosis.
We previously identified the top 10 risk factors affecting sperm counts; these factors, except for sleep time and alpha-fetoprotein, could be grouped into two clusters. The first cluster includes factors related to metabolic syndrome, indicating that they play a crucial role in influencing sperm count. The second cluster comprises nutritional metabolites, suggesting that these diet-related factors also have a significant impact on sperm count.
The decision tree algorithm from ML methods is popular in clinical studies,17–20 not only because of its promising performance, but also due to its ability to generate tree-shaped decision rules that provide valuable information for decision-making. In this study, we used the well-known classification and regression tree (CART) algorithm along with the previously identified 10 risk factors to create a hierarchical decision support model. This model ranked the risk factors from those with the highest to those with the lowest impact on sperm count and matched the male patients with these predicted sperm counts, as well as offering personalized solutions for medical specialists to help individual male patients increase their sperm counts.
Materials and Methods
Data
The data analyzed in this study were sourced from our previous study.11 The research protocol of this study underwent the same rigorous evaluation as our previous study. We conducted the study in full compliance with the guidelines of the Declaration of Helsinki, ensuring ethical treatment of all participants. Prior to any analysis, we took measures to anonymize all data to meet the ethical requirements outlined by the institutional review board. In this continuation of the research program, we employed the previously identified 10 risk factors to construct predictive decision trees for estimating sperm count. Each decision tree was trained using the data collected to identify the best model for accurate sperm count estimation.11 We present the attributes of the participants, which include descriptive statistics for both the independent (X1–X29) and the dependent (sperm count) variables, in Supplementary Table S1. The process of subject selection is illustrated in Figure 1. A total of 71,108 members from the MJ health-check-up-based population database (MJPD) were initially recruited. We excluded 40,853 subjects with missing data on the main study variables, six subjects older than 50 years with uneven distribution across study groups, and 28,874 non-male subjects who did not undergo sperm count or motility tests during their annual health examination. After exclusion, 1375 eligible male subjects remained.
 |
Figure 1 The process for selecting male subjects for sperm count assessment. Abbreviation: MJPD, MJ health-check-up-based population database. |
Analytical Methods
We employed the CART method to generate decision rules. The fundamental concept behind CART is relatively straightforward; it involves recursively partitioning the input space into smaller regions based on the values of various features or attributes of the data. Throughout this partitioning process, CART seeks optimized cutting criteria to form tree-shaped decision rules that minimize prediction errors. These cutting criteria represent the nodes of the decision tree, while the predictions resulting from a specific rule set are represented by the leaves on the decision tree. In other words, the decision rules derived from CART consist of multiple nodes and their corresponding leaves.21,22 This methodology allowed us to create an interpretable model that could provide valuable insights into the relationships between the input features and the target variable (in this case, sperm count). By analyzing these decision rules, we could gain a better understanding of how different factors influenced sperm count estimation and obtain valuable information for clinical interpretation.
Before constructing the CART model, the data of subjects selected from the MJPD underwent a comprehensive preprocessing phase. During this preprocessing stage, various approaches were considered, including missing value exclusion and generation of dummied class codes. Once the data cleaning was completed, the preprocessed data were used to build the CART model. To construct the CART model, the data were first randomly split into a training set (80% of the data) and a testing set (20% of the data). As CART involved hyper-parameter tuning, the training set was further randomly divided into five folds for cross-validation (CV). In each CV iteration, one-fold was used as the validation set, and the remaining data were used to train the model. This process was repeated five times, with each fold serving as the validation set once, allowing us to determine the most optimized hyper-parameter set during the CV process. Subsequently, the tuned CART model was evaluated using the testing dataset.
For robustness and reliability, this entire process, including hyper-parameter tuning with 10-fold CV for constructing the CART model, was repeated 100 times in this study. The entire construction process is presented in Figure 2. The CART models were built using R software (version 4.2.3), with RStudio (version 1.1.453) used as the integrated development environment. Specifically, the “rpart” package (version 4.1.19) was employed for constructing the CART models, while the “caret” package (version 6.0–94) was used for hyper-parameter tuning with 10-fold CV. To evaluate the performance of the constructed CART models, four error metrics were employed in this study: symmetric mean absolute percentage error (SMAPE); relative absolute error (RAE); root relative squared error (RRSE); and root mean squared error (RMSE). The “MLmetrics” package (version 1.1.1) was used to compute the RAE metric, while the “Metrics” package (version 0.1.4) was employed for calculating SMAPE, RRSE, and RMSE. These error metrics served as important indicators of the model’s accuracy and effectiveness in estimating sperm counts.
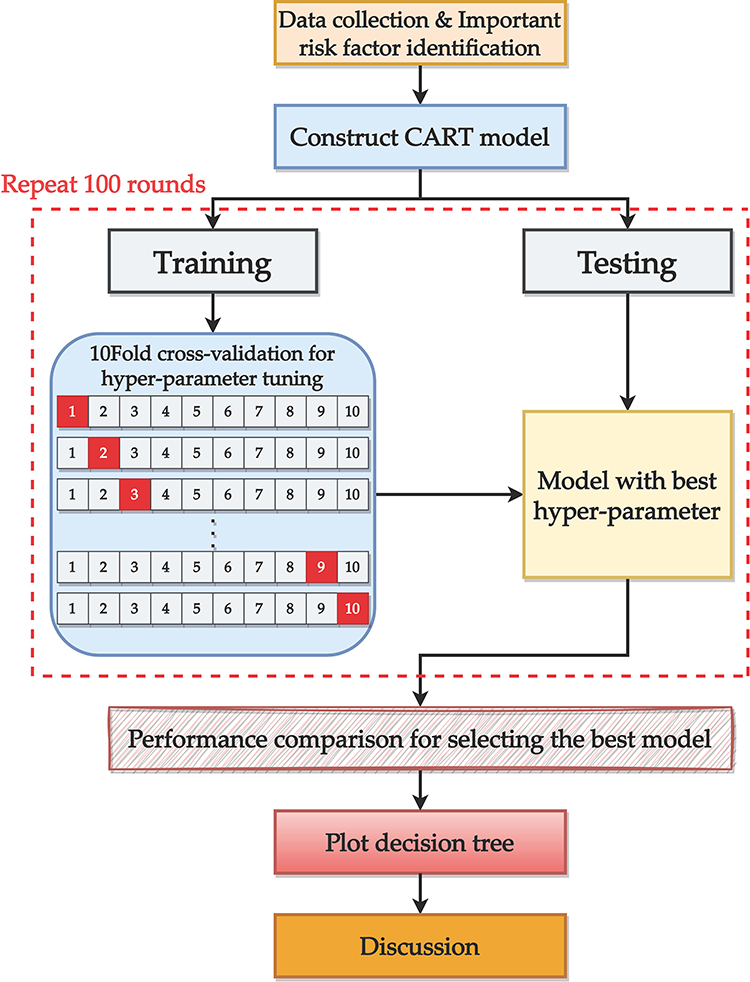 |
Figure 2 The model construction process. |
Results
A total of 100 trees were generated in a series of 100 rounds for constructing the CART model. These trees varied slightly in their decision rules due to the random data splits in each training round. To identify the most effective CART model, the five trees with the lowest error rates were selected for comparison; their details are provided in Table 1. The evaluation of the top five CART trees focused on the main performance metric, RMSE, along with RAE, RRSE, and SMAPE, to ensure the robustness of the constructed trees. The ranking in Tables 1 and 2 is based on RMSE, with the tree with the least error assigned rank 1. The analysis of the performance of trees 1 to 5 showed that tree 1 outperformed the others: it had the lowest RMSE (50.057), RAE (0.996), RRSE (1.022), and SMAPE (0.564) values. Notably, the performance of all trees was relatively close, indicating the stability of the CART model when applied to the data used in this study. In conclusion, the results demonstrate the stability of CART for estimating sperm counts, with tree 1 exhibiting the best overall performance among the top five trees evaluated.
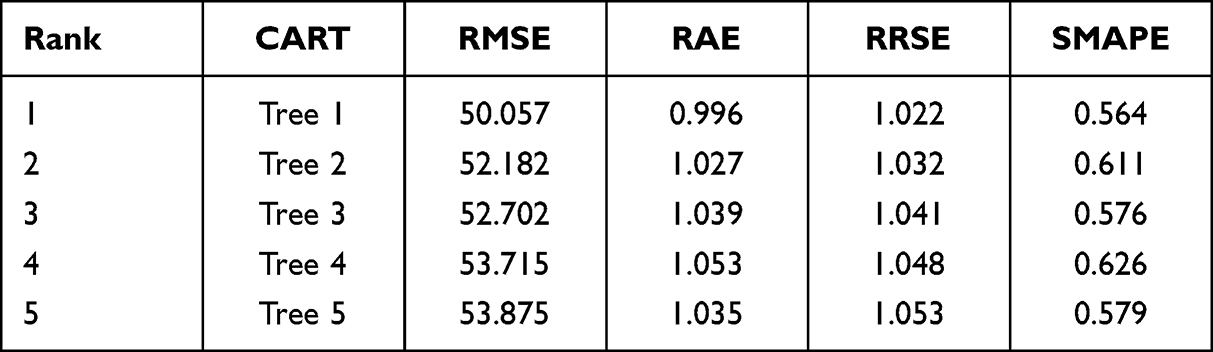 |
Table 1 The Top Five Trees Ranked Based on Their Performance After 100 Rounds of CART Model Construction |
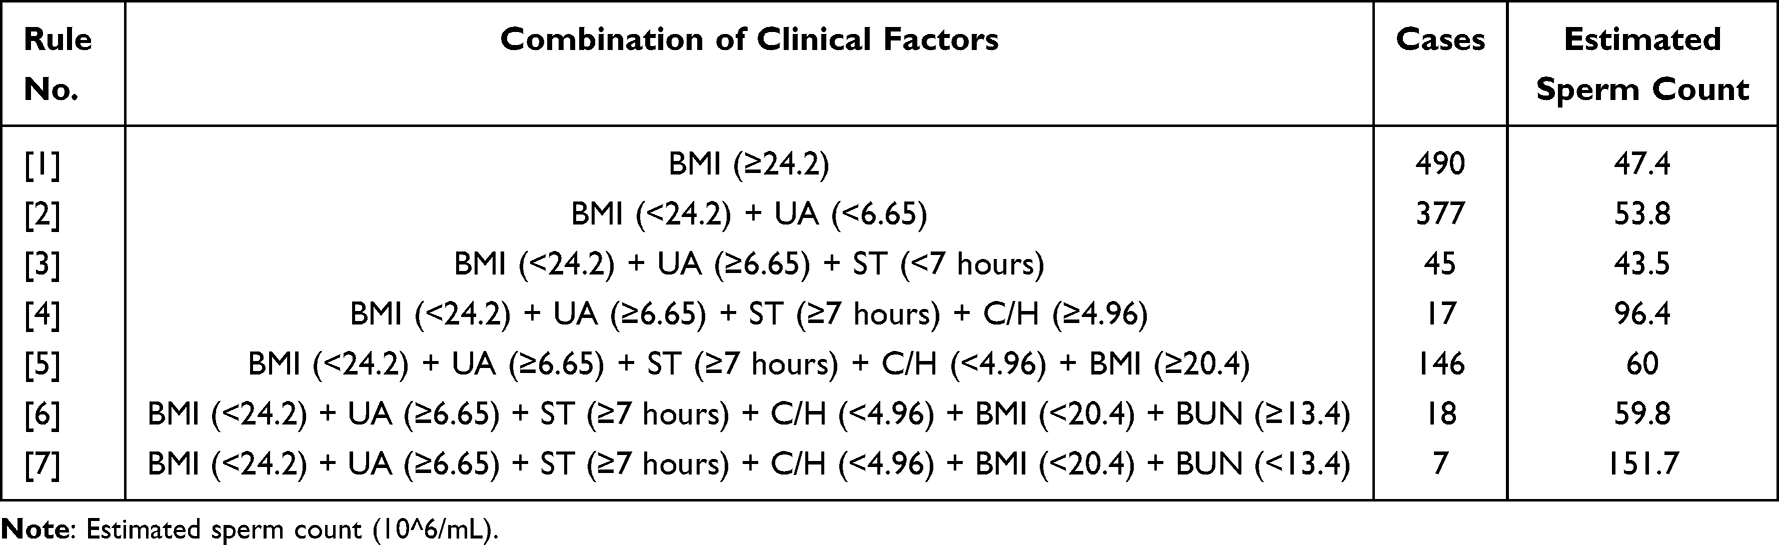 |
Table 2 Decision Rules of Tree 1 for Sperm Count Estimation |
Figures 3 and 4 display the decision tree plots corresponding to the trees from the CART model ranked top five in Table 1. Figures 3 shows the decision tree plots of trees 2 to 5. These plots demonstrate how the decision rules can vary slightly when the model is trained using randomly split data. It is important to note that these trees are among the top-performing ones and showcase their potential for accurately estimating sperm counts. Figure 4 is the main focus of this study. It represents the decision tree plot of tree 1, which is the best model in terms of overall performance. The decision rules depicted in this decision tree plot were derived from the data splits during training, leading to the model with the lowest error rates and the highest accuracy in sperm count estimation. By analyzing these tree plots, we gained valuable insights into how the CART model made decisions and predicted sperm counts based on the input features. The variability in decision rules of the top five trees highlights the sensitivity of the model to data fluctuations and underscores the need for robustness in model selection. In summary, Figures 3 and 4 provide a visual representation of the decision-making process of the top-performing CART trees, with Figure 4 being the primary focus as it represents the best model for sperm count estimation.
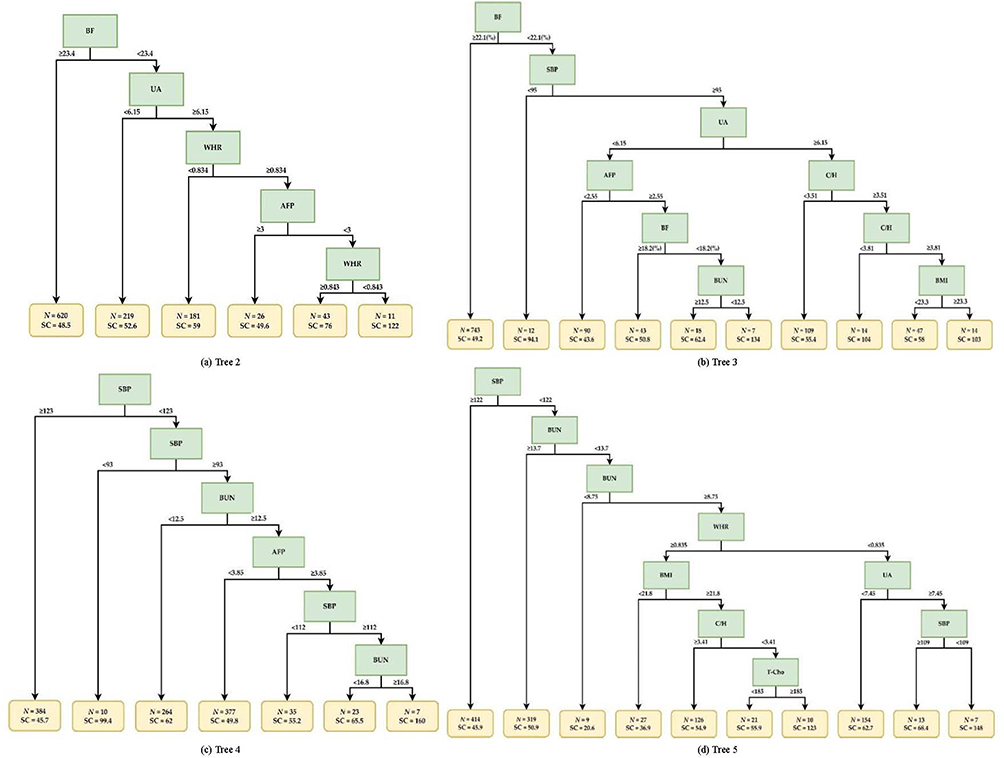 |
Figure 3 Decision tree plots of trees 2, 3, 4, and 5 for sperm count estimation. (a) Tree 2. (b) Tree 3. (c) Tree 4. (d) Tree 5. Abbreviations: N, cases number; SC, estimated sperm count (10^6/mL). Note: the abbreviations of various medical examination items, please refer to Supplementary Table S1. |
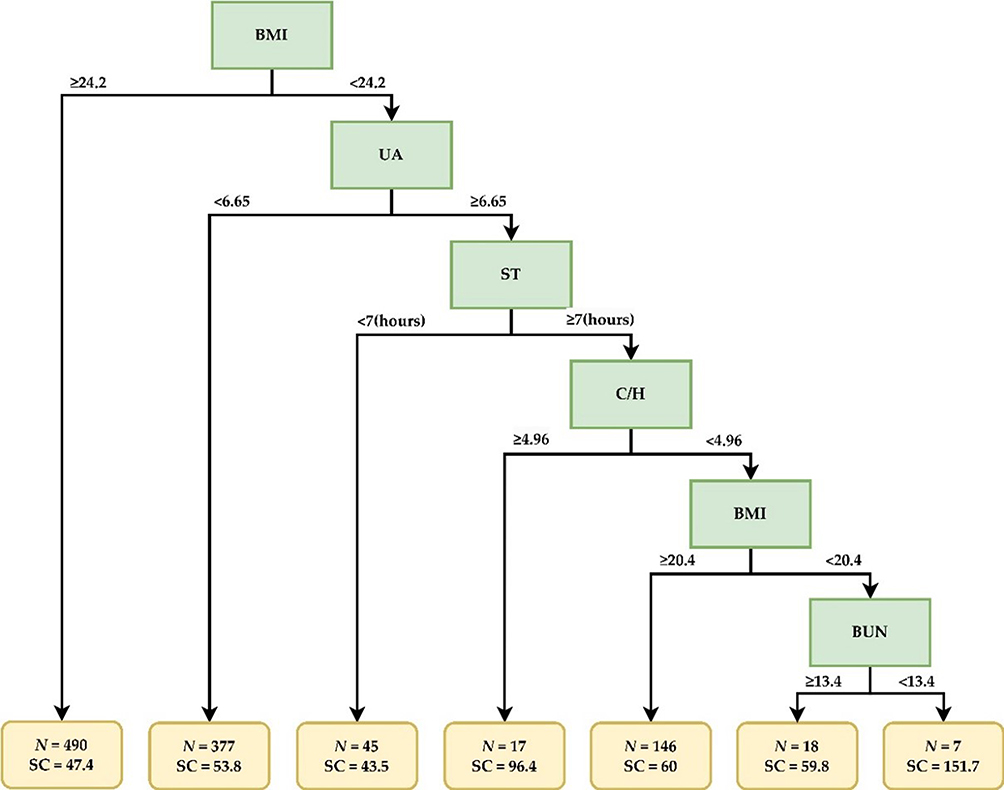 |
Figure 4 Decision tree plot of tree 1 for sperm count estimation. Abbreviations: N, cases number; SC, estimated sperm count (10^6/mL). Note: The abbreviations of various medical examination items, please refer to Supplementary Table S1. |
Figure 4 shows the decision rules extracted from tree 1 presented as the decision tree plot. The nodes in the plot (highlighted in green) represent the optimal cutting criteria identified by the CART model. For instance, in the first node (body mass index [BMI]), if the BMI value is ≥24.2, the decision branches to the left; otherwise, it takes the right path. When a combination of decision rules (nodes) leads to leaves (highlighted in orange), the corresponding leaves provide the estimated value for sperm count. It is essential to note that this estimated value represents the mean sperm count obtained from the CART model. In other words, the value should be understood as an approximation of sperm count, rather than an absolute value.
Figure 2 allows visualization and interpretation of how the CART model makes decisions based on input features and ultimately provides an estimated sperm count at each leaf of the tree. These results helped to understand the predictive behavior of the model in relation to specific criteria and aided in assessing sperm counts with a reasonable level of accuracy. Tree 1 yielded a set of seven decision rules used for sperm count estimation. To enhance visual clarity and facilitate in-depth discussion, these decision rules are sorted and conveniently presented in Table 2. The table showcases the seven decision rules derived from tree 1, with each rule having its corresponding “Cases”, representing the total number of subjects that satisfied that particular decision rule. The “Estimated Sperm Count” column shows the values associated with the leaves on the tree plot.
The information obtained from these decision rules provides valuable insights for further analysis in the upcoming discussion section, where the clinical significance of the findings can be thoroughly examined and elaborated upon. Table 2 shows the various criteria that contributed to the estimation of sperm counts and enables comprehensive exploration of their implications in the context of the study.
Discussion
Although male patients with metabolic syndrome are believed to have semen of lower quality, previous studies of different populations have been inconclusive.23,24 No specific values or ranges for this risk factor have been determined, making it challenging for medical specialists to provide guidance to couples seeking pregnancy. Our previous study demonstrated that metabolic syndrome negatively affects sperm counts in generally healthy male populations.11 To further explore this, we employed ML algorithms and generated risk factors to construct a decision tree (Figure 4). This decision tree prioritized BMI as the initial node, followed by UA, sleep duration, cholesterol-to-high density lipoprotein ratio (T-Cho/HDL-C), and blood urea nitrogen (BUN) as the final node to explain the observed sperm counts. In our decision tree model, individuals that conformed to a higher number of nodes from the top down were associated with higher sperm counts.
In previous studies, elevated BMI or being overweight has been linked to reduced sperm production, likely due to disruptions in reproductive hormones.25 Conversely, low BMI or being underweight is also associated with impaired sperm production, although our decision tree does not support this finding.26 Interestingly, the penultimate node in our model indicated that even a BMI lower than 20.4 was associated with high sperm counts. The second aspect of our proposed decision tree model was focused on serum uric acid, which is known to influence sperm formation.11 The consumption of high-purine foods, such as fish and seafood, can raise uric acid levels in the serum, potentially leading to hyperuricemia.27 A systematic review revealed that regular consumption of fish and seafood has a positive impact on sperm quality.28 It is plausible that elevated serum uric acid levels may be indicative of males’ dietary habits that include a higher intake of purine-rich food, such as seafood. Furthermore, it is possible that other components of food contribute to increased sperm production. One such candidate is omega-3, a polyunsaturated fatty acid commonly found in fish, which has been demonstrated to enhance sperm count and other semen characteristics.29 However, it is worth noting that our previous investigation included the consumption of omega-3 supplements, but no significant impacts on sperm formation were observed.11 In our previous study, we observed that males with shorter sleep durations were prone to low sperm counts. Our algorithm further revealed that males need more than 7 hours of sleep to achieve high sperm counts. In addition, our decision tree linked a high T-Cho/HDL-C ratio to increased sperm count. Despite the potential for higher risk of cardiovascular disease associated with a higher T-Cho/HDL-C ratio,30 it is important to note that high cholesterol levels are associated with improved sperm motility and morphology.31 Therefore, having a high T-Cho/HDL-C ratio for a short period might be beneficial to steroidogenesis and spermatogenesis.32
The final node in our decision tree was BUN, representing the amount of urea nitrogen in the blood, which reflects the kidney’s ability to remove waste products from the bloodstream.33 Previous studies have demonstrated that properly functioning kidney filtration positively influences sperm count and reproductive hormones.34 In our analysis of the general male population, we also observed that a higher BUN level was associated with lower sperm counts. However, it is premature to conclude that males with a one-time high BUN level have poorer kidney functioning compared to males with low BUN levels. Further investigation and data are needed to draw more definitive conclusions.
Limitations
Our study has several limitations. Firstly, it is important to note that the predicted sperm count may not fully represent the participant’s actual fertility status. Secondly, further in-depth studies are required for a better understanding of the mechanisms through which these identified risk factors influence sperm count. These factors may affect spermatogenesis directly or indirectly. For example, uric acid, the final metabolite of purine, showed a positive association with sperm count. This may be attributed to male patients consuming high-purine food, such as seafood. However, the association between serum levels and sperm count cannot be solely explained by dietary patterns. For instance, high protein intake could elevate both BUN and uric acid levels at the same time.27 Nonetheless, in our established model, BUN and uric acid had opposite effects on sperm count. This suggests that other components of the patient’s diet might contribute to the increase in sperm count.35
Lastly, our model would benefit from a larger dataset to enhance its predictive ability. The order and nodes in the decision tree are subject to change when additional health examination data are incorporated. Continual data input would refine and strengthen the model’s accuracy in predicting sperm count. In conclusion, while our study sheds light on important risk factors influencing sperm count, it has limitations that warrant further research and larger datasets to fully comprehend the complexities of male fertility and reproductive health assessment.
Conclusions
The low birth rates in many developed countries are exacerbated by late marriage and advanced maternal age. Establishing a model using laboratory data and lifestyle questionnaires from annual health screenings to predict the sperm count and semen quality of middle-aged men could significantly enhance the conception rate and counteract the declining birth rate. A larger dataset is crucial to further train and refine this decision tree, enabling it to offer more precise and valuable recommendations for patients seeking to improve their sperm counts and fertility.
Data Sharing Statement
The datasets used in this study were obtained from the MJ Health Research Foundation. Access and authorization for data use can be requested through the application procedures provided at the following link: http://www.mjhrf.org/main/page/release1/en/#release01.
Ethical Approval
This research was partially funded by the National Science and Technology Council, Taiwan (NSTC-112-2221-E-161-001; NSTC 111-2221-E-030-009) and this research was partially funded by the Far Eastern Memorial Hospital (NSC-RD-111-1-10-508; NSC-RD-111-1-10-516), and this research received no specific grant from any funding agency in the public, commercial, or not-for-profit sectors.
Consent for Publication
This manuscript contains no person’s details, images, or videos.
Acknowledgments
Hung-Hsiang Huang and Chi-Jie Lu are co-first authors for this study. The study received approval from the ClinicalTrials.gov (ID: NCT05225454) and was also approved by the Research Ethics Review Committee of Far Eastern Memorial Hospital (No: IRB-110027-E; Approved date: 2023-02-20). The study was conducted in accordance with the guidelines outlined in the Declaration of Helsinki.
Author Contributions
All authors made a significant contribution to the work reported, whether that is in the conception, study design, execution, acquisition of data, analysis and interpretation, or in all these areas; took part in drafting, revising or critically reviewing the article; gave final approval of the version to be published; have agreed on the journal to which the article has been submitted; and agree to be accountable for all aspects of the work.
Disclosure
The authors report no conflicts of interest in this work.
References
1. Economic UNDo, Social Affairs PD. World population prospects 2022: summary of results. United Nations New York, NY, USA; 2022.
2. Baloyi SM, Mokwena KJL. Metabolic Syndrome in Reproductive Health: urgent Call for Screening. In: Lifestyle and Epidemiology: The Double Burden of Poverty and Cardiovascular Diseases in African Populations; 2021:191.
3. Zhao L, Pang AJ. Effects of Metabolic syndrome on semen quality and circulating sex hormones: a systematic review and meta-analysis. Front Endocrinol (Lausanne). 2020;11:428. doi:10.3389/fendo.2020.00428
4. Liu Y, Chen P-HC, Krause J, Peng LJJ. How to read articles that use machine learning: users’ guides to the medical literature. JAMA. 2019;322(18):1806–1816. doi:10.1001/jama.2019.16489
5. Triantafyllidis AK, Tsanas AJ. Applications of machine learning in real-life digital health interventions: review of the literature. J Med Internet Res. 2019;21(4):e12286. doi:10.2196/12286
6. Wu T-E, Chen H-A, Jhou M-J, Chen Y-N, Chang T-J, Lu C-J. Evaluating the effect of topical atropine use for myopia control on intraocular pressure by using machine learning. J Clin Med. 2020;10(1):111. doi:10.3390/jcm10010111
7. Lee T-S, Lu C-J. Health informatics: the foundations of public health.
8. Lu H, Uddin S Disease prediction using graph machine learning based on electronic health data: a review of approaches and trends.
9. Iqbal I, Mustafa G, Ma JJD. Deep learning-based morphological classification of human sperm heads. Diagnostics. 2020;10(5):325. doi:10.3390/diagnostics10050325
10. Liu K, Zhang Y, Martin C, Ma X, Shen BJ. Translational bioinformatics for human reproductive biology research: examples, opportunities and challenges for a future reproductive medicine. Int J Mol Sci. 2022;24(1):4. doi:10.3390/ijms24010004
11. Huang -H-H, Hsieh S-J, Chen M-S, et al. Machine learning predictive models for evaluating risk factors affecting sperm count: predictions based on health screening indicators. J Clin Med. 2023;12(3):1220. doi:10.3390/jcm12031220
12. Shehadeh HA, Jebril IH, Jaradat GM, et al. Intelligent diagnostic prediction and classification system for Parkinson’s Disease by Incorporating Sperm Swarm Optimization (SSO) and density-based feature selection methods. Int J Adv Soft Comput Appl. 2023;15(1). doi:10.15849/IJASCA.230320.08
13. Alhenawi E, Al-Sayyed R, Hudaib A, Mirjalili SJ. Feature selection methods on gene expression microarray data for cancer classification: a systematic review. Comput Biol Med. 2022;140:105051.
14. Pudjihartono N, Fadason T, Kempa-Liehr AW, O’Sullivan B. A review of feature selection methods for machine learning-based disease risk prediction. Front Bioinfor. 2022;2:927312. doi:10.3389/fbinf.2022.927312
15. Tan P-N, Steinbach M, Kumar V. Introduction to Data Mining, Pearson Education. Indian Nursing Council; 2006.
16. Bolón-Canedo V, Alonso-Betanzos A. Ensembles for feature selection: a review and future trends. Inform Fusion. 2019;52:1–12.
17. Chang -C-C, Yeh J-H, Chiu H-C, et al. Utilization of decision tree algorithms for supporting the prediction of intensive care unit admission of myasthenia gravis: a machine learning-based approach. J Pers Med. 2022;12(1):32. doi:10.3390/jpm12010032
18. Peng J, Chen C, Zhou M, Xie X, Zhou Y, Luo C-H. A machine-learning approach to forecast aggravation risk in patients with acute exacerbation of chronic obstructive pulmonary disease with clinical indicators. Sci Rep. 2020;10(1):1–9.
19. Shih -C-C, Lu C-J, Chen G-D, Chang -C-C. Risk prediction for early chronic kidney disease: results from an adult health examination program of 19,270 individuals. Int J Environ Res Public Health. 2020;17(14):4973. doi:10.3390/ijerph17144973
20. Inceer M, Brouillette MJ, Fellows LK, et al. Factors partitioning physical frailty in people aging with HIV: a classification and regression tree approach. HIV Med. 2022;23(7):738–749. doi:10.1111/hiv.13236
21. Gordon A, Breiman L, Friedman J, Olshen R, Stone CJ. Classification and Regression Trees. Wiley Interdiscip Rev. 1984;40(3):874.
22. Gulati P, Sharma A, Gupta MJ. Theoretical study of decision tree algorithms to identify pivotal factors for performance improvement: a review. Int J Comput Appl. 2016;141(14):19–25.
23. Ventimiglia E, Capogrosso P, Colicchia M, et al. Metabolic syndrome in white E uropean men presenting for primary couple’s infertility: investigation of the clinical and reproductive burden. Andrology. 2016;4(5):944–951. doi:10.1111/andr.12232
24. Ventimiglia E, Capogrosso P, Serino A, et al. Metabolic syndrome in White-European men presenting for secondary couple’s infertility: an investigation of the clinical and reproductive burden. Asian J Androl. 2017;19(3):368. doi:10.4103/1008-682X.175783
25. Ma J, Wu L, Zhou Y, et al. Association between BMI and semen quality: an observational study of 3966 sperm donors. Human Reprod. 2019;34(1):155–162. doi:10.1093/humrep/dey328
26. Guo D, Xu M, Zhou Q, Wu C, Ju R, Dai J. Is low body mass index a risk factor for semen quality? A PRISMA-compliant meta-analysis. Medicine. 2019;98(32):e16677.
27. Sato Y, Feig DI, Stack AG, et al. The case for uric acid-lowering treatment in patients with hyperuricaemia and CKD. Nat Rev Nephrol. 2019;15(12):767–775. doi:10.1038/s41581-019-0174-z
28. Johnson Q, Veith W. Effect of dietary plant and animal protein intake on sperm quality in monkeys. Arch Androl. 2001;46(2):145–151. doi:10.1080/01485010151094092
29. Falsig AM, Gleerup C, Knudsen U. The influence of omega‐3 fatty acids on semen quality markers: a systematic PRISMA review. Andrology. 2019;7(6):794–803. doi:10.1111/andr.12649
30. Jeppesen J, Facchini F, Reaven GJ. Individuals with high total cholesterol/HDL cholesterol ratios are insulin resistant. J Intern Med. 1998;243(4):293–298. doi:10.1046/j.1365-2796.1998.00301.x
31. Liu C-Y, Chou Y-C, Lin S-H, et al. Serum lipid profiles are associated with semen quality. Asian J Androl. 2017;19(6):633. doi:10.4103/1008-682X.195240
32. Gwynne JT, Strauss JF III. The role of lipoproteins in steroidogenesis and cholesterol metabolism in steroidogenic glands. Endocr Rev. 1982;3(3):299–329. doi:10.1210/edrv-3-3-299
33. Dossetor JB. Creatininemia versus uremia: the relative significance of blood urea nitrogen and serum creatinine concentrations in azotemia. Ann Intern Med. 1966;65(6):1287–1299. doi:10.7326/0003-4819-65-6-1287
34. Lehtihet M, Hylander BJA. Semen quality in men with chronic kidney disease and its correlation with chronic kidney disease stages. Andrologia. 2015;47(10):1103–1108. doi:10.1111/and.12388
35. Ferramosca A, Zara V. Diet and male fertility: the impact of nutrients and antioxidants on sperm energetic metabolism. Int J Mol Sci. 2022;23(5):2542. doi:10.3390/ijms23052542
 © 2023 The Author(s). This work is published and licensed by Dove Medical Press Limited. The
full terms of this license are available at https://www.dovepress.com/terms
and incorporate the Creative Commons Attribution
- Non Commercial (unported, 3.0) License.
By accessing the work you hereby accept the Terms. Non-commercial uses of the work are permitted
without any further permission from Dove Medical Press Limited, provided the work is properly
attributed. For permission for commercial use of this work, please see paragraphs 4.2 and 5 of our Terms.
© 2023 The Author(s). This work is published and licensed by Dove Medical Press Limited. The
full terms of this license are available at https://www.dovepress.com/terms
and incorporate the Creative Commons Attribution
- Non Commercial (unported, 3.0) License.
By accessing the work you hereby accept the Terms. Non-commercial uses of the work are permitted
without any further permission from Dove Medical Press Limited, provided the work is properly
attributed. For permission for commercial use of this work, please see paragraphs 4.2 and 5 of our Terms.