Back to Journals » Journal of Inflammation Research » Volume 17
Use of Machine Learning for the Identification and Validation of Immunogenic Cell Death Biomarkers and Immunophenotypes in Coronary Artery Disease
Authors Zhang YJ, Huang C, Zu XG, Liu JM, Li YJ
Received 10 October 2023
Accepted for publication 28 December 2023
Published 12 January 2024 Volume 2024:17 Pages 223—249
DOI https://doi.org/10.2147/JIR.S439315
Checked for plagiarism Yes
Review by Single anonymous peer review
Peer reviewer comments 3
Editor who approved publication: Dr Tara Strutt
Yan-jiao Zhang,1 Chao Huang,2 Xiu-guang Zu,1 Jin-ming Liu,1 Yong-jun Li1
1Department of Cardiology, The Second Hospital of Hebei Medical University, Shijiazhuang, 050000, People’s Republic of China; 2Department of Thoracic Surgery, The Fourth Hospital of Hebei Medical University, Shijiazhuang, 050011, People’s Republic of China
Correspondence: Yong-jun Li, Department of Cardiology, The Second Hospital of Hebei Medical University, Heping West Road No. 215, Shijiazhuang, 050000, People’s Republic of China, Tel +86 15803210938, Email [email protected]
Objective: Immunogenic cell death (ICD) is part of the immune system’s response to coronary artery disease (CAD). In this study, we bioinformatically evaluated the diagnostic and therapeutic utility of immunogenic cell death-related genes (IRGs) and their relationship with immune infiltration features in CAD.
Methods: We acquired the CAD-related datasets GSE12288, GSE71226, and GSE120521 from the Gene Expression Omnibus (GEO) database and the IRGs from the GeneCards database. After identifying the immune cell death-related differentially expressed genes (IRDEGs), we developed a risk model and detected immune subtypes in CAD. IRDEGs were identified using least absolute shrinkage and selection operator (LASSO) analysis. Using a nomogram, we confirmed that both the LASSO model and ICD signature genes had good diagnostic performance.
Results: There was a high degree of coincidence and immune representativeness between two CAD groups based on characteristic genes and hub genes. Hub genes were associated with the interaction of neuroactive ligands with receptors and cell adhesion receptors. The two groups differed in terms of adipogenesis, allograft rejection, and apoptosis, as well as the ICD signature and hub gene expression levels. The two CAD-ICD subtypes differed in terms of immune infiltration.
Conclusion: Quantitative real-time PCR (qRT-PCR) correlated CAD with the expression of OAS3, ITGAV, and PIBF1. The ICD signature genes are candidate biomarkers and reference standards for immune grouping in CAD and can be beneficial in precise immune-targeted therapy.
Keywords: bioinformatics, gene signature, immune infiltration, hub genes, immune grouping, immune-targeted therapy
Introduction
Over the past three decades, mortality from coronary artery disease (CAD) has decreased, primarily due to lowering low-density cholesterol and controlling traditional risk factors such as hypertension, smoking, obesity, and diabetes. However, cardiovascular disease (CVD) remains a significant global burden due to a lack of effective treatments. Therefore, it is essential to explore new therapeutic strategies.1 Many immune cells, including macrophages, T and B cells, dendritic cells, neutrophils, and mast cells, influence the development of atherosclerotic plaques by secreting cytokines, chemokines, proteases, procoagulants, and other bioactive molecules. An important contributor to CVD is atherosclerosis.2–5 Due to their unique characteristics, modified lipoproteins, such as oxidized low-density lipoproteins, can act as adjuvant molecular structures to activate the body’s innate immune responses and also as antigens to activate adaptive immune responses.6 There is a complex interaction between innate and adaptive immunity throughout the progression of CAD.
The Canakinumab Anti-inflammatory Thrombosis Outcome Study (CANTOS) trial provided the first evidence of the beneficial effects of inflammation-targeted therapy in atherosclerosis, but it did not show a reduction in overall or CVD mortality. In addition, the side effects of canakinumab were shown to include leukopenia and elevated mortality rates.7 The Cardiovascular Inflammation Reduction Trial (CIRT) revealed that individuals who received low-dose methotrexate for rheumatological or dermatological indications showed a reduction in cardiovascular events. Nevertheless, there was no decrease in the levels of inflammation biomarkers, including high sensitivity C-reactive protein (hsCRP), interleukin-1β (IL-1β), and interleukin-6 (IL-6), and, importantly, there was a significant increase in the incidence of skin cancer.8 The results of these clinical trials emphasize the importance of tailoring immunotherapy to specific cases of CVD and demonstrate the crucial role of inflammatory pathways in the pathogenesis of atherosclerosis.7,8 Thus, it is necessary to identify new markers of vascular inflammation, define patient subsets expected to benefit from immunotherapy, and develop more precise and safer targeted immunotherapies.9
The Nomenclature Committee on Cell Death (NCCD) defines immunogenic cell death (ICD) as “a form of regulated cell death that is sufficient to activate an adaptive immune response that is immunologically active”.10 Thus, ICD inducers can effectively activate the immune microenvironment. Targeting adaptive immunity in combination with immune checkpoint blockers offers a promising strategy to improve the effectiveness of immunotherapy and reduce immunological side effects.11,12 Immunotherapeutic strategies can be developed by discovering reliable biological markers and targeting adaptive immunity.13 Immunological research in CAD is grounded in the close association of ICDs with the immune environment and the success of ICD inducers in cancer immunotherapy.14–16
The immunological features and role of ICD in CAD have not been clearly established.17–21 In this study, we aimed to systematically evaluate IRGs and immune infiltration features in CAD at multiple levels using bioinformatic approaches to offer insights into diagnosis and immunotherapy. Figure 1 depicts the workflow of the study and the use of the Gene Expression Omnibus (GEO) database and peripheral blood samples to identify immunogenic cell death-related differentially expressed genes (IRDEGs). We created a gene signature consisting of 17 genes and a nomogram model. We performed the validation using an external dataset and quantitative real-time PCR (qRT-PCR). Additionally, we identified immune subtypes, performed network and functional enrichment analyses, and characterized immune cell infiltration. To the best of our knowledge, this is the first study to identify risk factors for CAD from the perspective of ICD. Classifying patients and carefully examining their biological and immunological characteristics can lay the groundwork for developing individualized treatments for CAD.
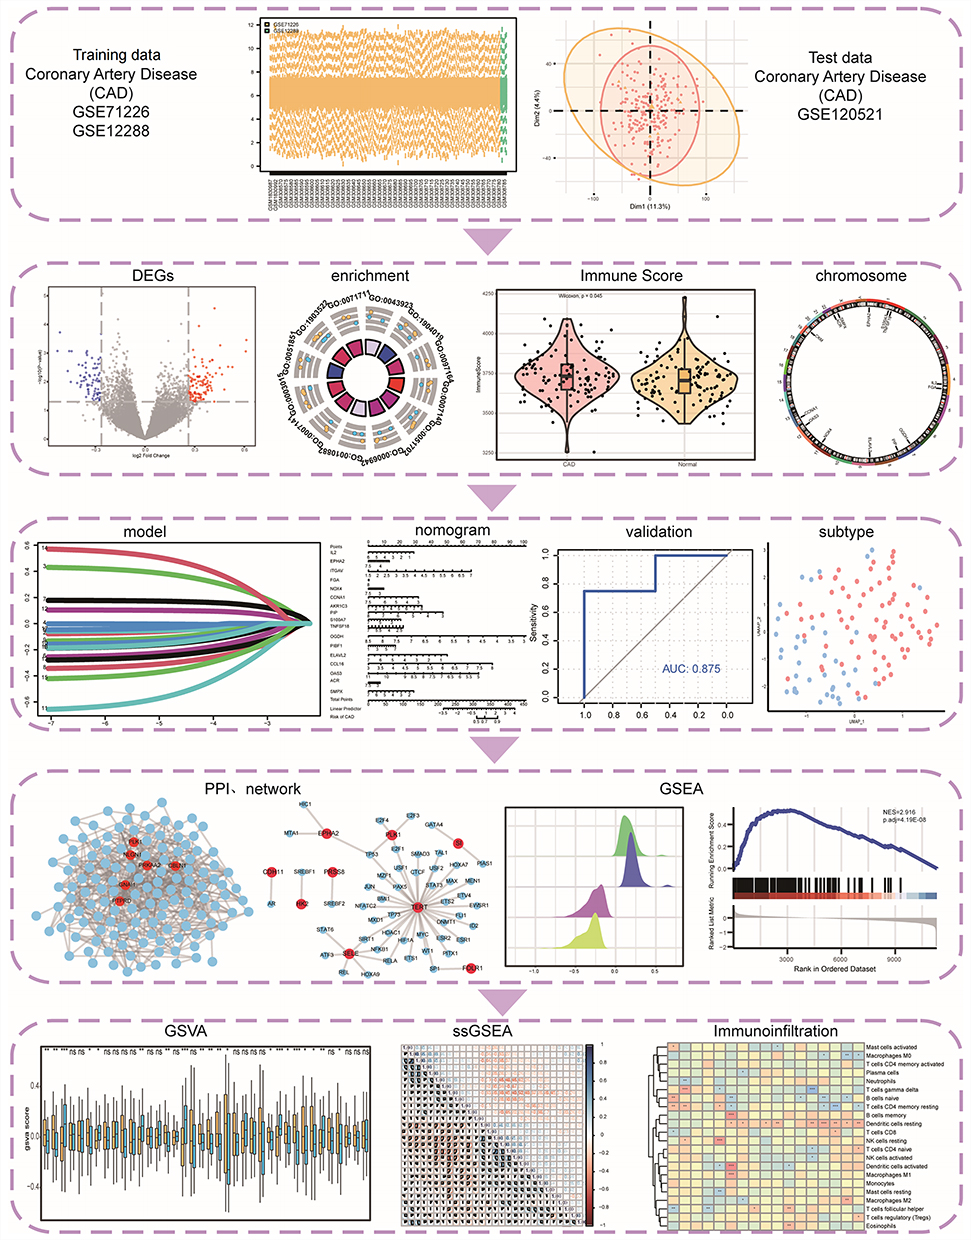 |
Figure 1 Technology Roadmap. *P < 0.05, **P < 0.01, and ***P < 0.001. Abbreviations: DEGs, differentially expressed genes; PPI, Protein-protein interaction; GSEA, Gene Set Enrichment Analysis; GSVA, Gene Set Variation Analysis. |
Materials and Methods
Data Collection and Processing
We accessed publicly available gene expression profiles for patients with CAD from the GSE12288,22 GSE71226, and GSE12052123 datasets of the GEO database.24 We included a total of 110 CAD and 108 normal samples in GSE12288, based on the GPL96 platform. GSE71226 included data from three patients with CAD and three normal samples based on the GPL570 platform. GSE120521 consisted of four CAD cases and four normal cases based on the GPL16791 platform. We used GSE12288 and GSE71226 as training datasets and GSE120521 as the validation dataset. Details of the GEO datasets are shown in Table 1.
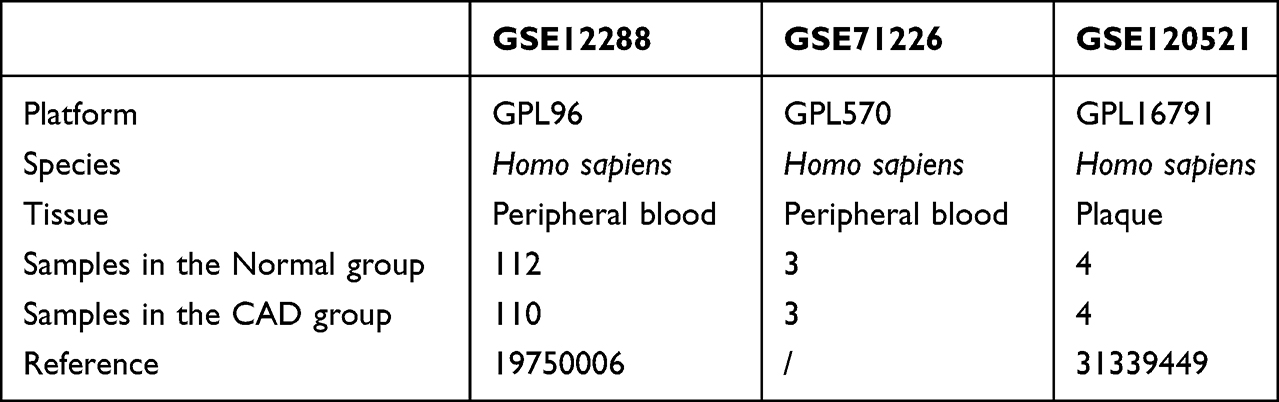 |
Table 1 Overview of GEO Datasets |
Immunogenic cell death-related genes (IRGs) were retrieved from the GeneCards database25 using “Immunogenic cell death” as the search term and employing a screening criterion of a score>5.96. In total, we obtained 1771 IRGs, as listed in Table S1.
CAD-Associated DEGs
We subjected the GSE12288 and GSE71226 datasets to de-batch processing using the package R “sva”26 and obtained the integrated GEO datasets (combined datasets), which contained 113 CAD samples and 115 control (normal) samples. Finally, we normalized the integrated GEO datasets and the validation dataset GSE120521 using the “limma” package in R,27 followed by probe annotation and other standardization and normalization processes.
We divided the samples into CAD and control (normal) groups. We evaluated the differential gene expression between the CAD and normal groups using the limma package in R.27 |FC| > 1.2, adj. P < 0.05 were set as the threshold values for DEGs.
The overlap between IRGs and DEGs in the integrated GEO datasets identified 18 IRDEGs for further analysis. We visualized the outcomes of the differential expression analyses for chromosome localization using the R packages “ggplot2” for volcano mapping, “pheatmap” for heat mapping, and “RCircos”.28
We used the R package ESTIMATE to compare the immune scores between the normal and CAD groups and to determine the relationship between IRDEG expression levels and immune scores.
Construction of a Forest Model and Nomogram Model
To detect the feature genes among the IRDEGs, we downscaled the integrated GEO dataset using the least absolute shrinkage and selection operator (LASSO) algorithm. We used an established risk score formula to calculate the penalty coefficients for the feature genes, which were then weighted using individual normalized gene expression values. The penalty coefficients of the feature genes were displayed using forest plots.

To predict the risk of CAD, we constructed columnar line graph models based on selected signature genes. We verified the accuracy of the model using a separate validation set. Using the R package pROC,29 we plotted receiver operating characteristic (ROC) curves, and the area under the curve (AUC) was calculated to determine the accuracy of the diagnostic model. To evaluate the decision-making efficacy of the model with respect to patient outcomes, we used the “ggDCA” package in R30 to create a decision curve analysis (DAC) curve.31
Identification of ICD Subtypes
The Uniform Manifold Approximation and Projection (UMAP) partitions or compresses patient groups based on their features. We used the algorithm in the R package UMAP32 to evaluate the genetic characteristics of patients with CAD and categorize them into different subtypes.
Differences in Biological Characteristics Between ICD Subtypes
Gene Ontology (GO) analysis is a commonly used approach for evaluating functional enrichment at the biological process (BP), molecular function (MF), and cellular component (CC) levels.33 The Kyoto Encyclopedia of Genes and Genomes (KEGG) database contains data on genomes, biological pathways, diseases, medications, and other aspects.34 We used the R package clusterProfiler35,36 to perform GO functional annotation and KEGG pathway enrichment analyses of DEGs in CAD-ICD subtypes. The statistical significance was set at P < 0.05.
To analyze if a group of predefined genes exhibited statistically significant differences between two biological states, we used a computational technique known as the Gene Set Enrichment Analysis (GSEA), which is frequently adopted to assess alterations in pathways and biological processes in samples from expression datasets.37 We downloaded the reference gene sets “c5.go.v7.4. entrez.gmt” and “c2.cp.kegg.v7.4. entrez.gmt” from the MSigDB database38 to investigate the differences in biological processes between CAD-ICD subtypes. We used the clusterProfiler R package for the GSEA and visualization, with an adjusted P-value of 0.05 indicating statistical significance. Using the reference gene set “h.all.v7.4. symbols.gmt” downloaded from the MSigDB database38 and the R package GSVA,39 we calculated enrichment scores for each sample in the dataset at each hallmark and determined the correlations between dysregulated pathways in patients with CAD. Differences were considered statistically significant at a P-value of < 0.05.
Protein-Protein, mRNA-miRNA, mRNA-RBP, mRNA-TF, and mRNA-Drug Interaction Networks
We used the STRING database40 to construct a protein-protein interaction network (PPI)41 corresponding to DEGs between CAD-ICD subtypes. The minimum necessary interaction score was 0.150. PPIs were exported and further analyzed using Cytoscape.42 The Cytohubba plug-in43 consists of 12 algorithms. We obtained the top 30 nodes for each algorithm, and the genes obtained by at least 5 algorithms were identified as hub nodes.
Using the GOSemSim R package, we calculated the geometric mean of semantic similarities to evaluate the similarity of protein functions.
We used seven prediction programs (TargetScan, microT, miRmap, picTar, RNA22, PITA, and miRanda) to obtain hub gene-associated miRNAs from the StarBase database(https://starbase.sysu.edu.cn/). We retrieved hub gene-associated transcription factors (TF) from the miRNet database(http://www.mirnet.ca). We predicted the RNA-binding proteins (RBP) that interact with hub genes with the help of the Encyclopedia of RNA Interactomes (ENCORI) database (https://rnasysu.com/encori/index.php) and we set clipExpNum ≥ 5 and clipIDnum > 10 as the screening criteria for mRNA-RBP pairs. Using References ≥ 3 and Organisms ≥ 2 as screening criteria, the public Comparative Toxicogenomics Database (CTD) (http://ctdbase.org/) was used to predict potential drugs or small molecule compounds that interact with hub genes. Interaction networks were visualized using Cytoscape.
Immune Cell Infiltration Analysis
Using a single-sample gene set enrichment analysis (ssGSEA), we determined the contents of 28 immune cells from patients with different CAD subtypes and visualized the composition of immune cells using box plots.44 A Wilcoxon test was performed to compare immune cell proportions, and a P-value < 0.05 was regarded as statistically significant.
CIBERSORTX leverages machine learning to infer cell type-specific gene expression profiles without physically separating cells. The abundance of immune cells in samples was evaluated using RNA-seq data.45 The abundance of 22 immune cell species in the patients with different CAD subtypes was evaluated using the CIBERSORTX algorithm (https://cibersortx.stanford.edu/). We used the R package corrplot46 to generate a heat map of the correlation between immune cell infiltration levels in patients with different CAD subtypes.
Peripheral Blood Collection, RNA Extraction, and qRT-PCR Validation
We collected whole blood samples from 10 patients with CAD and 10 age- and gender-matched healthy subjects (Table S2) using EDTA anticoagulation tubes at the Second Hospital of Hebei Medical University, China. The study was approved by the Ethics Committee of the institution. All enrolled participants gave their informed consent.
Total RNA was extracted from the fresh whole blood samples using the RNAPrep High Efficiency Blood Total RNA Extraction Kit (TIANGEN, Beijing, China), following the instructions provided by the manufacturer. With the PrimeScript RT Reagent Kit with gDNA Eraser (TaKaRa Bio, Beijing, China), the cDNA was reverse transcribed using the Fluorescence Quantification Kit Platinum SYBR Green qPCR SuperMix-UDG (Invitrogen, Carlsbad, CA, USA) and the FTC-3000 Real Time Quantitative Thermal Cycler (Funglyn Biotech, Richmond Hill, Canada) for qRT-PCR. The relative expression levels of the target genes were calculated using the 2−ΔΔCt method by normalizing the expression levels to the levels of GAPDH, the reference gene. The primers used for qRT-PCR are listed in Table 2.
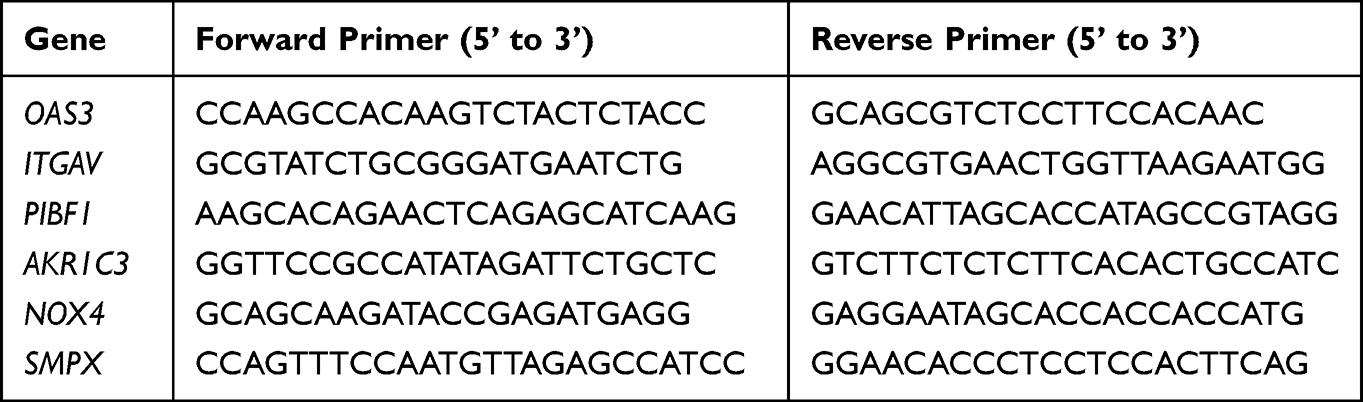 |
Table 2 Sequences of Primers Used for Quantitative Real-Time PCR |
Statistical Analysis
We used R (version 4.1.1) for performing the statistical analyses of our data. Independent t-tests were used to compare two groups of normally distributed continuous variables. Wilcoxon rank-sum tests were used to compare two groups of non-normally distributed independent variables. Pearson’s correlation analysis was used to evaluate the correlation coefficients between the different genes. Statistical analyses were performed using two-sided P-values, and significance was determined at P < 0.05.
Results
Landscape of Differentially Expressed Genes (DEGs) in CAD
The training set data, compiled from the merged and batch-normalized GSE12288 and GSE71226 datasets, consisted of 113 disease records and 115 normal records (Figure 2A–D).
 |
Figure 2 Landscape of DEGs in CAD. (A) Box plot of the combined dataset before standardization. (B) Box plot of the combined dataset after standardization. (C) PCA plot of the combined dataset before standardization. (D) PCA plot of the combined dataset after standardization. (E) Volcano plot of differential gene expression between the CAD and normal groups. (F) Histogram of the results of the GO and KEGG pathway enrichment analyses for the categories: BP, CC, MF, and biological pathway (Pathway). The horizontal coordinates are the GO and KEGG terms, and the vertical coordinates represent the number of genes. (G) Results of the GO functional enrichment analysis; the node color indicates the gene expression level, and the quadrilateral color indicates the Z-score. (H) Results of the KEGG pathway enrichment analysis; the node color indicates the gene expression level, and the quadrilateral color indicates the Z-score for a KEGG pathway. (I) Immune scores for CAD and normal samples; pink indicates CAD, blue indicates normal, and the vertical axis is the immune score. Abbreviations: DEGs, differentially expressed genes; CAD, coronary artery disease; GO, Gene Ontology; KEGG, Kyoto Encyclopedia of Genes and Genomes; BP, biological process; CC, cellular component; MF, molecular function. |
We detected 196 DEGs between the CAD and control samples, including 121 upregulated and 75 downregulated DEGs in CAD (Figure 2E). Gene Ontology (GO) functional annotation (Table S3A and Figure 2F) revealed that these DEGs were predominantly associated with the positive regulation of viral transcription by the host and involved in processes such as epithelial cell apoptosis, ammonium ion metabolism, meiotic nuclear division in males, and symbiont interactions (Figure 2G).
The KEGG pathway analysis revealed that these genes are involved in hypertrophic cardiomyopathy, dilated cardiomyopathy, arrhythmogenic right ventricular cardiomyopathy, ABC transporter, and ECM-receptor interactions (Figure 2H and Table S3B). Patients with CAD had significantly higher immune scores than those with normal samples, as determined by the simultaneous analysis of the immune scores between CAD and normal samples (P < 0.05; Figure 2I).
Overview of IRDEGs in CAD
We identified 18 IRDEGs: interleukin-2 (IL2), ephrin type-A receptor 2 (EPH2), fibrinogen α chain (FGA), 2’-5’-oligoadenylate synthetase 3 [EC2.7.7.84] (OAS3), integrin α chain V (ITGAV), progesterone-induced-blocking factor 1 (PIBF1), aldo-keto reductase family 1 member C3 [EC 1.1.1.188] (AKR1C3), prolactin-induced protein (PIP), S100 calcium-binding protein A7 (S100A7) psoriasin, tumor necrosis factor ligand superfamily member 18 (TNFSF18), α-ketoglutarate dehydrogenase, 2-oxoglutarate dehydrogenase E1 component, mitochondrial [EC:1.2.4.2] (OGDH), ”ELAV-like protein 2 (ELAVL2), chemokine (C-C motif) ligand 16 (CCL16), creatine kinase, muscle [EC2.7.3.2] (CKM), autophagy-related circular RNA (ACR), nicotinamide adenine dinucleotide phosphate oxidase 4 [EC1.6.99.1] (NOX4), cyclin A (CCNA1), and small muscle protein X-linked (SMPX). These genes were visualized in a heatmap (Figure 3A) and group comparison maps (Figure 3B). The CAD and control groups showed considerable differences in the expression levels of IRDEGs (P < 0.05); 14 genes were upregulated in the disease group (IL2, EPHA2, FGA, NOX4, CCNA1, PIP, S100A7, TNFSF18, OGDH, ELAVL2, OAS3, CKM, ACR, and SMPX), and four genes were downregulated in the disease group (ITGAV, AKR1C3, PIBF1, and CCL16).
 |
Figure 3 Panoramic view of IRDEGs (A) Expression of IRDEGs in the CAD and control groups. (B) Graphical display of IRDEGs between CAD and control groups, *P < 0.05, **P < 0.01, and ***P < 0.001. (C) Chromosomal localization of upregulated IRDEGs. (D) Chromosomal localization of downregulated IRDEGs. (E) Correlations between the immune score and IRDEGs in all CAD samples; the horizontal axis represents correlation; the vertical axis represents IRDEGs. Abbreviations: IRDEGs, immune cell death-related differentially expressed genes; CAD, coronary artery disease. |
We used the RCircos package to annotate the chromosomal locations of 14 upregulated and 4 downregulated IRDEGs. Of the 14 upregulated IRDEGs, S100A7 and TNFSF18 were located on chromosome 1, IL2 and FGA on chromosome 4, OGDH and PIP on chromosome 7, ELAVL2 on chromosome 9, NOX4 on chromosome 11, OAS3 on chromosome 12, CCNA1 on chromosome 13, CKM on chromosome 19, ACR on chromosome 22, and SMPX and ACR on chromosome X (Figure 3C). Among the four upregulated IRDEGs (Figure 3D), ITGAV was located on chromosome 2, AKR1C3 on chromosome 10, PIBF1 on chromosome 13, and CCL16 on chromosome 17.
In the correlation analyses, the levels of 16 IRDEGs were correlated with immune scores. There were significant negative correlations between the immune scores and several IRDEGs such as ACR, ELAVL2, PIP, CCL16, and FGA (P < 0.05, r < 0), while the immune scores and OGDH, PIBF1, and AKR1C3 were positively correlated (P < 0.05, r > 0, Figure 3E).
Contributions of IRDEGs to CAD Progression
Based on the integrated GEO dataset, we conducted a least absolute shrinkage and selection operator (LASSO) regression analysis to investigate the effect of the 18 IRDEGs on CAD. We identified the following 17 signature genes with high impact on CAD: IL2, EPHA2, ITGAV, FGA, NOX4, CCNA1, AKR1C3, PIP, S100A7, TNFSF18, OGDH, PIBF1, ELAVL2, CCL16, OAS3, ACR, and SMPX (Figure 4A–C). We plotted the ROC curve based on the predicted risk score, and the AUC value was 0.813 for the training dataset (Figure 4D).
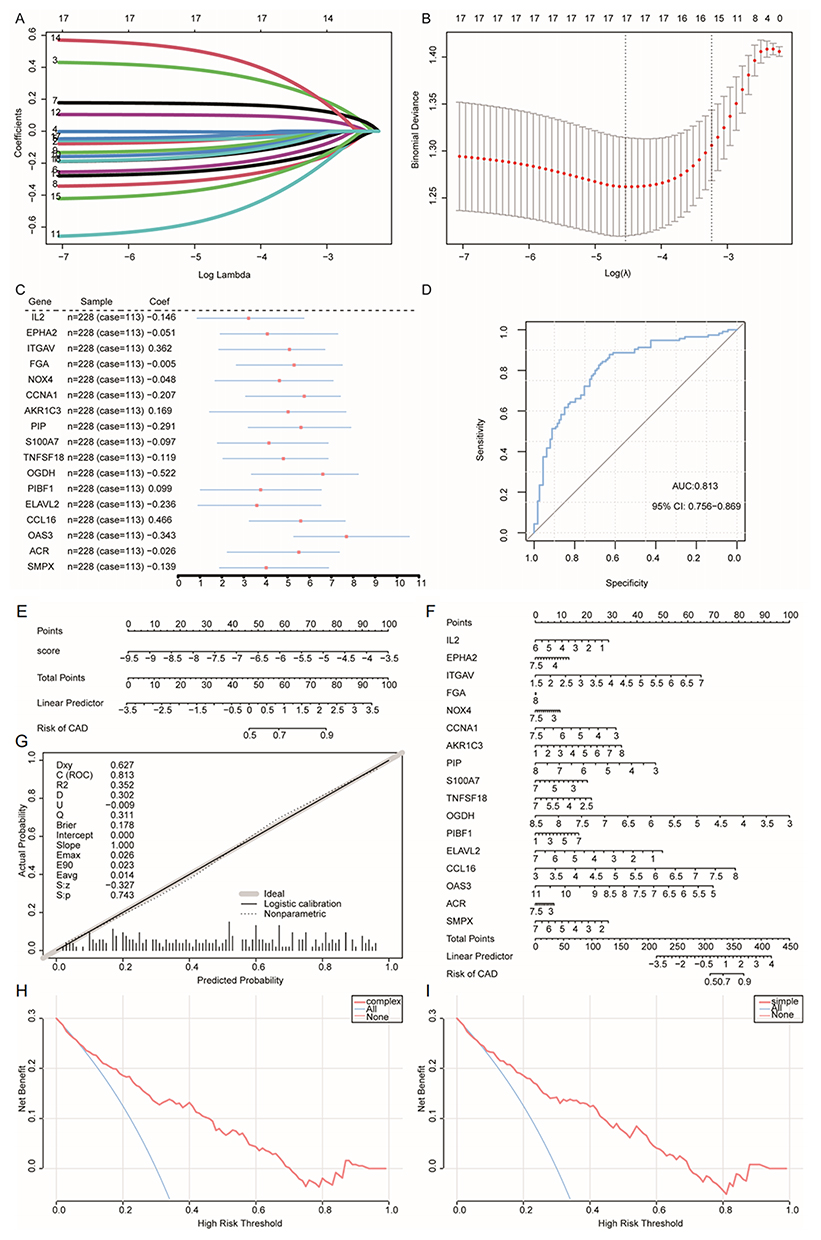 |
Figure 4 Diagnostic model construction and evaluation based on IRDEGs. (A and B) LASSO regression was used to identify significant IRDEGs related to CAD. (C) Forest plot of the genes in the diagnostic model. (D) ROC curve of the predicted risk score in the CAD training set. (E) Nomogram of the LASSO risk scores. (F) Expression nomogram plot of the 17 trait genes. (G) Calibration curve plot of the LASSO risk score model. (H) DCA curve of the trait-related genes; blue indicates follow-on diagnosis and pink indicates a trait gene combination. (I) DCA curve of predicted risk scores; blue indicates a follow-up diagnosis and pink indicates a risk score model. Abbreviations: IRDEGs, immune cell death-related differentially expressed genes; LASSO, least absolute shrinkage and selection operator; CAD, coronary artery disease; ROC, receiver operating characteristic; DCA, decision curve analysis. |
According to the nomogram (Figures 4E and F), the LASSO risk score and 17 signature genes were predictors of the occurrence of CAD. Additionally, a calibration curve for the column-line plot (nomogram plot) of the LASSO risk score revealed that the diagnostic model for CAD had high accuracy and good model performance (Figure 4G). We used a decision curve analysis (DCA) to evaluate the diagnostic value of the 17 characteristic genes (Figure 4H) and the LASSO risk score model (Figure 4I). The DCA indicated that the diagnosis of CAD using column-line graph models was effective.
We generated box plots of the expression levels of key genes in CAD and normal samples in the GSE120521 dataset (Figure 5A) to verify whether these signature genes showed differential and similar expression trends in other datasets. The differences between the CAD and the normal groups in the expression of CCNA1, ELAVL2, FGA, IL2, ITGAV, OAS3, OGDH, PIBF1, and TNFSF18 were significant (P < 0.05), and the expression trends were consistent with those in the combined data set. The AUC for the test set was 0.875 using ROC curves calculated from the predicted risk scores (Figure 5B). AUC values were 0.875 for TNFSF18 (Figure 5C), 0.938 for PIP (Figure 5D), 0.719 for OAS3 (Figure 5E), 0.875 for OGDH (Figure 5F), 0.938 for ITGAV (Figure 5G), 0.750 for FGA (Figure 5H), 0.688 for CCNA1 (Figure 5I), and 0.750 for IL2 (Figure 5J). Integration of the projected ROC curves for the remaining trait-related genes (Figure S1) showed that these genes all had good predictive performance.
 |
Figure 5 Feature gene expression in the validation set GSE120521 and in various parts of the human body. (A) Grouped comparison plots of feature genes in the CAD and normal groups in the GSE120521 dataset, *P < 0.05, **P < 0.01, (B) ROC curves of the predicted risk scores for diagnosis in the validation set GSE120521. (C–J) ROC curve of the feature genes (C) TNFSF18, (D) PIP, (E) OAS3, (F) OGDH, (G) ITGAV, (H) FGA, (I) CCNA1, and (J) IL2 in the validation set GSE120521. (K–N) Expression of (K) EPHA2, (L) FGA, (M) IL2, and (N) ITGAV in normal and tumor tissues of 34 tissues and organs. *P < 0.05, **P < 0.01, ***P < 0.001, and ****P < 0.0005. Abbreviations: CAD, coronary artery disease; ROC, receiver operating characteristic. |
In addition, we investigated the expression levels of 17 signature genes in various parts of the body. We used violin plots to visualize the differential expression of EPHA2 (Figure 5K), FGA (Figure 5L), IL2 (Figure 5M), and ITGAV (Figure 5N) in 34 tissues and organs, as well as in normal and tumor tissues. There were significant differences between the normal and tumor tissues in the expression of these characteristic genes across most cancer types (P < 0.05) (Figure S2).
ICD Subtypes in CAD
Using the UMAP method, we identified two CAD-ICD subtypes, cluster 1 and cluster 2, based on 17 signature genes in the integrated GEO dataset (Figure 6A). Cluster 1 contained 74 samples, and cluster 2 contained 39 samples. Clustering revealed significant differences between the two subtypes in terms of the signature genes (Figure 6B). We separately analyzed the CAD-ICD subtypes for the expression levels of the 17 signature genes and found that ELAVL2, EPHA2, ITGAV, and NOX4 were differentially expressed (Figure 6C).
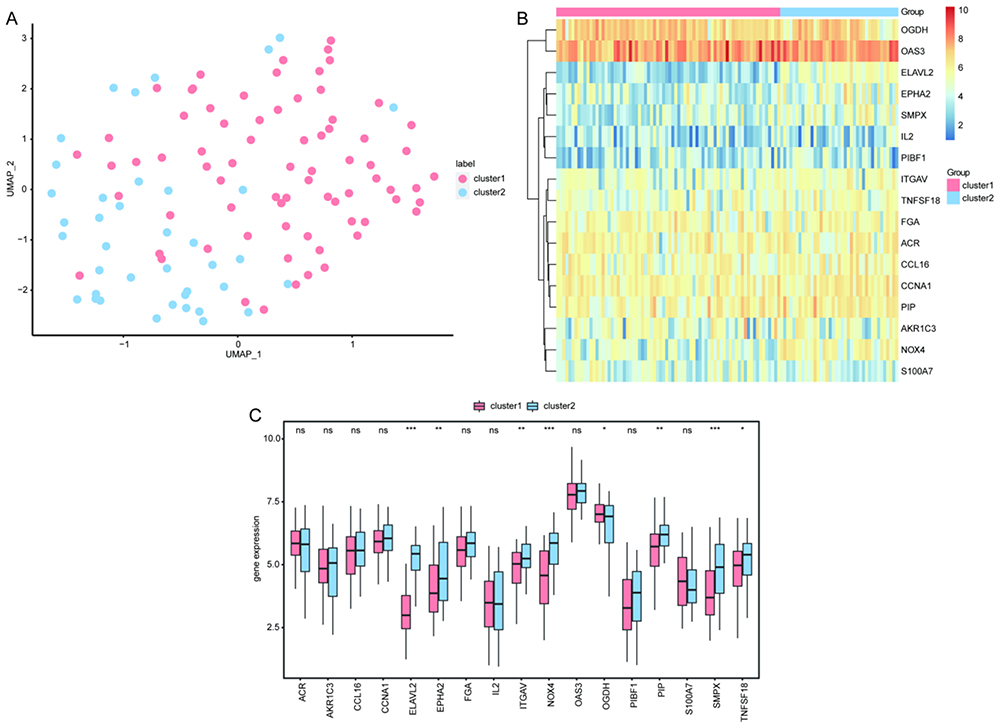 |
Figure 6 Clustering analysis of the two CAD-ICD subtypes. (A) Plot of the UMAP clustering results. (B) Heat map of the feature gene expression in the two clusters. (C) Intergroup comparison of feature gene expression; the horizontal axis shows the signature genes, while the vertical axis shows the gene expression levels. Pink indicates cluster 1, blue indicates cluster 2, *P < 0.05, **P < 0.01, ***P < 0.001. Abbreviations: CAD, coronary artery disease; ICD, immunogenic cell death; UMAP, Uniform Manifold Approximation and Projection. |
Network Analyses
The two CAD-ICD subtypes showed differences in expression, and we used 138 DEGs to construct a PPI network to investigate the interactions. We included 471 reciprocal pairs and 135 genes in the PPI network and visualized it using Cytoscape. PTPRD, GNAI1, CBLN1, PRKAA2, NLGN1, and PLK1 nodes interacted with 25, 19, 19, 18, 18, and 17 genes, respectively (Figure 7A).
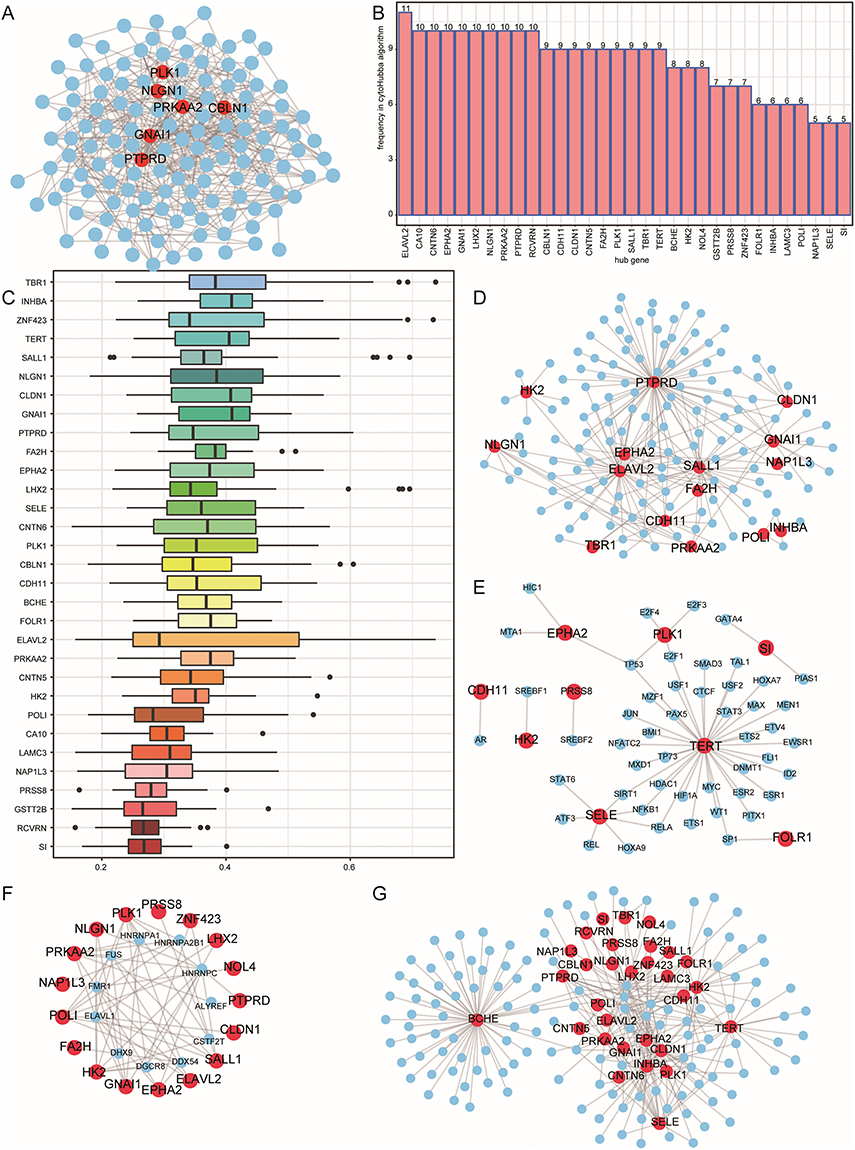 |
Figure 7 PPI network and hub gene networks based on DEGs in the CAD-ICD subgroups. (A) PPI network. Blue nodes are shared genes and red nodes are shared genes with a higher number of shared genes than the medium degree. (B) Gene frequency table based on 12 algorithms; the horizontal axis shows the genes and the vertical axis shows frequencies. (C) GO semantic similarity score of hub genes in the PPI for DEGs; the horizontal axis indicates the similarity level, and the vertical axis indicates the gene. (D) mRNA-miRNA network; red nodes represent genes and blue nodes represent miRNAs. (E) mRNA-TF network; red nodes represent genes and blue nodes represent TFs. (F) mRNA-RBP network; red nodes represent genes and blue nodes represent RBPs. (G) mRNA-drug network; red nodes represent genes and blue nodes represent drugs. Abbreviations: PPI, Protein-protein interaction; DEGs, differentially expressed genes; CAD, coronary artery disease; ICD, immunogenic cell death; GO, Gene Ontology; TF, transcription factor; RBP, RNA-binding protein. |
We calculated the top 30 nodes obtained by each algorithm using the 12 algorithms in CytoHubba. In total, we identified 32 genes obtained through at least five algorithms as hub genes (Figure 7B). The GO semantic similarity of the hub genes showed that TBR1, INHBA, and ZNF423 were functionally related to several genes (Figure 7C). We predicted miRNA interactions using 32 hub genes. Nineteen hub genes and 176 miRNA molecules were included in the mRNA-miRNA interaction network, which consisted of 235 pairs (Figure 7D).
We constructed the mRNA-TF network and acquired interaction data for nine hub genes and 49 TFs. Among these, TERT was associated with 36 TFs. The mRNA-TF interaction network contained 56 interaction pairs. (Figure 7E).
We identified 11 RBPs associated with 17 hub genes by constructing an mRNA-RBP network of hub genes (Figure 7F). The mRNA-RBP interaction network contained 59 pairs of interactions.
The mRNA-drug interaction network (Figure 7G) indicated that 134 potential drugs or molecules were linked to 30 hub genes. Among these, C006780 simultaneously targeted 27 hub genes. In the mRNA-drug interaction network, we detected 280 pairs of interactions.
Biological Characterization of Hub Genes
A GO functional enrichment analysis revealed that the hub genes were mainly related to the following functions: response to alcohol, heterophilic cell-cell adhesion via plasma membrane cell adhesion molecules, postsynaptic specialization assembly, presynapse assembly, response to ketone, and other biological processes (Figure 8A and B), intrinsic component of synaptic membrane, synaptic membrane, photoreceptor cell cilium, nuclear cyclin-dependent protein kinase holoenzyme complex, 9+0 non-motile cilium, and other cellular components (Figure 8C), peptide hormone binding, superoxide-generating NAD(P)H oxidase activity, glucose binding, heme binding, hormone binding, and other cellular functions (Figure 8D), as well as affecting galactose metabolism, starch and sucrose metabolism, carbohydrate digestion and absorption, neuroactive ligand-receptor interaction, cell adhesion molecules, and other KEGG pathways (Figure 8E).
 |
Figure 8 GO and KEGG enrichment analyses of hub genes. (A) Histogram of the GO functional enrichment analysis. Node colors indicate gene expression levels and line colors indicate different biological functions. (B) BP (C) CC (D) MF (E) KEGG enrichment analyses. Abbreviations: GO, Gene Ontology; KEGG, Kyoto Encyclopedia of Genes and Genomes; BP, biological process; CC, cellular component; MF, molecular function. |
Hub Gene Subtypes in CAD
Thirty-one of the 32 hub genes in the PPI network were identified in the integrated GEO dataset. Using the UMAP method, two hub gene subtypes, cluster 1 and cluster 2, were identified based on 31 hub genes (Figure 9A). We found that 80 samples in cluster 1 and 33 samples in cluster 2 overlapped with the CAD-ICD subtype results. Of the 74 samples in CAD-ICD cluster 1, 69 were located in cluster 1, and 28 of the 33 hub genes for cluster 2 samples were located in cluster 2. This result indicated that the model conducted with the 17 signature genes was representative. The clustering results showed that the hub genes varied significantly between subtypes (Figure 9B). A comparison of the 31 hub genes between the two subtypes revealed significant differences in their expression levels (P < 0.05; Figure 9C).
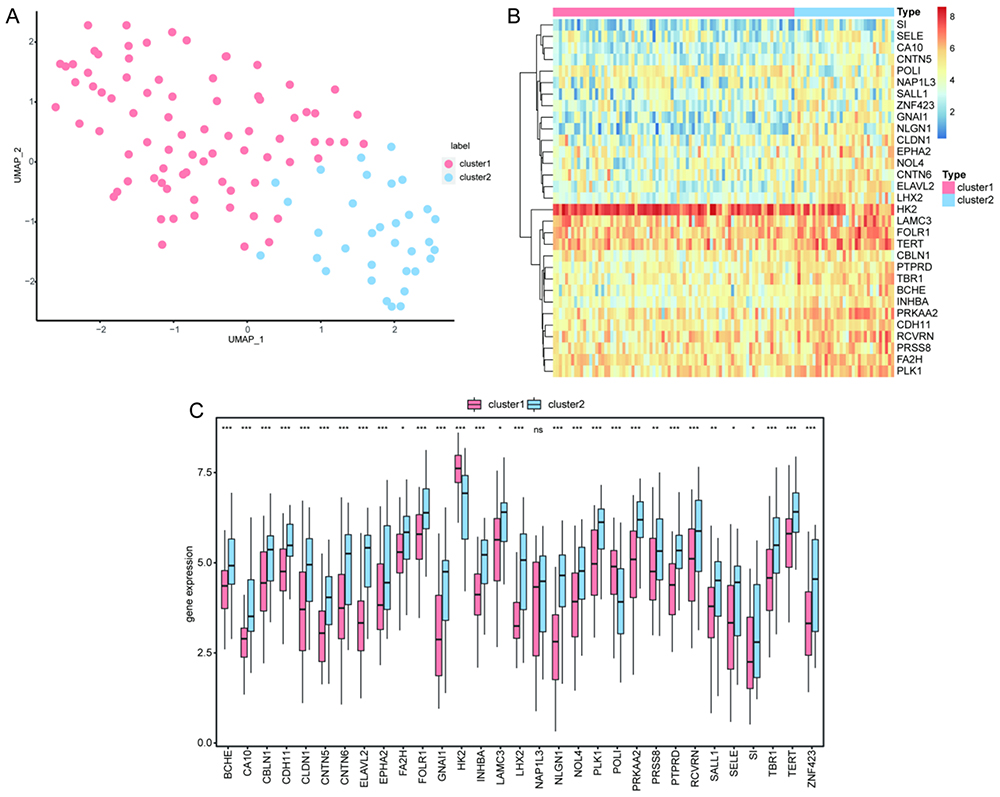 |
Figure 9 Clustering analysis of hub gene subtypes in CAD. (A) Plot of UMAP clustering results. (B) Heat map of hub gene expression in the two clusters. (C) Intergroup comparison of hub gene expression; the horizontal axis shows the hub genes, while the vertical axis shows the hub gene expression levels. Pink indicates cluster 1 and blue indicates cluster 2. *P < 0.05, **P < 0.01, ***P < 0.001. Abbreviations: CAD, coronary artery disease; UMAP, Uniform Manifold Approximation and Projection. |
Biological Enrichment Analysis of Distinct CAD-ICD Subtypes
We performed a gene set enrichment analysis (GSEA) (Figure 10A) to further determine the differences between the CAD-ICD subtypes. The results are shown in Table S4. In cluster 1, several biologically relevant pathways, such as ficolin 1 rich granule (Figure 10B) and phagocytic vesicle (Figure 10C), were upregulated, whereas cation transmembrane transporter activity (Figure 10D) and pattern specification process (Figure 10E) were downregulated.
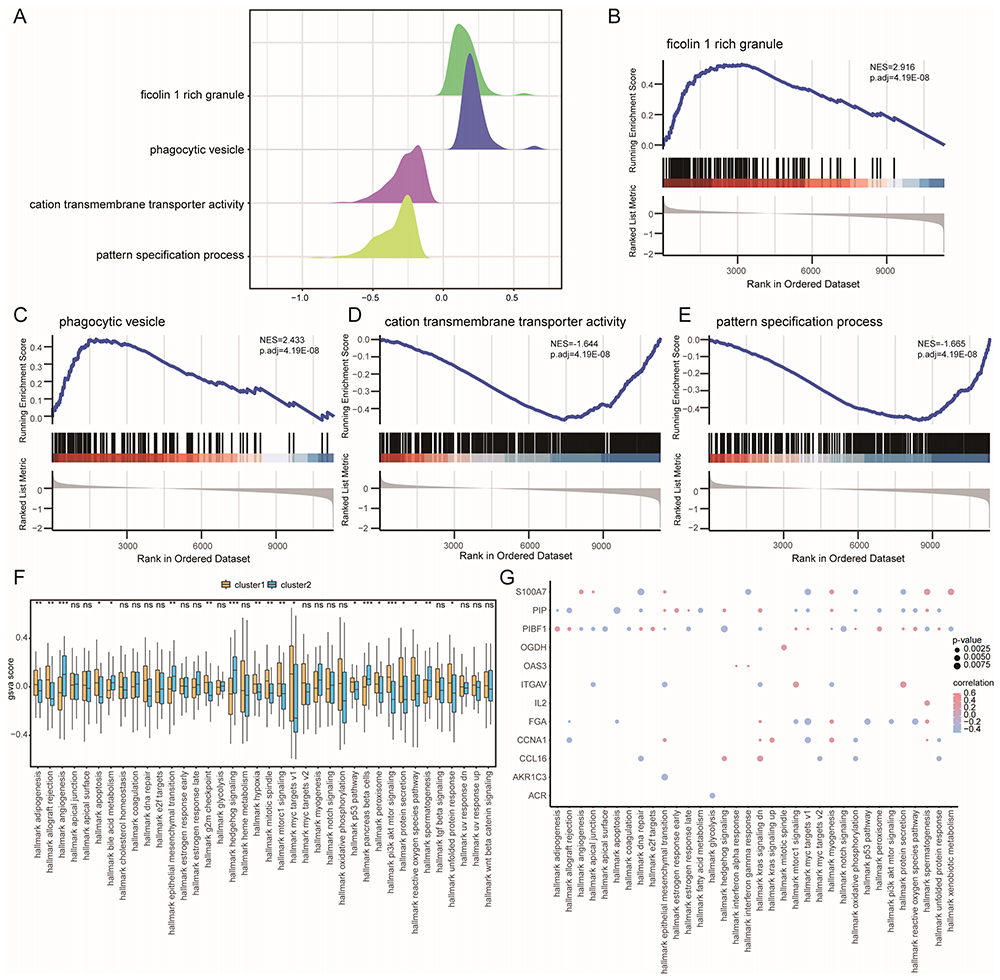 |
Figure 10 GSEA and GSVA of CAD-ICD subtypes. (A) Mountain range plot of the four biological functions in the GSEA for cluster 1. (B-E). GSEA shows that cluster 1 is significantly related to ficolin-1 rich granule (B), phagocytic vesicles (C), cation transmembrane transporter activity (D), and the pattern specification process (E). (F) Differences in hallmark genes between subtypes; coordinates are hallmarks, the vertical axis shows GSVA scores, yellow indicates cluster 1 and blue indicates cluster 2, *P < 0.05, **P < 0.01, and ***P < 0.001. (G) Correlation between trait genes and hallmarks; the horizontal axis shows hallmarks, and the vertical axis shows trait-related genes, node size indicates the significance level, and node color indicates the correlation level. Abbreviations: GSEA, Gene Set Enrichment Analysis; GSVA, Gene Set Variation Analysis; CAD, coronary artery disease; ICD, immunogenic cell death. |
The GSVA results are presented in Table S5. The biological processes of hallmark adipogenesis, hallmark allograft rejection, and hallmark apoptosis were significantly activated in cluster 1 (P < 0.05; Figure 10F). There was a significant difference between the two subtypes with respect to most biological processes, such as hallmark DNA repair, hallmark early estrogen response, and hallmark interferon-alpha response (P < 0.05, Figure 10F). When we examined the relationships between signature genes and hallmark biological processes, we found that S100A7 exhibited a significant positive correlation with hallmark angiogenesis, myogenesis, spermatogenesis, and xenobiotic metabolism, whereas PIBF1 showed a significant positive correlation with hallmark hedgehog, notch, and apical junction signaling (P < 0.05, r > 0, Figure 10G).
Immune Infiltration Characteristics of the Two CAD-ICD Subtypes
The single sample gene set enrichment analysis (ssGSEA) results revealed that the relative frequencies of central memory CD4+ T cells, immature B cells, monocytes, and neutrophils were significantly higher in cluster 1 than in cluster 2 (P < 0.05, Figure 11A). We calculated the correlation between the immune cell content in each subtype separately. Cluster 1 exhibited a positive correlation with activated CD8+ T cells, activated B cells, activated CD4+ T cells, and central memory CD4+ T cells (r > 0; Figure 11B). In addition, activated B cells, activated CD4+ T cells, immature B cells, and type 1 T helper cells were positively correlated with most immune cells in cluster 2 (r > 0, Figure 11C).
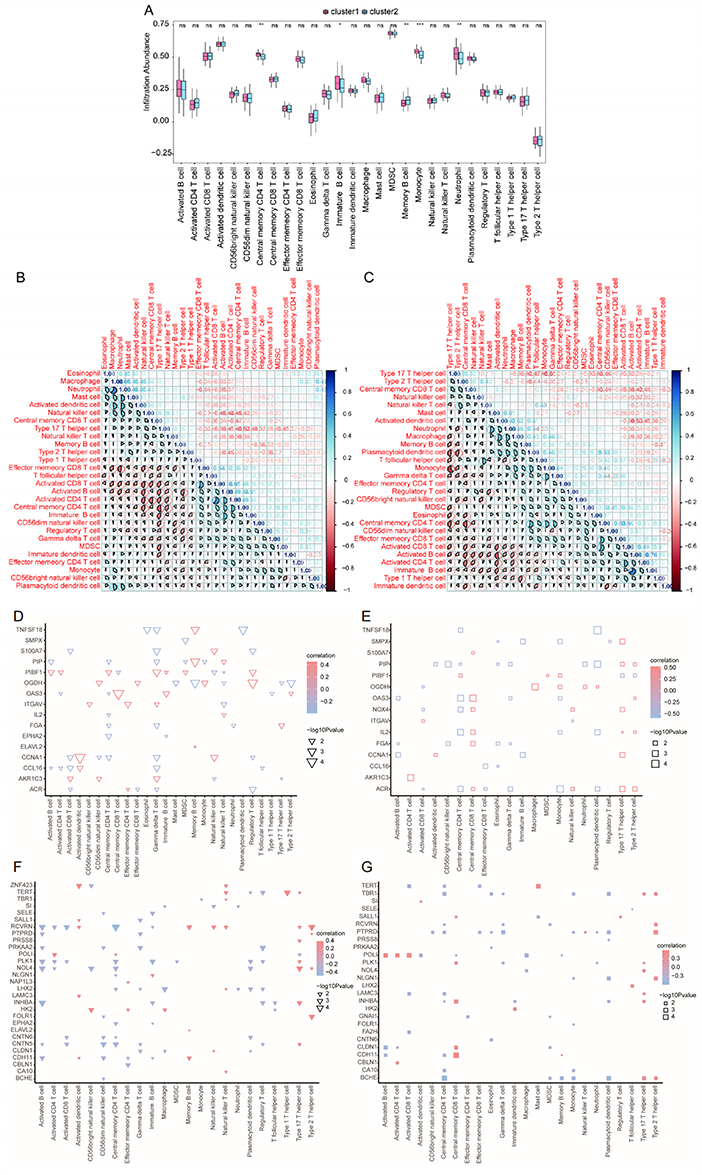 |
Figure 11 Immunological characteristics of two CAD-ICD subtypes determined by ssGSEA (A) Histogram of immune cell contents; blue indicates cluster 2, pink indicates cluster 1, the horizontal axis indicates immune cells, and the vertical axis indicates cell content; *P < 0.05, **P < 0.01, ***P < 0.001. (B and C). Correlation between immune cell content in cluster 1 (B) and cluster 2 (C). Blue indicates a positive correlation and red indicates a negative correlation. (D) Correlation of feature genes with immune cells in cluster 1; node size indicates significance and node color indicates correlation. The horizontal axis shows immune cells, and the vertical axis shows the signature genes. (E) Correlation of feature genes with immune cells in cluster 2. (F) Correlation of hub genes with immune cells in cluster 1; node size indicates significance and node color indicates correlation. The horizontal axis shows immune cells, and the vertical axis shows hub genes. (G) Correlations between hub genes and immune cells in cluster 2. Abbreviations: CAD, coronary artery disease; ICD, immunogenic cell death; GSEA, Gene Set Enrichment Analysis. |
We calculated the rank correlations between characteristic genes and the immune cells for clusters 1 and 2. In cluster 1, CD4 T cells, gamma delta T cells, and several characteristic genes were significantly correlated (P < 0.05, Figure 11D), while in cluster 2, there was a significant correlation between central memory CD8 T cells and type 17 T helper cells (P < 0.05, Figure 11E). Hub genes and immune cells were differentially correlated in clusters 1 and 2. Among the hub genes, RCVRN and PLK1 were strongly correlated with multiple immune cell types in cluster 1 (P < 0.05, Figure 11F), whereas in cluster 2, PTPRD and POLI showed greater correlation with multiple immune cell types (P < 0.05, Figure 11G).
Using CIBERSORTX, we found that the correlation between the immune cells in cluster 1 (Figure 12A) was notably different from those in cluster 2 (Figure 12B). We also calculated the correlation between the 17 signature genes and immune cell contents separately for each of the CAD-ICD subtypes. In cluster 1, multiple signature genes were significantly positively correlated with resting dendritic cells (r > 0, P < 0.05; Figure 12C), while numerous signature genes were significantly negatively correlated with CD4 naïve T cells in cluster 2 (r < 0, P < 0.05; Figure 12D).
 |
Figure 12 The immunological characteristics of the two CAD-ICD subgroups as determined using CIBERSORTX. (A) Correlation of immune cell content in cluster 1; pink indicates a positive correlation and blue indicates a negative correlation. (B) Correlation of immune cell contents in cluster 2. (C) Correlation between immune cells and signature genes in cluster 1; the vertical axis shows immune cells and the horizontal axis shows hub genes; red indicates a positive correlation and blue indicates a negative correlation; node size indicates significance and node color indicates correlations. (D) Correlation between immune cells and signature genes in cluster 2. *P < 0.05, **P < 0.01, ***P < 0.001. Abbreviations: CAD, coronary artery disease; ICD, immunogenic cell death. |
qRT-PCR Validation
qRT-PCR analysis revealed statistically significant differences in the levels of IL2, ITGAV, FGA, NOX4, CCNA1, AKR1C3, PIP, S100A7, TNFSF18, OGDH, PIBF1, ELAVL2, OAS3, and SMPX between the CAD and control groups. In the CAD group, OAS3 was upregulated, while ITGAV and PIBF1 were downregulated; these findings were consistent with the results of the GEO integration test set and the GSE120521 validation set. AKR1C3 was downregulated in the CAD group, which was consistent with the test set. NOX4 and SMPX were downregulated in the CAD group, which was consistent with the results of the validation set (Figure 13).
 |
Figure 13 Quantitative real-time PCR analysis for validation of signature genes. *P < 0.05, ***P < 0.001. |
Discussion
The main treatment strategy for CAD is lipid lowering; however, this approach does not yield sustained benefits. Therefore, more precise immunotherapeutic approaches are needed, including the identification of new biomarkers, the characterization of immune responses, and immunophenotypic management.9 Biomarkers refer to specific indicators that can be measured or observed within an organism, typically used to indicate a physiological state, disease state, or biological process within the organism. These markers can be specific attributes of molecules, cells, tissues, or organisms, and their measurement or analysis can provide valuable insights into the individual’s health status or the progression of a disease. In patients with cancer, IRGs have demonstrated the ability to predict therapeutic responses, presenting considerable potential as biomarkers for effective antitumor treatment.47 Research on IRGs is sparse, despite their possible utility in the treatment of noninfectious and nonmalignant diseases.48
We used several machine learning algorithms to explore the roles of ICD-related genes in CAD. We analyzed ICD expression profiles, built risk models, screened for biological markers, and used UMAP to distinguish subtypes, focusing on subtype differences in immune infiltration characteristics. We found that ICD gene-specific features could effectively distinguish patients with CAD from healthy controls. Lastly, we confirmed the ICD signature genes discovered from microarray data in a different CAD GEO dataset as well as in newly obtained peripheral blood samples.
ICD can modulate the various immune responses that are skewed in CAD. OAS3 encodes an enzyme crucial for the inhibition of viral infection and cellular protein synthesis. This gene is involved in the biology of coronaviruses, immune responses, and antiviral activities.49–51 OAS3 has potential as an anti-atherosclerotic agent, as shown by bioinformatics analysis and qPCR verification of carotid plaques.52 Our results were consistent with these findings. A study on ApoF KO mice showed that they lacked OAS2 and OAS3, and their livers and spleens did not express genes required for the interferon alpha (IFNα) response; furthermore, they exhibited impaired macrophage activation and reduced aortic atherosclerotic lesions, suggesting that OAS3 is involved in ApoF/Stat2-induced atherosclerosis via type I interferon signaling.53
Exome-wide association and single-nucleotide polymorphism studies have identified 13 novel loci, including OAS3, for vulnerability to the early onset of myocardial infarction, hypertension, or CKD.54 In addition, genome-wide association studies have shown that OAS3 is related to variations in serum HDL-C levels, suggesting that individuals carrying the minor allele of OAS3_rs2072134 should avoid high-protein, high-fat diets, especially those rich in saturated and polyunsaturated fatty acids.55
Inflammation is closely related to aortic dissection. Weakening of the aorta and immune reactions contribute to abdominal aortic aneurysms. The level of immune cell infiltration varies significantly between samples.56 OAS3 is involved in immune and inflammatory responses in COVID-19,57,58 tuberculosis,59,60 psoriasis,61 systemic lupus erythematosus,62,63 and other diseases. OAS3 increases the IFNαβ signaling and the secretion of pro-inflammatory cytokines by inducing apoptosis, regulating immune cell receptors, and autophagy, primarily via the production of type I interferon, IL10, and CXCL2.59–61 OAS exerts immunomodulatory functions and contributes to chronic inflammation, autoimmune diseases, cancer, and infectious diseases. Gonzalez et al used homology modeling and virtual high-throughput screening to identify inhibitors of OAS1, OAS2, and OAS3. This further contributed to the use of OAS enzymes as drug targets.64 In summary, OAS3 is a reliable predictor of CAD and can be useful in guiding immunophenotyping and targeted therapy for CAD.
ITGAV (αv-integrins) is a subunit of the integrin family of cell adhesion receptors. These heterodimeric glycoproteins are essential for the physiology and pathology of many biological functions and mediate immune cell transport, migration, and immune synapse formation during inflammation and cancer. Oksala et al used qPCR and found that ITGAV expression is downregulated in arterial plaques.65 Cardiac and macrovascular remodeling require the synergistic action of alpha5 and integrin αV (ITGAV) in the endothelium.66
Numerous studies have demonstrated that blocking ITGAV expression or using integrin αvβ5 inhibitors can negate the cardiovascular protective effect of integrin receptor αvβ5.67 Convallotoxin (CNT), a naturally occurring cardiotonic substance with anti-inflammatory pharmacological effects, can promote the polarization of M2 macrophages and thereby prevent atherosclerosis by triggering the PPARγ-integrin αvβ5 signaling pathway.68 ITGAV has been found to activate brown adipose tissue, suggesting that it can serve as a therapeutic target in obesity and metabolic syndromes.69 Only cardiac-derived c-Kit+ cells with low ITGAV expression have inherently low repair capacity.70 Therefore, ITGAV contributes to the immunological processes in CAD and other CVDs and demonstrates enormous potential for the development of immune-targeted therapies for CAD.
Although PIBFI has not been linked to CVDs, there is substantial evidence that it is strongly linked to the immune system. PIBF1 encodes the protein that regulates several aspects of the immune system, including cytokine synthesis, NK cell activity, and arachidonic acid metabolism, to promote normal pregnancy. The reduced PIBF1 activity that is associated with decreased IL-33 receptor alpha chain expression in chorionic metaplasia B cells during late pregnancy can be a factor contributing to spontaneous preterm birth in humans.71 It was found that silencing PIBF could increase the expression of E-cadherin, suggesting that PIBF interfered with intercellular adhesion via E-cadherin.72 In vivo studies on atherosclerosis have shown that cadherin 11 (CDH11) expression is elevated in plaque tissues.
In our network analysis, we found CDH11 to be an important hub gene. CDH11 promotes atherosclerotic plaque growth by altering the immune response to atherosclerosis and the infiltration of macrophages and T cells during inflammation.73 We hypothesize that PIBF1 may influence the immune response in atherosclerosis via cadherin; however, this warrants further experimental studies. Although some genes showed inconsistent expression patterns in the test or validation sets and PCR analysis, these differences could be due to inter-batch variations caused by several factors, such as different sample sizes and platforms. Nevertheless, these findings provide crucial data for informing future research.
AKR1C3 was found to be markedly downregulated in peripheral blood samples from patients with acute myocardial infarction, and HOXB4, a transcriptional activator of AKR1C3, prevented ferroptosis in erastin-treated H9C2 cells. Both AKR1C3 and HOXB4 can be used as acute myocardial infarction biomarkers.74 Numerous studies have shown that Nox4 has anti-atherogenic and vasoprotective effects on the endothelium. CYB5R3 alleviates the inflammatory activation of endothelial cells by assisting NOX4-dependent H2O2 production via CoQ.75 Nox4-/- Ldlr-/- mice exhibited endothelial dysfunction and a higher atherosclerotic plaque load after a high-fat diet when compared to Ldlr-/- mice.76 In a diabetic atherosclerosis model, Nox4-/- mice had more atherosclerotic plaques.77 The results of the present study corroborate these findings.
In our study, although trends in S100A7 expression varied, there was a significant difference between the CAD and control groups in the expression of this gene. Borsky et al found that S100A7 interacts with high mobility histone B1 (HMGB1) and contributes substantially to the immunopathology of psoriasis.78 Psoralen levels are associated with intima-media thickness, suggesting a potential link between psoriasis and atherosclerosis, as demonstrated by Awad et al.79 HMGB1 is a damage-associated molecular pattern (DAMP) mediated by the ICD gene. Therefore, we hypothesized that S100A7 interacts with HMGB1 and fundamentally affects the immune system in CAD patients. There is a lack of data on the association between immunity in CVDs and other genes that serve as signatures for ICD. However, this is a novel finding that merits additional in-depth investigation.
Cells release DAMPs in response to tissue damage or stressful circumstances, and these are recognized by receptors on the surface of sensor cells. This results in the activation of inflammatory responses, the production of chemokines and pro-inflammatory cytokines, and tissue remodeling via the induction of angiogenesis, proliferation, and migration of neighboring cells.80 ICD is mainly mediated by DAMPs, including surface exposure of calreticulin (CRT), ATP excretion, and HMGB1 release.81
The biological activity of HMGB1 depends on its subcellular localization, context, and post-translational modifications.82 HMGB1 is involved in a variety of DNA-related processes in the nucleus, including DNA repair, transcriptional control, and genomic stability,82 and regulates autophagic flux in the cytoplasm.83,84 In the extracellular environment, HMGB1 interacts with various immune cells, including fibroblasts, monocytes/macrophages, dendritic cells, and endothelial cells, and performs complex functions that support innate and acquired immunity.85 Additionally, it contributes to inflammation, migration, invasion, proliferation, differentiation, and tissue regeneration and repair.86–88 HMGB1 is a DAMP that induces both harmful and favorable responses after tissue injury, and, hence, is relevant in inflammatory injury and regenerative repair processes in CAD.80 Therefore, we hypothesized that the role of ICD-related genes in the CAD immune response is influenced by interactions between HMGB1 and various immune cells and cytokines.
In our study, the functional predictions revealed that these DEGs were principally involved in the KEGG pathways linked to arrhythmogenic right ventricular cardiomyopathy, dilated cardiomyopathy, hypertrophic cardiomyopathy, and ECM-receptor interactions. The 32 pivotal genes in the immune subtype were mainly associated with the following biological processes: cell adhesion of plasma membrane cell adhesion molecules, response to ketones, and cellular functions such as peptide hormone binding, superoxide-generating NAD(P)H oxidase activity, and glucose binding. They influenced galactose metabolism, starch and sucrose metabolism, neuroactive ligand-receptor interactions, cell adhesion molecules, and other KEGG pathways. Significant biological processes in both groups included adipogenesis, allograft rejection, apoptosis, DNA repair, and the interferon-alpha response. These findings support our hypothesis that HMGB1 and ICD signature genes cooperate to trigger the CAD immune response.
Researchers have used immune infiltration to examine the tumor immunological environment, identify cancer-specific diagnostic genes, and develop appropriate treatment strategies and biomarkers.89 Our study is the first where ICD has been used for immunophenotyping of CAD and the immune cell infiltration profiles in subtypes have been evaluated from various perspectives. The ICD gene-based immune subtypes were representative and differed significantly in their biological functions related to immune processes and immune infiltration characteristics. The two immune subtypes were well distinguished in terms of major immune cell components, correlations among immune cell contents, and relationships with phenotype-associated genes. We also found that the frequencies of central memory CD4+ T cells, immature B cells, monocytes, and neutrophils were significantly higher in cluster 1 than in cluster 2, with considerable differences in the immune cell profiles. We also verified the relationships among immune cells, signatures, and hub genes.
The importance of immune cells in atherosclerotic inflammation has been extensively studied. In atherosclerotic plaques, the chemokine receptors CCR2, CCR5, and CX3CR1 recruit classical monocytes, which subsequently differentiate into highly functional and phenotypically heterogeneous dendritic cells and macrophages.90 A study found two distinct macrophage populations in mouse arteries, with intimal macrophages exhibiting a proatherogenic effect.91 Another investigation in a mouse model demonstrated that dendritic cells are heterogeneous; those expressing CCL19 and CCL21 have anti-atherogenic effects mediated by the receptor CCR7,92 and those expressing CCL17 have proatherogenic effects.93 Neutrophils promote vascular inflammation by releasing reactive oxygen species, which increase endothelial barrier permeability.94 They also secrete chemokines that attract monocytes and extrude nuclear material to form extracellular neutrophil traps, which activate macrophages to promote atherosclerosis.95
Atherosclerotic plaques in mice are dominated by CD4+ T cells, and Th1 cells have a proatherogenic phenotype. In contrast, CD8+ cells have dual functions in atherosclerotic lesions, including IFNγ production, macrophage activation, and atheroprotective effects via B-cell regulation.96 In a mouse model, B1 cells produced IgM antibodies that prevented ox-LDL uptake by macrophages in the lesion, thus protecting against atherosclerosis,97 whereas B2 cells promoted atherosclerosis by forming antibody responses in response to B cells in the germinal center.98 Thus, these immune cells play an extraordinarily complex and crucial role in the immune response in CAD, and the ICD gene signature can clearly distinguish between subtypes with infiltrative immune features. These genes can be regarded as reliable parameters for immunophenotyping in CAD.
Immunotyping patients and analyzing their biological metabolism and immune infiltration characteristics can facilitate more accurate identification of treatment responders and the selection of more potential immunomodulatory targets. Targeting atherogenic B-cell subsets is one strategy to target adaptive immune cells.99 B-cell depletion therapy has been used to treat rheumatoid arthritis and multiple sclerosis. Research in mice has shown that anti-CD20 antibodies selectively remove B2 cells and reduce atherosclerosis.100,101 In patients with acute ST-elevation myocardial infarction, single-dose rituximab proved to be safe and effective in removing B cells.102
In addition, immune cells utilize several metabolic traits to meet the wide range of metabolic demands associated with inflammation in CAD. These traits include glycolysis, the pentose phosphate pathway, oxidative phosphorylation, β-oxidation of fatty acids in mitochondria, and amino acid metabolism.103 Consequently, metabolic pathways offer potential diagnostic opportunities, such as metabolic radiotracers and therapeutic interventions for CAD.104 The central and peripheral nervous systems also regulate vascular inflammation and plaque stability, in addition to regulating macrophage cholesterol metabolism, paving the way for identifying novel therapeutic targets.105
Most ongoing anti-inflammatory clinical trials on CAD do not include preselected patient populations. The lack of efficacy in these clinical trials may be attributable to the heterogeneity of the patient populations. Using a multi-marker approach combining inflammatory and non-invasive vascular markers can be an effective strategy for improving cardiovascular risk prediction as an alternative to employing conventional risk factors in routine clinical practice. Other studies, such as the GLACIER trial, incorporated FDG-PET to determine vascular inflammation106 with little success and at a high cost, suggesting the need for biomarkers that are more accurate and convenient to use. There is increasing evidence that polygenic risk scores can aid in stratifying risk in CAD.
It is also important to carefully consider the side effects of immunotherapy. Immunosuppression and chronic inflammation exacerbate the incidence of cancer, and immune checkpoint inhibitor therapies can enhance the probability of CVD in cancer.107,108 Therefore, it is critical to understand the complex immune relationship between CVD and tumors, screen target patients, identify immunological responders and non-responders, and develop more precise targeted therapies in order to improve the clinical safety of anti-inflammatory therapies in CAD.
The precise interaction among IRGs in CAD remains uncertain, and the implementation of co-expression analysis has the potential to enhance our understanding of the underlying mechanism in future research endeavors. The polygenic nature of CAD is characterized by a substantial degree of heritability.109 Through comprehensive genome-wide association studies, it is feasible to effectively identify genetic variations linked to CAD, thereby establishing a foundation for computing polygenic risk scores (PRSs).110 Multiple studies have substantiated the strong association between PRSs and the extent and severity of coronary atherosclerosis, as evaluated using coronary artery computed tomography angiography (CTA).111,112 Recent investigations have demonstrated the practical applicability of integrating PRSs into risk prediction models for estimating the incidence of CAD and serving as a guide for proactive healthcare interventions.113,114 Incorporating IRGs within PRSs holds the potential to provide key insights into the treatment management of patients with CAD and the prediction of their future outcomes, thereby offering valuable guidance for future clinical practice. Although immune-targeted therapy is a milestone in the history of the treatment of oncological diseases, its application to CAD is still a nascent area of research with many unresolved issues. CAD immunotherapy may benefit from alternative vascular inflammatory markers, such as IRGs, which could also be used for immunophenotypic patient management, paving the way for more precise and safe clinical management.
This study has certain limitations. First, it is challenging to integrate findings with clinical data since the GEO dataset lacks disease-related prognostic indicators. Second, owing to temporal and resource constraints, the validation of gene functions and mechanisms underlying research findings derived from bioinformatics analysis did not include any in vivo or in vitro experiments. Finally, further investigations are required to explore the mechanisms underlying the interactions of the predicted TFs, miRNAs, RBPs, and drugs in CAD. The extensive use of datasets can result in batch discrepancies that are difficult to eliminate during analysis. Future endeavors will involve conducting detailed experiments aimed at investigating the specific functions of these genes and the potential advantages of ICD in CAD treatment.
Conclusions
This prospective study was the first to investigate the role of ICD and immunophenotypes in CAD. We constructed a diagnostic nomogram that consisted of 17 hallmark genes. This served as a secondary classification for immune stratification, and we evaluated the representativeness of the stratification. Finally, we analyzed the biological traits of the immunological subtypes and immune cell infiltration. Our findings can aid the development of vascular inflammatory indicators for CAD, immunological classification, and safe and precise targeted treatments in the future. However, more research is required to confirm its precise pathophysiology and molecular targets.
Abbreviations
OAS3, 2’-5’-oligoadenylate synthetase 3 [EC2.7.7.84]; ITGAV, integrin α chain V; PIBF1, progesterone-induced-blocking factor 1; AKR1C3, aldo-keto reductase family 1 member C3 [EC 1.1.1.188]; NOX4, nicotinamide adenine dinucleotide phosphate hydrogen oxidase 4 [EC1.6.99.1]; SMPX, small muscle protein X-linked.
Data Sharing Statement
The original contributions presented in the study are included in the article/Supplementary Files, further inquiries can be directed to the corresponding author.
Ethics Approval and Informed Consent
This study was conducted in accordance with the declaration of Helsinki.The studies involving human participants were reviewed and approved by the Medical Ethics Committee of the Second Hospital of Hebei Medical University (approval number 2023-C016, dated February 28, 2023). All enrolled participants gave their informed consent.
Acknowledgments
We would like to thank Editage (www.editage.cn) for English language editing.
Funding
This research was supported by the Transversal Research Project of Kuntuo Xincheng Pharmaceutical Research & Development (Beijing) Co., Ltd.
Disclosure
The authors report no conflicts of interest in this work.
References
1. Timmis A, Townsend N, Gale CP, et al. European society of cardiology: cardiovascular disease statistics 2019. Eur Heart J. 2020;41(1):12–85. doi:10.1093/eurheartj/ehz859
2. Legein B, Temmerman L, Biessen EA, Lutgens E. Inflammation and immune system interactions in atherosclerosis. Cell Mol Life Sci. 2013;70(20):3847–3869. doi:10.1007/s00018-013-1289-1
3. Ketelhuth DF, Hansson GK. Adaptive response of T and B cells in atherosclerosis. Circ Res. 2016;118(4):668–678. doi:10.1161/CIRCRESAHA.115.306427
4. Tabas I, Bornfeldt KE. Macrophage phenotype and function in different stages of atherosclerosis. Circ Res. 2016;118(4):653–667. doi:10.1161/CIRCRESAHA.115.306256
5. Winkels H, Ehinger E, Vassallo M, et al. Atlas of the immune cell repertoire in Mouse atherosclerosis defined by single-cell RNA-sequencing and mass cytometry. Circ Res. 2018;122(12):1675–1688. doi:10.1161/CIRCRESAHA.117.312513
6. Roy P, Orecchioni M, Ley K. How the immune system shapes atherosclerosis: roles of innate and adaptive immunity. Nat Rev Immunol. 2022;22(4):251–265. doi:10.1038/s41577-021-00584-1
7. Ridker PM, Everett BM, Thuren T, et al. Antiinflammatory therapy with canakinumab for atherosclerotic disease. N Engl J Med. 2017;377(12):1119–1131. doi:10.1056/NEJMoa1707914
8. Ridker PM, Everett BM, Pradhan A, et al. Low-dose methotrexate for the prevention of atherosclerotic events. N Engl J Med. 2019;380(8):752–762. doi:10.1056/NEJMoa1809798
9. Engelen SE, Robinson AJB, Zurke YX, Monaco C. Therapeutic strategies targeting inflammation and immunity in atherosclerosis: how to proceed? Nat Rev Cardiol. 2022;19(8):522–542. doi:10.1038/s41569-021-00668-4
10. Galluzzi L, Vitale I, Aaronson SA, et al. Molecular mechanisms of cell death: recommendations of the nomenclature committee on cell death 2018. Cell Death Differ. 2018;25(3):486–541. doi:10.1038/s41418-017-0012-4
11. Pfirschke C, Engblom C, Rickelt S, et al. Immunogenic chemotherapy sensitizes tumors to checkpoint blockade therapy. Immunity. 2016;44(2):343–354. doi:10.1016/j.immuni.2015.11.024
12. Voorwerk L, Slagter M, Horlings HM, et al. Immune induction strategies in metastatic triple-negative breast cancer to enhance the sensitivity to PD-1 blockade: the TONIC trial. Nat Med. 2019;25(6):920–928. doi:10.1038/s41591-019-0432-4
13. Bonfiglio CA, Weber C, Atzler D, Lutgens E. Immunotherapy and cardiovascular diseases: novel avenues for immunotherapeutic approaches. Q J M. 2023;116(4):271–278. doi:10.1093/qjmed/hcab207
14. Xie W, Forveille S, Iribarren K, et al. Lurbinectedin synergizes with immune checkpoint blockade to generate anticancer immunity. Oncoimmunology. 2019;8(11):e1656502. doi:10.1080/2162402X.2019.1656502
15. Kepp O, Zitvogel L, Kroemer G. Lurbinectedin: an FDA-approved inducer of immunogenic cell death for the treatment of small-cell lung cancer. Oncoimmunology. 2020;9(1):1795995. doi:10.1080/2162402X.2020.1795995
16. Montes de Oca R, Alavi AS, Vitali N, et al. Belantamab mafodotin (GSK2857916) drives immunogenic cell death and immune-mediated antitumor responses in vivo. Mol Cancer Ther. 2021;20(10):1941–1955. doi:10.1158/1535-7163.MCT-21-0035
17. Du Y, Hu Y, Wen N, et al. Abnormal expression of TGFBR2, EGF, LRP10, and IQGAP1 is involved in the pathogenesis of coronary artery disease. Rev Cardiovasc Med. 2021;22(3):947–958. doi:10.31083/j.rcm2203103
18. Feng X, Zhang Y, Du M, et al. Identification of diagnostic biomarkers and therapeutic targets in peripheral immune landscape from coronary artery disease. J Transl Med. 2022;20(1):399. doi:10.1186/s12967-022-03614-1
19. Liu C, Liu J, Zhang Y, Wang X, Guan Y. Immune-related potential biomarkers and therapeutic targets in coronary artery disease. Front Cardiovasc Med. 2022;9:1055422. doi:10.3389/fcvm.2022.1055422
20. Wei D, Qi J, Wang Y, et al. NR4A2 may be a potential diagnostic biomarker for myocardial infarction: a comprehensive bioinformatics analysis and experimental validation. Front Immunol. 2022;13:1061800. doi:10.3389/fimmu.2022.1061800
21. Zhao S, Wu Y, Wei Y, Xu X, Zheng J. Identification of biomarkers associated with CD8+ T cells in coronary artery disease and their pan-cancer analysis. Front Immunol. 2022;13:876616. doi:10.3389/fimmu.2022.876616
22. Sinnaeve PR, Donahue MP, Grass P, et al. Gene expression patterns in peripheral blood correlate with the extent of coronary artery disease. PLoS One. 2009;4(9):e7037. doi:10.1371/journal.pone.0007037
23. Mahmoud AD, Ballantyne MD, Miscianinov V, et al. The human-specific and smooth muscle cell-enriched LncRNA SMILR promotes proliferation by regulating mitotic CENPF mRNA and drives cell-cycle progression which can be targeted to limit vascular remodeling. Circ Res. 2019;125(5):535–551. doi:10.1161/CIRCRESAHA.119.314876
24. Barrett T, Wilhite SE, Ledoux P, et al. NCBI GEO: archive for functional genomics data sets—update. Nucleic Acids Res. 2013;41:D991–5. doi:10.1093/nar/gks1193
25. Stelzer G, Rosen N, Plaschkes I, et al. The GeneCards Suite: from gene data mining to disease genome sequence analyses. Curr Protoc Bioinformatics. 2016;54:1.30.1–1.30.33. doi:10.1002/cpbi.5
26. Leek JT, Johnson WE, Parker HS, et al. The sva package for removing batch effects and other unwanted variation in high-throughput experiments. Bioinformatics. 2012;28(6):882–883. doi:10.1093/bioinformatics/bts034
27. Ritchie ME, Phipson B, Wu D, et al. limma powers differential expression analyses for RNA-sequencing and microarray studies. Nucleic Acids Res. 2015;43(7):e47. doi:10.1093/nar/gkv007
28. Zhang H, Meltzer P, Davis S. RCircos: an R package for Circos 2D track plots. BMC Bioinf. 2013;14:244. doi:10.1186/1471-2105-14-244
29. Robin X, Turck N, Hainard A, et al. pROC: an open-source package for R and S+ to analyze and compare ROC curves. BMC Bioinf. 2011;12:77. doi:10.1186/1471-2105-12-77
30. Fitzgerald M, Saville BR, Lewis RJ. Decision curve analysis. JAMA. 2015;313(4):409–410. doi:10.1001/jama.2015.37
31. Van Calster B, Wynants L, Verbeek JFM, et al. Reporting and interpreting decision curve analysis: a guide for investigators. Eur Urol. 2018;74(6):796–804. doi:10.1016/j.eururo.2018.08.038
32. Milošević D, Medeiros AS, Stojković Piperac MS, et al. The application of Uniform Manifold Approximation and Projection (UMAP) for unconstrained ordination and classification of biological indicators in aquatic ecology. Sci Total Environ. 2022;815:152365. doi:10.1016/j.scitotenv.2021.152365
33. Ashburner M, Ball CA, Blake JA, et al. Gene ontology: tool for the unification of biology. Gene Ontology Consortium Nat Genet. 2000;25(1):25–29.
34. Kanehisa M, Goto S. KEGG: Kyoto Encyclopedia of Genes and Genomes. Nucleic Acids Res. 2000;28(1):27–30. doi:10.1093/nar/28.1.27
35. Yu G, Wang LG, Han Y, He QY. clusterProfiler: an R package for comparing biological themes among gene clusters. Omics. 2012;16(5):284–287. doi:10.1089/omi.2011.0118
36. Wu T, Hu E, Xu S, et al. clusterProfiler 4.0: a universal enrichment tool for interpreting omics data. Innovation. 2021;2(3):100141. doi:10.1016/j.xinn.2021.100141
37. Subramanian A, Tamayo P, Mootha VK, et al. Gene set enrichment analysis: a knowledge-based approach for interpreting genome-wide expression profiles. Proc Natl Acad Sci USA. 2005;102(43):15545–15550. doi:10.1073/pnas.0506580102
38. Liberzon A, Birger C, Thorvaldsdóttir H, Ghandi M, Mesirov JP, Tamayo P. The Molecular Signatures Database (MSigDB) hallmark gene set collection. Cell Syst. 2015;1(6):417–425. doi:10.1016/j.cels.2015.12.004
39. Hänzelmann S, Castelo R, Guinney J. GSVA: gene set variation analysis for microarray and RNA-seq data. BMC Bioinf. 2013;14:7. doi:10.1186/1471-2105-14-7
40. Szklarczyk D, Kirsch R, Koutrouli M, et al. The STRING database in 2023: protein-protein association networks and functional enrichment analyses for any sequenced genome of interest. Nucleic Acids Res. 2023;51(D1):D638–D646. doi:10.1093/nar/gkac1000
41. Zhou J, Xiong W, Wang Y, Guan J. Protein function prediction based on PPI Networks: network reconstruction vs edge enrichment. Front Genet. 2021;12:758131. doi:10.3389/fgene.2021.758131
42. Shannon P, Markiel A, Ozier O, et al. Cytoscape: a software environment for integrated models of biomolecular interaction networks. Genome Res. 2003;13(11):2498–2504. doi:10.1101/gr.1239303
43. Chin CH, Chen SH, Wu HH, Ho CW, Ko MT, Lin CY. cytoHubba: identifying hub objects and sub-networks from complex interactome. BMC Syst Biol. 2014;8(suppl 4):S11. doi:10.1186/1752-0509-8-S4-S11
44. Barbie DA, Tamayo P, Boehm JS, et al. Systematic RNA interference reveals that oncogenic KRAS-driven cancers require TBK1. Nature. 2009;462(7269):108–112. doi:10.1038/nature08460
45. Newman AM, Steen CB, Liu CL, et al. Determining cell type abundance and expression from bulk tissues with digital cytometry. Nat Biotechnol. 2019;37(7):773–782. doi:10.1038/s41587-019-0114-2
46. Wei T, Simko V, Levy M, Xie Y, Jin Y, Zemla J. Package ‘corrplot’. Statistician. 2017;56:e24.
47. Kroemer G, Galluzzi L, Kepp O, Zitvogel L. Immunogenic cell death in cancer therapy. Annu Rev Immunol. 2013;31:51–72. doi:10.1146/annurev-immunol-032712-100008
48. Kroemer G, Galassi C, Zitvogel L, Galluzzi L. Immunogenic cell stress and death. Nat Immunol. 2022;23(4):487–500. doi:10.1038/s41590-022-01132-2
49. Pairo-Castineira E, Clohisey S, Klaric L, et al. Genetic mechanisms of critical illness in COVID-19. Nature. 2021;591(7848):92–98. doi:10.1038/s41586-020-03065-y
50. Wickenhagen A, Sugrue E, Lytras S, et al. A prenylated dsRNA sensor protects against severe COVID-19. Science. 2021;374(6567):eabj3624. doi:10.1126/science.abj3624
51. Banday AR, Stanifer ML, Florez-Vargas O, et al. Genetic regulation of OAS1 nonsense-mediated decay underlies association with COVID-19 hospitalization in patients of European and African ancestries. Nat Genet. 2022;54(8):1103–1116. doi:10.1038/s41588-022-01113-z
52. Dong R, Jiang G, Tian Y, Shi X. Identification of immune-related biomarkers and construction of regulatory network in patients with atherosclerosis. BMC Med Genomics. 2022;15(1):245. doi:10.1186/s12920-022-01397-4
53. Lagor WR, Fields DW, Bauer RC, et al. Genetic manipulation of the ApoF/Stat2 locus supports an important role for type I interferon signaling in atherosclerosis. Atherosclerosis. 2014;233(1):234–241. doi:10.1016/j.atherosclerosis.2013.12.043
54. Yamada Y, Kato K, Oguri M, et al. Identification of 13 novel susceptibility loci for early-onset myocardial infarction, hypertension, or chronic kidney disease. Int J Mol Med. 2018;42(5):2415–2436. doi:10.3892/ijmm.2018.3852
55. Liu M, Jin HS, Park S. Protein and fat intake interacts with the haplotype of PTPN11_rs11066325, RPH3A_rs886477, and OAS3_rs2072134 to modulate serum HDL concentrations in middle-aged people. Clin Nutr. 2020;39(3):942–949. doi:10.1016/j.clnu.2019.03.039
56. Chen Y, Ouyang T, Fang C, et al. Identification of biomarkers and analysis of infiltrated immune cells in stable and ruptured abdominal aortic aneurysms. Front Cardiovasc Med. 2022;9:941185. doi:10.3389/fcvm.2022.941185
57. Zhang C, Feng YG, Tam C, Wang N, Feng Y. Transcriptional profiling and machine learning unveil a concordant biosignature of Type I interferon-inducible host response across nasal swab and pulmonary tissue for COVID-19 diagnosis. Front Immunol. 2021;12:733171. doi:10.3389/fimmu.2021.733171
58. Krishnamoorthy S, Li GH, Cheung CL. Transcriptome-wide summary data-based Mendelian randomization analysis reveals 38 novel genes associated with severe COVID-19. J Med Virol. 2023;95(1):e28162. doi:10.1002/jmv.28162
59. Leisching G, Wiid I, Baker B. OAS1, 2, and 3: significance During Active Tuberculosis? J Infect Dis. 2018;217(10):1517–1521. doi:10.1093/infdis/jiy084
60. Leisching G, Cole V, Ali AT, Baker B. OAS1, OAS2 and OAS3 restrict intracellular M. tb replication and enhance cytokine secretion. Int J Infect Dis. 2019;80S:S77–S84. doi:10.1016/j.ijid.2019.02.029
61. Gao LJ, Shen J, Ren YN, Shi JY, Wang DP, Cao JM. Discovering novel hub genes and pathways associated with the pathogenesis of psoriasis. Dermatol Ther. 2020;33(6):e13993. doi:10.1111/dth.13993
62. Chen H, Huang L, Jiang X, et al. Establishment and analysis of a disease risk prediction model for the systemic lupus erythematosus with random forest. Front Immunol. 2022;13:1025688. doi:10.3389/fimmu.2022.1025688
63. Shen M, Duan C, Xie C, et al. Identification of key interferon-stimulated genes for indicating the condition of patients with systemic lupus erythematosus. Front Immunol. 2022;13:962393. doi:10.3389/fimmu.2022.962393
64. Gonzalez KJ, Moncada-Giraldo DM, Gutierrez JB. In silico identification of potential inhibitors against human 2’-5′- oligoadenylate synthetase (OAS) proteins. Comput Biol Chem. 2020;85:107211. doi:10.1016/j.compbiolchem.2020.107211
65. Oksala N, Pärssinen J, Seppälä I, et al. Kindlin 3 (FERMT3) is associated with unstable atherosclerotic plaques, anti-inflammatory type II macrophages and upregulation of beta-2 integrins in all major arterial beds. Atherosclerosis. 2015;242(1):145–154. doi:10.1016/j.atherosclerosis.2015.06.058
66. van der Flier A, Badu-Nkansah K, Whittaker CA, et al. Endothelial alpha5 and alphav integrins cooperate in remodeling of the vasculature during development. Development. 2010;137(14):2439–2449. doi:10.1242/dev.049551
67. Lin X, Sun Y, Yang S, et al. Omentin-1 modulates macrophage function via integrin receptors αvβ3 and αvβ5 and reverses plaque vulnerability in animal models of atherosclerosis. Front Cardiovasc Med. 2021;8:757926. doi:10.3389/fcvm.2021.757926
68. Zhang Y, Shi X, Han J, et al. Convallatoxin Promotes M2 macrophage polarization to attenuate atherosclerosis through PPARγ-Integrin αvβ5 signaling pathway. Drug Des Devel Ther. 2021;15:803–812. doi:10.2147/DDDT.S288728
69. Fu T, Li C, Sun Z, et al. Integrin αV mediates the effects of irisin on human mature adipocytes. Obes Facts. 2022;15(3):442–450. doi:10.1159/000523871
70. Streeter BW, Brown ME, Shakya P, et al. Using computational methods to design patient-specific electrospun cardiac patches for pediatric heart failure. Biomaterials. 2022;283:121421. doi:10.1016/j.biomaterials.2022.121421
71. Huang B, Faucette AN, Pawlitz MD, et al. Interleukin-33-induced expression of PIBF1 by decidual B cells protects against preterm labor. Nat Med. 2017;23(1):128–135. doi:10.1038/nm.4244
72. Balassa T, Berta G, Jakab L, Bohonyi N, Szekeres-Bartho J. The effect of the progesterone-induced blocking factor (PIBF) on E-cadherin expression, cell motility and invasion of primary tumour cell lines. J Reprod Immunol. 2018;125:8–15. doi:10.1016/j.jri.2017.10.047
73. Johnson CL, Riley L, Bersi M, Linton MF, Merryman WD. Impaired macrophage trafficking and increased helper T-cell recruitment with loss of cadherin-11 in atherosclerotic immune response. Am J Physiol Heart Circ Physiol. 2021;321(4):H756–H769. doi:10.1152/ajpheart.00263.2021
74. Liang J, Cao Y, He M, et al. AKR1C3 and its transcription factor HOXB4 are promising diagnostic biomarkers for acute myocardial infarction. Front Cardiovasc Med. 2021;8:694238. doi:10.3389/fcvm.2021.694238
75. Yuan S, Hahn SA, Miller MP, et al. Cooperation between CYB5R3 and NOX4 via coenzyme Q mitigates endothelial inflammation. Redox Biol. 2021;47:102166. doi:10.1016/j.redox.2021.102166
76. Langbein H, Brunssen C, Hofmann A, et al. NADPH oxidase 4 protects against development of endothelial dysfunction and atherosclerosis in LDL receptor deficient mice. Eur Heart J. 2016;37(22):1753–1761. doi:10.1093/eurheartj/ehv564
77. Gray SP, Di Marco E, Kennedy K, et al. Reactive oxygen species can provide atheroprotection via NOX4-dependent inhibition of inflammation and vascular remodeling. Arterioscler Thromb Vasc Biol. 2016;36(2):295–307. doi:10.1161/ATVBAHA.115.307012
78. Borsky P, Fiala Z, Andrys C, et al. Alarmins HMGB1, IL-33, S100A7, and S100A12 in psoriasis vulgaris. Mediators Inflamm. 2020;2020:8465083. doi:10.1155/2020/8465083
79. Awad SM, Attallah DA, Salama RH, Mahran AM, Abu El-Hamed E. Serum levels of psoriasin (S100A7) and koebnerisin (S100A15) as potential markers of atherosclerosis in patients with psoriasis. Clin Exp Dermatol. 2018;43(3):262–267. doi:10.1111/ced.13370
80. Pellegrini L, Foglio E, Pontemezzo E, Germani A, Russo MA, Limana F. HMGB1 and repair: focus on the heart. Pharmacol Ther. 2019;196:160–182. doi:10.1016/j.pharmthera.2018.12.005
81. Garg AD, Nowis D, Golab J, Vandenabeele P, Krysko DV, Agostinis P. Immunogenic cell death, DAMPs and anticancer therapeutics: an emerging amalgamation. Biochim Biophys Acta. 2010;1805(1):53–71. doi:10.1016/j.bbcan.2009.08.003
82. Celona B, Weiner A, Di Felice F, et al. Substantial histone reduction modulates genomewide nucleosomal occupancy and global transcriptional output. PLOS Biol. 2011;9(6):e1001086. doi:10.1371/journal.pbio.1001086
83. Zhu X, Messer JS, Wang Y, et al. Cytosolic HMGB1 controls the cellular autophagy/apoptosis checkpoint during inflammation. J Clin Invest. 2015;125(3):1098–1110. doi:10.1172/JCI76344
84. Ouyang F, Huang H, Zhang M, et al. HMGB1 induces apoptosis and EMT in association with increased autophagy following H/R injury in cardiomyocytes. Int J Mol Med. 2016;37(3):679–689. doi:10.3892/ijmm.2016.2474
85. Schiraldi M, Raucci A, Muñoz LM, et al. HMGB1 promotes recruitment of inflammatory cells to damaged tissues by forming a complex with CXCL12 and signaling via CXCR4. J Exp Med. 2012;209(3):551–563. doi:10.1084/jem.20111739
86. Bianchi ME, Manfredi AA. High-mobility group box 1 (HMGB1) protein at the crossroads between innate and adaptive immunity. Immunol Rev. 2007;220:35–46. doi:10.1111/j.1600-065X.2007.00574.x
87. Vénéreau E, Ceriotti C, Bianchi ME. DAMPs from cell death to new life. Front Immunol. 2015;6:422. doi:10.3389/fimmu.2015.00422
88. Tirone M, Tran NL, Ceriotti C, et al. High mobility group box 1 orchestrates tissue regeneration via CXCR4. J Exp Med. 2018;215(1):303–318. doi:10.1084/jem.20160217
89. Chen H, Song Y, Deng C, et al. Comprehensive analysis of immune infiltration and gene expression for predicting survival in patients with sarcomas. Aging. 2020;13(2):2168–2183.
90. Tabas I, Lichtman AH. Monocyte-macrophages and T cells in atherosclerosis. Immunity. 2017;47(4):621–634. doi:10.1016/j.immuni.2017.09.008
91. Williams JW, Zaitsev K, Kim KW, et al. Limited proliferation capacity of aortic intima resident macrophages requires monocyte recruitment for atherosclerotic plaque progression. Nat Immunol. 2020;21(10):1194–1204. doi:10.1038/s41590-020-0768-4
92. Trogan E, Feig JE, Dogan S, et al. Gene expression changes in foam cells and the role of chemokine receptor CCR7 during atherosclerosis regression in ApoE-deficient mice. Proc Natl Acad Sci USA. 2006;103(10):3781–3786. doi:10.1073/pnas.0511043103
93. Weber C, Meiler S, Döring Y, et al. CCL17-expressing dendritic cells drive atherosclerosis by restraining regulatory T cell homeostasis in mice. J Clin Invest. 2011;121(7):2898–2910. doi:10.1172/JCI44925
94. Wang L, Ai Z, Khoyratty T, et al. ROS-producing immature neutrophils in giant cell arteritis are linked to vascular pathologies. JCI Insight. 2020;5(20). doi:10.1172/jci.insight.139163
95. Warnatsch A, Ioannou M, Wang Q, Papayannopoulos V. Inflammation. Neutrophil extracellular traps license macrophages for cytokine production in atherosclerosis. Science. 2015;349(6245):316–320. doi:10.1126/science.aaa8064
96. Saigusa R, Winkels H, Ley K. T cell subsets and functions in atherosclerosis. Nat Rev Cardiol. 2020;17(7):387–401. doi:10.1038/s41569-020-0352-5
97. Kyaw T, Tay C, Krishnamurthi S, et al. B1a B lymphocytes are atheroprotective by secreting natural IgM that increases IgM deposits and reduces necrotic cores in atherosclerotic lesions. Circ Res. 2011;109(8):830–840. doi:10.1161/CIRCRESAHA.111.248542
98. Sage AP, Tsiantoulas D, Binder CJ, Mallat Z. The role of B cells in atherosclerosis. Nat Rev Cardiol. 2019;16(3):180–196. doi:10.1038/s41569-018-0106-9
99. Pattarabanjird T, Li C, McNamara C. B cells in atherosclerosis: mechanisms and potential clinical applications. JACC Basic Transl Sci. 2021;6(6):546–563. doi:10.1016/j.jacbts.2021.01.006
100. Ait-Oufella H, Herbin O, Bouaziz JD, et al. B cell depletion reduces the development of atherosclerosis in mice. J Exp Med. 2010;207(8):1579–1587. doi:10.1084/jem.20100155
101. Kyaw T, Tay C, Khan A, et al. Conventional B2 B cell depletion ameliorates whereas its adoptive transfer aggravates atherosclerosis. J Immunol. 2010;185(7):4410–4419. doi:10.4049/jimmunol.1000033
102. Zhao TX, Aetesam-Ur-Rahman M, Sage AP, et al. Rituximab in patients with acute ST-elevation myocardial infarction: an experimental medicine safety study. Cardiovasc Res. 2022;118(3):872–882. doi:10.1093/cvr/cvab113
103. O’Neill LA, Kishton RJ, Rathmell J. A guide to immunometabolism for immunologists. Nat Rev Immunol. 2016;16(9):553–565. doi:10.1038/nri.2016.70
104. Tomas L, Edsfeldt A, Mollet IG, et al. Altered metabolism distinguishes high-risk from stable carotid atherosclerotic plaques. Eur Heart J. 2018;39(24):2301–2310. doi:10.1093/eurheartj/ehy124
105. Lutgens E, Atzler D, Döring Y, Duchene J, Steffens S, Weber C. Immunotherapy for cardiovascular disease. Eur Heart J. 2019;40(48):3937–3946. doi:10.1093/eurheartj/ehz283
106. Lehrer-Graiwer J, Singh P, Abdelbaky A, et al. FDG-PET imaging for oxidized LDL in stable atherosclerotic disease: a Phase II study of safety, tolerability, and anti-inflammatory activity. JACC Cardiovasc Imaging. 2015;8(4):493–494. doi:10.1016/j.jcmg.2014.06.021
107. Drobni ZD, Alvi RM, Taron J, et al. Association between immune checkpoint inhibitors with cardiovascular events and atherosclerotic plaque. Circulation. 2020;142(24):2299–2311. doi:10.1161/CIRCULATIONAHA.120.049981
108. Poels K, van Leent MMT, Boutros C, et al. Immune checkpoint inhibitor therapy aggravates T cell-driven plaque inflammation in atherosclerosis. JACC CardioOncol. 2020;2(4):599–610. doi:10.1016/j.jaccao.2020.08.007
109. Zdravkovic S, Wienke A, Pedersen NL, et al. Heritability of death from coronary heart disease: a 36-year follow-up of 20 966 Swedish twins. J Intern Med. 2002;252(3):247–254. doi:10.1046/j.1365-2796.2002.01029.x
110. Torkamani A, Wineinger NE, Topol EJ. The personal and clinical utility of polygenic risk scores. Nat Rev Genet. 2018;19(9):581–590. doi:10.1038/s41576-018-0018-x
111. Christiansen MK, Nissen L, Winther S, et al. Genetic risk of coronary artery disease, features of atherosclerosis, and coronary plaque burden. J Am Heart Assoc. 2020;9(3):e014795. doi:10.1161/JAHA.119.014795
112. Khera AV, Emdin CA, Drake I, et al. Genetic risk, adherence to a healthy lifestyle, and coronary disease. N Engl J Med. 2016;375(24):2349–2358. doi:10.1056/NEJMoa1605086
113. Inouye M, Abraham G, Nelson CP, et al. Genomic risk prediction of coronary artery disease in 480,000 adults: implications for primary prevention. J Am Coll Cardiol. 2018;72(16):1883–1893. doi:10.1016/j.jacc.2018.07.079
114. Mega JL, Stitziel NO, Smith JG, et al. Genetic risk, coronary heart disease events, and the clinical benefit of statin therapy: an analysis of primary and secondary prevention trials. Lancet. 2015;385(9984):2264–2271. doi:10.1016/S0140-6736(14)61730-X
 © 2024 The Author(s). This work is published and licensed by Dove Medical Press Limited. The
full terms of this license are available at https://www.dovepress.com/terms
and incorporate the Creative Commons Attribution
- Non Commercial (unported, 3.0) License.
By accessing the work you hereby accept the Terms. Non-commercial uses of the work are permitted
without any further permission from Dove Medical Press Limited, provided the work is properly
attributed. For permission for commercial use of this work, please see paragraphs 4.2 and 5 of our Terms.
© 2024 The Author(s). This work is published and licensed by Dove Medical Press Limited. The
full terms of this license are available at https://www.dovepress.com/terms
and incorporate the Creative Commons Attribution
- Non Commercial (unported, 3.0) License.
By accessing the work you hereby accept the Terms. Non-commercial uses of the work are permitted
without any further permission from Dove Medical Press Limited, provided the work is properly
attributed. For permission for commercial use of this work, please see paragraphs 4.2 and 5 of our Terms.