Back to Journals » OncoTargets and Therapy » Volume 13
Use of a Novel Thyroid-Stimulating Hormone Model for Predicting the Progression of Hepatocellular Carcinoma
Authors Yu L ![]() , Liu X, Jiang Y, Wang X
, Liu X, Jiang Y, Wang X ![]() , Wang X, Yang Z
, Wang X, Yang Z ![]()
Received 7 August 2020
Accepted for publication 14 October 2020
Published 6 November 2020 Volume 2020:13 Pages 11421—11431
DOI https://doi.org/10.2147/OTT.S275304
Checked for plagiarism Yes
Review by Single anonymous peer review
Peer reviewer comments 2
Editor who approved publication: Professor Yong Teng
Lihua Yu,1,2,* Xiaoli Liu,1,* Yuyong Jiang,1,* Xinhui Wang,1 Xianbo Wang,1 Zhiyun Yang1
1Center of Integrative Medicine, Beijing Ditan Hospital, Capital Medical University, Beijing 100015, People’s Republic of China; 2First Clinical Medical College, Beijing University of Chinese Medicine, Beijing 100029, People’s Republic of China
*These authors contributed equally to this work
Correspondence: Zhiyun Yang
Center of Integrative Medicine, Beijing Ditan Hospital, Capital Medical University, Beijing 100015, People’s Republic of China
Tel/Fax +86-10-84322148
Email [email protected]
Background: Individuals with hepatocellular carcinoma (HCC) are at risk of tumor recurrence after surgical resection, which affects their survival. The aim of the present study was to establish a model for predicting tumor progression in patients with HCC.
Methods: To develop and validate the efficacy of a novel prognostic model, a retrospective cohort with HCC (n = 1005) at Beijing Ditan Hospital was enrolled from January 2008 and June 2017. Furthermore, a prospective cohort (n = 77) was recruited to validate the association between thyroid-stimulating hormone (TSH) levels and tumor progression in patients with HCC.
Results: The model used in predicting the progression of HCC included four variables (namely, Barcelona Clinic Liver Cancer [BCLC] stage, presence of portal vein tumor thrombus, alpha-fetoprotein level, and TSH level). The AUROC of the 1-year progression-free survival (PFS) model was 0.755 and 0.753 in the deriving cohort and validation cohort, respectively, and these values were significantly higher than those of the Child–Pugh score, Model for End-stage Liver Disease (MELD), tumor–lymph node–metastasis (TNM) staging system, Okuda classification, and CLIP score. A simple assessment using a nomogram showed the 1-year PFS rate of patients with HCC. In the prospective cohort, the KM curve showed that the high TSH level group had a shorter PFS than the low TSH level (p = 0.001).
Conclusion: The prognostic model of HCC progression was superior to other well-known classical tumor scoring systems. A high TSH level was correlated to poor outcome, particularly those with advanced HCC.
Keywords: hepatocellular carcinoma, thyroid hormone, tumor progression model
Background
Hepatocellular carcinoma (HCC) is the fourth leading cause of cancer-related deaths worldwide based on the 2018 Global Cancer Statistics. Moreover, the countries that are at high risk for HCC are China and Eastern Africa.1 Based on China’s cancer statistics in 2015, HCC accounts for one-third, or even half, of the total HCC cases globally.2 HCC poses a serious threat to the life and health of people.
Several classical prediction models used for evaluating liver function, which include the Child–Pugh and MELD scores, cannot assess for liver tumors.3 However, there are three well-known tumor prediction models, which are as follows: tumor–lymph node–metastasis (TNM) staging system, which is used for the prognostication of most solid tumors,4 Okuda staging system, which is utilized for measuring liver function (ascites, albumin, and bilirubin levels) and estimating the percentage of liver tumor involvement, and CLIP system (Child–Pugh score, liver tumor load, AFP level, and presence of portal vein tumor thrombus [PVTT]).5,6 All the above mentioned models are used to predict the mortality of HCC. However, in predicting the prognosis of HCC, a novel model for tumor progression must be established.
Most of the current models for predicting the recurrence of HCC are concentrated in resection or liver transplantation population, while there are few models related to the progression of HCC compared with other treatment methods of HCC patients. Recurrence and progression will affect the survival outcome of patients with HCC. Although liver transplantation is the highest level of treatment for patients with HCC, the recurrence of such condition remains a limiting factor of long-term survival.7
Meanwhile, the recurrence rate for radical treatment methods is still high in patients with HCC after resection.8 Progression-free survival (PFS) is becoming more and more important as an alternative endpoint for overall survival of solid tumors,9 because it is measured earlier in the same follow-up. Therefore, different models were used to predict the recurrence of HCC after liver transplantation and curative resection. In addition, in the whole HCC population, a model for predicting tumor progression is not yet available.
The present study aimed to identify a novel prognostic model for tumor progression in patients with HCC. Furthermore, a prospective cohort was included to validate the correlation between thyroid‐stimulating hormone (TSH) level and tumor progression.
Methods
Study Design and Population
A retrospective cohort (n=1005) and prospective cohort (n=77) were included in the study. The retrospective cohort comprised patients with HCC from Beijing Ditan Hospital between January 2008 and June 2017, and the prospective cohort included patients with HCC from Beijing Ditan Hospital between January 2018 and June 2018. In patients with HCC, radiological examination was performed every 3–6 months. The time of tumor progression was identified on radiological examination. The definition of progression conforms to the mRECIST criteria.10 Progression-free survival (PFS) was calculated from the date of diagnosis to the date when tumor progression was diagnosed or date of last follow-up.
The inclusion criteria were as follows: (1) patients with HCC who were diagnosed according to the 2017 China guidelines (based on biopsy, radiology, and alpha-fetoprotein [AFP level ≥ 400 μg/L] serology results),11 (2) those with complete clinical data, (3) those with more than 1 year of follow-up.
The exclusion criteria were as follows: (1) pregnant women, (2) those younger than 18 years, (3) those with incomplete data, and (4) those with <1 year of follow-up.
Demographic and Clinical Data
The following demographic data were collected: age, gender, alcohol consumption, smoking history, family history of HCC, etiology, Barcelona clinic liver cancer (BCLC) stage, tumor multiplicity, tumor size, and presence of PVTT at baseline, cirrhosis, hypertension, diabetes, and coronary disease. The following laboratory parameters were included: white blood cell (WBC), neutrophil/lymphocyte (N/L), red blood cell, hemoglobin (HGB), platelet, blood urea nitrogen, creatinine (CR), alanine aminotransferase (ALT), aspartate aminotransferase (AST), total bilirubin (TBIL), albumin (ALB), γ-glutamyl transferase, prothrombin (PTA), AFP, triiodothyronine (T3), tetraiodothyronine (T4), TSH, free triiodothyronine (FT3), and free tetraiodothyronine levels. The following complications were observed: ascites, bacterial infection, hepatorenal syndrome, esophageal and gastric varices, upper gastrointestinal hemorrhage, portal hypertension, and hepatic encephalopathy.
Scoring Models
The prognostic scores of the five classical models were included: The Child–Pugh score was calculated using the following values: hepatic encephalopathy level, prothrombin time, presence of ascites, TBIL level, and ALB level.12 The MELD score was calculated using the following formula: MELD = 3.78 × ln[TBIL (mg/dL)] + 11.2 × ln(INR) + 9.57 × ln[CR (mg/dL)] + 6.43.13 The TNM staging system includes tumor load, lymph node involvement, and metastasis.4 Okuda classification uses ALB and TBIL levels, presence or absence of ascites, and liver involvement.5 The CLIP score includes the Child–Pugh score, tumor morphology, AFP level, and presence of PVTT.6
Statistical Analysis
Demographic data and clinical factors, which included progression and no progression, were compared across the two groups using Student’s t-test, and continuous data were expressed as means ± standard deviation (SD) or medians with interquartile range (P25-P75) using the nonparametric Mann–Whitney U-test. Categorical variables were analyzed using the χ2 test or Fisher’s exact probability test.
Cox proportional regression analysis was performed to identify the independent prognostic factors of HCC. The PFS rates were compared using the Kaplan–Meier method.
Orthogonal partial least squares discriminant analysis (OPLS-DA) was used to rank the ability of the parameters in predicting the prognosis of patients with HCC using the SIMCA software (version 14.0). The prognostic model formula was developed using the means of multivariate logistic regression. Based on the multivariate analysis results, the nomogram models were established using rms in R project version 3.4.2 package (http://www.rproject.org/). The Statistical Package for the Social Sciences software (version 22.0) and R (version 3.6.0) were used for statistical analysis.
Results
Characteristics of the Retrospective Cohort of Patients with HCC
The retrospective cohort (n=1005) was divided into deriving cohort (January 2008 and December 2014, n=698) and validation cohort (January 2015 and June 2017, n=307) to establish a novel prognostic model. The characteristics of the two cohorts of patients with HCC are presented in detail (Table 1). In the deriving and validation cohorts, the progression group had higher conservative treatments, BCLC stage (stages C-D), N/L, AST, TBIL, γ-GGT, and AFP levels and lower HGB, ALB, PTA, TSH, T3, and FT3 levels and was more likely to present with PVTT, ascites, and bacterial infection than the no progression group.
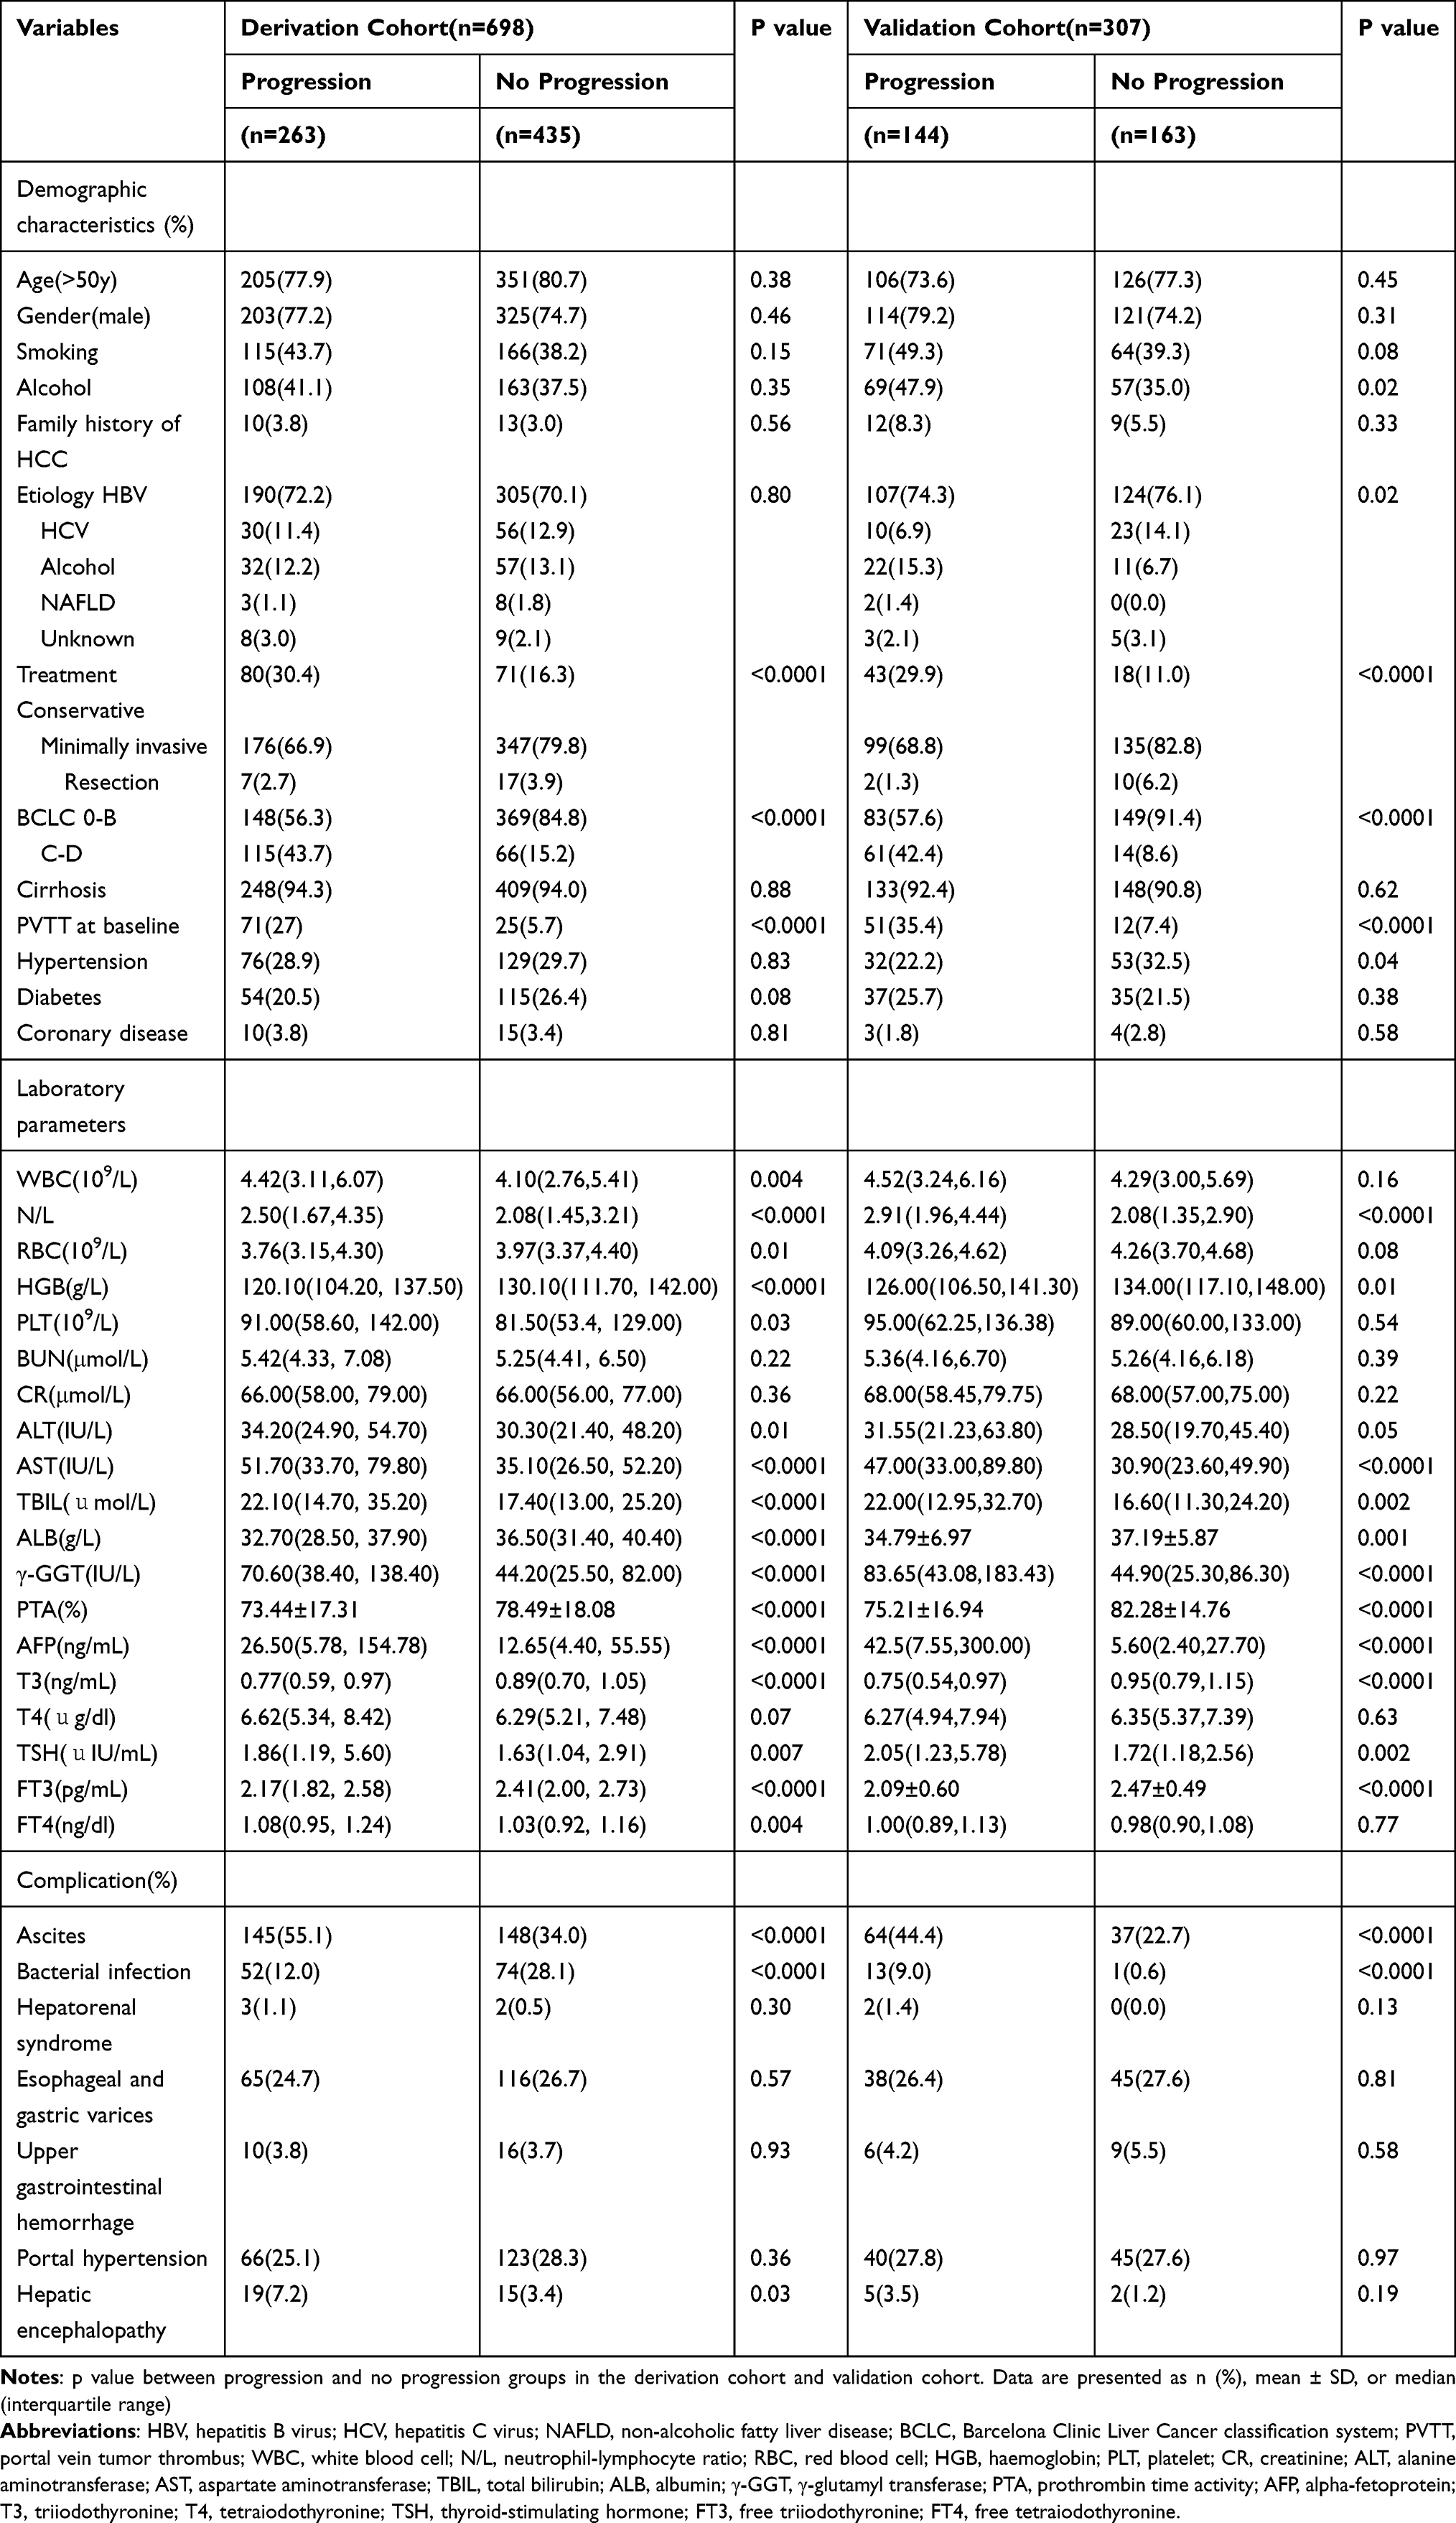 |
Table 1 Characteristics of Patients with Hepatocellular Carcinoma According to Outcome in the Derivation Cohort and Validation Cohort |
Identification of the Optimal Model for Predicting the Progression of HCC
Cox proportional regression analysis was performed to evaluate the effect of clinical variables on the outcome of patients with HCC. Cox multivariate analysis revealed that PVTT at baseline (hazard ratio [HR] = 1.91; 95% confidence interval [CI]: 1.28–2.84; p = 0.001), tumor size (>5 cm; HR = 1.42; 95% CI: 1.06–1.92; p = 0.02), BCLC stage (stages C-D; HR = 1.49; 95% CI: 1.04–2.13; p = 0.03), WBC level (>4*109/L; HR = 1.26; 95% CI: 1.01–1.57; p = 0.039), HGB level (>120 g/L; HR = 0.75; 95% CI: 0.57–0.99; p = 0.04), CR level (>111 μmol/L; HR = 2.05; 95% CI: 1.30–3.24; p = 0.002), ALB level (>40 g/L; HR = 0.66; 95% CI: 0.46–0.96; p = 0.028), γ-GGT level (>60 IU/L; HR = 1.82; 95% CI: 1.40–2.36; p < 0.0001), AFP level (>400 ng/mL; HR = 2.57; 95% CI: 1.97–3.36; p < 0.0001), and TSH level (>5uIU/mL; HR = 2.40; 95% CI: 1.83–3.15; p < 0.0001) were the independent prognostic predictors of HCC (Table 2).
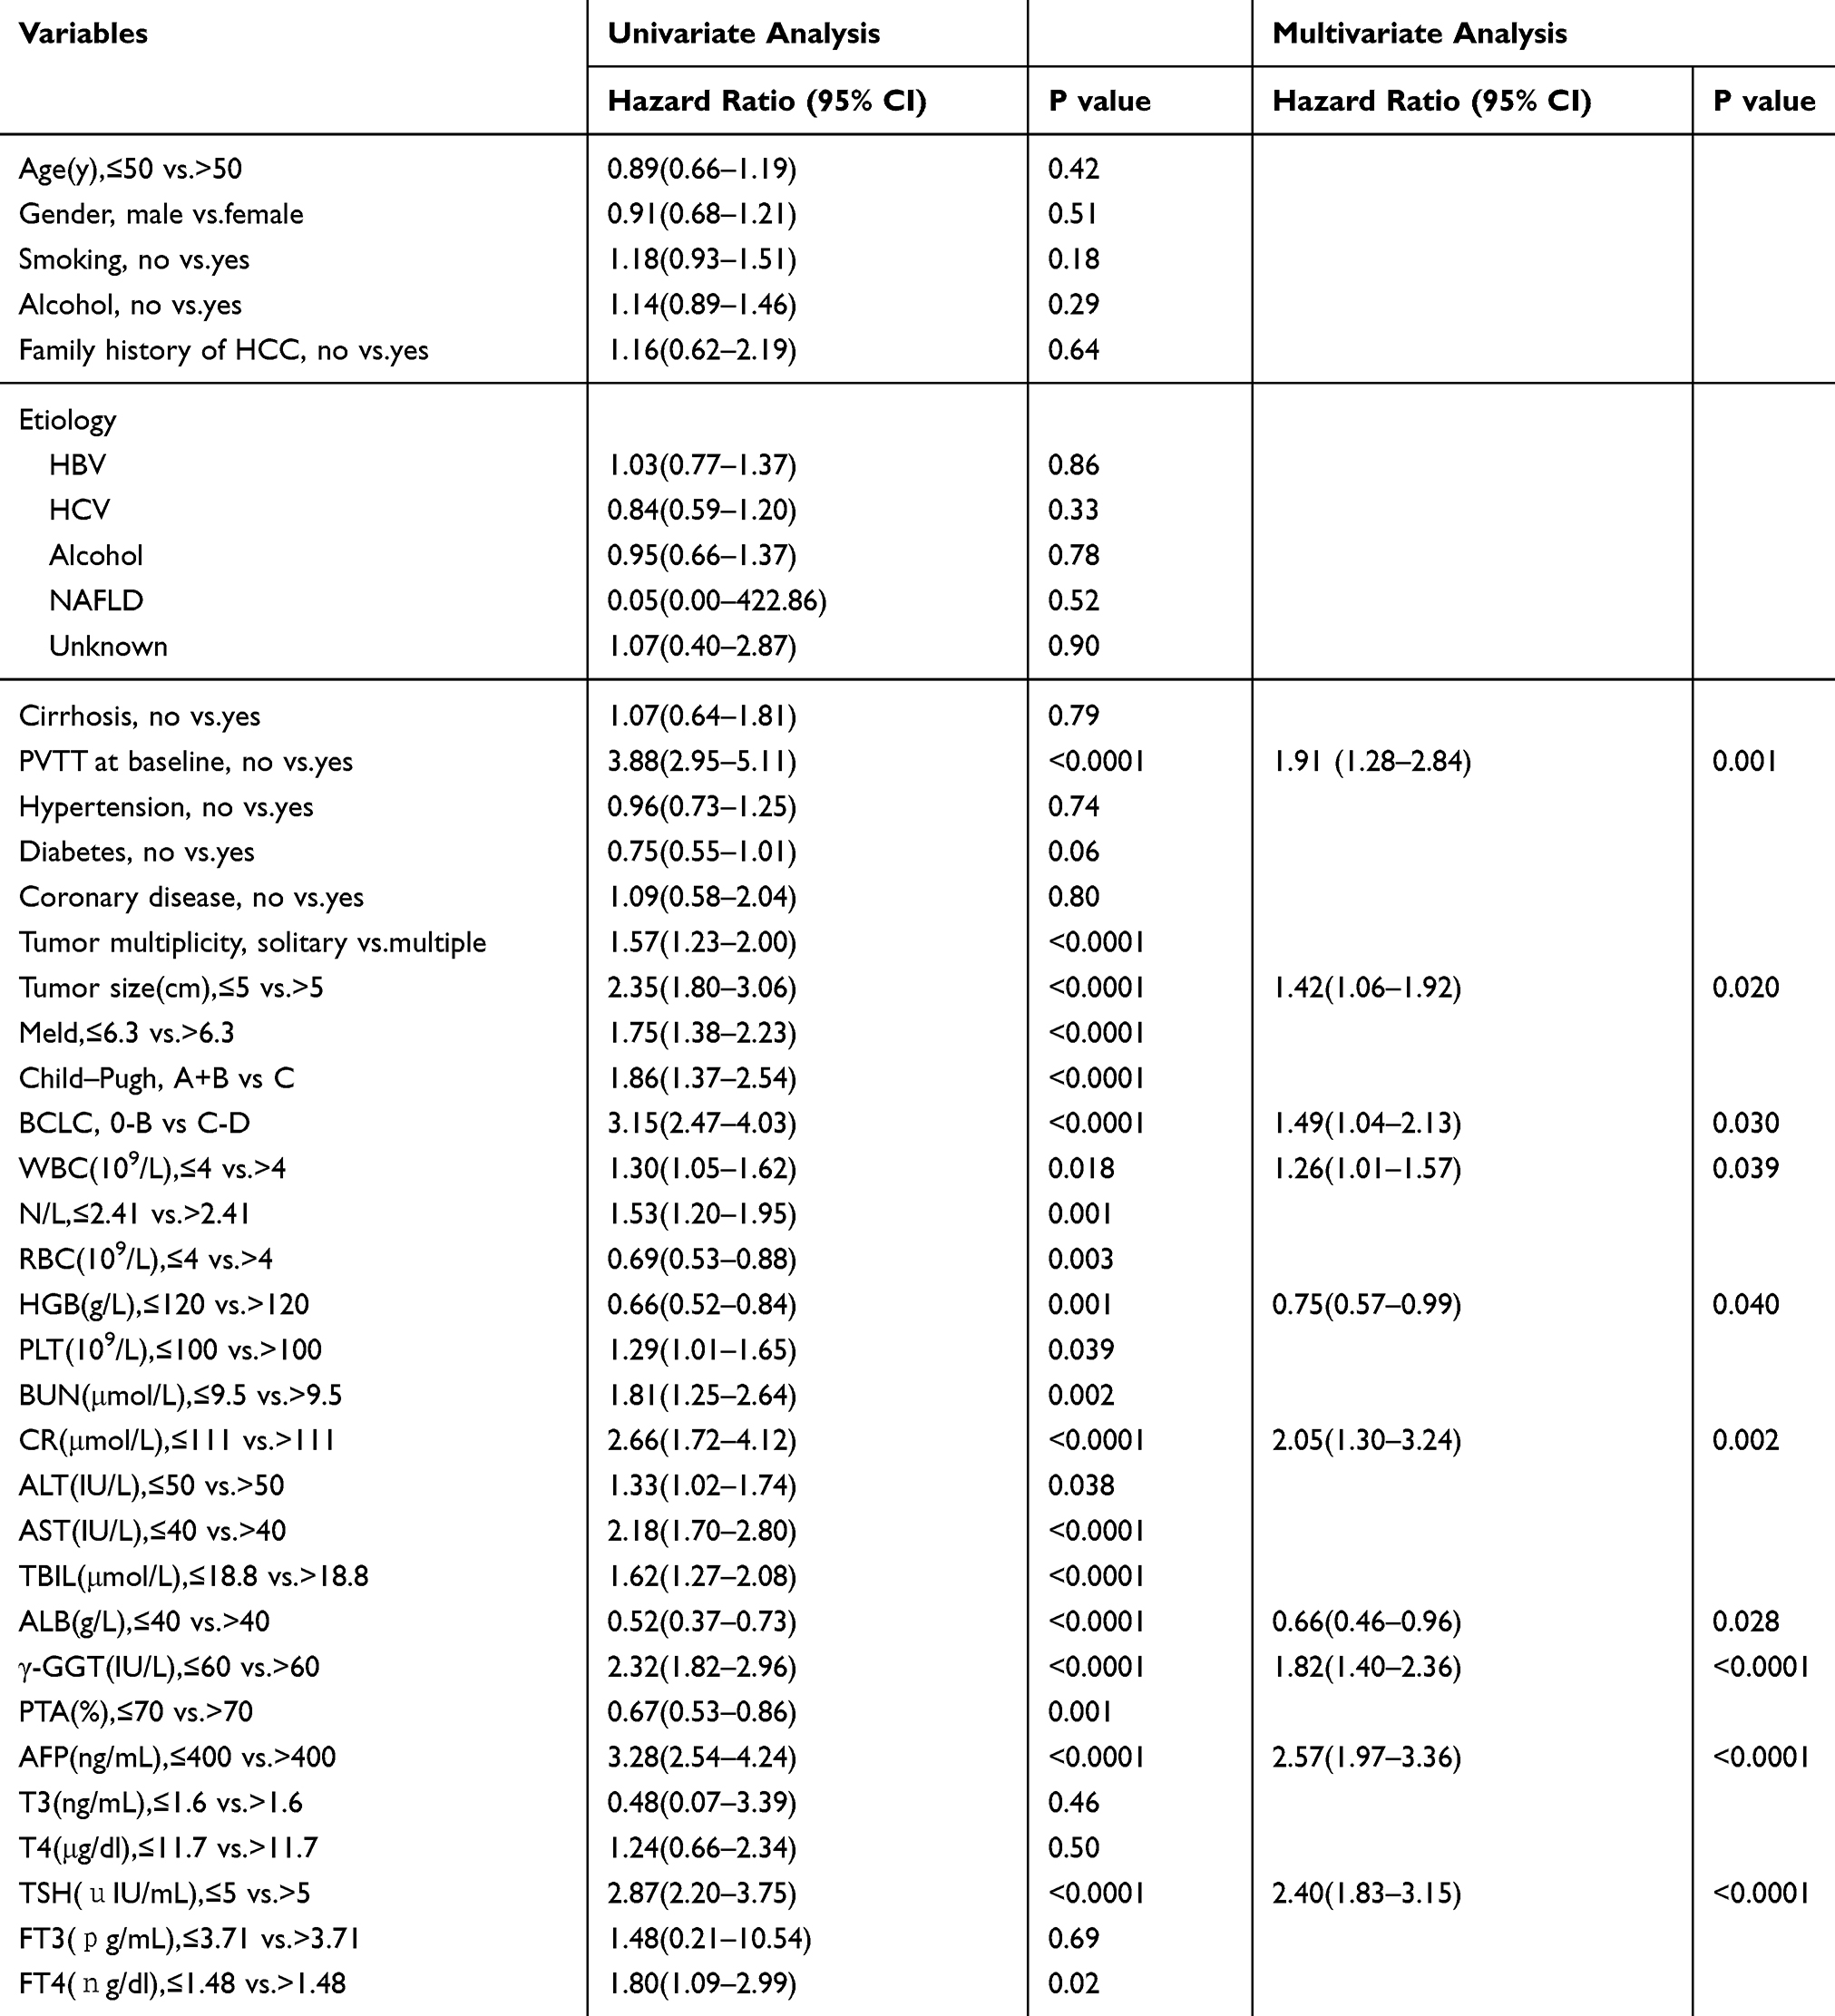 |
Table 2 Univariate and Multivariate Cox Regression Analyses for PFS in Patients with HCC from the Derivation Cohort |
OPLS-DA was conducted via optimization of the ability of the variables and the order of clinical variables affecting the outcome of HCC. The ROC and 3D plots were significantly different between the progression and no progression groups (Figure 1A and B). Combined with Cox multivariate regression factors, the top four clinical variables (namely, BCLC stage, presence of PVTT, AFP level, and TSH level) can better predict the outcome of tumor progression in patients with HCC (Figure 1C and D).
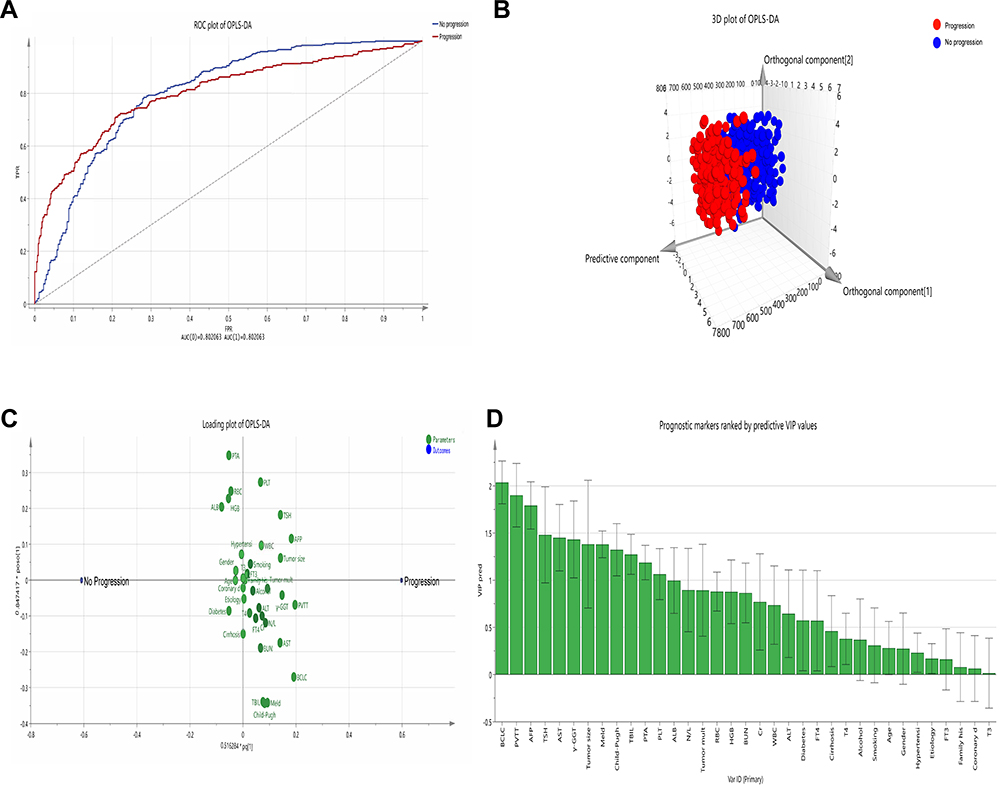 |
Figure 1 Orthogonal partial least squares discriminant analysis (OPLS‐DA) of the prognosis of HCC. (A) Receiver operating characteristic (ROC) curve of OPLS‐DA. (B) The OPLS-DA 3D plot of progression and no progression was distinguished using the predictive component: blue dots representing no progression and red dots indicating progression. (C) Loading plot from the OPLS-DA of the progression and no progression groups. The variables are located at zero on the x -axis, and the two groups were similar. Thoe deviating from zero on the x -axis have predictive value. (D) When the predictive VIP (VIP-pred) value is higher, the ability to predict the progression of HCC is stronger. |
A new model for predicting the progression of HCC (the progression model) was established via COX regression analysis: prognostic index (PI) = 0.793 * BCLC stage + 0.500 * PVTT + 1.004 * AFP level + 0.986 * TSH level (0 for patients with BCLC stage 0-B, without PVTT, AFP level ≤400 ng/mL, and TSH level ≤5uIU/mL; 1 for patients with BCLC stage C-D, PVTT at baseline, AFP level >400 ng/mL, and TSH level >5uIU/mL).
Validation of the Progression Model
We divided the progression model into the high-risk group (>0.4266) and low-risk group (≤0.4266), with cut-off values of 0.4266. The progression model in the high-risk group was significantly shorter than that in the low-risk group for PFS both in the deriving and validation cohorts (both p < 0.0001; Figure S1 A, B). The area under the receiver operating characteristic (AUROC) curve of the progression model for predicting 1-year PFS in the deriving and validation cohorts was 0.755 and 0.753, respectively. The AUROC of the progression model was significantly better than that of the separate variables in the model and classical model (Child–Pugh score, MELD score, TNM stage, Okuda classification, and CLIP score) (Figure 2A, B, C, and D). The AUROCs of all models are listed (Table S1). We further assessed the risk of One-year PFS in HCC patients with high levels of TSH and low levels of TSH according to different treatments in the deriving cohorts. Whether in conservative treatment, minimally invasive or resection, the risk of 1-year PFS of HCC patients with low level of TSH was significantly better than that in the high level of TSH group (Figure S2 A, B, and C).
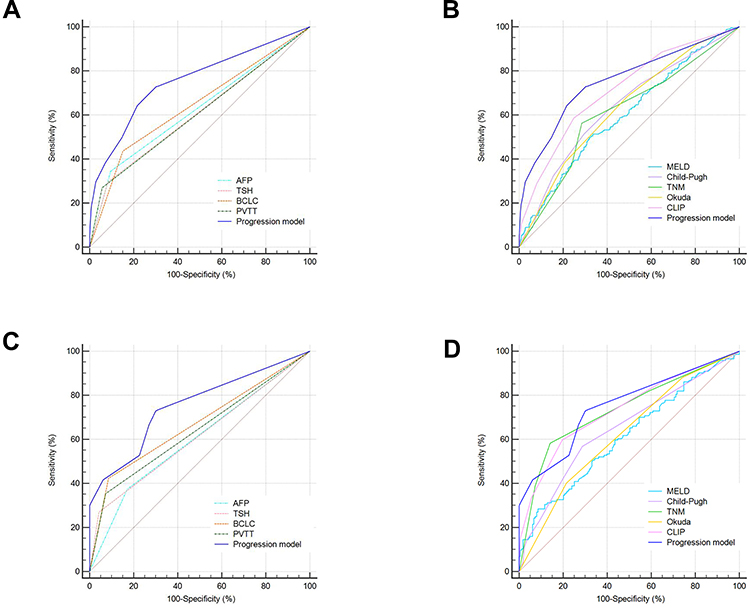 |
Figure 2 Receiver operating characteristic curves of the different models in predicting the 1-year PFS of patients with hepatocellular carcinoma. (A–B) Separate prognostic variables and other models in the deriving cohort. (C–D) Separate prognostic variables and other models in the validation cohort. |
Establishment and Evaluation of the Progression Model Using a Nomogram
The progression model was further established using a nomogram for PFS by combining BCLC stage, presence of PVTT, AFP level, and TSH level identified via the Cox multivariate analyses and OPLS-DA (Figure 3A). The nomogram included three tumor parameters (BCLC stage, presence of PVTT, and AFP level) and one thyroid function parameter (TSH level), and the detailed point assignment is presented (Table S2). The calibration plot for the probabilities of 1-year PFS fitted well between the actual observation and prediction of the progression model using a nomogram (Figure 3B and C). Meanwhile, we further established the decision curve analysis (DCA), a novel evaluation method for predicting the clinical net benefit. The clinical net benefit rate of the progression model using the nomogram was significantly higher than that of BCLC stage and TSH level (Figure 3D and E).
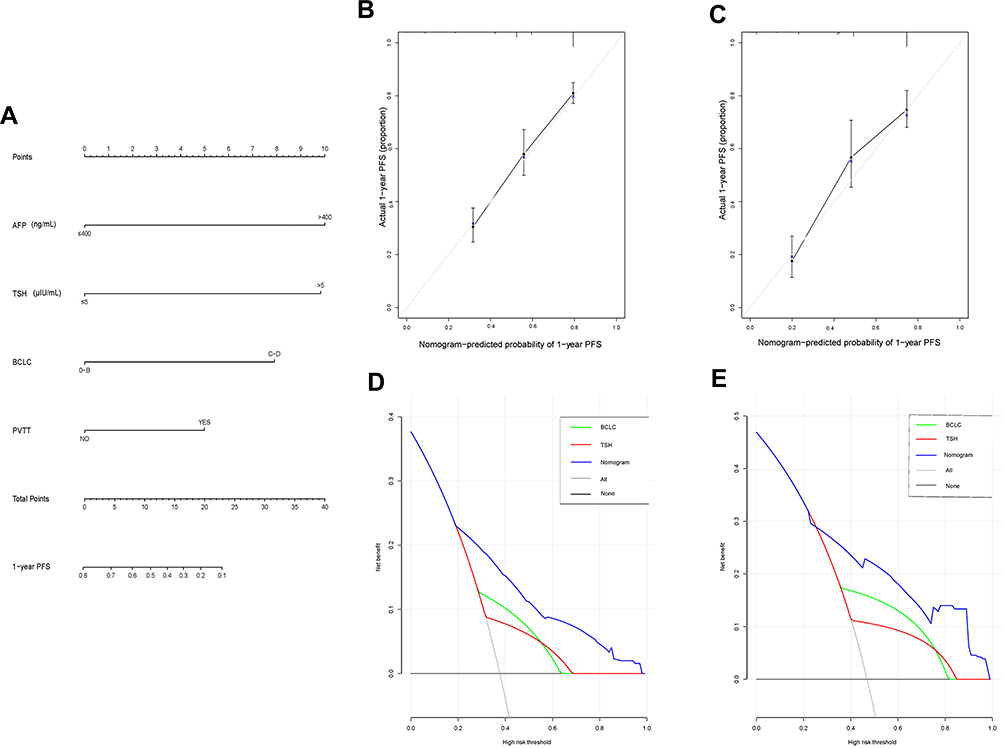 |
Figure 3 Prognostic nomogram and calibration curves and decision curve analysis. Nomogram predicted progression-free survival (PFS) (A) for HCC patients. To use the nomogram, the value of an individual patient is located on each variable axis, and a line is drawn upward to determine the number of points received for the value of each variable. The sum of these numbers is located on the total point axis, and a line is drawn downward to PFS axes to determine the likelihood of 1-year PFS. The calibration curves for 1-year PFS (B, C) in the deriving and validation cohorts were identified. The nomogram-predicted probability of PFS is plotted on the x-axis, and the actual PFS is plotted on the y-axis. Decision curve analyses show the clinical benefit of the different models. The nomogram-predicted probabilities of 1-year PFS (D, E) in the deriving and validation cohorts are compared with BCLC stage and TSH level. Solid lines indicate the net benefit of the predictive model across a range of threshold probabilities (blue: nomogram; red: TSH level; and green: BCLC stage). The horizontal solid black line represents the assumption that no patient will experience the event, and the solid grey line indicates the assumption that all patients will experience the event. AFP, alpha-fetoprotein; TSH, thyroid-stimulating hormone; BCLC classification system, Barcelona Clinic Liver Cancer classification system; PVTT, portal vein tumor thrombus. |
TSH Level of the Prospective Cohort
As TSH level is the fourth most powerful variable that can predict the progression of HCC, we further evaluated the relationship between TSH level and HCC progression in the prospective cohort. The clinical characteristics of patients with HCC are shown (Table S3). In the progression group, most patients were older (age > 50 years) and had PVTT, BCLC stage C-D, and high TSH level. The KM curve showed that the high TSH level group (TSH level > 5uIU/mL) had a shorter PFS than the low TSH level group (TSH level ≤ 5uIU/mL). Moreover, the effect of a high TSH level on the outcome of HCC was greater in patients with BCLC stage C-D than in those with BCLC stage 0-B (Figure 4A, B, and C).
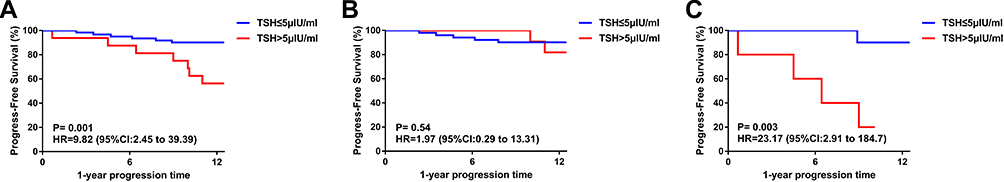 |
Figure 4 The Kaplan–Meier curve show Progression-free survival (PFS) of patients with hepatocellular carcinoma (HCC) who have different BCLC stages and thyroid-stimulating hormone (TSH) levels. (A) The PFS in all patients with HCC who have different TSH levels. (B) The PFS of HCC patients with BCLC stage 0-B. (C) The PFS of HCC patients with BCLC stage C-D. |
Discussion
At present, patients with HCC are still at risk of tumor progression after receiving different treatments (such as liver transplantation or resection, interventional therapy, or even conservative treatment). Tumor progression will directly affect the survival of patients with HCC. However, studies about solid tumors have identified and approved the surrogate endpoints of survival (including PFS) to reflect the survival benefits of patients.9,14 Therefore, a simple tumor progression model must be established for patients with HCC. We performed Cox multivariate analysis and OPLS-DA to identify the best variables and finally determine that the four variables (BCLC stage, presence of PVTT, AFP level, and TSH level) were the optimal models of HCC progression.
In the prognosis model of HCC, in terms of etiology, the prognostic model of hepatitis B correlated to HCC (PAGE-B, CU-HCC, GAG-HCC, and REACH-B for the development of HCC) must be established,15,16 and in terms of treatment, it is more important to evaluate the prognosis of recurrence and survival after surgical resection.17,18 However, in the whole HCC population, a tumor progression model for the evaluation of the clinical condition of patients with HCC is not available. In this study, we established a novel model for predicting HCC progression, and this model was compared with well-known classic tumor models (TNM staging system, Okuda classification, and CLIP score). Finally, the progression model for evaluating PFS was found to be superior to the classical tumor models in patients with HCC.
A nomogram is a widely used prediction model in clinical settings, which is simple and visualization. It can directly predict the probability of a single clinical variable and model to facilitate clinical decision-making.19 In our study, the nomogram integrated the optimal prognostic variables of HCC, including tumor grade (BCLC stage), serum tumor biomarkers (AFP level), presence of PVTT, and TSH level, thus making it accurate for the prediction of PFS. The calibration plot is used to evaluate how close the nomogram estimated risk is to the actual risk.19 The DCA has proposed the use of the clinical net benefit rate to evaluate the clinical benefit of the prediction model.20,21 Via the presentation of DCA, the progression model based on the nomogram has a good clinical benefit rate compared with BCLC stage and TSH level for predicting 1-year PFS.
In the progression model, the other three indices (BCLC stage, presence of PVTT, and AFP level) are all clinical variables directly correlated to HCC, and TSH level is a novel independent prognostic factor associated with HCC progression. If patients continually present with TSH levels exceeding 5uIU/mL, they are then diagnosed with hypothyroidism. A previous study has shown that a high prevalence of hypothyroidism was observed in patients with HCC, and the incidence of hypothyroidism was as high as 11.7%. The risk of HCC was 2-fold in patients with hypothyroidism compared with those without.22 Moreover, hypothyroidism was also observed in a patient with an HCC of unknown etiology.23 Numerous clinical studies have found that hypothyroidism is an independent risk factor of HCC.24,25 Furthermore, the role of thyroid hormone in HCC was observed in animal research and basic experimental studies. Frau C et al have found that hypothyroidism enhances the development of precancerous lesions for HCC in an animal study.26 Hypothyroidism directly affects the reduction of catalase and glutathione in the liver, resulting in liver cell damage.27,28 Thyroid-stimulating hormone receptor (TSHR) exists not only in thyroid tissue but also in human liver tissues. TSH/TSHR has been shown to play an important role in maintaining liver glucose, triglyceride, and bile acid homeostasis in animal models,29–31 and it has also been found that TSH/TSHR overexpression in human HCC tissues is associated with poor prognosis.32 However, the role of thyroid hormone in HCC has been controversial.33 The studies have found that patients with high levels of TSH, the larger the tumor, the worse the prognosis.34 In contrast, another independent study has shown that higher TSH or FT4 in the blood is associated with better clinical outcomes in HCC patients receiving chemotherapy.25 Therefore, in our prospective cohort, we found that TSH level was associated with HCC progression, and patients with a high TSH level were at risk of tumor progression. Further analysis showed that the PFS of HCC patients with BCLC stage C-D who had high TSH level was shorter than that of patients with low TSH level.
The present study had several limitations. First, in the establishment of the progression model, only internal verification was performed, and external multicenter data were not available for validation. Second, the correlation between TSH level and progression outcome in patients with HCC was only observed in a small proportion of the prospective cohort, and the number of HCC patients with high TSH level was not sufficient. Therefore, a large sample of prospective data is required for evaluation. Third, PFS was used as the predictive index of outcome, which requires radiological data to determine the presence of tumor progression. Thus, the time is not as accurate as the overall survival.
Conclusions
In conclusion, the establishment of the progression model can predict tumor progression and positively affect the survival of HCC patients. Moreover, a high TSH level was correlated to poor outcome in HCC patients, particularly those with advanced HCC.
Abbreviations
HCC, hepatocellular carcinoma; HBV, hepatitis B virus; HCV, hepatitis C virus; NAFLD, non-alcoholic fatty liver disease; BCLC, Barcelona Clinic Liver Cancer classification system; MELD, Model for End-stage Liver Disease; TNM, tumor–lymph node–metastasis; PVTT, portal vein tumor thrombus; WBC, white blood cell; N/L, neutrophil-lymphocyte ratio; RBC, Red blood cell; HGB, haemoglobin; PLT, platelet; CR, creatinine; ALT, alanine aminotransferase; AST, aspartate aminotransferase; TBIL, total bilirubin; ALB, albumin; γ-GGT, γ-glutamyl transferase; PTA, prothrombin time activity; AFP, alpha-fetoprotein; T3, triiodothyronine, T4, tetraiodothyronine; TSH, thyroid‐stimulating hormone; FT3, free triiodothyronine; FT4, free tetraiodothyronine; OPLS-DA, Orthogonal partial least squares discriminant analysis; AUROC, area under the receiver operating characteristic; DCA, decision curve analysis; PFS, Progression-free survival.
Ethics Approval and Consent to Participate
This study is in accordance with the Declaration of Helsinki and has been approved by the ethical committee of Beijing Ditan Hospital, Capital Medical University. The study is a retrospective research, only collect the clinical data of patients, do not interfere with the treatment plan of patients, and will not bring risks to the physiology of patients. The researchers will try their best to protect the information provided by patients from disclosing personal privacy. Retrospective study does not need to obtain informed consent, mainly because: (1) we only collect clinical laboratory data of patients, the risk is controllable; (2) some patients lose contact or have died, and can not track their own signature of informed consent. All patients in the prospective cohort provide informed consent to have their clinical data used in this study. And the researchers keep their privacy strictly.
Consent for Publication
Written informed consent was obtained from each patient. Information that could identify individual participants during or after data collection was not accessible.
Funding
This study was supported by the National Science Foundation of China (No. 81874435), Application of Clinical Features of Capital City of Science and Technology commission (No. Z171100001017082).
Disclosure
The authors declare that they have no competing interests.
References
1. Bray F, Ferlay J, Soerjomataram I, et al. Global cancer statistics 2018: GLOBOCAN estimates of incidence and mortality worldwide for 36 cancers in 185 countries[J]. CA Cancer J Clin. 2018;68(6):394–424.
2. Chen W, Zheng R, Baade PD, et al. Cancer statistics in China, 2015[J]. CA Cancer J Clin. 2016;66(2):115–132.
3. Durand F, Valla D. Assessment of the prognosis of cirrhosis: child–Pugh versus MELD[J]. J Hepatol. 2005;42(1):S100–S107. doi:10.1016/j.jhep.2004.11.015
4. Sobin LH, Gospodarowicz MK, Wittekind C TNM Classification of Malignant Tumours, 7th Edition[M]//TNM classification of malignant tumours. 1992.
5. Okuda K, Ohtsuki T, Obata H, et al. Natural history of hepatocellular carcinoma and prognosis in relation to treatment study of 850 patients[J]. Cancer. 1985;56(4):918–928.
6. Listed N. A new prognostic system for hepatocellular carcinoma: A retrospective study of 435 patients[J]. Hepatology. 1998;28(3):751–755.
7. Zimmerman MA, et al. Recurrence of hepatocellular carcinoma following liver transplantation: a review of preoperative and postoperative prognostic indicators[J]. Arch Surg. 2008;143(2):182–188. doi:10.1001/archsurg.2007.39
8. Okada S, Shimada K, Yamamoto J, et al. Predictive factors for postoperative recurrence of hepatocellular carcinoma[J]. Gastroenterology. 1994;106(6):1618–1624. doi:10.1016/0016-5085(94)90419-7
9. Llovet JM, Montal R, Villanueva A. Randomized trials and endpoints in advanced HCC: role of PFS as a surrogate of survival. J Hepatol. 2019;70(6):1262–1277. doi:10.1016/j.jhep.2019.01.028
10. Lencioni R, Llovet JM. Modified RECIST (mRECIST) assessment for hepatocellular carcinoma. Semin Liver Dis. 2010;30(01):052–060. doi:10.1055/s-0030-1247132
11. Zhou J, Sun H-C, Wang Z, et al. Guidelines for diagnosis and treatment of primary liver cancer in China (2017 edition)[J]. Liver Cancer. 2018;7(3):235–260. doi:10.1159/000488035
12. Cholongitas E, Papatheodoridis GV, Vangeli M, et al. Systematic review: the model for end-stage liver disease - should it replace Child-Pugh’s classification for assessing prognosis in cirrhosis? Aliment Pharmacol Ther. 2018;7(11–12):
13. Kamath PS, Kim WR. The model for end-stage liver disease (MELD). Hepatology. 2007;45(3):797–805. doi:10.1002/hep.21563
14. Kemp R, Prasad V. Surrogate endpoints in oncology: when are they acceptable for regulatory and clinical decisions, and are they currently overused?[J]. BMC Med. 2017;15(1):134. doi:10.1186/s12916-017-0902-9
15. Papatheodoridis G, Dalekos G, Sypsa V, et al. PAGE-B predicts the risk of developing hepatocellular carcinoma in Caucasians with chronic hepatitis B on 5-year antiviral therapy[J]. J Hepatol. 2016;64(4):800–806. doi:10.1016/j.jhep.2015.11.035
16. Wong GLH, Chan HLY, Chan HY, et al. Accuracy of risk scores for patients with chronic hepatitis B receiving entecavir treatment[J]. Gastroenterology. 2013;144(5):933–944. doi:10.1053/j.gastro.2013.02.002
17. Schoenberg M, Hao J, Bucher J, et al. Perivascular tumor-infiltrating leukocyte scoring for prognosis of resected hepatocellular carcinoma patients[J]. Cancers. 2018;10(10):389. doi:10.3390/cancers10100389
18. Fan Ang S, Ng ES-H, Li H, et al. Correction: the Singapore Liver Cancer Recurrence (SLICER) Score for Relapse Prediction in Patients with Surgically Resected Hepatocellular Carcinoma. PLoS One. 2015;10(5):e0128058. doi:10.1371/journal.pone.0128058
19. Balachandran VP, Gonen M, Smith JJ, et al. Nomograms in oncology: more than meets the eye[J]. Lancet Oncol. 2015;16(4):e173–e180. doi:10.1016/S1470-2045(14)71116-7
20. Vickers AJ, Elkin EB. Decision curve analysis: a novel method for evaluating prediction models[J]. Med Decision Making. 2006;26(6):565–574. doi:10.1177/0272989X06295361
21. Talluri R, Shete S. Using the weighted area under the net benefit curve for decision curve analysis[J].BMC. BMC Medical Informatics and Decision Making. 2016;16(1):94. doi:10.1186/s12911-016-0336-x
22. Hassan MM, Kaseb A, Li D, et al. Association between hypothyroidism and hepatocellular carcinoma: A case-control study in the United States. Hepatology. 2009;49(5):1563–1570. doi:10.1002/hep.22793
23. Reddy A, Dash C, Leerapun A, et al. Hypothyroidism: a possible risk factor for liver cancer in patients with no known underlying cause of liver disease[J]. Clin Gastroenterol Hepatol. 2007;5(1):118–123. doi:10.1016/j.cgh.2006.07.011
24. Zhang N, Jin W, Zhou S, et al. Hypothyroidism is associated with worse outcomes of hepatocellular carcinoma patients after liver transplantation. Cancer Med. 2018;7(12):5870–5878. doi:10.1002/cam4.1797
25. Chu Y-D, Lin K-H, Huang Y-H, et al. A novel thyroid function index associated with opposite therapeutic outcomes in advanced hepatocellular carcinoma patients receiving chemotherapy or sorafenib[J]. Asia-Pacific Journal of Clinical Oncology. 2018;14(5):e341–e351. doi:10.1111/ajco.12983
26. Frau C, Loi R, Petrelli A, et al. Local hypothyroidism favors the progression of preneoplastic lesions to hepatocellular carcinoma in rats[J]. Hepatology. 2015;61(1):249–259. doi:10.1002/hep.27399
27. Grattagliano I, Lauterburg BH, Portincasa P, et al. Mitochondrial glutathione content determines the rate of liver regeneration after partial hepatectomy in eu- and hypothyroid rats. J Hepatol. 2003;39(4):571–579. doi:10.1016/S0168-8278(03)00317-9
28. S M W, Cheng WL, Lin CD, et al. Thyroid hormone actions in liver cancer[J]. Cell Mol Life Sci. 2013;70(11):1915–1936.
29. Wang T, Xu J, Bo T, et al. Decreased fasting blood glucose is associated with impaired hepatic glucose production in thyroid-stimulating hormone receptor knockout mice[J]. Endocr J. 2013;60(8):941–950. doi:10.1507/endocrj.EJ12-0462
30. Yan F, Wang Q, Lu M, et al. Thyrotropin increases hepatic triglyceride content through upregulation of SREBP-1c activity[J]. J Hepatol. 2014;61(6):1358–1364. doi:10.1016/j.jhep.2014.06.037
31. Zhang X, Song Y, Feng M, et al. Thyroid-stimulating hormone decreases HMG-CoA reductase phosphorylation via AMP-activated protein kinase in the liver[J]. J Lipid Res. 2015;56(5):963–971. doi:10.1194/jlr.M047654
32. Shih YL, Huang YH, Lin KH, et al. Identification of functional thyroid stimulating hormone receptor and TSHR gene mutations in hepatocellular carcinoma[J]. Anticancer Res. 2018;38(5):2793–2802.
33. Chi HC, Tsai CY, Tsai MM, et al. Molecular functions and clinical impact of thyroid hormone-triggered autophagy in liver-related diseases[J]. J Biomed Sci. 2019;26:1.
34. Pinter M, Haupt L, Hucke F, et al. The impact of thyroid hormones on patients with hepatocellular carcinoma[J]. PLoS One. 2017;12(8):e0181878. doi:10.1371/journal.pone.0181878
 © 2020 The Author(s). This work is published and licensed by Dove Medical Press Limited. The
full terms of this license are available at https://www.dovepress.com/terms
and incorporate the Creative Commons Attribution
- Non Commercial (unported, 3.0) License.
By accessing the work you hereby accept the Terms. Non-commercial uses of the work are permitted
without any further permission from Dove Medical Press Limited, provided the work is properly
attributed. For permission for commercial use of this work, please see paragraphs 4.2 and 5 of our Terms.
© 2020 The Author(s). This work is published and licensed by Dove Medical Press Limited. The
full terms of this license are available at https://www.dovepress.com/terms
and incorporate the Creative Commons Attribution
- Non Commercial (unported, 3.0) License.
By accessing the work you hereby accept the Terms. Non-commercial uses of the work are permitted
without any further permission from Dove Medical Press Limited, provided the work is properly
attributed. For permission for commercial use of this work, please see paragraphs 4.2 and 5 of our Terms.