Back to Journals » Diabetes, Metabolic Syndrome and Obesity » Volume 11
Urinary TGF-β1 was not independently associated with renal function in diabetes mellitus
Authors Sauriasari R ![]() , Pratiwi MY
, Pratiwi MY ![]()
Received 23 April 2018
Accepted for publication 17 July 2018
Published 8 October 2018 Volume 2018:11 Pages 597—602
DOI https://doi.org/10.2147/DMSO.S172057
Checked for plagiarism Yes
Review by Single anonymous peer review
Peer reviewer comments 2
Editor who approved publication: Professor Ming-Hui Zou
Rani Sauriasari, Mia Yuliana Pratiwi
Faculty of Pharmacy, Universitas Indonesia, Depok, Indonesia
Background: Several clinical studies have shown increased level of urinary TGF-β1 in diabetic nephropathy patients and its correlation with urine albumin-to-creatinine ratio (UACR), but other studies showed different results. Because of this contradiction, this study aims to analyze the correlation between urinary TGF-β1 concentration and UACR, and also estimated glomerular filtration rate (eGFR) in type 2 diabetes mellitus (DM) patients by controlling some confounding factors.
Methods: This was a cross-sectional study, and the samples were obtained using consecutive sampling technique. The study was performed on 99 subjects (62 DM normoalbuminuria patients, 27 DM albuminuria patients, and 10 non-DM patients as controls) at Pasar Minggu Community Health Center. Urinary TGF-β1 concentration was measured by ELISA, and UACR was measured using immunoturbidimetry and an enzymatic colorimetric method. The eGFR value was calculated based on serum creatinine using Chronic Kidney Disease Epidemiology Collaboration equation. The results were then subjected to be analyzed statistically.
Results: There was an increase of urinary TGF-β1 in albuminuria (326.49±48.98) as compared to normoalbuminuria (290.54±30.71) and non-DM subjects (229.83±31.90), but the values did not differ statistically (P=0.790). In addition, no correlation was observed between urinary TGF-β1 and UACR (r=−0.084, P=0.410) and eGFR (r=0.155, P=0.125), but a correlation was found with SBP (r=−0.224, P=0.026). Linear regression analysis showed that urinary TGF-β1 and HbA1c could predict UACR, but only HbA1c could be considered as a significant predictor of UACR.
Conclusion: There is an increase of urinary TGF-β1 concentrations in albuminuria patients clinically, but not statistically. The concentration of TGF-β1 was not correlated with UACR and eGFR, but correlated with SBP. Since TGF-β1 could be interfered by many factors, including hypertension and its medication, urinary TGF-β1 might not be independently associated with renal function in diabetes.
Keywords: albuminuria, diabetes mellitus, diabetic nephropathy, TGF-β1, UACR
Introduction
Diabetic nephropathy is a common microvascular complication of DM and a severe health problem due to increased morbidity and mortality. The most common cause of chronic renal disease and ESRD in the US is diabetes, which accounts for roughly 50% of all cases, followed by hypertension (25%), with other causes including glomerulonephritis and polycystic kidney disease.1 In Malaysia, South Korea, and Mexico, ESRD is caused by diabetic nephropathy in more than 50% of the cases.1 It is predicted that the prevalence will increase by more than two million cases in 2030.1 The risk of diabetic nephropathy causing ESRD is equivalent to an increase of early mortality in DM patients.1 eGFR and UACR are referred to as biomarkers to determine chronic kidney diseases.2 However, there are situations where serum creatinine based-eGFR may not be accurate due to the clinical conditions that affect serum creatinine concentration.3 Inaccuracy also happens in measuring urine albumin since the calculation of excretion rate requires a timed urine specimen. An error could be due to incomplete bladder emptying, incomplete collection, and spills, which lead to the variation in albumin excretion.3 Also, studies have shown that the progression of diabetic nephropathy is even reported in diabetic patients without any significant changes in urinary albumin levels; for instance, microalbuminuria could reverse to normoalbuminuria in advanced diabetic nephropathy patients.4,5 The excretion level of albumin also varied due to some clinical characteristics of patients, such as obesity, exercise, diet, smoking, infection, and inflammation.6–10 These observations indicate that the progression of diabetic nephropathy does not necessarily affect urinary albumin, yet it only reflects an initial reversible phase of kidney damage.11 Thus, these markers are relatively imprecise to determine the early stage of diabetic nephropathy in DM patients, and a more sensitive diagnostic test of early-stage kidney damage in DM patients is highly needed.12
Several studies have suggested that intrinsic renal cells can produce inflammatory cytokines and growth factors, such as TGF-β1, during the progression of diabetic nephropathy.13,14 As a fibrogenic cytokine, TGF-β1 is considered as a key mediator in diabetic nephropathy.15 Recent evidence suggests that TGF-β1 is involved in the pathogenesis of diabetic nephropathy because of its prosclerotic properties.16 TGF-β1 is a multifunctional cytokine circulating in a biologically inactive form in human plasma.17 Among its many actions, regulation of cell proliferation and ECM production appear prominent. Excessive production of TGF-β1 is thought to occur in cases with fibrosis of the kidney, liver, skin, and other organs.18 The expression of TGF-β1 is known to be increased in patients with type 2 DM, especially those with high HbA1c. Hyperglycemia in DM patients can activate ROS, PKC, polyol pathway, production of AGEs, and hexosamine pathway, which will transcribe TGF-β1.13,19,20 The presence of TGF-β1 causes renal cell hypertrophy and accumulation of ECM, which are involved in the pathophysiology of kidney damage.12,20
Several clinical studies have shown increased level of urinary TGF-β1 in diabetic nephropathy patients and its correlation with UACR.18,20,21 However, other studies showed different results suggesting no correlation between urinary TGF-β1 and UACR in type 2 DM.22 Because of this contradiction, the present study aims to analyze the levels of urinary TGF-β1 in type 2 DM patients with normoalbuminuria and albuminuria, and to evaluate its correlation with the UACR, and also eGFR. The results of this research are expected to confirm whether TGF-β1 can be used as a marker for diabetic nephropathy.
Materials and methods
Study design and subjects
This was a cross-sectional study undertaken in April 2017 and was approved by Ethics Committee, Faculty of Medicine, Universitas Indonesia, Dr Cipto Mangunkusumo Hospital (151/UN2.F1/ETIK/II/2017). The study population included patients attending Pasar Minggu Community Health Center. A total of 99 subjects were divided into three groups: 27 patients with type 2 DM with albuminuria, 62 patients with type 2 DM with normoalbuminuria, and 10 non-DM controls.
Sample collection and assessment
Patients were enrolled if they met the following inclusion criteria: age ≥25 years old, in fasting state for at least 8 hours before sample collection, not severely anemic (Hb ≥10.7 g/dL), not having hematuria, and willing to sign written informed consent. Demographic and baseline data, including body weight, height, and blood pressure, were recorded. After enrollment, patients were asked to go home and return on the following day for study. They were instructed to fast for 8 hours before returning on the following day.
On the day of study, patients were asked to collect their first urine in the morning in a 30 mL plastic container. The urine obtained was divided into two equal parts: one was used for TGF-β1 measurement and the other was sent to a commercial laboratory (Prodia) to determine UACR. UACR was measured using immunoturbidimetry and an enzymatic colorimetric method. Urinary TGF-β1 level was measured using ELISA kit according to the procedure mentioned in the package insert (Catalog No. EH0287; Fine Test, Wuhan, China). Absorbance was measured at 450 nm. Blood was obtained by finger prick for HbA1c determination. HbA1c was determined using HbA1c analyzer (Alere Afinion AS100; Abbott, Chicago, IL, USA).
Statistical analysis
Descriptive statistics were used for descriptive data. Comparison between groups was done using a chi-squared test for categorical variables. Kruskal–Wallis and Mann–Whitney statistics were used to analyze nonparametric data, and ANOVA was used for parametric data. Correlation between two variables was analyzed using Spearman or Pearson test. A P-value of <0.05 was considered statistically significant. All analyses were performed using SPSS version 20 (IBM Corp., Armonk, NY, USA).
Results
The characteristic data included gender, age, body mass index, height, weight, exercise routine, smoking habit, duration of DM, oral antidiabetic use, blood pressure, hypertension, urinary albumin, urinary creatinine, HbA1c, UACR, and eGFR, and are presented in Table 1. There were significant differences in age, HbA1c, albuminuria, and UACR, but not in other characteristics. Regarding the sample groups, there were significant differences in the average age between albuminuria and non-DM group (P<0.001), but not between albuminuria and normoalbuminuria type 2 DM groups. Similar studies also showed significant differences in age between DM patients and non-DM subjects.14 Increased age increases the risk of DM as indicated by the increasing proportion of patients with DM as the age increased. Increase in proportion of DM with increasing age is also due to the increased interference with glucose tolerance.15 HbA1c also showed a significant difference (P<0.001). The average HbA1c levels in non-DM subjects, normoalbuminuria subjects, and albuminuria subjects were 5.53%, 8.28%, and 9.52%, respectively. Based on the average HbA1c levels, it is clear that normoalbuminuria and albuminuria groups have uncontrolled HbA1c levels. It suggests that high levels of HbA1c will increase the risk of diabetic nephropathy.16,17
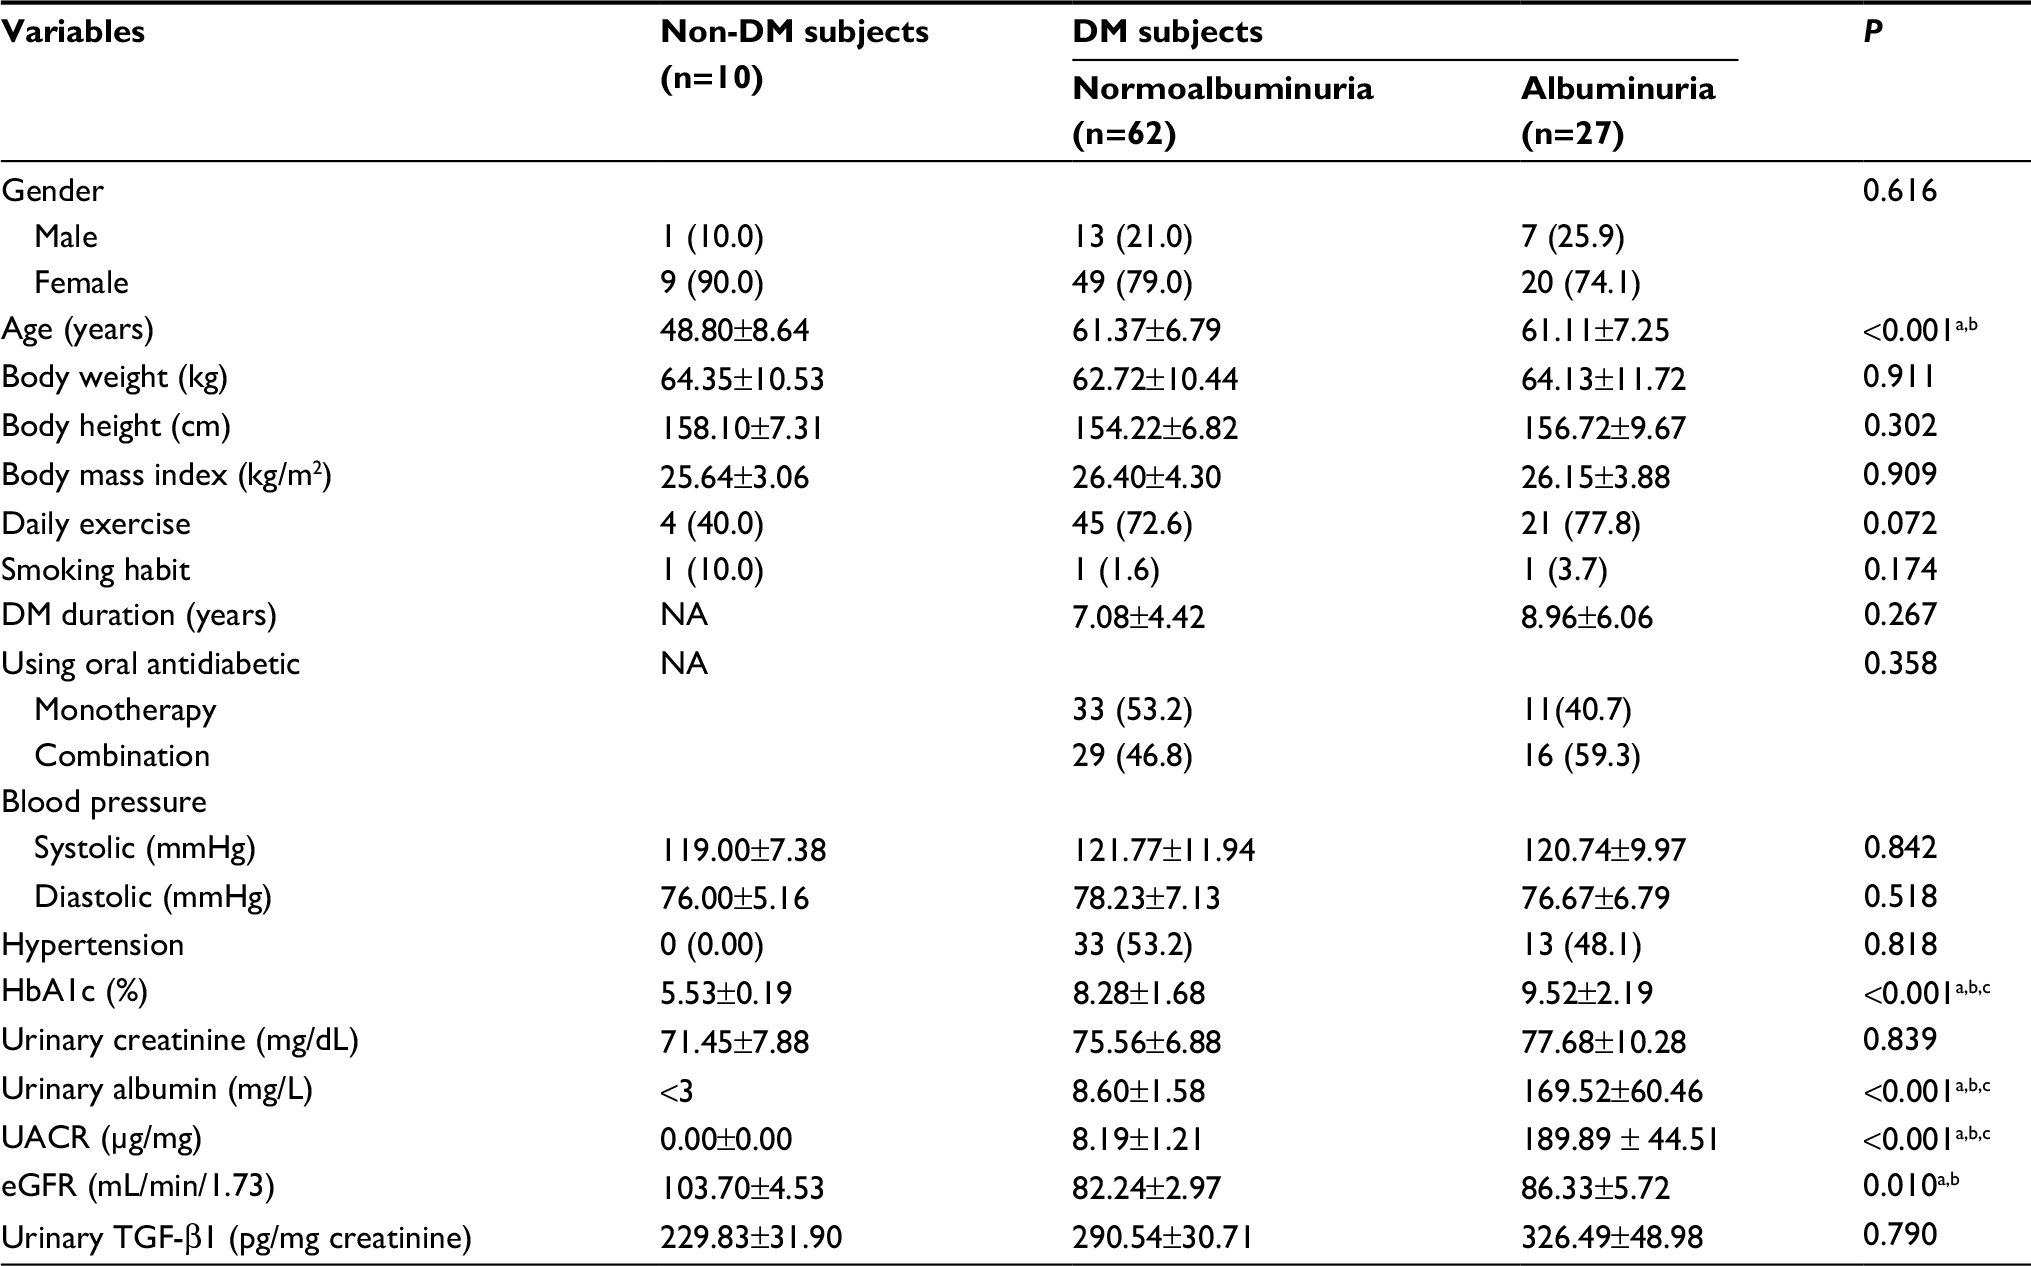 | Table 1 Characteristics of the study subjects Notes: Data expressed as n (%) or mean ± SD/SEM. aSignificant difference between albuminuria and non-DM group. bSignificant difference between normoalbuminuria and non-DM group. cSignificant difference between albuminuria and normoalbuminuria group. Abbreviations: DM, diabetes mellitus; UACR, urine albumin-to-creatinine ratio; eGFR, estimated glomerular filtration rate; NA, not applicable. |
Most of the subjects in this study had normoalbuminuria. The mean UACR differed greatly between normoalbuminuria and albuminuria groups (8.19 and 189.89 µg/mg, respectively). On the other hand, the TGF-β1 concentration was not significantly different (P=0.790) between the three groups. However, the albuminuria group showed the highest TGF-β1 concentration (326.49 pg/mg creatinine), followed by normoalbuminuria group (290.54 pg/mg creatinine), which had a higher average concentration compared to the non-DM group (229.83 pg/mg creatinine).
There was no significant correlation between urinary TGF-β1 and UACR (r=−0.084, P=0.410), and eGFR (r=0.155, P=0.125) (Table 2). This result showed that in patients with albuminuria, there was an increase in concentration of urinary TGF-β1 clinically, but not statistically. However, we found a significant correlation between urinary TGF-β1 and SBP (Table 3).
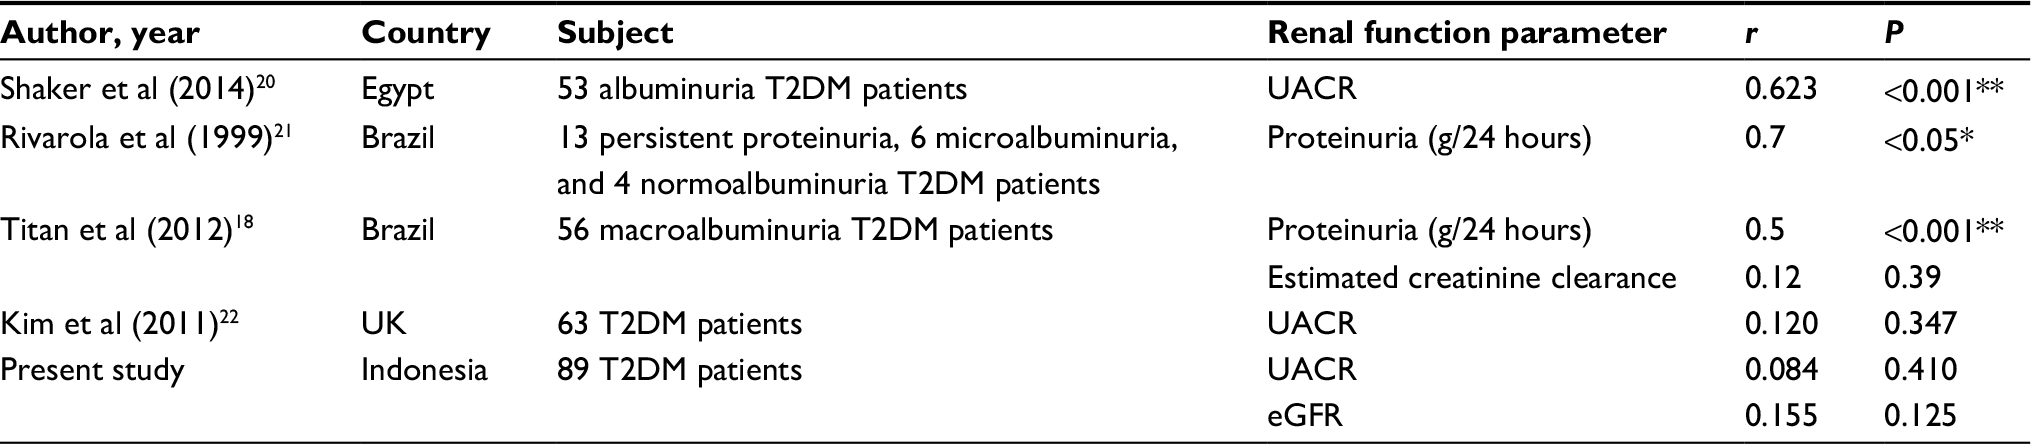 | Table 2 Correlation between urinary TGF-β1 and renal function parameters in this study and the previous studies Abbreviations: T2DM, type 2 diabetes mellitus; UACR, urine albumin-to-creatinine ratio; eGFR, estimated glomerular filtration rate. *P<0.05; **P<0.001. |
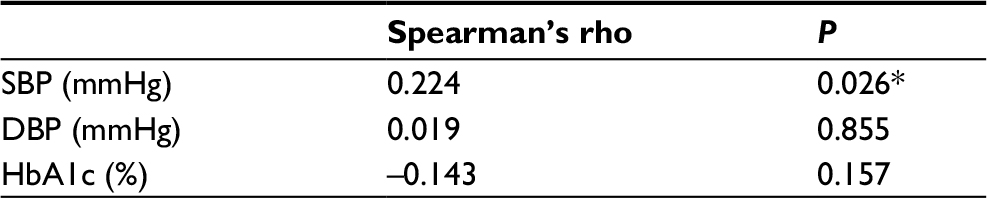 | Table 3 Correlation between urinary TGF-β1 and other parameters in all subjects Note: *P<0.05, significant. |
Table 4 shows the linear regression analysis using a backward method. The analysis showed that urinary TGF-β1 and HbA1c could predict UACR, but only HbA1c could be considered as a significant predictor of UACR.
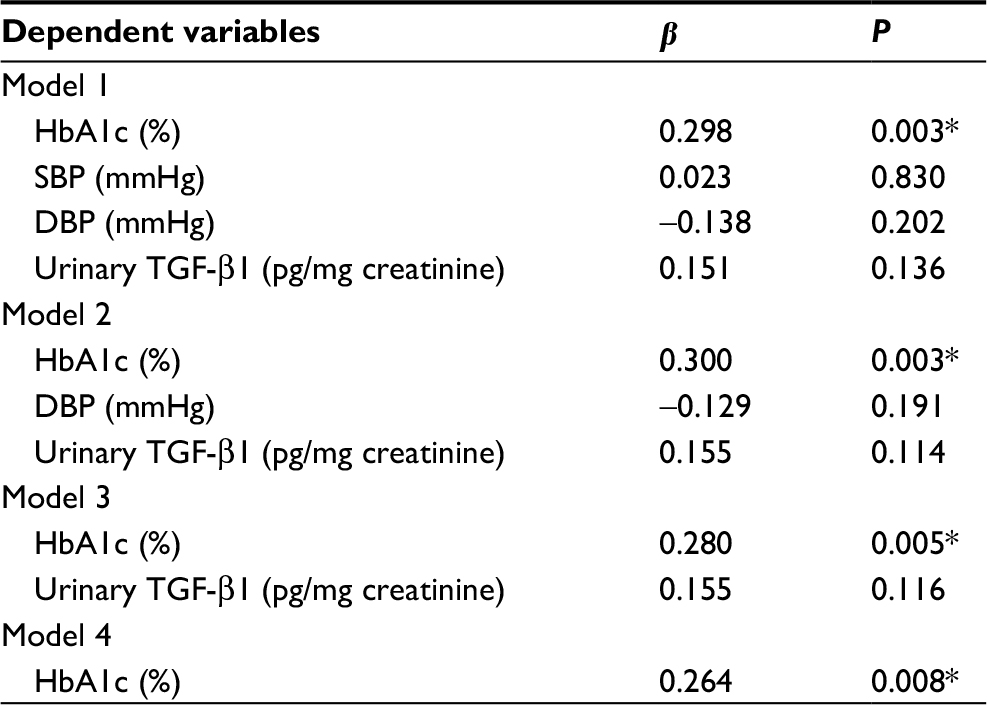 | Table 4 Linear regression analysis of variables predicting UACR in all subjects Note: *P<0.05, significant. Model 1, no adjustment; Model 2, adjusted for SBP; Model 3, adjusted for SBP and DBP; Model 4, adjusted for SBP, DBP, and urinary TGF-B1 |
Discussion
The generation of AGEs through nonenzymatic oxidative reaction of amino acids from proteins occurs in renal tissue and plasma in patients with hyperglycemia, and leads to renal complications in patients with DM.23–25 AGEs also release specific cellular response factors of profibrotic cytokines, such as TGF-β1.26 Studies have suggested that TGF-β1 could be a hallmark to estimate the progression of diabetic renal disease because it stimulates ECM accumulation and promotes renal cell hypertrophy.27 The result of this study showed that there was an increase of TGF-β1 in albuminuria patients when compared to normoalbuminuria and non-DM patients, but the values did not differ statistically, and no correlation was observed between UACR and urinary TGF-β1. This result was also supported by a previous study.22 On the contrary, several studies found positive correlation between UACR and urinary TGF-β1, and also between glucose concentration and HbA1c.20,21,28–30 The increase of urinary TGF-β1 in albuminuria patients was seen during the early stages of diabetic nephropathy, and the increase was more with the development of diabetic nephropathy.31 In this study, we did not found any correlation between urinary TGF-β1 and HbA1c, UACR, and eGFR, but there was a correlation with SBP. However, after multivariate analysis, we found that only HbA1c could be considered as a significant predictor of UACR.
The above results can be due to many other biological factors in the body that can contribute to the increase of TGF-β1. Several studies have shown that TGF-β1 levels are increased in various pathological conditions. One of the conditions is increased blood pressure in the patients, related to the renin–angiotensin system, which can activate TGF-β1.32–35 In this study, the urinary TGF-β1 concentration was correlated with SBP. It is suggested that the absence of correlation between TGF-β1 and UACR and eGFR was because most of the study subjects received antihypertensive medication, especially angiotensin-converting enzyme inhibitors or angiotensin receptor blockers, which can potentially decrease the level of urinary TGF-β1.22 It is reported that consumption of losartan can cause a decrease in urinary TGF-β1 levels of DM patients with diabetic nephropathy.34 Drugs used for cardiovascular disease are also known to reduce TGF-β1 concentration.32,36,37 The oxidative stress together with activation of TGF-β1 has the potential to cause various fibrosis-related diseases.38 The clinical background of subjects revealed a history of cardiovascular diseases, ranging from hyperlipidemia to heart failure, and that some patients were on cardiovascular therapy, such as telmisartan, simvastatin, and isosorbide dinitrate. Additionally, the decreased blood pressure was also suspected to lead to the decrease in urinary TGF-β1 in diabetic nephropathy patients. Although these conditions are commonly observed in the kidneys in a pathological state, TGF-β1 concentration decreases when the blood pressure, especially SBP, decreases.32,39
Conclusion
There was an increase of urinary TGF-β1 concentrations in albuminuria patients clinically, but not statistically. The concentration of TGF-β1 was not correlated with UACR and eGFR, but correlated with SBP. Therefore, urinary TGF-β1 concentration might not be an independent marker for the renal function in DM.
Abbreviations
AGEs, advanced glycation end products
DBP, Diastolic Blood Pressure
DM, diabetes mellitus
ECM, extracellular matrix
eGFR, estimated glomerular filtration rate
ESRD, end-stage renal disease
SBP, Systolic Blood Pressure
TGF B1, Transforming Growth Factor B1
UACR, urine albumin-to-creatinine ratio
Acknowledgments
This study was financially supported by University Excellent Research Grant/Hibah Penelitian Unggulan Perguruan Tinggi (PUPT) Grant from Ministry of Research and Higher Education, Indonesia. The authors would like to express their gratitude to Pasar Minggu Community Health Center and Prodia Clinical Laboratory for their support.
Disclosure
The authors report no conflicts of interest in this work.
References
Mcknight AJ, Duffy S, Maxwell AP, Maxwell AP, Mcknight AJ. Genetics of Diabetic Nephropathy: a Long Road of Discovery. Curr Diab Rep. 2015;15(7):1–11. | ||
. Kidney Disease: Improving Global Outcomes (KDIGO) KDIGO Clinical Practice Guideline for the Evaluation and Management of Chronic Kidney Disease. Kidney inter. 2013;3((Suppl.)(1)):1–150. | ||
Levey AS, Becker C, Inker LA. Glomerular filtration rate and albuminuria for detection and staging of acute and chronic kidney disease in adults: a systematic review. JAMA. 2015;313(8):837–846. | ||
Perkins BA, Ficociello LH, Ostrander BE, et al. Microalbuminuria and the risk for early progressive renal function decline in type 1 diabetes. J Am Soc Nephrol. 2007;18(4):1353–1361. | ||
Macisaac RJ, Jerums G. Diabetic kidney disease with and without albuminuria. Curr Opin Nephrol Hypertens. 2011;20(3):246–257. | ||
Molitch ME, DeFronzo RA, Franz MJ, et al. Nephropathy in diabetes. Diabetes Care. 2004;27 Suppl 1:S79–S83. | ||
Heathcote KL, Wilson MP, Quest DW, Wilson TW. Prevalence and duration of exercise induced albuminuria in healthy people. Clin Invest Med. 2009;32(4):261–E265. | ||
Hogan SL, Vupputuri S, Guo X, et al. Association of cigarette smoking with albuminuria in the United States: the third National Health and Nutrition Examination Survey. Ren Fail. 2007;29(2):133–142. | ||
O-Charoen P, Gangcuangco LMA, Chow DC, Ndhlovu LC, Barbour JD, Shikuma CM. Inflammation and albuminuria in HIV-infected patients receiving combination antiretroviral therapy. Hawaii J Med Public Health. 2014;73:37. | ||
Sharma K. The link between obesity and albuminuria: adiponectin and podocyte dysfunction. Kidney Int. 2009;76(2):145–148. | ||
Campion CG, Sanchez-Ferras O, Batchu SN. Potential role of serum and urinary biomarkers in diagnosis and prognosis of diabetic nephropathy. Can J Kidney Health Dis. 2017;4:2054358117705371. | ||
Lee SY, Choi ME. Urinary biomarkers for early diabetic nephropathy: beyond albuminuria. Pediatr Nephrol. 2015;30(7):1063–1075. | ||
Thomson SE, Mclennan SV, Twigg SM. Growth factors in diabetic complications. Expert Rev Clin Immunol. 2006;2(3):403–418. | ||
Murad MA, Abdulmageed SS, Iftikhar R, Sagga BK. Assessment of the common risk factors associated with type 2 diabetes mellitus in jeddah. Int J Endocrinol. 2014;2014:1–9. | ||
Kemenkes RI. InfoDATIN: Situasi dan Analisis Diabetes. 2014. Available from: http://www.pusdatin.kemkes.go.id/folder/view/01/structure-publikasi-pusdatin-info-datin.html. Accessed October 3, 2017. | ||
Penno G, Solini A, Bonora E, et al. HbA1c Variability As an Independent Correlate of Nephropathy, but Not Retinopathy, in Patients With Type 2 Diabetes. Diab Care. 2013;3:1–10. | ||
Xu F, Zhao LH, Su JB, et al. The relationship between glycemic variability and diabetic peripheral neuropathy in type 2 diabetes with well-controlled HbA1c. Diabetol Metab Syndr. 2014;6(1):139–7. | ||
Titan SM, Vieira JM, Dominguez WV, et al. Urinary MCP-1 and RBP: independent predictors of renal outcome in macroalbuminuric diabetic nephropathy. J Diabetes Complications. 2012;26(6):546–553. | ||
Roestenberg P, van Nieuwenhoven FA, Wieten L, et al. Connective tissue growth factor is increased in plasma of type 1 diabetic patients with nephropathy. Diabetes Care. 2004;27(5):1164–1170. | ||
Shaker YM, Soliman HA, Ezzat E, et al. Serum and urinary transforming growth factor beta 1 as biochemical markers in diabetic nephropathy patients. Beni-Suef Univ J Basic Appl Sci. Elsevier Ltd. 2014;3(1):16–23. | ||
Rivarola EW, Moyses-Neto M, Dantas M, da-Silva CG, Volpini R, Coimbra TM. Transforming growth factor beta activity in urine of patients with type 2 diabetes and diabetic nephropathy. Braz J Med Biol Res. 1999;32(12):1525–1528. | ||
Kim MJ, Frankel AH, Donaldson M, et al. Oral cholecalciferol decreases albuminuria and urinary TGF-β1 in patients with type 2 diabetic nephropathy on established renin–angiotensin–aldosterone system inhibition. Kidney Int. 2011;80(8):851–860. | ||
Bucala R, Vlassara H. Advanced glycosylation end products in diabetic renal and vascular disease. Am J Kidney Dis. 1995;26(6):875–888. | ||
Daroux M, Prévost G, Maillard-Lefebvre H, et al. Advanced glycation end-products: implications for diabetic and non-diabetic nephropathies. Diabetes Metab. 2010;36(1):1–10. | ||
Weiss MF, Erhard P, Kader-Attia FA, et al. Mechanisms for the formation of glycoxidation products in end-stage renal disease. Kidney Int. 2000;57(6):2571–2585. | ||
Bohlender JM, Franke S, Stein G, Wolf G. Advanced glycation end products and the kidney. Am J Physiol Renal Physiol. 2005;289(4): F645–F659. | ||
Castro NE, Kato M, Park JT, Natarajan R. Transforming growth factor β1 (TGF-β1) enhances expression of profibrotic genes through a novel signaling cascade and microRNAs in renal mesangial cells. J Biol Chem. 2014;289(42):29001–29013. | ||
Hellmich B, Schellner M, Schatz H, Pfeiffer A. Activation of transforming growth factor-beta1 in diabetic kidney disease. Metabolism. 2000;49(3):353–359. | ||
Hefini S, Kamel A, El-Banawy H, Refai W, Khalil G. The role of BMP-7 and TGF-ß1 in diabetic nephropathy. J Med Res Inst. 2007;28:235–243. | ||
El Mesallamy HO, Ahmed HH, Bassyouni AA, Ahmed AS, Ahmed ME. Clinical significance of inflammatory and fibrogenic cytokines in diabetic nephropathy. Clin Biochem. 2012;45(9):646–650. | ||
Yaqiu J, Guoliang L, Wei K. Serum level of transforming growth factor-β and its meaning in diabetic nephropathy. J China Med Univ. 2001;30:125–132. | ||
Bertoluci MC, Uebel D, Schmidt A, et al. Urinary TGF-beta1 reduction related to a decrease of systolic blood pressure in patients with type 2 diabetes and clinical diabetic nephropathy. Diabetes Res Clin Pract. 2006;72(3):258–264. | ||
Conserva F, Pontrelli P, Accetturo M, Gesualdo L. The pathogenesis of diabetic nephropathy: focus on microRNAs and proteomics. J Nephrol. 2013;26(5):811–820. | ||
Houlihan CA, Akdeniz A, Tsalamandris C, Cooper ME, Jerums G, Gilbert RE. Urinary transforming growth factor-beta excretion in patients with hypertension, type 2 diabetes, and elevated albumin excretion rate: effects of angiotensin receptor blockade and sodium restriction. Diabetes Care. 2002;25(6):1072–1077. | ||
Kanwar YS, Sun L, Xie P, Liu FY, Chen S. A glimpse of various pathogenetic mechanisms of diabetic nephropathy. Annu Rev Pathol. 2011;6:395–423. | ||
Guimarães DA, Rizzi E, Ceron CS, et al. Atorvastatin and sildenafil decrease vascular TGF-β levels and MMP-2 activity and ameliorate arterial remodeling in a model of renovascular hypertension. Redox Biol ; . 2015;6:386–395[Internet]. Elsevier. | ||
Jugdutt BI, Khan MI, Jugdutt SJ, Blinston GE. Combined captopril and isosorbide dinitrate during healing after myocardial infarction. Effect on ventricular remodeling, function, mass and collagen. J Am Coll Cardiol. 1995;25(5):1089-96. | ||
Richter K, Konzack A, Pihlajaniemi T, Heljasvaara R, Kietzmann T. Redox-fibrosis: Impact of TGFβ1 on ROS generators, mediators and functional consequences. Redox Biol. 2015;6:344–352. | ||
González-Albarrán O, Gómez O, Ruiz E, Vieitez P, García-Robles R. Role of systolic blood pressureon the progression of kidney damage in an experimental model of type 2 diabetes mellitus, obesity, and hypertension (Zucker rats. Am J Hypertens. 2003;16(11 Pt 1):979–985. |
 © 2018 The Author(s). This work is published and licensed by Dove Medical Press Limited. The
full terms of this license are available at https://www.dovepress.com/terms
and incorporate the Creative Commons Attribution
- Non Commercial (unported, 3.0) License.
By accessing the work you hereby accept the Terms. Non-commercial uses of the work are permitted
without any further permission from Dove Medical Press Limited, provided the work is properly
attributed. For permission for commercial use of this work, please see paragraphs 4.2 and 5 of our Terms.
© 2018 The Author(s). This work is published and licensed by Dove Medical Press Limited. The
full terms of this license are available at https://www.dovepress.com/terms
and incorporate the Creative Commons Attribution
- Non Commercial (unported, 3.0) License.
By accessing the work you hereby accept the Terms. Non-commercial uses of the work are permitted
without any further permission from Dove Medical Press Limited, provided the work is properly
attributed. For permission for commercial use of this work, please see paragraphs 4.2 and 5 of our Terms.