Back to Journals » Diabetes, Metabolic Syndrome and Obesity » Volume 12
Upregulation Of Renal GLUT2 And SGLT2 Is Involved In High-Fat Diet-Induced Gestational Diabetes In Mice
Authors Jiang YK, Xin KY, Ge HW, Kong FJ, Zhao G
Received 30 June 2019
Accepted for publication 13 September 2019
Published 14 October 2019 Volume 2019:12 Pages 2095—2105
DOI https://doi.org/10.2147/DMSO.S221396
Checked for plagiarism Yes
Review by Single anonymous peer review
Peer reviewer comments 3
Editor who approved publication: Professor Ming-Hui Zou
Yong-Kuan Jiang,1,* Kai-Yue Xin,2,3,* Hong-Wei Ge,4 Fei-Juan Kong,5,6 Gang Zhao2,7
1Department of Anesthesiology, Ningbo No.6 Hospital, Ningbo, Zhejiang, People’s Republic of China; 2Department of Cardiology, Shanghai Institute of Cardiovascular Diseases, Zhongshan Hospital, Fudan University, Shanghai, People’s Republic of China; 3Department of Cardiology, Cheeloo College of Medicine, Shandong University, Jinan, Shandong, People’s Republic of China; 4Department of Urology, Affiliated Hangzhou First People’s Hospital, Zhejiang University School of Medicine, Hangzhou, People’s Republic of China; 5Department of Endocrinology and Metabolism, Shanghai General Hospital, Shanghai Jiao Tong University School of Medicine, Shanghai, People’s Republic of China; 6Department of Endocrinology and Metabolism, Xuhui District Central Hospital of Shanghai, Shanghai, People’s Republic of China; 7Department of Cardiology, Kashgar Prefecture Second People’s Hospital, Kashi, Xinjiang, People’s Republic of China
*These authors contributed equally to this work
Correspondence: Fei-Juan Kong
Department of Endocrinology and Metabolism, Shanghai General Hospital, Shanghai Jiao Tong University School of Medicine, No. 100 Haining Road, Hongkou District, Shanghai 200080, People’s Republic of China
Tel +86-21-63240090
Fax +86-21-63240090
Email [email protected]
Gang Zhao
Department of Cardiology, Shanghai Institute of Cardiovascular Diseases, Zhongshan Hospital, Fudan University, No. 180 Fenglin Road, Xuhui District, Shanghai 200032, People’s Republic of China
Tel +86-21-64041990 ext. 2745
Fax +86-21-64223006
Email [email protected]
Introduction: Gestational diabetes mellitus (GDM) is a metabolic disorder during mid- to late-pregnancy characterized by hyperglycemia, insulin resistance and fetal mal-development. Glucose transporter type 2 (GLUT2) and sodium-coupled glucose cotransporters 2 (SGLT2) in the proximal tubules play a critical role in the reabsorption of glucose and have been linked to the occurrence of type 2 diabetes mellitus (T2DM). Our study was designed to investigate the role of GLUT2 and SGLT2 in the pathogenesis of GDM, which is considered a forerunner of T2DM, and investigate the related molecular mechanism.
Methods: High-fat diet (HFD) was utilized to build a GDM mouse model that closely induces metabolic abnormalities similar to human GDM. Body weight, blood glucose and serum insulin were recorded in the experimental process. Glucose tolerance was determined by the use of an intraperitoneal glucose tolerance test (IPGTT). In addition, levels of GLUT2 and SGLT2 were evaluated to further explore the underlying mechanism of GDM.
Results: HFD feeding induced abnormal glucose metabolism as manifested by increased levels of blood glucose and insulin and prominent glucose intolerance. Additionally, fetal mice from mother feed on HFD showed higher mean body weight. Furthermore, HFD feeding led to an increase in the number of positive cells of GLUT2 and SGLT2 in the renal proximal tubule and the expressions of renal GLUT2 and SGLT2 mRNA and proteins in mice. However, no obvious change was observed in renal morphology.
Conclusion: Our study demonstrates a potential involvement of renal GLUT2 and SGLT2 in GDM pathology in an HFD-induced GDM mouse model, which further supports the role of renal GLUT2 and SGLT2 not only in T1DM and T2DM but also in GDM.
Keywords: gestational diabetes mellitus, insulin resistance, renal threshold for glucose, GLUT2, SGLT2
Introduction
Gestational diabetes mellitus (GDM) is defined as abnormal glucose metabolism that is first discovered or diagnosed during pregnancy.1 As most patients with GDM usually do not show obvious clinical manifestations, GDM screening has become a routine prenatal examination using a glucose tolerance test (OGTT) during the second trimester of pregnancy. It has been reported that GDM affects 5% to 10% of pregnant women depending on different screening methods, diagnostic criteria and the population screened over the past decades.2,3 GDM is not only associated with higher risk of maternal postpartum type 2 diabetes mellitus (T2DM) but also related to an increased frequency of potential adverse outcomes and long-term metabolic dysregulation in offspring.4–7 However, related pathological mechanisms underlying GDM are still not understood.
Similar to T2DM, previous reports have suggested that the main pathophysiologic mechanisms behind GDM are primarily β-cell dysfunction and insulin resistance.8 While recent studies report that women with GDM may suffer dysfunction of physiological decline in the renal threshold for glucose (RTG) during pregnancy.9 RTG is defined as the point of glucose concentration in the blood at which the kidney will excrete glucose (see glycosuria), which is normally stable within a certain range10 and may change in some cases, such as T1DM and T2DM.11,12 The kidney is critical to the balance of glucose homeostasis through filtration and reabsorption of glucose. Normally, the kidneys filter approximately 180g of glucose per day, all of which is reabsorbed into the circulation through glucose transporter proteins in cell membranes within the proximal tubules. Glucose carrier proteins mainly involve 2 major classes: the glucose transporters (GLUTs) and the sodium-coupled glucose cotransporters (SGLTs).13,14 Of the various GLUT and SGLT proteins in the kidneys, GLUT2 and SGLT2 are considered to be more crucial in the glucose regulation. SGLT2 is responsible for reabsorbing approximately 90% of the glucose filtered at the glomerulus in the proximal tubular cells, and GLUT2 promotes reabsorption glucose back into circulation.15 The role of the kidney in glucose control has been increasingly recognized, due to its involvement in the occurrence of T2DM and its complications. Most prior evidence has mainly concentrated on the role of GLUT2 and SGLT2 in T2DM.13,16 Recently, it is suggested that upregulation of renal SGLT2 may be associated with GDM.9
Stable and mature animal model of GDM is the basis of exploring the pathophysiologic aspects of human GDM. Previous studies have reported several animal models available to study GDM, including induced, spontaneous and transgenic animal models.17,18 Spontaneous and transgenic animal models commendably develop hyperglycemia, which is close to human GDM.19 While the method is not widely used in research due to expensive animal cost, limited species and individual differences. Streptozotocin (STZ) induces a high or moderate hyperglycemia by the destruction of pancreatic β-cells depending on different dose, which is commonly used in animal study in the past.20 However, it is difficult to control the dose of STZ during the molding process to induce an expected blood glucose level. In recent years, increasing evidence suggests the availability of high-fat diet (HFD) in the establishment of GDM animal model.21 The model is prevalent due to its convenience and similarity to GDM in human.
The present study establishes a mouse model of GDM using HFD and explores the role of renal GLUT2 and SGLT2 in the development of GDM.
Materials And Methods
Animals And Study Design
All experimental procedures involving animals were in accordance with the NIH guidelines for the Care and Use of Laboratory Animals, and the study protocols were approved by Animal Care and Use Committee of Shanghai Jiao Tong University.
Female clean healthy C57BL/6 mice aged 6 weeks and weighing 16–18 g were employed for the present study. The animals were housed in a controlled environment (21 ± 2°C, 50 ± 10% humidity, 12 hrs light/dark cycle) with food and water available ad libitum. After adaptive feeding for 1 week, female mice were randomly divided into two experimental groups (n = 30 per group): control or HFD group. Mice consumed control rodent diet (10% kcal fat; Research Diets, New Brunswick, NJ) or HFD (45% kcal fat; Research Diets, New Brunswick, NJ) (Table 1). After 6-week dietary intervention, mice in control group were divided into two subgroups (n = 15): control virgin group (CV) and control pregnant group (CP), and mice in HFD group were divided into HFD virgin group (HV) and HFD pregnant group (HP) (n = 15). Female mice in CP and HP groups were mated with males of the same genotype in a ratio of 1:2. The next morning, female rats were observed for the presence or absence of vaginal suppositories, which were taken with a cotton swab and observed further under the microscope. If sperms were found in three different fields, the female rate was marked as positive for pregnancy, and the date was marked as gestation day (GD) 0. The mating procedure lasted for 1 week which comprised approximately one estrous cycle. Non-pregnant female mice in this period were considered infertile and excluded from the study. Fortunately, all 30 female rates were found pregnant. Then, the mice in HV and HP groups continued feeding HFD until GD 18.
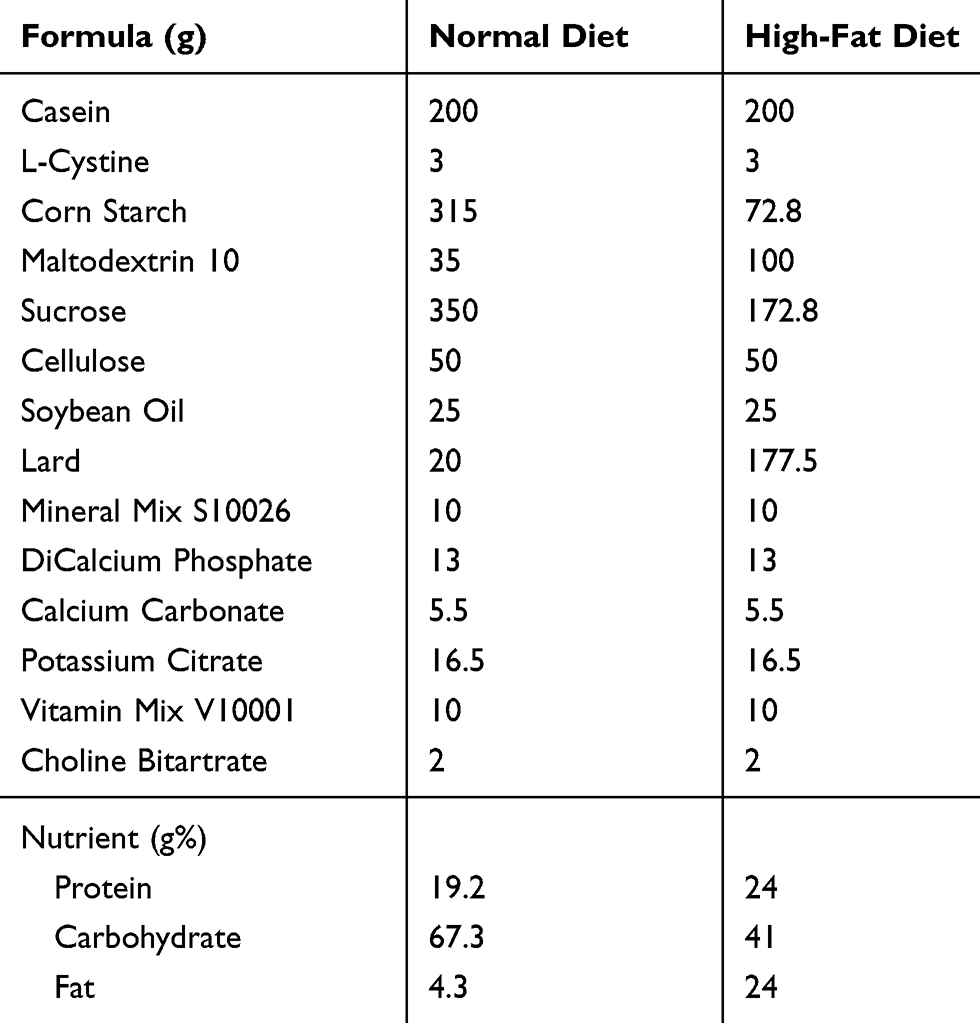 |
Table 1 Formula And Nutrient Of Normal And High-Fat Diets |
Measurement Of Body Weight, Blood Glucose, And Serum Insulin
Body weight, blood glucose, and serum insulin were monitored at different time points, including before dietary intervention, after 6 weeks of HFD, and on GD 0, 10, and 18. Blood glucose and insulin levels were determined from tail venipuncture blood samples. Blood glucose concentration was measured immediately using a blood glucose meter and strips (OneTouch Ultra; Johnson & Johnson, Langhorne, PA). The blood samples were then centrifuged at low speed (4°C, 5000 rpm, 15 mins) within 1 hr; the supernatant was harvested and stored at −80°C for measuring serum insulin level by enzym-linked immunosorbent assay (ELISA; Mercodia AB, Uppsala, Sweden) according to the manufacturer’s instructions. In addition, urine volume and fluid intake were observed daily.
Glucose Tolerance Test
Glucose tolerance was determined by an intraperitoneal glucose tolerance test (IPGTT). Mice were fasted for 12 hrs with free access to water and intraperitoneally injected with glucose (1.5 g/kg body weight). Blood samples were collected from the tail vein at 0, 15, 30, 60 and 120 mins after glucose administration. Blood glucose and insulin levels were measured instantly using methods as mentioned above. Meanwhile, area under the curve (AUC) of blood glucose and insulin was calculated.
Hematoxylin And Eosin (HE) Staining
On GD 18, all of the mice were anesthetized by intraperitoneal injection of overdose Nembutal and sacrificed. We chose GD 18 as the time point because the general gestation period of mice is 17–19 days.17,22 Then cesarean section was performed, and the number and weights of fetuses in CP and HP groups were recorded. In each group, 7 out of 15 mice were sacrificed to obtain the kidney for HE staining or immunohistochemistry examination, while the rest were subjected to mRNA or protein analysis. The protocol was described as previously.23 Morphologic changes of glomeruli and renal tubules were observed under light microscopy (BX50, Olympus Corporation, Tokyo, Japan).
Immunohistochemistry Analysis
Bouin-fixed kidney from each group was processed, paraffin embedded, and sectioned at 5 μm for GLUT2 and SGLT2 immunohistochemistry. Sections were dewaxed in xylene and hydrated using a graded series of ethanol. Antigenic retrieval was performed by immersing mounted tissue sections in 0.01 mM sodium citrate buffer (pH 6.0) and heating in an autoclave (121°C) for 5 mins. Deparaffinized sections were blocked for 1 hr in normal goat serum, followed by incubation in rabbit anti-GLUT2 and -SGLT2 polyclonal antibodies (1:100; Santa Cruz Biotechnology, Santa Cruz, CA, USA) overnight in a humidified chamber at 4°C. Subsequently, the tissue slides were incubated with peroxidase-conjugated secondary antibody (Vector Laboratories, Burlingame, CA, USA) at room temperature for 30 mins and visualised by incubation with a 3,3′-diaminobenzidine tetrahydrochloride (DAB; Vector Laboratories, Burlingame, CA, USA) at room temperature for 5 mins. The sections were then counterstained with hematoxylin (Merck KGaA, Darmstadt, Germany) and observed by light microscopy (BX50, Olympus Corporation, Tokyo, Japan).
Western Blot Analysis
Kidney tissues were harvested and were homogenized on ice in the presence of protease and phosphatase inhibitors. Homogenates were centrifuged at 12,000 × g at 4°C for 15 mins. Protein concentration in supernatants was quantified by the BCA method using bovine serum albumin (BSA) as the standard. Proteins were analyzed by 10% SDS-PAGE and transferred to PVDF membranes that were incubated in 5% non-fat milk at room temperature for 1 hr, then incubated with appropriate primary and secondary antibodies. Membranes were washed and proteins were detected by enhanced chemiluminescence (ECL) using a LAS-4000 lumino-image analyzer (Fuji Film, Tokyo, Japan). Bands were digitally scanned and analyzed using ImageJ software (NIH Image, National Institutes of Health, Bethesda, MD, USA).
Real-Time Quantitative Polymerase Chain Reaction
Total RNA was extracted from the kidney using TRIzol® Reagent (Invitrogen, Carlsbad, CA, USA). cDNA was synthesized from 1 μg of RNA using the PrimeScript™ RT Reagent Kit (Takara Biotechnology Co., Ltd., Dalian, China) according to the manufacturer’s instructions. Amplification was performed on a 7500 Real-Time PCR System (Applied Biosystems, Foster City, CA, USA) using SYBR® Premix Ex Taq™ (Takara Biotechnology Co.) according to the manufacturer’s instructions. Primers used for quantitative PCR were shown as follows:
GLUT2 (forward: GGAGCCTCCAGTAAGAAGTCTG 5′-3′, reverse: TGGCAGGTAGAATTAGTCTCAGG 5′-3′); SGLT2 (forward: TTTTGGTGGTTGTGCTGG 5′-3′, reverse: CTCGGAAGATGTGGAAGG 5′-3′); Glyceraldehyde 3-phosphate dehydrogenase (GAPDH) (forward: CCCTCTGGAAAGCTGTGG 5′-3′, reverse: AGTGGATGCAGGGATGATG 5′-3′). Relative changes in gene expression were determined using the 2−ΔΔct method, with the housekeeping gene GAPDH as an internal control.
Statistical Analysis
All data were calculated as means ± SD and checked using the Kolmogorov–Smirnov (KS) test before further analysis. Statistical significance between two datasets was assessed using the Student’s t-test. Multiple groups were compared using one-way ANOVA followed by Tukey multiple comparison testing. A P value of <0.05 was considered statistically significant. All statistical tests were performed using GraphPad Prism Version 6.0 (GraphPad Prism Software, Inc. CA, USA).
Results
Changes Of Body Weight, Blood Glucose, And Serum Insulin In Mice
Body weight was determined at different time points for all groups. As indicated in Figure 1A, the body weight showed an increasing trend after 6 weeks of HFD, and a rapid elevation of body weight was found in the mice of HP group compared to the moderate increase in CP group (P <0.05). The weight at GD 18 and total weight gain of mice in HV and HP groups were significantly higher than that of CV and CP groups (P <0.05, Figure 1B). Next, we examined the blood glucose and serum insulin in these mice. Blood glucose levels exhibited a gradual upregulation at the end of 6-week HFD feeding and during pregnancy in the mice of HV and HP groups but not CV or CP group (P <0.05, Figure 1C). Similar to the trend of blood glucose change, serum insulin levels were enhanced at the end of HFD feeding in HV and HP groups and continued to elevate throughout pregnancy (P <0.05, Figure 1E). Moreover, blood glucose and serum insulin at GD 18 were significantly advanced in HV mice in contrast to the CV mice (P <0.05, Figure 1D and F). Interestingly, blood glucose levels were deregulated at the end of pregnancy in CP mice but further increased in HP mice (P <0.05, Figure 1D), whereas insulin levels were increased in both CP and HP mice and showed a more pronounced enhancement in the mice of HP group (P <0.05, Figure 1F). In addition, the urine volume and fluid intake were increased significantly during mid- to late-pregnancy in HP mice compared to CP mice. However, there was no significant change in the mice of CV or HV group.
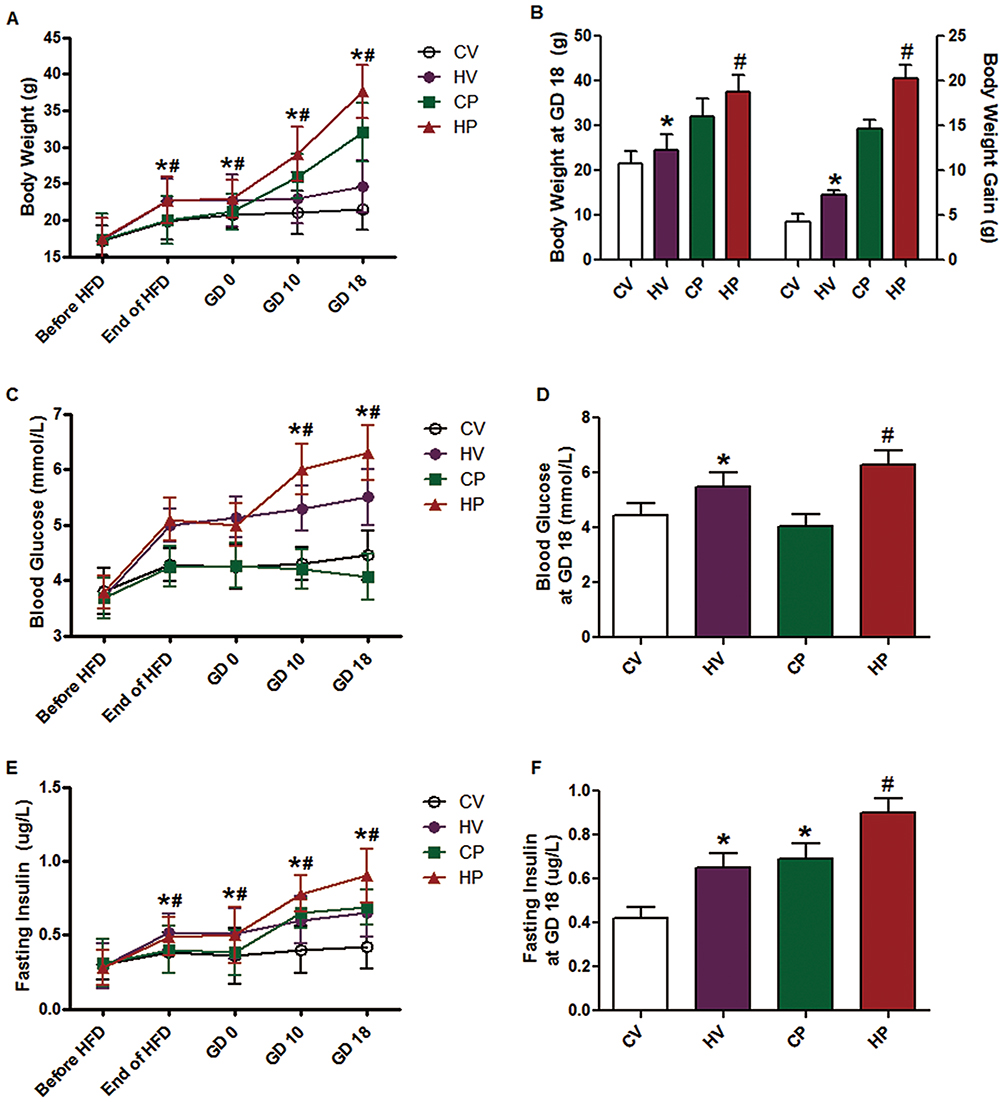 |
Figure 1 Changes of body weight (A, B), blood glucose (C, D), and serum insulin (E, F) in mice of different groups before dietary intervention, after 6 weeks of HFD, and on GD 0, 10, and 18. Data are expressed as the mean ± SD values (n = 15). *P <0.05 vs CV group, #P <0.05 vs CP group. |
Glucose Tolerance Test In Mice
By performing a glucose tolerance test at the end of HFD feeding, we found that blood glucose and insulin levels of mice in HV and HP groups indicated a slight increase without statistically significant differences, suggesting HFD for 6 weeks did not cause dramatical changes in either glucose or insulin levels (Figure 2A and B). Then, we conducted the same test at GD 18. As shown in Figure 2C, compared with CP group, the mice in HP group showed impaired glucose tolerance, as manifested by obviously increased glucose levels after glucose injection (P <0.05, 15 and 30 mins). Consistently, insulin levels of HP group mice were also dramatically higher than that of CP throughout the test (P <0.05, Figure 2D). These results suggested successful establishment of a mouse model of GDM. However, no significant upregulation was observed in the glucose or insulin levels in HV mice compared with CV mice.
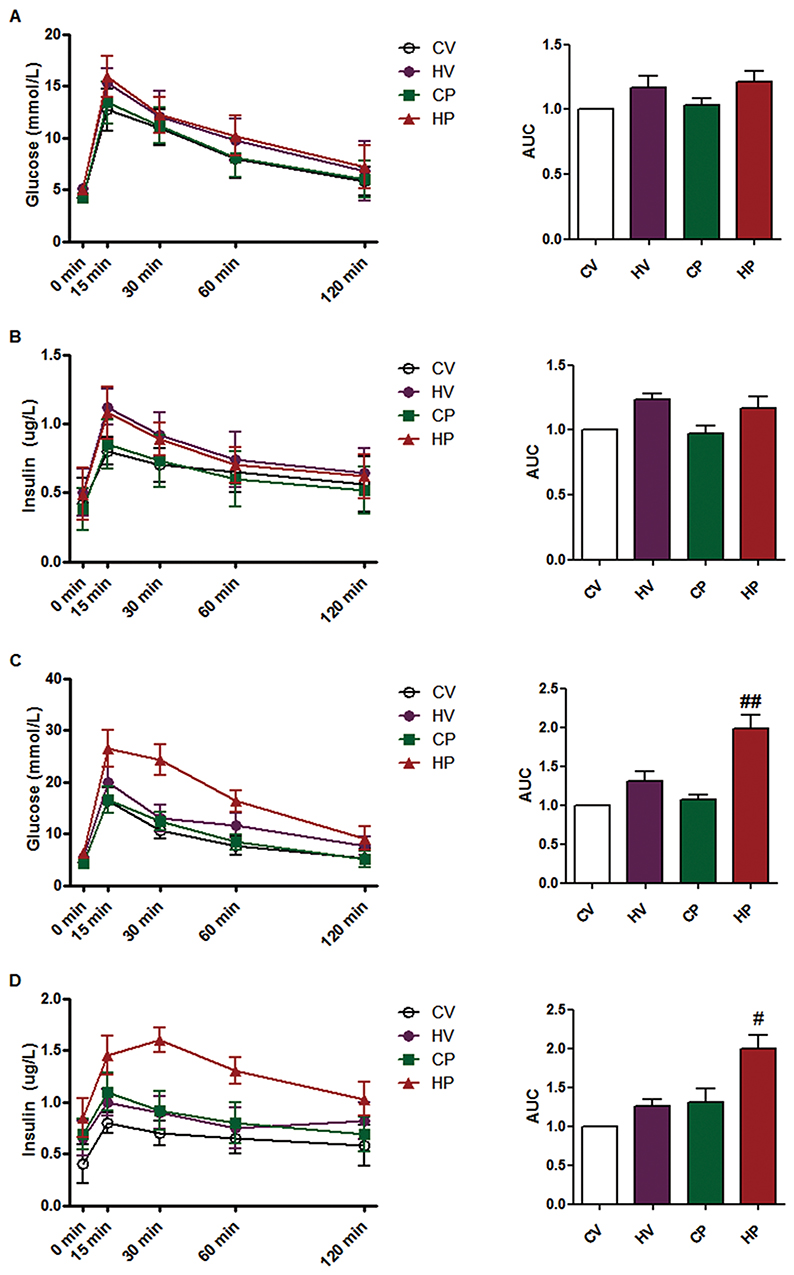 |
Figure 2 Glucose tolerance test. Blood glucose (A) and serum insulin levels (B) during intraperitoneal glucose tolerance test in the four groups after 6 weeks of HFD. Blood glucose (C) and serum insulin levels (D) during intraperitoneal glucose tolerance test in the four groups on GD 18. Area under the curve (AUC) of blood glucose and serum insulin was calculated. Data are expressed as the mean ± SD values (n = 15). #P <0.05, ##P <0.01 vs CP group. |
Reproductive Outcome Of Pregnant Mice
The number of fetal mice was counted for each female from CP and HP groups. However, there was no significant differences in average little size between CP and HP groups (Figure 3A). Moreover, we determined the body weight of fetal mice and found that mean body weight of fetal mice born by HP mothers was significantly higher than those by CP mothers (P <0.05, Figure 3B).
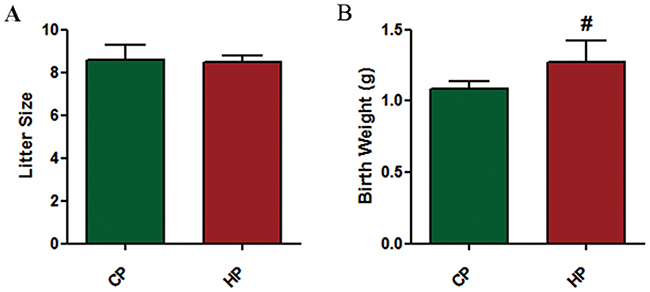 |
Figure 3 Reproductive outcome of pregnant mice. Litter size (A) and body weight at birth (B) of fetal mice by each female mouse from CP and HP experimental groups were recorded. Data are expressed as the mean ± SD values (n = 15). #P <0.05 vs CP group. |
Changes Of Renal Morphology In Mice
Representative graphs of renal morphology of the four groups are shown in Figure 4. It revealed that glomeruli of the mice in the CV group were normal with clear Bowman capsule and normal thickness of the glomerular basement membrane. The mesangial matrix, mesangial cells and endothelial cells showed no significant proliferation. Renal tubular epithelial cells displayed mild swelling, and renal interstitial vascular showed mild congestion with no obvious inflammatory cell infiltration. Renal morphology in the other three groups did not demonstrate significant changes compared with CV group.
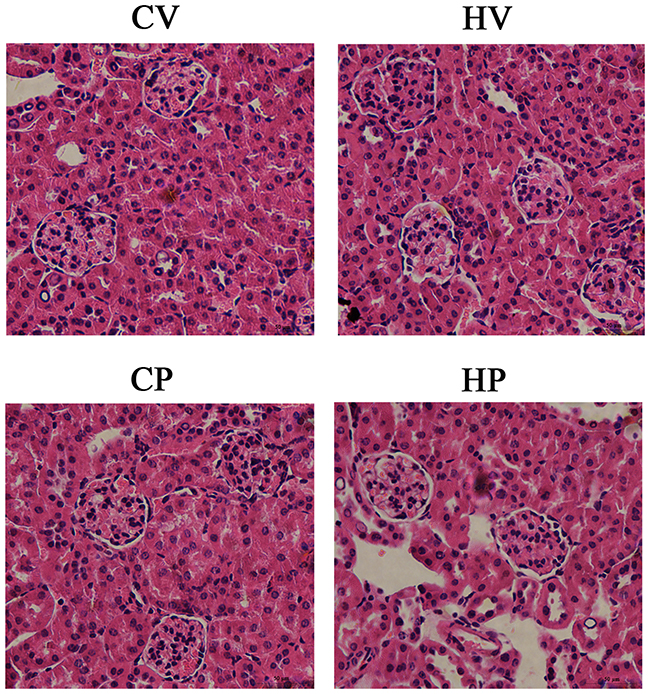 |
Figure 4 Changes of renal morphology. The kidney was stained with HE for morphologic analysis under light microscopy. Morphologic changes of glomeruli and renal tubules were observed under a high magnification field (× 400). |
Changes Of Immunohistochemical Staining And Protein Expression Of Renal GLUT2 And SGLT2 In Mice
We speculate the reason for increased blood glucose in HV and HP mice could be attributed to elevated expression of renal GLUT2 and SGLT2. Therefore, we sacrificed the mice at GD 18 and harvested their kidneys to detect the expression changes of GLUT2 and SGLT2 by immunohistochemistry, RT-qPCR and Western blot analysis. The positive staining of GLUT2 and SGLT2 is mainly located in the renal proximal tubule. As expected, positive cells of GLUT2 and SGLT2 were increased in the renal proximal tubule of HV and HP mice compared with CV and CP mice (Figure 5A). Consistent with the trend of immunohistochemical staining, the results also demonstrated significantly higher expressions of SGLT2 and SGLT2 mRNA and protein in mice of HV and HP groups than that of CV and CP groups (P <0.05, Figure 5B and C).
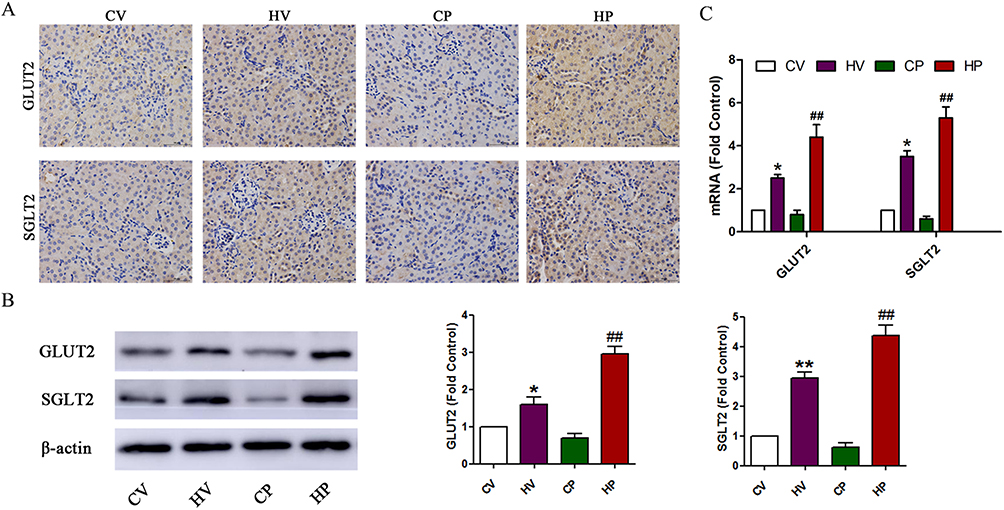 |
Figure 5 Changes of renal GLUT2 and SGLT2 levels. (A) Immunohistochemical staining of renal GLUT2 and SGLT2. Coronal kidney sections were stained with GLUT2 and SGLT2 antibodies and observed under a high magnification field (× 400). (B) Representative immunoblot and quantification of GLUT2 and SGLT2 in the kidney of mice from the four groups. (C) mRNA expression levels of GLUT2 and SGLT2 in the kidney of mice from the four groups. Data are expressed as the mean ± SD values (n = 15). *P <0.05, **P <0.01 vs CV group, ##P <0.01 vs CP group. |
Discussion
In the present study, we determined the role of renal GLUT2 and SGLT2 in the pathophysiologic mechanisms of GDM through employing an HFD-induced GDM mouse model. The outcome of this study showed that HFD feeding before and during pregnancy in mice may lead to physiological and pathological performances close to human GDM. HFD intervention increased body weight and induced abnormal glucose metabolism as manifested by increased blood glucose and serum insulin and prominent glucose intolerance in mice, leading to various acute or long-term adverse consequences in offspring. Moreover, HFD upregulated levels of renal GLUT2 and SGLT2, which demonstrates the potential role of GLUT2 and SGLT2 in the pathogenesis of GDM in mice.
GDM is defined as any degree of glucose intolerance with onset or first recognition during pregnancy.1 In the second and third trimester, due to the physiological insulin resistance, maternal insulin secretion is elevated to maintain blood glucose levels. Impairment of pancreatic β-cell function or compensatory increases of insulin secretion or both leads to GDM.4 Given the prevalence of GDM, a growing body of research has carried out to investigate the physiological and pathological mechanisms of GDM both in animal and human.9,24–28 However, due to the specificity of pregnancy, it is difficult to carry out some invasive research, limiting further understanding of GDM. Therefore, an ideal GDM animal model will undoubtedly provide a good research foundation and platform for further study of etiology, pathogenesis and effective prevention and treatment of GDM.
In recent years, much evidence has been accumulated to indicate that dietary factors play a critical role in the pathogenesis of GDM.29–31 As part of a classical western lifestyle, HFD has been indicated to be closely connected with glucose disturbance and insulin resistance, which subsequently leads to T2DM.32 And HFD-induced GDM animal model is more consistent with the clinical features of diabetes, which replicates the pathogenesis of diabetes by changing diet structure to increase insulin secretion, reduce insulin sensitivity, and ultimately result in insulin resistance.4 Accordingly, in the current study, we employed HFD intervention in an effort to develop an ideal GDM model in mice. Moreover, NV and HV groups were established to exclude the influences of placental secretion of various hormones and enzymes in pregnancy and further demonstrate HFD-induced insulin resistance in pregnancy.
Obesity and overweight take the top spot in the various risk factors for the development of diabetes, and weight gain during pregnancy increases the incidence of T2DM in pregnant women.33 Consistently, our results indeed confirmed that HP mice exhibited dramatically elevated weight gain compared to CP mice. Along with the increase of body weight, blood glucose and insulin showed a corresponding elevation, especially in mid- and late-pregnancy, during which GDM usually occurs. Meanwhile, we found that HFD feeding for 6 weeks did not cause significant insulin resistance, although it induced an increase in body weight and serum insulin. However, insulin resistance was evident during late pregnancy as indicated by prominent glucose intolerance. Increased insulin resistance, the so-called physiological insulin resistance, is common during pregnancy to maintain the glucose for the fetus, resulting in elevated insulin levels.4 Elevated levels of various pregnancy-related hormones may account for this phenomenon.8,34 However, failure to upregulate insulin production to overcome the further aggravated degree of insulin resistance leads to hyperglycemia or finally GDM during pregnancy.35 Our results demonstrated that HFD feeding contributed to pathologic performances in mice close to the human condition of GDM.
Insulin resistance induced by hormonal and adipokine secretion from the placenta contributes to the development of GDM.8 Exploration of potential pathophysiological mechanisms and new therapeutic targets is of great importance to the prevention and treatment GDM. Recent study suggested that impairment in the decrease of the RTG may have a place in the development of GDM.9 RTG is dependent on the renal glucose reabsorptive capacity, which is associated with GLUTs and SGLTs in the proximal tubules. Emerging evidence suggests that expression of GLUT2 or SGLT2 or both was increased in hyperglycemic rodents and humans,13,14,16 which may lead to increased reabsorption of renal glucose in patients with TIDM and T2DM.11,36 On the contrary, RTG has been indicated to be lower in pregnant women than non-pregnant women,37,38 which may be explained by high renal blood flow and decreased renal glucose transporter expression.37,38 Similarly, recent study demonstrated that RTG in normal glucose tolerance pregnancy was significantly lower than that in the GDM women, as well as the healthy controls.9 And the relatively high RTG in GDM may attribute to upregulation of renal glucose transporter expression including GLUT2 and SGLT2.9 Consistent with the findings, in an HFD-induced GDM model, our results suggested that expressions of GLUT2 and SGLT2 were enhanced significantly in HP mice as indicated by increased number of positive cells of GLUT2 and SGLT2 in the renal proximal tubule and levels of renal GLUT2 and SGLT2 mRNA and protein. The enhancement of renal glucose transporter expression may contribute to the elevated blood glucose level, which further aggravates insulin resistance and eventually leads to GDM.
Conclusions
In conclusion, the present study indicated a potential involvement of renal GLUT2 and SGLT2 in the pathology of GDM in an HFD-induced GDM mouse model. As far as we know, our study is the first study which explores a probable connection between renal glucose transporter and GDM. The current findings display new evidence supporting the role of renal GLUT2 and SGLT2 in diabetes. A better understanding of the renal involvement in GDM may provide new evidence for the pathogenesis of GDM and open new horizons for pharmaceutics developments.
Acknowledgment
This work was supported by the Medical Research Project of Shanghai Xuhui District (No. SHXH201836), Special Study of Zhongshan Hospital of Fudan University (No. 201801), Natural Science Foundation of Xinjiang Uygur Autonomous Region (No. 2019D01C090), and Domestic Technical Cooperation Projects of Shanghai Science and Technology Commission (No. 19695840200).
Disclosure
The authors declare no conflicts of interest, financial or otherwise in this work.
References
1. Alberti KG, Zimmet PZ. Definition, diagnosis and classification of diabetes mellitus and its complications. Part 1: diagnosis and classification of diabetes mellitus provisional report of a WHO consultation. Diabet Med. 1998;15:539–553. doi:10.1002/(SICI)1096-9136(199807)15:7<539::AID-DIA668>3.0.CO;2-S
2. Jiwani A, Marseille E, Lohse N, et al. Gestational diabetes mellitus: results from a survey of country prevalence and practices. J Matern Fetal Neonatal Med. 2012;25:600–610. doi:10.3109/14767058.2011.587921
3. Guariguata L, Linnenkamp U, Beagley J, Whiting DR, Cho NH. Global estimates of the prevalence of hyperglycaemia in pregnancy. Diabetes Res Clin Pract. 2014;103:176–185. doi:10.1016/j.diabres.2013.11.003
4. Catalano PM. Trying to understand gestational diabetes. Diabet Med. 2014;31:273–281. doi:10.1111/dme.12381
5. Damm P. Future risk of diabetes in mother and child after gestational diabetes mellitus. Int J Gynaecol Obstet. 2009;104(Suppl 1):S25–S26. doi:10.1016/j.ijgo.2008.11.025
6. Page KA, Romero A, Buchanan TA, Xiang AH. Gestational diabetes mellitus, maternal obesity, and adiposity in offspring. J Pediatr. 2014;164:807–810. doi:10.1016/j.jpeds.2013.11.063
7. Metzger BE, Lowe LP, Dyer AR, et al. Hyperglycemia and adverse pregnancy outcomes. N Engl J Med. 2008;358:1991–2002. doi:10.1056/NEJMoa0707943
8. Barbour LA, McCurdy CE, Hernandez TL, et al. Cellular mechanisms for insulin resistance in normal pregnancy and gestational diabetes. Diabetes Care. 2007;30(Suppl 2):S112–S119. doi:10.2337/dc07-s202
9. Klein P, Polidori D, Twito O, Jaffe A. Impaired decline in renal threshold for glucose during pregnancy – a possible novel mechanism for gestational diabetes mellitus. Diabetes Metab Res Rev. 2014;30:140–145. doi:10.1002/dmrr.2474
10. Rave K, Nosek L, Posner J, et al. Renal glucose excretion as a function of blood glucose concentration in subjects with type 2 diabetes – results of a hyperglycaemic glucose clamp study. Nephrol Dial Transplant. 2006;21:2166–2171. doi:10.1093/ndt/gfl175
11. Mogensen CE. Maximum tubular reabsorption capacity for glucose and renal hemodynamcis during rapid hypertonic glucose infusion in normal and diabetic subjects. Scand J Clin Lab Invest. 1971;28:101–109. doi:10.3109/00365517109090668
12. Lawrence RD. Renal threshold for glucose: normal and in diabetics. Br Med J. 1940;1:766–768. doi:10.1136/bmj.1.4140.766
13. Vestri S, Okamoto MM, de Freitas HS, et al. Changes in sodium or glucose filtration rate modulate expression of glucose transporters in renal proximal tubular cells of rat. J Membr Biol. 2001;182:105–112. doi:10.1007/s00232-001-0036-y
14. Rahmoune H, Thompson PW, Ward JM, et al. Glucose transporters in human renal proximal tubular cells isolated from the urine of patients with non-insulin-dependent diabetes. Diabetes. 2005;54:3427–3434. doi:10.2337/diabetes.54.12.3427
15. Marsenic O. Glucose control by the kidney: an emerging target in diabetes. Am J Kidney Dis. 2009;53:875–883. doi:10.1053/j.ajkd.2008.12.031
16. Freitas HS, Anhe GF, Melo KF, et al. Na(+)-glucose transporter-2 messenger ribonucleic acid expression in kidney of diabetic rats correlates with glycemic levels: involvement of hepatocyte nuclear factor-1alpha expression and activity. Endocrinology. 2008;149:717–724. doi:10.1210/en.2007-1088
17. Liang C, DeCourcy K, Prater MR. High-saturated-fat diet induces gestational diabetes and placental vasculopathy in C57BL/6 mice. Metabolism. 2010;59:943–950. doi:10.1016/j.metabol.2009.10.015
18. Brawerman GM, Kereliuk SM, Brar N, et al. Maternal resveratrol administration protects against gestational diabetes-induced glucose intolerance and islet dysfunction in the rat offspring. J Physiol. 2019;597:4175–4192. doi:10.1113/JP278082
19. Luo J, Quan J, Tsai J, et al. Nongenetic mouse models of non-insulin-dependent diabetes mellitus. Metabolism. 1998;47:663–668. doi:10.1016/s0026-0495(98)90027-0
20. Rerup CC. Drugs producing diabetes through damage of the insulin secreting cells. Pharmacol Rev. 1970;22:485–518.
21. Holemans K, Caluwaerts S, Poston L, Van Assche FA. Diet-induced obesity in the rat: a model for gestational diabetes mellitus. Am J Obstet Gynecol. 2004;190:858–865. doi:10.1016/j.ajog.2003.09.025
22. Xing B, Wang L, Li Q, et al. Hsp70 plays an important role in high-fat diet induced gestational hyperglycemia in mice. J Physiol Biochem. 2015;71:649–658. doi:10.1007/s13105-015-0430-z
23. Fischer AH, Jacobson KA, Rose J, Zeller R. Hematoxylin and eosin staining of tissue and cell sections. CSH Protoc. 2008;2008:t4986. doi:10.1101/pdb.prot4939
24. Giacobbe A, Granese R, Grasso R, et al. Association between maternal serum high mobility group box 1 levels and pregnancy complicated by gestational diabetes mellitus. Nutr Metab Cardiovasc Dis. 2016;26:414–418. doi:10.1016/j.numecd.2016.02.007
25. Retnakaran R, Ye C, Kramer CK, et al. Evaluation of circulating determinants of beta-cell function in women with and without gestational diabetes. J Clin Endocrinol Metab. 2016;101:2683–2691. doi:10.1210/jc.2016-1402
26. Wu H, Liu Y, Wang H, Xu X. High-fat diet induced insulin resistance in pregnant rats through pancreatic pax6 signaling pathway. Int J Clin Exp Pathol. 2015;8:5196–5202.
27. Ameri P, Bruzzone S, Mannino E, et al. Impaired increase of plasma abscisic acid in response to oral glucose load in type 2 diabetes and in gestational diabetes. PLoS One. 2015;10:e115992.
28. Todoric J, Handisurya A, Knapp B, et al. Relationship of pentraxin 3 with insulin sensitivity in gestational diabetes. Eur J Clin Invest. 2013;43:341–349. doi:10.1111/eci.12051
29. Gilmartin AB, Ural SH, Repke JT. Gestational diabetes mellitus. Rev Obstet Gynecol. 2008;1:129–134.
30. Bellisario V, Panetta P, Balsevich G, et al. High-fat diet during pregnancy acts as a stressor increasing maternal glucocorticoids’ signaling to the fetus and disrupting maternal behavior in a mouse model. Psychoneuroendocrinology. 2015;61:10.
31. Payolla TB, Lemes SF, de Fante T, et al. High-fat diet during pregnancy and lactation impairs the cholinergic anti-inflammatory pathway in the liver and white adipose tissue of mouse offspring. Mol Cell Endocrinol. 2016;422:192–202. doi:10.1016/j.mce.2015.12.004
32. Winzell MS, Ahren B. The high-fat diet-fed mouse: a model for studying mechanisms and treatment of impaired glucose tolerance and type 2 diabetes. Diabetes. 2004;53(Suppl 3):S215–S219. doi:10.2337/diabetes.53.suppl_3.s215
33. Palomba S, de Wilde MA, Falbo A, et al. Pregnancy complications in women with polycystic ovary syndrome. Hum Reprod Update. 2015;21:575–592. doi:10.1093/humupd/dmv029
34. Robinson DP, Klein SL. Pregnancy and pregnancy-associated hormones alter immune responses and disease pathogenesis. Horm Behav. 2012;62:263–271. doi:10.1016/j.yhbeh.2012.02.023
35. Poulakos P, Mintziori G, Tsirou E, et al. Comments on gestational diabetes mellitus: from pathophysiology to clinical practice. Hormones (Athens). 2015;14:335–344.
36. Farber SJ, Berger EY, Earle DP. Effect of diabetes and insulin of the maximum capacity of the renal tubules to reabsorb glucose. J Clin Invest. 1951;30:125–129. doi:10.1172/JCI102424
37. Christensen PJ. Tubular reabsorption of glucose during pregnancy. Scand J Clin Lab Invest. 1958;10:364–371. doi:10.3109/00365515809051238
38. Davison JM, Lovedale C. The excretion of glucose during normal pregnancy and after delivery. J Obstet Gynaecol Br Commonw. 1974;81:30–34. doi:10.1111/j.1471-0528.1974.tb00360.x
 © 2019 The Author(s). This work is published and licensed by Dove Medical Press Limited. The
full terms of this license are available at https://www.dovepress.com/terms
and incorporate the Creative Commons Attribution
- Non Commercial (unported, 3.0) License.
By accessing the work you hereby accept the Terms. Non-commercial uses of the work are permitted
without any further permission from Dove Medical Press Limited, provided the work is properly
attributed. For permission for commercial use of this work, please see paragraphs 4.2 and 5 of our Terms.
© 2019 The Author(s). This work is published and licensed by Dove Medical Press Limited. The
full terms of this license are available at https://www.dovepress.com/terms
and incorporate the Creative Commons Attribution
- Non Commercial (unported, 3.0) License.
By accessing the work you hereby accept the Terms. Non-commercial uses of the work are permitted
without any further permission from Dove Medical Press Limited, provided the work is properly
attributed. For permission for commercial use of this work, please see paragraphs 4.2 and 5 of our Terms.