")
Back to Journals » Neuropsychiatric Disease and Treatment » Volume 15
UPLC-Q-TOF-MS profiling of the hippocampus reveals metabolite biomarkers for the impact of Dl-3-n-butylphthalide on the lipopolysaccharide-induced rat model of depression
Authors Geng C, Guo Y, Qiao Y, Zhang J, Chen D, Han W, Yang M, Jiang P
Received 1 February 2019
Accepted for publication 10 June 2019
Published 10 July 2019 Volume 2019:15 Pages 1939—1950
DOI https://doi.org/10.2147/NDT.S203870
Checked for plagiarism Yes
Review by Single anonymous peer review
Peer reviewer comments 3
Editor who approved publication: Dr Yuping Ning
Chunmei Geng,*,1 Yujin Guo,*,1 Yi Qiao,2 Jun Zhang,3 Dan Chen,1 Wenxiu Han,1 Mengqi Yang,1 Pei Jiang1
1Institute of Clinical Pharmacy and Pharmacology, Jining First People’s Hospital, Jining Medical University, Jining, People’s Republic of China; 2Department of Public Health, Jining Medical University, Jining, People’s Republic of China; 3Department of Pharmacy, The First Affiliated Hospital of Zhengzhou University, Zhengzhou, People’s Republic of China
*These authors contributed equally to this work
Purpose: An increasing body of evidence reveals that inflammation is involved in the pathological mechanisms of depression. Our previous basic research confirmed that Dl-3-n-butylphthalide (NBP) possess anti-inflammatory properties. However, studies investigating metabolite biomarkers for the involvement of NBP in hippocampus tissue in the lipopolysaccharide (LPS)-induced rat model of depression are currently limited. Thus, the aim of this study was to identify metabolite biomarkers in the hippocampus for the impact of NBP in this model of depression.
Material and methods: Male Sprague–Dawley rats were randomly allocated to one of the following three groups (n=6): Control, LPS-induced rat model of depression (LPS), and NBP involvement in the LPS-induced rat model of depression (LPS+NBP). Ultra-high-performance liquid chromatography-mass spectroscopy was used to determine the hippocampal metabolites. Multivariate statistical analysis was performed to identify differentially expressed hippocampal metabolites in the three groups.
Results: Most of the identified differentially expressed metabolites were related to amino acid, lipid, energy, and oxidative stress metabolism. Additionally, metabolites were eventually connected to different pathways and metabolic networks, which may partly account for the pathophysiological process of depression.
Conclusion: The present findings provide insight into the anti-inflammatory effects of NBP, and further elucidate the pathophysiological mechanisms underlying inflammation-induced depression.
Keywords: inflammation, Dl-3-n-butylphthalide, lipopolysaccharide, metabolite biomarkers, ultra-high-performance liquid chromatography-mass spectroscopy
Introduction
An increasing body of evidence has revealed that inflammation plays a crucial role in the pathophysiological mechanisms of depression.1,2 Depression, one of the most common debilitating psychiatric diseases, is associated with high mortality and morbidity. A model of inflammation-induced depression was established in our laboratory using low doses (500 μg/kg every 2 days) of lipopolysaccharide (LPS) in male Sprague–Dawley rats for 2 weeks.3 LPS is an efficient and vigorous inducer of pro-inflammatory cytokines (tumor necrosis factor alpha, interleukin1β, interleukin6, and C-reactive protein), which may further trigger neuroendocrine and neurochemical variations that lead to depressive behavior. The LPS-induced rat model of depression is a validated animal model widely used in the study of clinical depression and the evaluation of the antidepressant effects of various drugs.4,5 Following the administration of LPS, the depressive behavior of Sprague–Dawley rats was reflected in increased immobility in the forced swimming test, tail suspension test, and reduced preference for sweet solutions (assessed using the sucrose preference test).6 Congruently, antidepressants have been shown to improve pro-inflammatory cytokine-evoked depressive-like behavior in animals.7 Therefore, anti-inflammatory treatments are urgently required to alleviate depressive symptoms, improve quality of life, and prolong life expectancy of patients.
Dl-3-n-butylphthalide (NBP), a racemic compound, is extracted from the seeds of Apium graveolens Linn. In China, NBP has been used in the treatment of ischemic stroke for many years.8 However, the therapeutic effect of NBP is not confined to these regions. Studies have shown that NBP possesses anti-oxidant, anti-apoptotic, and anti-inflammatory properties. For instance, NBP may exert a protective effect on the brain by reducing neuronal cell loss, decreasing oxidative stress, and suppressing inflammation.9 Additionally, in a rat model of LPS-induced sepsis, NBP inhibited the c-Jun N-terminal kinase pathway and increased the enzymatic activity of heme oxygenase-1, leading to a marked decrease in neuroinflammatory response.10 Depression is closely associated with oxidative damage and neuroinflammation, and NBP exerts neuroprotective/therapeutic effects. However, thus far, few metabolomics studies have investigated the role of NBP in depression.
In recent years, metabonomics – a quantitative determination of the dynamic metabolic response of biological system to pathophysiological stimulation or genetic modification – has been widely used.11 Powerful metabolic profiling methods (eg, nuclear magnetic resonance, liquid chromatography–mass spectrometry [LC-MS], gas chromatography-MS) have been used for the discovery of molecular biomarkers involved in monitoring the chemically induced toxicity in organs, diagnosing or predicting clinical disease, exploring the underlying mechanisms of various diseases, and evaluating the therapeutic effects of drugs, etc.12–14 Although little is known regarding a certain disease, metabolomics may potentially reveal alterations and disturbances in metabolic activities in given biological species. In addition, it is a promising opportunity to generate novel hypotheses for addressing the molecular mechanisms of diseases. This approach ultimately aims toward a comprehensive understanding of pathophysiological mechanisms. Currently, metabolomics have been widely used in the peripheral area (eg, plasma and urine) and the central nervous system (eg, prefrontal cortex and hippocampus).15,16 Hippocampus tissue is closely related to the neural activity of the central nervous system and may provide unique perspectives on localized metabolic information compared with plasma and urine; thus, study on hippocampus may be more profound. However, thus far, limited evidence has been published regarding metabolite biomarkers for the involvement of NBP in hippocampus tissue in the LPS-induced rat model of depression.
Therefore, the aim of the present study was to employ an ultra-high-performance LC-MS (UPLC-MS) metabolomic approach combined with principal component analysis (PCA), partial least squares-discriminate analysis (PLS-DA), and orthogonal partial least-squares discriminant analysis (OPLS-DA) to identify differentially expressed hippocampus metabolites in the LPS-induced rat model of depression. The discovery of metabolites biomarkers may assist researchers in elucidating the effects of NBP involvement in LPS-induced depression in rat, and the underlying inflammation-related pathophysiological mechanisms of depression.
Materials and methods
Materials and instruments
NBP was obtained from Shijiazhuang Pharma Group NBP Pharmaceutical Co. Ltd., Shijiazhuang, Hebei Province, China. DL-o-chlorophenylalanine, used as internal standard (IS), was purchased from GL Biochem (Shanghai) Ltd. Acetonitrile, methanol and ultra-pure water were of chromatographic grade and obtained from Merck Company, Darmstadt, Germany. Formic acid was purchased from CNW, Shanghai, China. The Waters AcquityTM UPLC system was coupled with the Waters XevoTM Q-TOF mass analyzer. The column used for this analysis was the Waters Acquity UPLC HSS T3 column (2.1 mm×100 mm, 1.8 μm), Waters Company, America.
Experimental protocols
Male Sprague–Dawley rats aged approximately 8 weeks were initially housed in a temperature-controlled environment with ad libitum access to food and water except prior to the sucrose preference test. All animal experiments were performed according to the Regulations of Experimental Animal Administration issued by the State Committee of Science and Technology of the People’s Republic of China, with the approval of the Ethics Committee of Jining First People’s Hospital, Jining Medical University (NO. 20170016).
Rats were randomly allocated to one of the following three groups (n=6): Control, LPS, and LPS+NBP. LPS was administrated every other day and was carried out 14 days. Meanwhile, in the latter group, NBP dissolved in soybean oil (30 mg/kg/day) was administered through oral gavage for 14 days. In contrast, the Control and LPS groups were treated with an equal amount of soybean oil. The dosage of NBP was selected on the basis of previous studies investigating the neuroprotective effects of this drug. The dose of LPS (500 μg/kg every 2 days) was selected to effectively induce depressive-like behavior by repeated stimulation based on previous findings.3 The behavioral tests were performed 24 hrs after the last injection, and the results were previously published.6 One day after the behavioral tests, the rats were anesthetized with 1% sodium pentobarbital (50 mg/kg), the brain tissues were dissected on ice, and quickly stored at −80°C for further analysis.
UPLC-MS methods
Separation from hippocampus tissue was achieved using a Waters Acquity UPLC HSS T3 column (2.1 mm×100 mm, 1.8 μm) with the column temperature maintained at 40°C. The flow rate was 0.3 mL/min. The mobile phases were as follows: mobile phase A, water containing 0.1% formic acid and mobile phase B, acetonitrile containing 0.1% formic acid. The following gradient conditions were used for lipid separation: 0/5, 2/5, 12/95, 15/95, 17/5, and 20/5 (min/% solvent B). The injection volume was 6 μL. Mass spectrometry was simultaneously performed in the positive and negative electrospray ionization (ESI) modes. The parameters for the positive ESI mode were as follows: capillary voltage 1.4 kV, sampling cone 40 V; source temperature 120°C, desolvation temperature 350°C, cone gas flow 50 L/h, desolvation gas flow 600 L/h, collision energy 10–40 V, ion energy 1 V, scan time 0.03 s, interscan time 0.02 s, and scan range 50–1500 m/z. The parameters for the negative ESI mode were: capillary voltage 1.3 kV, sampling cone 23 V, source temperature 120°C, desolvation temperature 350°C, cone gas flow 50 L/h, desolvation gas flow 600 L/h, collision energy 10–40 V, ion energy 1 V, scan time 0.03 s, interscan time 0.02 s, and scan range 50–1500 m/z.
Sample preparation
Hippocampus tissue sample (50 mg) was added to 800 μL of methanol (with IS, 5 µg/mL), mixed and vortexed for 0.5 min, and centrifuged at 12,000 rpm for 15 mins at 4°C. Finally, the supernatant (200 μL) was moved to a vial for LC-MS analysis.
Multivariate statistical analysis
The data were analyzed using feature extraction and preprocessed with the Masslynx 4.1 software (Waters). Subsequently, data were normalized and edited into a two-dimensional data matrix using the Microsoft Excel 2010 software, including observations (samples), retention time, mass, and peak intensity. A multivariate analysis of the edited data was performed using the SIMCA-P 13.0 software (Umetrics AB, Umea, Sweden). A modified multicriteria assessment strategy was used for the procedure of variable selection. The assessment was used to reduce the number of variables and explore those that were most sensitive to the interventions. A statistically significant threshold of variable influence on projection (VIP) values from the OPLS-DA model (VIP>1.0) and two-tailed Student’s t-test (p<0.05) were used. Fold change was defined as the average mass response (area) ratio between two groups.
VIP>1.0 and p<0.05 were the key parameters revealing differences of metabolites between groups. MetaboAnalyst 3.0 (http://www.metaboanalyst.ca/) permits comprehensive metabolomic data analysis, visualization, and interpretation to analyze the pathway. Pathway analysis and visualization is based on the Kyoto Encyclopedia of Genes and Genomes (KEGG; http://www.genome.jp/kegg/). The Human Metabolome Database (HMDB; http://www.hmdb.ca/) was implemented in the use of the MetaboAnalyst tool, which helps determine the most significantly altered metabolic pathways. In addition, possible biological roles were analyzed using the enrichment analysis function of MetaboAnalyst 3.0.
Ingenuity Pathways Analysis (IPA; http://www.ingenuity.com) is a web-based software application able to identify biological pathways and functions associated with biomolecules of interest. We uploaded the metabolite lists onto an IPA server to systematically study the metabolic differences in the hippocampi of the Control, LPS, and LPS+NBP groups. Molecular interaction networks were generated based on the knowledge sorted in the Ingenuity Pathway Knowledge Base. The network score was based on the hypergeometric distribution and calculated using the right-tailed Fisher’s exact test. High scores indicated high relevance of the molecules to the network.
Results
UPLC-MS chromatogram of hippocampus tissue samples
Figure 1 shows representative UPLC-quadrupole time-of-flight MS total ion current chromatograms of hippocampus tissue from the quality control (QC) samples of ESI+ and ESI−, with good reproducibility. All hippocampus tissue samples (Control, LPS, and LPS+NBP groups) presented strong response to peak for analysis and good reproducibility in retention time.
 |
Figure 1 (A) Typical UPLC-Q-TOF-MS TIC of hippocampus tissue from the QC sample of ESI+. (B) Typical UPLC-Q-TOF-MS TIC chromatogram of hippocampus tissue from the QC sample of ESI−. Abbreviations: UPLC-Q-TOF-MS, ultra-high-performance liquid chromatography-mass spectroscopy; TIC, total ion chromatogram; QC, quality control, ESI, electrospray ionization. |
Multivariate statistics
Metabolites from methanol extracts were analyzed using both positive and negative ion modes of mass spectrometry. After excluding IS, 1,503 and 437 individual peaks were detected in hippocampus tissue samples of the Control, LPS, and LPS+NBP groups at ESI+ and ESI−, respectively. These peaks were used in the subsequent multivariate analysis. The whole PCA scores of the three groups were R2X=0.496 and Q2=0.185 at ESI+, and R2X=0.568 and Q2=0.433 at ESI−. For the LPS and Control groups, the PCA scores plots were ESI+: R2X=0.468, Q2=0.049, ESI−: R2X=0.56, Q2=0.296. For the LPS and LPS+NBP groups, the PCA score plots were ESI+: R2X=0.497, Q2=0.00357, ESI−: R2X=0.495, Q2=0.222. The pair-wise PLS-DA score plots also suggested that the LPS rat was significantly different from Control rat (ESI+: R2X=0.408, R2Y=0.963, Q2=0.737; ESI−: R2X=0.517, R2Y=0.921, Q2=0.676). For the LPS and LPS+NBP groups, these values were ESI+: R2X=0.396, R2Y=0.983, Q2=0.694; ESI−: R2X=0.386, R2Y=0.982, Q2=0.614. OPLS-DA analysis was used to evaluate the two groups and further maximize the discrimination. The OPLS-DA loading plots suggested that this model was robust and showed clear separation between the Control and the LPS group (ESI+: R2X=0.408, R2Y=0.963, Q2=0.719; ESI−: R2X=0.517, R2Y=0.921, Q2=0.722).For the LPS and LPS + NBP groups, these values were ESI+: R2X=0.396, R2Y=0.983, Q2=0.558; ESI−: R2X=0.386, R2Y=0.982, Q2=0.614.All parameters of the OPLS-DA model (R2X, R2Y, and Q2Y) were positive, suggesting that the model was robust. R2X and R2Y are the cumulative model variations in X and Y, respectively. Q2 is the cumulative predicted variation. Values of these parameters approaching 1.0 indicate a reliable model with predictive reliability. Additionally, a permutation test with 200 iterations verified that the constructed OPLS-DA model was valid and not over-fitted, as the original R2 and Q2 values to the right were significantly higher than the corresponding permutated values to the left (ESI+: R2=0.851, Q2=−0.0871; ESI−: R2X=0.877, Q2=0.14) for the LPS and Control groups, and (ESI+: R2=0.811, Q2=−0.0132; ESI−: R2X=0.931, Q2=0.243) for the LPS and LPS + NBP groups. These results are shown in Figures 2 and 3.
 |
Figure 2 Multivariate statistical analysis between the LPS-induced depression and healthy Control groups at ESI+: (A) principal component analysis (PCA) scores plot; (B) partial least squares-discriminate analysis (PLS-DA) scores plot; (C) statistical validation of the PLS-DA model through 200× permutation testing; and (D) pair-wise orthogonal projections to latent structures discriminant (OPLS-DA) scores plot. Multivariate statistical analysis between the LPS-induced depression and healthy Control groups at ESI−: (E) PCA scores plot; (F) PLS-DA scores plot; (G) statistical validation of the PLS-DA model through 200×permutation testing; and (H) OPLS-DA scores plot.Abbreviations: LPS, lipopolysaccharide; ESI, electrospray ionization. |
 |
Figure 3 Multivariate statistical analysis between the LPS-induced depression and NBP treatment groups (LPS+Ding) at ESI+: (A) PCA scores plot; (B) PLS-DA scores plot; (C) Statistical validation of the PLS-DA model through 200× permutation testing; and (D) OPLS-DA scores plot. Multivariate statistical analysis between the LPS-induced depression and NBP treatment groups at ESI−: (E) PCA scores plot; (F) PLS-DA scores plot; (G) statistical validation of the PLS-DA model by 200× permutation testing, and (H)OPLS-DA scores plot.Abbreviations: LPS, lipopolysaccharide; ESI, electrospray ionization; NBP, Dl-3-n-butylphthalide; PCA, principal component analysis; PLS-DA, partial least squares-discriminate analysis; OPLS-DA, orthogonal partial least-squares discriminant analysis. |
Identification of potential biomarkers
Significant differences in metabolites were identified among the hippocampus tissue samples of the Control, LPS, and LPS+NBP groups (according to the VIP>1.0 in the OPLS-DA models and p<0.05 the two indices). In the Control and LPS groups, 23 significantly different metabolites were identified (8 decreased and 15 increased in LPS versus Control) (Table 1). In the LPS+NBP and LPS groups, 13 significantly different metabolites were identified (9 decreased and 4 increased in LPS+NBP versus LPS) (Table 2). These differentially expressed metabolites are mainly related to amino acid, lipid, energy, and oxidative stress metabolism.
 |
Table 1 Summary of the significantly different metabolites in the hippocampus between the LPS and Control groups at ESI+ and ESI− |
 |
Table 2 Summary of the significantly different metabolites in the hippocampus between the LPS and LPS+NBP at ESI+ and ESI− |
Metabolic pathway and functional analyses
Functional analysis showed that the identified differential metabolites were primarily involved in amino acid metabolism, energy metabolism, lipid, and oxidative stress metabolism. In this analysis, we identified several pathways that may be significant (Raw p<0.5, Impact>0). There were four most significantly different pathways: pentose phosphate pathway, alanine, aspartate, and glutamate metabolism, citrate cycle (TCA cycle), and purine metabolism in LPS-induced depression group. In the LPS+NBP group, the two most significantly different pathways were: phenylalanine, tyrosine, and tryptophan biosynthesis and arginine and proline metabolism. The detailed results of the pathway analyses are shown in. The detail results of pathway analyses are shown in Table 3 with a summary shown in Figure 4.
 |
Table 3 Result from pathway analysis from MetaboAnalyst |
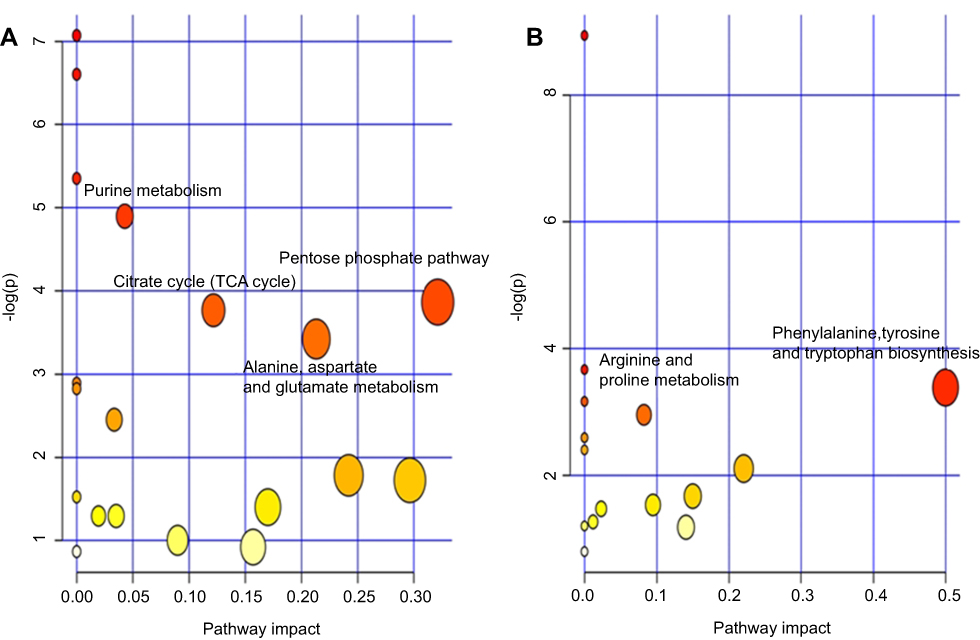 |
Figure 4 Summary of the pathway analysis using MetaboAnalyst. (A) LPS group versus Control group (B) LPS+NBP group versus LPS group.Abbreviations: LPS, lipopolysaccharide; NBP, Dl-3-n-butylphthalide. |
Molecular interaction networks of the significantly different metabolites among the control, LPS, and LPS+NBP groups in the IPA analysis
Molecular interaction network analysis was performed using the differential metabolites uploaded to the IPA website. The most significantly altered network was “Lipid Metabolism, Small Molecule Biochemistry and Cellular Compromise”. Numerous metabolites (ie, L-glutamine, kynurenic acid, L-tyrosine, L-methionine, L-arginine, and p38) were involved in signaling pathways exerting various pharmacological effects (Figure 5).
 |
Figure 5 Merged network combining major signaling networks related to the metabolites differentially expressed in the Ingenuity Pathways Analysis. Note: For clarity, proteins and metabolites were merged with different geometric shapes in the relevant network in the hippocampus. Red indicates upregulation of metabolites, whereas green indicates downregulation of metabolites. Metabolites not correlated to proteins and treatment are shown as clear. Dotted lines show indirect interactions or regulations between the two parties, whereas solid lines show direct physical interactions (eg, binding) of the two parties.Abbreviation: CP, correlation of pathway. |
Discussion
Biochemical interpretation
The underlying inflammatory pathogenesis of depression was studied by employing the LPS-induced rat model of depression and the UPLC-MS metabolomics approach coupled with multivariate statistical analysis. Our study revealed altered metabolites clearly in LPS group compared to the Control group and LPS+NBP group versus LPS group. Differential metabolites involved in the pentose phosphate pathway; alanine, aspartate, and glutamate metabolism; citrate cycle (TCA cycle); purine metabolism; phenylalanine, tyrosine, and tryptophan biosynthesis; and arginine and proline metabolism were distributed to three dominant categories according to their biochemical functions (based on the annotations of the KEGG and HMDB) to better understand the potent mechanisms of depression. These categories were: (1) amino acid metabolism disorder (glutamine, glutamate, and gamma-aminobutyric acid [GABA]); (2) energy metabolism disorder (purine, D-ribose 5-phosphate, D-glucose 6-phosphate, citric acid, and cyclic adenosine monophosphate); (3) lipid metabolism (phosphatidylcholine [PC]: 2:0/0:0). This is the first study to report hippocampal metabolic changes in the involvement of NBP in the LPS-induced rat model of depression.
Interpretation of potential biomarkers reversed by NBP
In our previous behavioral tests, NBP increased sucrose preference and reduced immobility time, indicating its potential antidepressant effects. The UPLC-MS based on the metabolomics approach was used to further investigate the effect of NBP. According to the KEGG and HMDB databases, these metabolites were finally connected to different pathways and metabolic networks.
Amino acid metabolism
Metabolic analysis revealed that a number of amino acids and neurotransmitters were significantly changed in the hippocampus among the three groups. Several of these amino acids are involved in the phenylalanine, tyrosine, and tryptophan biosynthesis, while several amino acids are excitatory/inhibitory neurotransmitters (ie, L-glutamine and GABA).17 In animal models of depression, alterations in glutamatergic or GABAergic neurotransmitters trigger depressive-like behavior. Several clinical studies indicated that alterations in both of these neurotransmitter systems may play a crucial role in the pathogenesis of depression.18,19 In our study, the level of L-glutamine was decreased in the hippocampus of LPS rat. This result is in agreement with a previous study using gas chromatography–mass spectrometry to assess the hippocampus of chronic unpredictable mild stress-model rats.20 In contrast, the levels of the inhibitory neurotransmitter GABA were increased in LPS rat. In previous study, dose of ketamine increases pre- and postsynaptic markers of GABA synapses in PFC, including increased GAD65/67, VGAT, and gephyrin, and reverses the deficits in these GABA markers caused by chronic stress exposure. We speculate that upregulation of GABA neurotransmission could play a role in the sustained, as well as rapid, antidepressant actions of these agents, and NBP may play a neuroprotective effect due to this hypothesis.21 Therefore, these findings reinforce previous studies that indirectly suggested the involvement of the glutamatergic or GABAergic systems in the pathophysiology of depression. Multiple preclinical studies have supported that disruptions of the glutamine–glutamate cycle (eg, glutamine deficiency and loss of astrocytes) in the hippocampus are closely related to depressive-like behavior in animals.22–24 Changes in the levels of L-glutamine in the hippocampi of LPS rat were clinically important. This finding was consistent with the results of a study that used chronic unpredictable mild stress rats and an LC-MS approach. The study revealed that L-glutamine may be a useful potential biomarker for the diagnosis of depression and development of antidepressants in the future.25 However, our study confirmed that the levels of L-glutamine were decreased in the hippocampi of the LPS+NBP rat. This discrepancy in the distribution of L-glutamine may suggest the presence of different signal-regulating pathways in the hippocampus. The present study demonstrated that perturbations in amino acid metabolism are involved in the pathophysiological process of depression, though the particular amino acids and directions of change are very complex.
Energy metabolism
The TCA cycle is the ultimate metabolic pathway as well as a linking hub of sugars, lipids, and amino acids. Therefore, the status of the TCA cycle is a comprehensive reflection of energy metabolism in the body.26,27 Our study identified changes in the hippocampus metabolites related to the TCA cycle between the LPS and Control groups, including citric acid and cyclic adenosine monophosphate. Citric acid is a dominant intermediate in the TCA cycle, playing a crucial role in energy metabolism. These findings indirectly suggest that disrupted energy metabolism is involved in the pathophysiology of depression.
Lipid metabolism
Lipid metabolism was markedly perturbed in both the LPS+NBP and LPS groups, suggesting that lipid metabolism disorders may be involved in the development of depression. PC and phosphatidylethanolamine are important lipids in mammals, playing an essential role in the structure of lipid bisporon that forms the cell membrane and an important biochemical role in the cell.28,29 In addition, PC (2:0/0:0) also act as messengers in cell signalling processes, the perturbation of PC (2:0/0:0) observed in this study may be closely involved in lipid metabolic dysfunction. In our metabolomic paper, PC (2:0/0:0) was only found. However, we had also done lipidomics study, lipid metabolism was involved in glycerophospholipid metabolism, sphingolipid metabolism, glycerolipid metabolism, and GPI-anchor biosynthesis the four pathways, the results were yet to be published.
Metabolite-protein network
The metabolic pathway analysis suggested that the identified metabolites were crucial for understanding the pathophysiological mechanism. As shown in Figure 5, we found that differentially expressed metabolites and small molecular-transport-associated major signaling pathways were associated with inflammation, oxidative stress responses, and apoptosis, which maybe strongly linked to the pathophysiological mechanism of LPS-induced depression. Numerous studies have shown that following the suppression of nuclear factor-κB pathway, inflammatory diseases are ameliorated through neuroinflammation.30,31 Adenosine monophosphate-activated protein kinase is a key metabolic regulator with the anti-inflammatory. Evidence revealed that suppressed autophagy by dephosphorylation of adenosine monophosphate-activated protein kinase and activation of the mechanistic target of rapamycin may be related to the development of LPS-induced inflammatory depression.32,33 The present study suggested that NBP may inhibit response to inflammation, oxidative stress, and autophagy, which may partly account for the pathophysiology of depression. These findings are consistent with our metabolomics results showing that amino acid metabolism, energy metabolism, and lipid metabolism were involved in the altered signaling pathways responding to treatment with LPS+NBP. Moreover, they emphasize the involvement of pro-inflammatory cytokines, which may be of pathological importance and a cause or consequence of LPS-induced depression.
Conclusion
In the present study, hippocampal metabolic changes were observed in the three examined groups. Numerous metabolites – involved in amino acid metabolism, energy metabolism, and lipid metabolism – and associated with inflammation, oxidative stress responses, and apoptosis, may partly account for the pathology of depression. Thus, the present findings identify metabolic biomarkers for the diagnosis of depression and provide insight into the anti-inflammatory effects of NBP. At an appropriate dosage, NBP may be used for the prevention and treatment of inflammation-induced depression. Further investigation of the combinational biomarkers is warranted to determine their clinical value and accuracy in the diagnosis of depression.
Acknowledgments
The study was supported by the National Natural Science Foundation of China (81602846; 31600947) and Natural Science Foundation of Shandong Province (ZR2016HQ21).
Disclosure
The authors report no conflicts of interest in this work.
References
1. Xu J, Zhao Y, Aisa HA. Anti-inflammatory effect of pomegranate flower in lipopolysaccharide (LPS)-stimulated RAW264.7 macrophages. Pharm Biol. 2017;55(1):2095–2101. doi:10.1080/13880209.2016.1257032
2. Zhang Y, Liu L, Peng YL, et al. Involvement of inflammasome activation in lipopolysaccharide-induced mice depressive-like behaviors. CNS Neurosci Ther. 2014;20(2):119–124. doi:10.1111/cns.12170
3. Dang R, Zhou X, Tang M, et al. Fish oil supplementation attenuates neuroinflammation and alleviates depressive-like behavior in rats submitted to repeated lipopolysaccharide. Eur J Nutr. 2017;57(3):893–906. doi:10.1007/s00394-016-1373-z
4. Lee DS, Kwon KH, Cheong SH. Taurine chloramine suppresses LPS-induced neuroinflammatory responses through Nrf2-mediated heme oxygenase-1 expression in mouse BV2 microglial cells. Adv Exp Med Biol. 2017;975:131–143.
5. Zhao X, Cao F, Liu Q, et al. Behavioral, inflammatory and neurochemical disturbances in LPS and UCMS-induced mouse models of depression. Behav Brain Res. 2019;364:494–502. doi:10.1016/j.bbr.2017.05.064
6. Yang M, Dang R, Xu P, et al. Dl-3-n-butylphthalide improves lipopolysaccharide-induced depressive-like behavior in rats: involvement of Nrf2 and NF-κB pathways. Psychopharmacology (Berl). 2018;235(9):2573–2585. doi:10.1007/s00213-018-4949-x
7. Ma M, Ren Q, Zhang JC, Hashimoto K. Effects of brilliant blue G on serum tumor necrosis factor-α levels and depression-like behavior in mice after lipopolysaccharide administration. Clin Psychopharmacol Neurosci. 2014;12(1):31–36.
8. Abdoulaye IA, Guo YJ. A review of recent advances in neuroprotective potential of 3-n-butylphthalide and its derivatives. Biomed Res Int. 2016;2016:1–9. doi:10.1155/2016/5012341
9. Qi Q, Xu J, Lv P, et al. DL-3-n-butylphthalide alleviates vascular cognitive impairment induced by chronic cerebral hypoperfusion by activating the Akt/Nrf2 signaling pathway in the hippocampus of rats. Neurosci Lett. 2018;672:59–64. doi:10.1016/j.neulet.2017.11.051
10. Liu CY, Zhao ZH, Chen ZT, et al. DL-3-n-butylphthalide protects endothelial cells against advanced glycation end product-induced injury by attenuating oxidative stress and inflammation responses. ExperTher Med. 2017;14(3):2241–2248. doi:10.3892/etm.2017.4784
11. Peisl BYL, Schymanski EL, Wilmes P. Dark matter in host-microbiome metabolomics: tackling the unknowns–A review. Anal Chim Acta. 2018;1037:13–27. doi:10.1016/j.aca.2017.12.034
12. Cai HL, Jiang P, Tan QY, et al. Therapeutic efficacy of atypical antipsychotic drugs by targeting multiple stress-related metabolic pathways. Transl Psychiatry. 2017;7(5):e1130. doi:10.1038/tp.2017.160
13. Kuhn M, Sühs KW, Akmatov MK, et al. Mass-spectrometric profiling of cerebrospinal fluid reveals metabolite biomarkers for CNS involvement in varicella zoster virus reactivation. J Neuroinflammation. 2018;15(1):20. doi:10.1186/s12974-018-1220-7
14. Miao X, Xiao B, Shui S, et al. Metabolomics analysis of serum reveals the effect of Danggui Buxue Tang on fatigued mice induced by exhausting physical exercise. J PharmBiomed Anal. 2018;151:301–309.
15. Sun L, Li J, Zhou K, et al. Metabolomic analysis reveals metabolic disturbance in the cortex and hippocampus of subchronic MK-801 treated rats. PLoS One. 2013;8(4):e60598. doi:10.1371/journal.pone.0060598
16. Liu X, Zheng P, Zhao X, et al. Discovery and validation of plasma biomarkers for major depressive disorder classification based on liquid chromatography–mass spectrometry. J Proteome Res. 2015;14(5):2322–2330. doi:10.1021/acs.jproteome.5b00144
17. Ni Y, Su M, Lin J, et al. Metabolic profiling reveals disorder of amino acid metabolism in four brain regions from a rat model of chronic unpredictable mild stress. FEBS Lett. 2008;582(17):2627–2636. doi:10.1016/j.febslet.2008.06.040
18. Wang C, Lou Y, Xu J, et al. Endoplasmic reticulum stress and NF-κB pathway in salidroside mediated neuroprotection: potential of salidroside in neurodegenerative diseases. Am J Chin Med. 2017;45(7):1459–1475. doi:10.1142/S0192415X17500793
19. Zheng B, Zhou Y, Zhang H, et al. Dl-3-n-butylphthalide prevents the disruption of blood-spinal cord barrier via inhibiting endoplasmic reticulum stress following spinal cord injury. Int J Biol Sci. 2017;13(12):1520–1531. doi:10.7150/ijbs.21107
20. Wu Y, Fu Y, Rao C, et al. Metabolomic analysis reveals metabolic disturbances in the prefrontal cortex of the lipopolysaccharide-induced mouse model of depression. Behav Brain Res. 2016;308:115–127. doi:10.1016/j.bbr.2016.04.032
21. Duman RS, Sanacora G, Krystal JH. Altered Connectivity in depression: GABA and glutamate neurotransmitter deficits and reversal by novel treatments. Neuron. 2019;102(1):75–90. doi:10.1016/j.neuron.2019.03.013
22. Croarkin PE, Levinson AJ, Daskalakis ZJ. Evidence for GABAergic inhibitory deficits in major depressive disorder. Neurosci Biobehav Rev. 2011;35(3):818–825. doi:10.1016/j.neubiorev.2010.10.002
23. Drouet JB, Fauvelle F, Maunoir-Regimbal S, et al. Differences in prefrontal cortex GABA/glutamate ratio after acute restraint stress in rats are associated with specific behavioral and neurobiological patterns. Neuroscience. 2016;285(4):155–165. doi:10.1016/j.neuroscience.2014.10.058
24. Ren Z, Pribiag H, Jefferson SJ, et al. Bidirectional homeostatic regulation of a depression-related brain state by gamma-aminobutyric acidergic deficits and ketamine treatment. Biol Psychiatry. 2016;80(6):457–468. doi:10.1016/j.biopsych.2016.02.009
25. Yang P, Li X, Ni J, et al. Alterations of amino acid level in depressed rat brain. Korean J Physiol Pharmacol. 2014;18(5):371–376. doi:10.4196/kjpp.2014.18.5.371
26. Gormanns P, Mueller NS, Ditzen C, et al. Phenome-transcriptome correlation unravels anxiety and depression related pathways. J Psychiatr Res. 2011;45(7):973–979. doi:10.1016/j.jpsychires.2010.12.010
27. Ivnitsky JJ, Schäfer TV, Malakhovsky VN, Rejniuk VL. Intermediates of krebs cycle correct the depression of the whole body oxygen consumption and lethal cooling in barbiturate poisoning in rat. Toxicology. 2004;202(3):165–172. doi:10.1016/j.tox.2004.05.005
28. Mittelstra㟠K, Waldenberger M. DNA methylation in human lipid metabolism and related diseases. CurrOpinLipidol. 2018;29(2):116–124.
29. Tang QQ. Lipid metabolism and diseases. Sci Bull. 2016;61(19):1471. doi:10.1007/s11434-016-1174-z
30. He Z, Zhou Y, Li L, et al. Dl-3-n-butylphthalide attenuates acute inflammatory activation in rats with spinal cord injury by inhibiting microglial TLR4/NF-κB signalling. J Cell Mol Med. 2017;21(11):3010–3022. doi:10.1111/jcmm.13212
31. Zhao H, Chen Z, Xie LJ, Liu GF. Suppression of TLR4/NF-κB signaling pathway improves cerebral ischemia–reperfusion injury in rats. Mol Neurobiol. 2017;55(5):4311–4319.
32. Fan K, Lin L, Ai Q, et al. Lipopolysaccharide-induced dephosphorylation of AMPK-activated protein kinase potentiates inflammatory injuryvia repression of ULK1-dependent autophagy. Front Immunol. 2018;9:1464. doi:10.3389/fimmu.2018.01464
33. Jeon SM. Regulation and function of AMPK in physiology and diseases. Exp Mol Med. 2016;48(7):e245.
 © 2019 The Author(s). This work is published and licensed by Dove Medical Press Limited. The full terms of this license are available at https://www.dovepress.com/terms.php and incorporate the Creative Commons Attribution - Non Commercial (unported, v3.0) License.
By accessing the work you hereby accept the Terms. Non-commercial uses of the work are permitted without any further permission from Dove Medical Press Limited, provided the work is properly attributed. For permission for commercial use of this work, please see paragraphs 4.2 and 5 of our Terms.
© 2019 The Author(s). This work is published and licensed by Dove Medical Press Limited. The full terms of this license are available at https://www.dovepress.com/terms.php and incorporate the Creative Commons Attribution - Non Commercial (unported, v3.0) License.
By accessing the work you hereby accept the Terms. Non-commercial uses of the work are permitted without any further permission from Dove Medical Press Limited, provided the work is properly attributed. For permission for commercial use of this work, please see paragraphs 4.2 and 5 of our Terms.