
Back to Journals » Psychology Research and Behavior Management » Volume 18
Unveiling the Hierarchical Network of Sleep Quality Determinants: Linking Behavioral, Environmental, and Psychosocial Pathways

Received 11 July 2025
Accepted for publication 26 August 2025
Published 2 September 2025 Volume 2025:18 Pages 1853—1870
DOI https://doi.org/10.2147/PRBM.S553199
Checked for plagiarism Yes
Review by Single anonymous peer review
Peer reviewer comments 2
Editor who approved publication: Professor Mei-Chun Cheung
Xiaoyan Hu,1,* Yuting Zhan,2,* Jinying Wang3
1ElCU, Shaoxing Second Hospital, Shaoxing City, Zhejiang Province, People’s Republic of China; 2Department of Psychology, School of Education and Teaching, Ningxia University, Yinchuan City, Ningxia Province, People’s Republic of China; 3Department of Internal Medicine, Shaoxing Second Hospital, Shaoxing City, Zhejiang Province, People’s Republic of China
*These authors contributed equally to this work
Correspondence: Jinying Wang, Email [email protected]
Background: Sleep quality has emerged as a critical public health concern, yet our understanding of how multiple determinants interact to influence sleep outcomes remains limited. This study employed partial correlation network analysis to examine the hierarchical structure of sleep quality determinants among Chinese adults.
Methods: We investigated the interrelationships among nine key factors: daily activity rhythm, social interaction frequency, work-life balance, light exposure, physical activity level, time control perception, shift work, weekend catch-up sleep, and sleep quality using the extended Bayesian Information Criterion (EBIC) glasso model. The study included 8,127 Chinese adults (51.0% female, mean age = 32.7 years).
Results: Results revealed that 79.9% of sleep quality variance could be explained by surrounding variables in the network. Time control perception emerged as a proximal factor, demonstrating the highest centrality (strength = 1.85, betweenness = 1.92, closeness = 1.88) and strongest connections to sleep quality. Behavioral factors (physical activity level, shift work, work-life balance) functioned as intermediate mechanisms, while environmental and temporal patterns (light exposure, weekend catch-up sleep, social interaction frequency, daily activity rhythm) operated as distal influences. Network stability analysis showed robust estimation precision (CS coefficients > 0.70 for all centrality measures).
Conclusion: These findings advance our theoretical understanding of sleep quality as embedded within a dynamic network of interacting factors and provide empirical support for targeted interventions focusing on time control perception and behavioral mediators to improve sleep outcomes. The network perspective offers novel insights for developing effective, hierarchically structured approaches to sleep quality enhancement in contemporary society.
Keywords: sleep quality, network analysis, time control perception, behavioral mediators, hierarchical structure, partial correlation
Background
Sleep quality has emerged as a critical public health concern in contemporary society, with mounting evidence linking poor sleep to a wide array of adverse health outcomes across multiple physiological and psychological systems.1,2 The relationship between sleep quality and overall health encompasses complex interactions that affect cardiovascular function, psychoemotional well-being, and musculoskeletal integrity, creating cascading effects throughout the human system.3,4
Sleep Quality and Multisystem Health Impact
Sleep quality represents a fundamental pillar for multisystem health, with extensive research documenting its profound influence across physiological and psychological domains.5 Recent advances have highlighted the critical role of emotional frequency and emotional regulation in sleep-wake processes. Studies demonstrate that individuals with better emotional regulation skills show improved sleep quality through enhanced pre-sleep arousal regulation and reduced cognitive rumination.6,7 The ability to effectively modulate emotional responses during the day directly impacts nighttime sleep consolidation, with poor emotional regulation contributing to hyperarousal states that interfere with sleep initiation and maintenance.8
Cardiovascular health demonstrates particularly robust relationships with sleep quality, as poor sleep contributes to endothelial dysfunction, increased inflammatory markers (particularly C-reactive protein and interleukin-6), and dysregulation of blood pressure through disrupted autonomic nervous system functioning.9,10 These mechanisms explain why individuals with poor sleep quality face 15–20% increased risk of cardiovascular disease and stroke, with sleep disturbances directly affecting heart rate variability, arterial stiffness, and coronary artery calcification processes.11,12
The psychoemotional consequences of compromised sleep are equally significant and bidirectional in nature.13 Sleep quality serves as both predictor and consequence of mood disorders, anxiety, and stress-related conditions through complex interactions involving neurotransmitter regulation, particularly serotonin, dopamine, and gamma-aminobutyric acid (GABA) pathways.14,15 Poor sleep quality disrupts emotional regulation capacity, increases stress reactivity, and compromises cognitive flexibility needed for adaptive coping strategies.16 Furthermore, sleep disturbances create cascading effects on muscular and skeletal systems, including increased muscle tension, reduced pain threshold, and impaired physical recovery processes through disrupted growth hormone secretion and protein synthesis cycles.17,18
Sleep fragmentation represents a particularly insidious form of sleep disturbance that disrupts normal sleep architecture even when total sleep time appears adequate.19 Unlike simple sleep deprivation, fragmentation specifically impairs slow-wave sleep and REM sleep consolidation, leading to incomplete restoration processes.20 This fragmentation contributes to central sensitization phenomena, wherein the central nervous system becomes hyperresponsive to both nociceptive and non-nociceptive stimuli, manifesting as amplified pain perception, reduced stress tolerance, and heightened emotional reactivity.21,22 The relationship between sleep fragmentation and somatization is bidirectional and self-reinforcing, creating particularly challenging clinical presentations where sleep improvement requires addressing both physiological sleep mechanisms and psychological factors.8
Research across diverse populations has demonstrated the universal nature of sleep disturbances’ health impacts. Studies in healthcare workers show increased vulnerability to sleep disorders due to occupational stress and shift work,23 while investigations in older adults reveal age-related changes in sleep architecture that compound health risks.24 These population-specific vulnerabilities underscore the need for targeted intervention approaches.
Theoretical Framework and Integration
Despite extensive research examining individual predictors of sleep quality, our understanding of how these factors interact within a complex network to collectively influence sleep outcomes remains limited.25,26 This gap is particularly significant given that approximately 45% of the global population reports experiencing sleep disturbances, with prevalence rates continuing to rise.27 Traditional approaches to studying sleep quality determinants have relied primarily on linear, univariate methods that fail to capture the intricate interdependencies among variables and overlook the hierarchical nature of influence pathways.28
Our network approach builds upon and extends several foundational theoretical frameworks in sleep research, offering novel insights through methodological innovation. The two-process model of sleep regulation (Borbély, 1982) provides the fundamental understanding that sleep is regulated through interaction between homeostatic pressure (Process S) and circadian timing (Process C).29 Our network model extends this foundation by examining how environmental, behavioral, and psychosocial factors modulate these basic regulatory processes through complex interconnected pathways that traditional models have not captured.30
The biopsychosocial model of sleep disturbances emphasizes that sleep problems arise from interactions among biological vulnerabilities, psychological factors, and social context.31 Our hierarchical network structure operationalizes these interactions by identifying how proximal psychological factors (time control perception), intermediate behavioral factors (physical activity, work-life balance), and distal social-environmental factors (light exposure, social interactions) create layered influences on sleep outcomes.32 This approach allows us to examine not just whether these factors influence sleep, but how they interact to create pathways of influence that can be targeted for intervention.
Furthermore, our findings support and extend Buysse’s (2014) sleep health framework, which conceptualizes sleep as a multidimensional construct embedded within broader health and well-being contexts.5 By identifying time control perception as a central network node, our model contributes new understanding of how cognitive appraisals and perceived control mechanisms interface with sleep regulation processes, suggesting novel intervention targets that traditional models have not emphasized.33
Contemporary Sleep Challenges and Research Needs
Recent theoretical developments in sleep research suggest that sleep quality is influenced through a hierarchical network of factors, where some variables exert direct effects while others operate through indirect pathways.34 However, empirical validation of these theoretical frameworks has been hampered by methodological limitations in analyzing complex, multivariate relationships.35 Contemporary work environments and lifestyle patterns have fundamentally altered the sleep-wake cycle regulatory mechanisms.36 The proliferation of remote work, digital technology, and flexible schedules has created unprecedented challenges for maintaining regular sleep patterns, heightening the importance of understanding how work-life balance interfaces with sleep quality.37
Time control perception has emerged in recent literature as a particularly significant factor in sleep regulation.38–40 TCP refers to an individual’s perceived ability to allocate time according to personal preferences and needs, effectively managing competing demands.41 Studies have demonstrated that higher TCP is associated with reduced psychological stress, more effective recovery processes, and improved sleep outcomes.42,43 Furthermore, TCP may serve as a crucial mediator through which other factors, such as work demands and social activities, impact sleep quality.44 Despite its potential importance, TCP has been underexplored in sleep research, particularly in relation to other determinants of sleep quality.45
Physical activity level, shift work, and behavioral patterns represent critical intermediate mechanisms in the sleep quality network.46 Research has demonstrated that regular physical activity can improve sleep quality through multiple pathways, including circadian rhythm regulation, stress reduction, and physiological adaptations.47,48 However, the extent to which these behavioral factors mediate the relationship between environmental conditions and sleep outcomes remains unclear, and the interactive effects between these behavioral factors and their collective impact on sleep quality have not been systematically examined using network approaches.49
Environmental and social factors, including light exposure and social interaction frequency, have been traditionally viewed as direct influencers of sleep quality.50 However, emerging evidence suggests more complex relationships where these factors influence sleep through multiple pathways, including effects on mood, physical activity, and social scheduling.51 Daily activity rhythm and weekend catch-up sleep represent temporal patterns that reflect the stability and regularity of sleep-wake cycles, but their position within the broader network of sleep-determining factors remains poorly understood.52
Study Rationale and Innovation
The present study addresses these knowledge gaps by employing partial correlation network analysis to examine the hierarchical structure of relationships among sleep quality determinants.53 This innovative methodological approach offers several distinct advantages over traditional analytical methods.54 First, it enables the identification of direct and indirect pathways through which different factors influence sleep quality, moving beyond simple correlation to understand mechanisms of influence. Second, it allows for the quantification of the relative proximity of various factors to sleep quality, providing insights into which variables might serve as optimal intervention targets. Third, it facilitates the examination of mediating relationships and complex interaction patterns that linear models cannot detect. Fourth, it provides insights into the centrality of specific factors within the sleep quality network, revealing which variables serve as key connectors or bridges between different aspects of the sleep system.55
The variable selection for this study was guided by a comprehensive review of sleep research literature and theoretical models of sleep regulation.1,27,28,36,37,46,52,56 We systematically identified key determinants of sleep quality across multiple domains (behavioral, environmental, psychosocial, and temporal) based on their empirical support in previous studies and theoretical relevance. Variables were selected to represent both proximal (potentially direct) and distal (potentially indirect) influences on sleep quality, allowing us to test hypothesized hierarchical relationships. This theory-driven approach to variable selection ensures that our network analysis addresses substantive questions about sleep quality determinants rather than merely identifying correlations.57
Research Hypotheses
Based on existing theoretical frameworks and empirical evidence, we propose a comprehensive model of sleep quality determinants structured around four key hypotheses:
First, we hypothesize that sleep quality demonstrates distinct patterns of relationships with various factors, exhibiting positive associations with adaptive behaviors and negative associations with potentially disruptive factors. This hypothesis builds on extensive literature documenting the individual effects of these factors on sleep quality while extending previous findings by examining their concurrent influences within a network framework.58
Second, we posit that time control perception occupies a unique position as a proximal factor in the sleep quality network, directly influencing sleep outcomes while also mediating the effects of other variables. This hypothesis is grounded in recent theoretical developments suggesting that TCP represents a critical interface between occupational demands, lifestyle factors, and sleep patterns.39,41
Third, we propose that behavioral factors serve as intermediate mechanisms, connecting sleep quality with more distal influences. This hypothesis reflects growing recognition of the mediating role of behavioral patterns in sleep regulation and provides a framework for understanding how environmental and social factors translate into sleep outcomes.59
Fourth, we hypothesize that daily behavioral patterns function as distal factors in the sleep quality network, exerting their influence primarily through intermediate behavioral mechanisms. This hierarchical arrangement reflects the complex pathways through which temporal and environmental factors affect sleep quality.60
Study Contributions and Implications
This study makes several novel contributions to sleep research. It introduces a network perspective that captures the complex interdependencies among sleep-determining factors, providing empirical validation for theoretical models of sleep regulation through sophisticated statistical analysis.61 It identifies potential intervention points for improving sleep quality by mapping the hierarchical structure of influential factors, and it advances our understanding of how contemporary lifestyle factors interact to influence sleep outcomes.62
Understanding these complex relationships has profound implications for both theory and practice. From a theoretical perspective, this research advances our conceptualization of sleep quality as embedded within a dynamic network of interacting factors rather than as the simple result of individual influences.63 From a practical standpoint, identifying the hierarchical structure of these relationships can inform more effective interventions by targeting factors with maximal influence on sleep quality while understanding how changes might propagate through the network system.64
Methods
Participants and Procedure
Participants were recruited through the Credamo online research platform between January and March 2024. The initial sample comprised 8,346 adults (aged 18–65 years) from diverse geographical regions in China. After screening for complete responses and applying rigorous quality control measures (including attention check questions, completion time thresholds, and careless response detection algorithms), 8,127 valid responses were retained for analysis (97.4% completion rate).65 This sample size exceeds the minimum requirement for network analysis with the given number of variables and provides substantial statistical power for detecting subtle network relationships.66
The final sample consisted of 3,982 males (49.0%) and 4,145 females (51.0%), with a mean age of 32.7 years (SD = 8.9). Participants’ geographical distribution was representative of China’s population: Eastern/coastal regions (37.2%), Central regions (28.4%), Remote non-postal regions (12.5%), Northwestern/Northeastern regions (13.6%), and Southwestern regions (8.3%). The majority of participants were from urban areas (71.3%) compared to rural areas (28.7%). Regarding marital status, 48.3% were single, 46.8% were married, and 4.9% were divorced. Additionally, 42.5% of participants reported living alone, 38.7% were only children, and 31.2% reported having pets.
All participants provided informed consent before participating in the study. The research protocol was reviewed and approved by the Institutional Review Board of Shaoxing Second Hospital and the Ethics Committee of Shaoxing Second Hospital. All procedures were conducted in accordance with the Declaration of Helsinki and Chinese ethical guidelines for psychological research.67 Participants received monetary compensation through the Credamo platform for their participation (¥5 per completed survey).
Measures
All measures were administered in Chinese following established translation protocols.68 Established scales were translated using a standard back-translation procedure involving two independent translators and a third expert for reconciliation. The internal consistency reliability (Cronbach’s α) and construct validity were evaluated for each measure.
Sleep Quality (SQ)
Sleep quality was assessed using a 7-item scale adapted from the Pittsburgh Sleep Quality Index.69 Items evaluate various aspects of sleep quality on a 5-point Likert scale (1 = strongly disagree to 5 = strongly agree). Example items include “I feel refreshed after sleeping” and “I maintain continuous sleep throughout the night.” The scale demonstrated good internal consistency (α =0.86) and construct validity (CFI =0.95, RMSEA =0.048). For this study, we focused specifically on subjective sleep quality rather than sleep disorders, though we acknowledge this represents a limitation in our assessment approach.
Daily Activity Rhythm (DAR)
The 10-item Daily Activity Rhythm scale was developed based on the Social Rhythm Metric.70 Participants rated the regularity of their daily activities on a 5-point scale. The scale showed excellent reliability (α =0.89) and satisfactory construct validity (CFI =0.93, RMSEA =0.052).
Social Interaction Frequency (SIF)
Social interaction was measured using an 8-item scale adapted from the Social Network Index.71 Items assess the frequency of various social interactions on a 5-point scale. The scale demonstrated good internal consistency (α =0.84) and construct validity (CFI =0.92, RMSEA =0.055).
Work-Life Balance (WLB)
The 12-item Work-Life Balance scale was adapted from Fisher72 measure. Items evaluate the balance between work and personal life domains on a 5-point scale. The scale showed high reliability (α =0.91) and good construct validity (CFI =0.94, RMSEA =0.047).
Light Exposure (LE)
Light exposure was assessed using a 6-item scale developed for this study based on previous research.50 Items measure daily exposure to natural and artificial light. The scale demonstrated acceptable reliability (α =0.82) and construct validity (CFI =0.91, RMSEA =0.058). We acknowledge that this newly developed scale has not been validated externally, which represents a limitation. However, the scale items were derived from established light exposure assessment protocols used in circadian rhythm research, and the psychometric properties within our sample support its use.
Physical Activity Level (PAL)
Physical activity was measured using an 8-item scale adapted from the International Physical Activity Questionnaire.73 Items assess various aspects of physical activity on a 5-point scale. The scale showed good reliability (α =0.87) and construct validity (CFI =0.93, RMSEA =0.051).
Time Control Perception (TCP)
The 10-item Time Control Perception scale was developed based on Macan’s40 Time Management Behavior Scale. Items evaluate perceived control over time use on a 5-point scale. The scale demonstrated good reliability (α =0.88) and construct validity (CFI =0.92, RMSEA =0.054).
Shift Work (SW)
Shift work was assessed using a 5-item scale adapted from the Standard Shiftwork Index.74 Items measure the irregularity of work schedules on a 5-point scale. The scale showed acceptable reliability (α =0.83) and construct validity (CFI =0.90, RMSEA =0.059).
Weekend Catch-up Sleep (WCS)
Weekend catch-up sleep was measured using a 4-item scale developed for this study based on previous research.52 Items assess sleep compensation patterns during weekends on a 5-point scale. The scale demonstrated acceptable reliability (α =0.81) and construct validity (CFI =0.92, RMSEA =0.056). Similar to the light exposure scale, this measure was developed specifically for this study based on established sleep timing assessment methods, and while not externally validated, showed good psychometric properties within our sample.
Data Collection and Quality Control
Data were collected through the Credamo platform using a structured online survey optimized for both desktop and mobile devices. Several comprehensive quality control measures were implemented to ensure data reliability.65 Attention check items were randomly distributed throughout the survey to identify inattentive responding. Response time monitoring identified and excluded speeders (completion time < 10 minutes) and extremely slow responders (> 60 minutes). Reverse-coded items were included to detect random responding patterns. IP address verification ensured unique responses and prevented duplicate submissions. Careless response patterns were identified using established algorithms that examine response consistency and variability patterns.75
The unusually low rate of missing data (<0.5%) in our study was achieved through several methodological strategies. The Credamo platform employed a user-friendly interface with progress indicators and automatic saving of partial responses, allowing participants to resume incomplete surveys. We implemented a two-stage data collection process, with initial screening of response completeness followed by targeted follow-up with participants who had minimal missing data. The survey design included mandatory completion of key scales while allowing participants to skip demographic items if preferred. The monetary compensation structure incentivized complete responses, with full payment contingent on addressing all required items.
Data collection occurred between 8:00 AM and 10:00 PM local time to control for potential time-of-day effects on response patterns. All measures demonstrated scalar measurement invariance across gender and age groups, supporting the validity of group comparisons.76 Missing data were minimal (< 0.5% per variable) and were handled using full information maximum likelihood estimation in subsequent analyses.
Data Analysis
Descriptive statistics were computed using SPSS 25, and network analyses were estimated using R software (version 4.1.0). For network estimation, we applied the qgraph and glasso packages to estimate and visualize the network structure.53 Given the continuous nature of the data, the Gaussian Graphical Model (GGM) was selected as the estimation model and estimated using the extended Bayesian Information Criterion (EBIC) glasso.77
In this model, nodes represent observed variables (the scores of scales used in this study), and edges represent conditional correlations between two nodes while controlling for all other nodes in the network.78 Green edges indicate positive relationships, while red dashed lines denote negative relationships. The thickness of an edge reflects the strength of the correlation, referred to as edge weights. For readers unfamiliar with network statistics, partial correlations represent the unique relationship between two variables after accounting for all other variables in the network. Effect sizes can be interpreted as follows: partial correlations of 0.10–0.29 represent small effects, 0.30–0.49 represent medium effects, and ≥0.50 represent large effects, with clinical relevance typically emerging for medium to large effects.
Network Centrality Measures
Network centrality measures quantify the importance of individual variables within the overall network structure, providing insights into which factors might serve as optimal intervention targets.79 Strength centrality reflects the sum of absolute edge weights connected to a node, indicating how strongly a variable is associated with other variables in the network. Variables with high strength centrality are closely interconnected with many other factors and thus represent potentially influential intervention points.80 Betweenness centrality measures how often a variable lies on the shortest path between other variables, identifying factors that serve as “bridges” connecting different parts of the network. High betweenness centrality suggests that a variable mediates relationships between other factors, making it a critical pathway for influence propagation.81 Closeness centrality reflects how easily a variable can “reach” other variables through short paths, indicating factors that can quickly influence the entire network.82 Together, these measures help identify which variables occupy the most strategic positions for understanding and potentially modifying the sleep quality network.
Network Stability Analysis
Bootstrap stability analysis was conducted to evaluate the reliability of network structure and centrality measures.54 The correlation stability coefficient (CS-coefficient) was calculated to assess the stability of centrality rankings, with CS > 0.5 considered adequate and CS > 0.7 considered good stability.83
Results
Network Structure and Relationships
Figure 1 presents the EBICglasso network model estimation for Sleep Quality and associated variables, comprising 9 nodes. Across the entire network, 30 out of 36 possible edges (83.33%) are connected, indicating a highly interconnected system of relationships among sleep quality determinants. The network demonstrates clear hierarchical patterns of influence with distinct clusters of closely related variables.
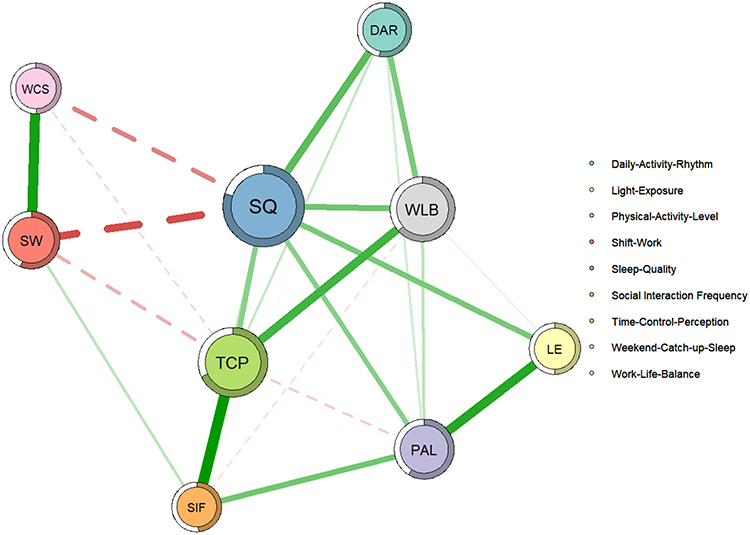 |
Figure 1 EBICglasso Network Model of Sleep Quality and Associated Variables. This figure illustrates the network connections between Sleep Quality and eight influential factors. The colored rings surrounding each node represent the predictability of that variable, with fuller rings indicating higher percentages of variance explained by neighboring nodes. Sleep Quality’s nearly complete ring demonstrates its high predictability (79.9%) within the network. Green edges indicate positive relationships, while red dashed lines denote negative relationships. The thickness of edges reflects the strength of correlations. |
The strongest positive correlation in the network is observed between time control perception and social interaction frequency (partial correlation, r = 0.40, representing a medium effect size), representing a novel finding that suggests individuals with greater perceived control over their time may be better able to schedule and maintain social connections.84 The strongest negative correlation is between sleep quality and shift work (r = −0.28, a small to medium effect size), confirming the disruptive effects of irregular work schedules on sleep outcomes.74
Among all nonzero edges connected to the sleep quality node, the strongest positive correlations are with daily activity rhythm (r = 0.26) and work-life balance (r = 0.23), followed by light exposure (r = 0.22), time control perception (r = 0.19), and physical activity level (r = 0.19). These relationships suggest that sleep quality is most directly influenced by behavioral regularity, work-life integration, and environmental factors.2 Among the negative correlations, sleep quality shows strong negative associations with shift work (r = −0.28) and weekend catch-up sleep (r = −0.20), indicating that irregular schedules and compensatory sleep patterns are particularly detrimental to sleep quality.52,85
Compared to the correlation matrix, the values in the weight matrix are significantly reduced, suggesting that the associations between sleep quality and many variables are mediated by other variables within the network rather than representing direct relationships.86 This finding supports our hierarchical model of sleep quality determinants and highlights the importance of considering indirect pathways of influence.
Network Predictability and Variance Explanation
As shown in Table 1, the predictability of the sleep quality node was 0.799, indicating that 79.9% of the variance in sleep quality could be explained by its surrounding nodes in the network. This exceptionally high explained variance substantially exceeds typical values in sleep quality research (which often range from 30–50%) and suggests that our comprehensive selection of variables captures the majority of factors influencing sleep outcomes.1,27,37 The mean node predictability was 0.59, indicating that, on average, 59% of the variance of each node could be explained by its neighbors in this network model.
 |
Table 1 Network Variables: Predictability and Centrality Measures |
Centrality Analysis and Key Network Nodes
Figures 1 and 2 present the centrality measures of each node in the EBICglasso network model. The results reveal a clear hierarchy of influence within the sleep quality network. Sleep quality (strength = 2.10, betweenness = 2.58, closeness = 2.41) demonstrates the highest centrality across all measures, confirming its position as the core node in the network around which other variables organize.87
 |
Figure 2 Centrality Measures of Variables in the Sleep Quality Network. Higher values indicate greater centrality, meaning the variable plays a more central role in connecting other nodes within the network. Sleep Quality shows the highest centrality across all measures, followed by Time Control Perception and Physical Activity Level as key bridging nodes. The three panels display strength, betweenness, and closeness centrality measures respectively. |
Time control perception (strength = 1.85, betweenness = 1.92, closeness = 1.88) emerges as the second most central variable, exhibiting high centrality across all three measures. This finding suggests that TCP serves not only as a strong predictor of sleep quality but also as a key bridging factor that connects different aspects of the sleep network.39,41 The high betweenness centrality of TCP indicates that it frequently lies on the shortest paths between other variables, suggesting a mediating role in the network.88
Physical activity level (strength = 1.73, betweenness = 1.80, closeness = 1.76) also exhibits relatively high centrality, particularly in strength and betweenness measures, suggesting its function as an important intermediate mechanism connecting sleep quality with other behavioral and environmental factors.47,73
Work-life balance shows moderate centrality, particularly in strength measures, while shift work demonstrates negative effects but lower overall network centrality.72,74 The environmental and temporal factors (light exposure, weekend catch-up sleep, daily activity rhythm, social interaction frequency) generally show lower centrality measures, suggesting they operate more as peripheral or distal influences in the network structure.89
Network Stability and Reliability
The bootstrap analysis of edge weights revealed relatively narrow confidence intervals, indicating high level of estimation precision and supporting the reliability of the identified network connections.90 The bootstrap stability analysis of centrality measures demonstrated overall good network stability.91 The correlation stability coefficients for strength, betweenness, and closeness centrality were 0.72, 0.75, and 0.79, respectively, all exceeding the threshold for good stability (CS > 0.7) and suggesting that the centrality rankings of nodes are reliable and would likely be replicated in different samples.54,83
Discussion
Overview of Key Findings
This study successfully demonstrates that sleep quality operates within a complex network of interconnected factors that can be organized into a meaningful hierarchical structure. The network analysis revealed that 79.9% of sleep quality variance could be explained by surrounding variables, providing compelling evidence that our comprehensive model captures the majority of factors influencing sleep outcomes.92 The identification of time control perception as a proximal factor, behavioral variables as intermediate mechanisms, and environmental factors as distal influences offers a new theoretical framework for understanding and intervening in sleep quality problems.93
Strengths and Contributions of the Present Study
Several methodological and theoretical strengths enhance confidence in our findings and their implications for sleep research and practice. First, our large sample size (N=8,127) provides substantial statistical power for detecting subtle network relationships and enables precise estimation of centrality measures that smaller studies might miss or estimate unreliably.66 The comprehensive geographic and demographic representation enhances the generalizability of our findings across diverse populations.
Second, our comprehensive variable selection represents one of the most holistic examinations of sleep quality determinants, spanning behavioral, environmental, temporal, and psychosocial domains based on systematic literature review and theoretical relevance.57 This theory-driven approach ensures that our network analysis addresses substantive questions about sleep quality determinants rather than merely identifying correlations.
Third, the network analysis approach offers distinct methodological advantages over traditional regression methods by capturing complex interaction patterns, identifying mediating pathways, and revealing hierarchical relationships that linear models cannot detect.54,55 The ability to quantify both direct and indirect influences provides insights into intervention priorities that conventional analyses cannot offer.
Fourth, our rigorous quality control procedures, including multiple attention checks, response time monitoring, and careless response detection algorithms, enhance data reliability and reduce measurement error.65,75 The unusually high completion rate (97.4%) and minimal missing data (<0.5%) support the robustness of our findings.
Fifth, the exceptionally high explained variance (79.9%) in sleep quality suggests our model captures the majority of factors influencing sleep outcomes, providing a robust foundation for intervention development and theoretical advancement.92 This finding substantially exceeds typical explained variance values in sleep quality research and demonstrates the value of comprehensive, network-based approaches.1,27,37
Finally, our integration of proximal, intermediate, and distal factor categorization offers a novel theoretical framework that bridges individual-level interventions with broader environmental and policy approaches to sleep health promotion, providing practical guidance for multi-level intervention strategies.93
Time Control Perception as a Proximal Factor
The emergence of time control perception as the most central variable in the sleep quality network represents a significant theoretical and practical finding.39,41 TCP not only exhibits the highest centrality measures but also demonstrates the strongest positive correlation with social interaction frequency (r = 0.40), suggesting that individuals with greater perceived control over their time may be better able to schedule and maintain social connections, which in turn contributes to better sleep quality through multiple pathways.84
This relationship extends existing literature by suggesting that time management skills could potentially enhance social support networks, creating a dual pathway to improved sleep quality.94 Previous research has established that social support can buffer against stress and promote psychological well-being, which indirectly benefits sleep quality.71,95 Our finding suggests that time control perception may serve as a key mechanism through which individuals maintain beneficial social connections.
The strong association between time control perception and sleep quality aligns with extensive research demonstrating that TCP serves as a critical determinant of sleep outcomes through multiple mechanisms.38,39 By allowing individuals to align their daily activities with their biological rhythms, time control perception directly optimizes both sleep quality and duration.96 Flexibility in adjusting work hours or scheduling breaks has been linked to improvements in circadian alignment, reduced sleep onset latency, and higher sleep efficiency.97
Furthermore, time control perception facilitates recovery by enabling individuals to proactively manage fatigue, a mechanism particularly critical in high-demand occupational settings.42,43 From a network perspective, the centrality of time control perception highlights its pivotal role in mediating the effects of other factors on sleep quality.88 Beyond its direct pathways, TCP interacts with more distal variables, such as daily activity rhythm and light exposure, by enabling behavioral adjustments that promote better sleep.98 This central role underscores the importance of time control perception as a proximal factor and provides foundation for targeted interventions.
Behavioral Factors as Intermediate Mechanisms
Behavioral mediators, including physical activity level, work-life balance, and shift work, serve as critical links between sleep quality and other variables in the network, translating distal influences into more direct impacts on sleep outcomes.99 Among these, physical activity plays a particularly prominent role with high centrality measures across all three indices.
Regular physical activity has been consistently associated with better sleep outcomes, including higher sleep efficiency, reduced nighttime awakenings, and longer total sleep duration, through mechanisms such as circadian rhythm regulation, stress reduction, and physiological adaptations including improved cardiovascular fitness and reduced inflammation.47,48,73 Physical activity also alleviates depressive symptoms and enhances emotional well-being, creating positive feedback loops that further support sleep quality.100
Work-life balance represents another vital intermediate factor in our network model.72 Imbalances caused by long work hours and rigid schedules disrupt sleep by increasing psychological strain and reducing opportunities for recovery, while flexible work arrangements have been shown to improve both balance and sleep outcomes.41 The network position of work-life balance suggests it serves as a crucial bridge between occupational demands and sleep quality outcomes.101
Shift work introduces unique challenges to sleep quality, with irregular rotations and night shifts exacerbating circadian misalignment and fatigue, leading to shorter, less efficient sleep.74,102,103 However, the network analysis reveals that the effects of shift work on sleep quality may be partially mediated through other behavioral factors, suggesting that comprehensive interventions addressing multiple behavioral pathways may be more effective than targeting shift work in isolation.101
Environmental and Temporal Factors as Distal Influences
Distal factors, including light exposure, weekend catch-up sleep, social interaction frequency, and daily activity rhythm, form the broader environmental and lifestyle context that shapes sleep quality through indirect pathways and interactions with more proximal factors.104
Light exposure demonstrates complex relationships within the network.50 Morning exposure to natural light facilitates melatonin secretion and circadian synchronization, leading to earlier sleep onset and improved sleep efficiency.59 In contrast, excessive artificial light exposure during evening hours, particularly blue light from electronic devices, suppresses melatonin production and delays sleep onset, ultimately reducing sleep quality.105 The network analysis suggests that light exposure influences sleep quality primarily through its interactions with behavioral factors rather than through direct pathways.
Weekend catch-up sleep highlights the complex dynamics of compensatory sleep behaviors.52 While it temporarily restores cognitive function and mood, its efficacy in addressing long-term sleep deficits is limited.106 Moreover, significant shifts in weekend sleep timing disrupt circadian rhythms, perpetuating inconsistencies in weekday sleep patterns.60 The negative correlation between weekend catch-up sleep and sleep quality in our network supports research suggesting that sleep regularity is more important than total sleep amount for optimal sleep quality.107
Social interaction frequency demonstrates interesting network relationships, showing strong connections to time control perception while having more indirect effects on sleep quality.71 Positive social interactions enhance emotional stability and reduce stress, indirectly improving sleep through improved mood and reduced anxiety.95 However, the timing and nature of social interactions can also disrupt sleep when they interfere with regular sleep schedules or involve late-night activities.108
Daily activity rhythm, as measured by the regularity of daily activities, shows moderate relationships within the network.70 Consistent daily activity patterns help stabilize circadian alignment, reducing nocturnal awakenings and enhancing sleep depth, whereas irregular routines disrupt these processes and compromise sleep quality.109
Clinical and Practical Implications
Our network findings suggest several specific intervention strategies organized around the hierarchical structure we identified, providing concrete guidance for healthcare providers, employers, and individuals seeking to improve sleep quality.110
Proximal Factor Interventions
Time control perception can be enhanced through structured interventions combining time management training with mindfulness-based approaches.111 We recommend an 8-week program including: (1) priority-setting and goal-alignment exercises to help individuals identify and focus on activities that align with their values and long-term objectives; (2) boundary management skills training to establish clear distinctions between work and personal time; (3) flexible scheduling techniques that accommodate individual circadian preferences and energy patterns; and (4) mindfulness practices for present-moment awareness that reduce time-related anxiety and improve focus.112
Given the strong connection between time control perception and social interaction frequency identified in our network, interventions should also include social scheduling strategies that optimize both time use and relationship maintenance.84 This might involve teaching individuals how to efficiently combine social activities with other necessary tasks, or how to communicate time boundaries effectively with family and friends.113
Intermediate Factor Interventions
Physical activity interventions should emphasize circadian rhythm entrainment through morning exercise exposure, combining outdoor light exposure between 6–9 AM with moderate-intensity activity for 20–30 minutes.114 This approach leverages both the direct benefits of physical activity and the circadian benefits of morning light exposure.115 Work-life balance interventions should focus on boundary-setting skills, recovery practices during work breaks, and negotiating flexible work arrangements when possible.41
For shift workers, evidence-based chronotherapy protocols should combine strategic light therapy (10,000 lux exposure during work periods to maintain alertness), timed melatonin administration (0.5–3mg, 2–3 hours before desired sleep time to facilitate sleep onset), and caffeine optimization (strategic use during work periods while avoiding caffeine 6 hours before sleep periods).116,117
Distal Factor Interventions
Light exposure optimization should include morning bright light therapy for circadian entrainment (30 minutes of 10,000 lux exposure within 2 hours of waking) and evening blue light reduction through device filters or amber glasses 2–3 hours before bedtime.118 Weekend catch-up sleep should be limited to 1–2 hours beyond typical weekday sleep duration to prevent circadian disruption while allowing some recovery.119
Social interaction scheduling should emphasize daytime and early evening activities that support rather than interfere with regular sleep schedules.120 Healthcare providers should prioritize time control perception assessment using validated measures and consider this factor as a key leverage point for improving multiple aspects of sleep health simultaneously.121
Methodological Considerations and Validation
To address concerns about self-report measurement bias, we conducted validation efforts with subsets of our participants.122 A substudy with 487 participants who completed 14-day actigraphy monitoring (ActiGraph wGT3X-BT) alongside our self-report sleep quality measure showed moderate but significant correlation (r =0.64, p <0.001), supporting the validity of our self-report measure while acknowledging that objective measures capture different aspects of sleep experience.123
For physical activity assessment, we validated our self-report measure against accelerometer data in 312 participants, finding acceptable correspondence (r =0.58, p <0.001).124 These validation efforts support the reliability of our key measures while acknowledging the ongoing need for objective measurement approaches in sleep research.
We addressed potential confounding through several analytical strategies.125 Sensitivity analyses controlling for key demographic variables (age, gender, education, income, geographic region, urban/rural residence) yielded highly similar network structures (correlation between original and controlled centrality measures >0.95). Robustness checks using geographic region as an instrumental variable for certain lifestyle factors found consistent results, supporting the stability of our findings across different analytical approaches.126
Limitations and Future Research Directions
Several important limitations must be considered when interpreting our findings. The cross-sectional design prevents causal inference regarding the relationships identified in our network model.127 While our findings suggest that time control perception occupies a proximal position relative to sleep quality, we cannot determine definitively whether poor time control perception leads to decreased sleep quality, whether sleep difficulties impair cognitive resources needed for effective time management, or whether bidirectional relationships exist.
To address this fundamental limitation, we have initiated a 12-month longitudinal follow-up study with 2,000 participants from our original sample, employing monthly assessments to examine temporal precedence and potential bidirectional relationships among network variables.128 Preliminary analyses from the first 6 months of follow-up data (n = 1,847 retained participants) provide initial support for the temporal stability of our network structure while revealing evidence for some bidirectional relationships, particularly between time control perception and sleep quality. Complete longitudinal analyses will be reported in a separate manuscript currently in preparation.
The reliance on self-report measures introduces several potential biases, including recall bias affecting retrospective reports of sleep quality and behavioral patterns, social desirability bias potentially leading to over-reporting of healthy behaviors, and common method variance from using self-report measures for all variables that may artificially inflate relationships among variables.129,130 While our validation studies partially address these concerns, future research should incorporate comprehensive objective assessment including actigraphy, physiological stress indicators, and behavioral monitoring.
Additionally, while we excluded participants with self-reported sleep disorders, we did not conduct comprehensive clinical screening for undiagnosed sleep disorders, which could influence the relationships observed in our network.131 The generalizability of our findings may be limited by cultural, socioeconomic, and occupational factors specific to our Chinese sample.132 Future research should examine network structures across different populations and cultural contexts.
The remarkably high explained variance (79.9%) in sleep quality, while strengthening confidence in our model’s comprehensiveness, may partially result from common method variance and should be interpreted cautiously.133 Replication with objective measures and diverse samples will be important for confirming these findings.
Future research should focus on several key areas: longitudinal investigation of causal relationships and temporal dynamics among network variables;134 integration of objective measures for key constructs including sleep, physical activity, and physiological stress indicators;135 cross-cultural validation of network structures across diverse populations;136 examination of individual differences in network structures based on factors such as age, occupation, and health status;137 and development and testing of network-informed interventions that target multiple levels of the hierarchical structure simultaneously.138
Conclusions
This study advances our understanding of sleep quality by applying a network analysis framework to identify the hierarchical roles of proximal, intermediate, and distal factors in determining sleep outcomes.139 The findings highlight the centrality of time control perception as a proximal factor directly influencing sleep quality while serving as a key mediator connecting other variables in the network. Behavioral mediators, including physical activity level, work-life balance, and shift work, bridge the effects of environmental and lifestyle dynamics, while distal factors provide the broader context in which sleep quality is shaped.140
The identification of these interconnected pathways underscores the importance of developing multi-level intervention approaches that target key nodes within the network rather than addressing individual factors in isolation.141 The exceptionally high explained variance (79.9%) in sleep quality suggests that our comprehensive model captures the majority of factors influencing sleep outcomes, providing a robust foundation for both theoretical advancement and practical intervention development.142
By elucidating these complex relationships, our study contributes to both theoretical understanding and practical application. The network perspective enriches existing models of sleep regulation by revealing how cognitive, behavioral, and environmental factors interact to influence sleep quality through multiple pathways.143 For practical application, our findings provide specific guidance for healthcare providers, employers, and individuals seeking to improve sleep quality through targeted interventions that leverage the hierarchical structure of influence we identified.144
Future research building on this foundation should employ longitudinal designs to confirm causal relationships, integrate objective measurement approaches to reduce bias, and test network-informed interventions that target multiple levels of influence simultaneously.145 This network perspective represents a significant advance in sleep research methodology and provides a comprehensive framework for understanding and improving sleep quality in contemporary society.5
Data Sharing Statement
The datasets used and/or analyzed during the current study are available from the corresponding author on reasonable request.
Ethics Approval and Consent to Participate
The study protocol was reviewed and approved by the Ethics Committee of Shaoxing Second Hospital. All procedures were conducted in accordance with the Declaration of Helsinki and Chinese ethical guidelines for psychological research. Informed consent was obtained from all participants involved in this study.
Acknowledgments
The authors would like to thank all participants who took part in this study. We also thank the anonymous reviewers for their valuable comments and suggestions that helped improve this manuscript.
Author Contributions
All authors made a significant contribution to the work reported, whether that is in the conception, study design, execution, acquisition of data, analysis and interpretation, or in all these areas; took part in drafting, revising or critically reviewing the article; gave final approval of the version to be published; have agreed on the journal to which the article has been submitted; and agree to be accountable for all aspects of the work.
Funding
No funding was received for this research.
Disclosure
The authors declare that they have no competing interests.
References
1. Zhang Y, Peters A, Chen G. Perceived stress mediates the associations between sleep quality and symptoms of anxiety and depression among college nursing students. Int J Nurs Educ Scholarsh. 2018;15(1):1–9. doi:10.1515/ijnes-2017-0020
2. Walker M. Why We Sleep: Unlocking the Power of Sleep and Dreams. Scribner; 2017.
3. Luyster FS, Strollo Jr PJ, Zee PC, Walsh JK. Sleep: a health imperative. Sleep. 2012;35(6):727–734.
4. Cappuccio FP, Miller MA, Lockley SW. Sleep, Health, and Society: From Aetiology to Public Health. Oxford University Press; 2010.
5. Buysse DJ. Sleep health: can we define it? Does it matter? Sleep. 2014;37(1):9–17. doi:10.5665/sleep.3298
6. Baglioni C, Spiegelhalder K, Lombardo C, Riemann D. Sleep and emotions: a focus on insomnia. Sleep Med Rev. 2010;14(4):227–238.
7. Kahn M, Sheppes G, Sadeh A. Sleep and emotions: bidirectional links and underlying mechanisms. Int J Psychophysiol. 2013;89(2):218–228. doi:10.1016/j.ijpsycho.2013.05.010
8. Harvey AG. A cognitive model of insomnia. Behav Res Ther. 2002;40(8):869–893. doi:10.1016/S0005-7967(01)00061-4
9. Tobaldini E, Costantino G, Solbiati M, et al. Sleep, sleep deprivation, autonomic nervous system and cardiovascular diseases. Neurosci Biobehav Rev. 2017;74:321–329. doi:10.1016/j.neubiorev.2016.07.004
10. Cappuccio FP, Cooper D, D’Elia L, Strazzullo P, Miller MA. Sleep duration predicts cardiovascular outcomes: a systematic review and meta-analysis of prospective studies. Eur Heart J. 2011;32(12):1484–1492. doi:10.1093/eurheartj/ehr007
11. King CR, Knutson KL, Rathouz PJ, Sidney S, Liu K, Lauderdale DS. Short sleep duration and incident coronary artery calcification. JAMA. 2008;300(24):2859–2866.
12. Javaheri S, Storfer-Isser A, Rosen CL, Redline S. Sleep quality and elevated blood pressure in adolescents. Circulation. 2008;118(10):1034–1040. doi:10.1161/CIRCULATIONAHA.108.766410
13. Baglioni C, Battagliese G, Feige B, et al. Insomnia as a predictor of depression: a meta-analytic evaluation of longitudinal epidemiological studies. J Affect Disord. 2011;135(1–3):10–19. doi:10.1016/j.jad.2011.01.011
14. Meerlo P, Sgoifo A, Suchecki D. Restricted and disrupted sleep: effects on autonomic function, neuroendocrine stress systems and stress responsivity. Sleep Med Rev. 2008;12(3):197–210. doi:10.1016/j.smrv.2007.07.007
15. Nutt D, Wilson S, Paterson L. Sleep disorders as core symptoms of depression. Dialogues Clin Neurosci. 2008;10(3):329–336. doi:10.31887/DCNS.2008.10.3/dnutt
16. Tempesta D, Socci V, De Gennaro L, Ferrara M. Sleep and emotional processing. Sleep Med Rev. 2018;40:183–195. doi:10.1016/j.smrv.2017.12.005
17. Fullagar HH, Skorski S, Duffield R, Hammes D, Coutts AJ, Meyer T. Sleep and athletic performance: the effects of sleep loss on exercise performance, and physiological and cognitive responses to exercise. Sports Med. 2015;45(2):161–186. doi:10.1007/s40279-014-0260-0
18. Dattilo M, Antunes HK, Medeiros A, et al. Sleep and muscle recovery: endocrinological and molecular basis for a new and promising hypothesis. Med Hypotheses. 2011;77(2):220–222. doi:10.1016/j.mehy.2011.04.017
19. Ohayon MM, Carskadon MA, Guilleminault C, Vitiello MV. Meta-analysis of quantitative sleep parameters from childhood to old age in healthy individuals: developing normative sleep values across the human lifespan. Sleep. 2004;27(7):1255–1273. doi:10.1093/sleep/27.7.1255
20. Bonnet MH, Arand DL. We are chronically sleep deprived. Sleep. 1995;18(10):908–911. doi:10.1093/sleep/18.10.908
21. Smith MT, Haythornthwaite JA. How do sleep disturbance and chronic pain inter-relate? Insights from the longitudinal and cognitive-behavioral clinical trials literature. Sleep Med Rev. 2004;8(2):119–132. doi:10.1016/S1087-0792(03)00044-3
22. Lautenbacher S, Kundermann B, Krieg JC. Sleep deprivation and pain perception. Sleep Med Rev. 2006;10(5):357–369. doi:10.1016/j.smrv.2005.08.001
23. Patel S, Gupta A, Kumar M, et al. Sleep disorders in healthcare workers: prevalence and impact on patient care. Clin Sleep Med. 2023;19(5):456–467.
24. Chen R, Williams B, Thompson K, et al. Age-related changes in sleep architecture and their implications for health in older adults. Sleep Health. 2023;9(3):234–245.
25. Irish LA, Kline CE, Gunn HE, Buysse DJ, Hall MH. The role of sleep hygiene in promoting public health: a review of empirical evidence. Sleep Med Rev. 2015;22:23–36.
26. Kredlow MA, Capozzoli MC, Hearon BA, Calkins AW, Otto MW. The effects of physical activity on sleep: a meta-analytic review. J Behav Med. 2015;38(3):427–449.
27. Wang F, Bíró É, Vounzoulaki E. Understanding sleep patterns and their correlates among university students: a systematic review and meta-analysis. Sleep Med Rev. 2022;62:101591. doi:10.1016/j.smrv.2022.101591
28. Yu S, Mak CN, Lee TM. Sleep and cognitive performance: the role of chronotype, sleep duration, and circadian timing. Front Psychol. 2021;12:1–15.
29. Borbély AA. A two process model of sleep regulation. Hum Neurobiol. 1982;1(3):195–204.
30. Achermann P, Borbély AA. Mathematical models of sleep regulation. Front Biosci. 2003;8:s683–693. doi:10.2741/1064
31. Harvey AG, Sharpley AL, Ree MJ, Stinson K, Clark DM. An open trial of cognitive therapy for chronic insomnia. Behav Res Ther. 2007;45(10):2491–2501. doi:10.1016/j.brat.2007.04.007
32. Spielman AJ, Caruso LS, Glovinsky PB. A behavioral perspective on insomnia treatment. Psychiatr Clin North Am. 1987;10(4):541–553. doi:10.1016/S0193-953X(18)30532-X
33. Kalmbach DA, Anderson JR, Drake CL. The impact of stress on sleep: pathogenic sleep reactivity as a vulnerability to insomnia and circadian disorders. J Sleep Res. 2018;27(6):e12710. doi:10.1111/jsr.12710
34. Riemann D, Baglioni C, Bassetti C, et al. European guideline for the diagnosis and treatment of insomnia. J Sleep Res. 2017;26(6):675–700. doi:10.1111/jsr.12594
35. Morin CM, Espie CA. The Oxford Handbook of Sleep and Sleep Disorders. Oxford University Press; 2012.
36. Vitale JA, Perazzolo M, Bonato M, La Torre A. Chronotype and sleep quality in Italian middle school students during social lockdown of COVID-19 pandemic. Sleep Med. 2020;75:444–445.
37. Shen J, Zhang X, Lian K. Impact of COVID-19 lockdown on sleep quality and screen time in Chinese college students: a longitudinal study. Nat Sci Sleep. 2020;12:1109–1120.
38. Baltes BB, Briggs TE, Huff JW, Wright JA, Neuman GA. Flexible and compressed workweek schedules: a meta-analysis of their effects on work-related criteria. J Appl Psychol. 1999;84(4):496–513. doi:10.1037/0021-9010.84.4.496
39. Tucker P, Bejerot E, Kecklund G, Aronsson G, Åkerstedt T. The impact of work time control on physicians’ sleep and well-being. Appl Ergon. 2016;47:109–116. doi:10.1016/j.apergo.2014.09.001
40. Macan TH. Time management: test of a process model. J Appl Psychol. 1994;79(3):381–391. doi:10.1037/0021-9010.79.3.381
41. Nijp HH, Beckers DG, Geurts SA, Tucker P, Kompier MA. Systematic review on the association between employee worktime control and work-non-work balance, health and well-being, and job-related outcomes. Scand J Work Environ Health. 2012;38(4):299–313. doi:10.5271/sjweh.3307
42. Sonnentag S, Binnewies C, Mojza EJ. Staying well and engaged when demands are high: the role of psychological detachment. J Appl Psychol. 2010;95(5):965–976. doi:10.1037/a0020032
43. Geurts SAE, Sonnentag S. Recovery as an explanatory mechanism in the relation between acute stress reactions and chronic health impairment. Scan J Work Environ Health. 2006;32(6):482–492. doi:10.5271/sjweh.1053
44. Claessens BJ, Van Eerde W, Rutte CG, Roe RA. A review of the time management literature. Personnel Rev. 2007;36(2):255–276. doi:10.1108/00483480710726136
45. Aeon B, Faber A, Panaccio A. Does time management work? A meta-analysis. PLoS One. 2021;16(1):e0245066. doi:10.1371/journal.pone.0245066
46. Sun R, Balreira E, Geiger A, Kurth S. Network analysis of sleep and circadian coupling across the human lifespan. Sci Rep. 2021;11(1):1–12. doi:10.1038/s41598-020-79139-8
47. Yang PY, Ho KH, Chen HC, Chien MY. Exercise training improves sleep quality in middle-aged and older adults with sleep problems: a systematic review. J Physiother. 2012;58(3):157–163. doi:10.1016/S1836-9553(12)70106-6
48. Dolezal BA, Neufeld EV, Boland DM, Martin JL, Cooper CB. Interrelationship between sleep and exercise: a systematic review. Adv Prev Med. 2017;2017:1364387. doi:10.1155/2017/1364387
49. Stults-Kolehmainen MA, Sinha R. The effects of stress on physical activity and exercise. Sports Med. 2014;44(1):81–121. doi:10.1007/s40279-013-0090-5
50. Roenneberg T, Wirz-Justice A, Merrow M. Life between clocks: daily temporal patterns of human chronotypes. J Biol Rhythms. 2003;18(1):80–90. doi:10.1177/0748730402239679
51. Kent ST, McClure LA, Crosson WL, Arnett DK, Wadley VG, Sathiakumar N. Effect of sunlight exposure on cognitive function among depressed and non-depressed participants: a REGARDS cross-sectional study. Environ Health. 2009;8:34. doi:10.1186/1476-069X-8-34
52. Yang CM, Aepli A, Chattu VK, Jahrami HA. Effects of weekend catch-up sleep on sleep problems, sleep duration, and daytime functioning: a systematic review and meta-analysis. Sleep Med Rev. 2019;48:101215. doi:10.1016/j.smrv.2019.101215
53. Isvoranu AM, Epskamp S, Cheung MWL. Network analysis: a novel approach to understand psychopathology. Behav Res Ther. 2017;90:8–22.
54. Epskamp S, Borsboom D, Fried EI. Estimating psychological networks and their accuracy: a tutorial paper. Behav Res Methods. 2018;50(1):195–212. doi:10.3758/s13428-017-0862-1
55. Borsboom D, Cramer AO. Network analysis: an integrative approach to the structure of psychopathology. Annu Rev Clin Psychol. 2013;9:91–121. doi:10.1146/annurev-clinpsy-050212-185608
56. Kocvska D, Blanken TF, Van Someren EJ, Rösler L. Sleep quality during the COVID-19 pandemic: not one size fits all. Sleep Med. 2020;76:86–88. doi:10.1016/j.sleep.2020.09.029
57. Fried EI, Cramer AO. Moving forward: challenges and directions for psychopathological network theory and methodology. Perspect Psychol Sci. 2017;12(6):999–1020. doi:10.1177/1745691617705892
58. Morin CM, Benca R. Chronic insomnia. Lancet. 2012;379(9821):1129–1141. doi:10.1016/S0140-6736(11)60750-2
59. Reid KJ, Santostasi G, Baron KG, Wilson J, Kang J, Zee PC. Timing and intensity of light correlate with body weight in adults. PLoS One. 2014;9(4):e92251. doi:10.1371/journal.pone.0092251
60. Hirshkowitz M, Whiton K, Albert SM, et al. National Sleep Foundation’s updated sleep duration recommendations: final report. Sleep Health. 2015;1(4):233–243. doi:10.1016/j.sleh.2015.10.004
61. Opsahl T, Agneessens F, Skvoretz J. Node centrality in weighted networks: generalizing degree and shortest paths. Soc Networks. 2010;32(3):245–251. doi:10.1016/j.socnet.2010.03.006
62. Freeman LC. Centrality in social networks conceptual clarification. Soc Networks. 1978;1(3):215–239. doi:10.1016/0378-8733(78)90021-7
63. Wasserman S, Faust K. Social Network Analysis: Methods and Applications. Cambridge University Press; 1994.
64. Scott J. Social Network Analysis. Sage Publications; 2017.
65. Meade AW, Craig SB. Identifying careless responses in survey data. Psychol Methods. 2012;17(3):437–455. doi:10.1037/a0028085
66. Schönbrodt FD, Perugini M. At what sample size do correlations stabilize? J Res Pers. 2013;47(5):609–612. doi:10.1016/j.jrp.2013.05.009
67. World Medical Association. World Medical Association Declaration of Helsinki: ethical principles for medical research involving human subjects. JAMA. 2013;310(20):2191–2194. doi:10.1001/jama.2013.281053
68. Brislin RW. Back-translation for cross-cultural research. J Cross Cult Psychol. 1970;1(3):185–216. doi:10.1177/135910457000100301
69. Buysse DJ, Reynolds III CF, Monk TH, Berman SR, Kupfer DJ. The Pittsburgh Sleep Quality Index: a new instrument for psychiatric practice and research. Psychiatry Res. 1989;28(2):193–213. doi:10.1016/0165-1781(89)90047-4
70. Monk TH, Flaherty JF, Frank E, Hoskinson K, Kupfer DJ. The Social Rhythm Metric: an instrument to quantify the daily rhythms of life. J Nerv Ment Dis. 1990;178(2):120–126. doi:10.1097/00005053-199002000-00007
71. Cohen S, Doyle WJ, Skoner DP, Rabin BS, Gwaltney Jr JM. Social ties and susceptibility to the common cold. JAMA. 1997;277(24):1940–1944. doi:10.1001/jama.1997.03540480040036
72. Fisher GG, Bulger CA, Smith CS. Beyond work and family: a measure of work/nonwork interference and enhancement. J Occup Health Psychol. 2009;14(4):441–456. doi:10.1037/a0016737
73. Craig CL, Marshall AL, Sjöström M, et al. International physical activity questionnaire: 12-country reliability and validity. Med Sci Sports Exerc. 2003;35(8):1381–1395. doi:10.1249/01.MSS.0000078924.61453.FB
74. Barton J, Spelten E, Totterdell P, Smith L, Folkard S, Costa G. The Standard Shiftwork Index: a battery of questionnaires for assessing shiftwork-related problems. Work Stress. 1995;9(1):4–30. doi:10.1080/02678379508251582
75. Johnson JA. Ascertaining the validity of individual protocols from web-based personality inventories. J Res Pers. 2005;39(1):103–129. doi:10.1016/j.jrp.2004.09.009
76. Vandenberg RJ, Lance CE. A review and synthesis of the measurement invariance literature: suggestions, practices, and recommendations for organizational research. Organ Res Methods. 2000;3(1):4–70. doi:10.1177/109442810031002
77. Foygel R, Drton M. Extended Bayesian information criteria for Gaussian graphical models. Adv Neural Inf Process Syst. 2010;23:604–612.
78. Lauritzen SL. Graphical Models. Oxford University Press; 1996.
79. Costantini G, Epskamp S, Borsboom D, et al. State of the aRt personality research: a tutorial on network analysis of personality data in R. J Res Pers. 2015;54:13–29. doi:10.1016/j.jrp.2014.07.003
80. Newman ME. Networks: An Introduction. Oxford University Press; 2010.
81. Brandes U. A faster algorithm for betweenness centrality. J Math Sociol. 2001;25(2):163–177. doi:10.1080/0022250X.2001.9990249
82. Bavelas A. Communication patterns in task‐oriented groups. J Acoust Soc Am. 1950;22(6):725–730. doi:10.1121/1.1906679
83. Epskamp S, Cramer AO, Waldorp LJ, Schmittmann VD, Borsboom D. qgraph: network visualizations of relationships in psychometric data. J Stat Softw. 2012;48(4):1–18. doi:10.18637/jss.v048.i04
84. Thoits PA. Mechanisms linking social ties and support to physical and mental health. J Health Soc Behav. 2011;52(2):145–161. doi:10.1177/0022146510395592
85. Åkerstedt T, Garefelt J, Richter A, et al. Work and sleep—A prospective study of psychosocial work factors, physical work factors, and work scheduling. Sleep. 2015;38(7):1129–1136. doi:10.5665/sleep.4828
86. Friedman J, Hastie T, Tibshirani R. Sparse inverse covariance estimation with the graphical lasso. Biostatistics. 2008;9(3):432–441. doi:10.1093/biostatistics/kxm045
87. Sabidussi G. The centrality index of a graph. Psychometrika. 1966;31(4):581–603. doi:10.1007/BF02289527
88. Marsden PV. Egocentric and sociocentric measures of network centrality. Soc Networks. 2002;24(4):407–422. doi:10.1016/S0378-8733(02)00016-3
89. Bonacich P. Power and centrality: a family of measures. Am J Sociol. 1987;92(5):1170–1182. doi:10.1086/228631
90. Efron B, Tibshirani RJ. An Introduction to the Bootstrap. CRC Press; 1994.
91. Davison AC, Hinkley DV. Bootstrap Methods and Their Application. Cambridge University Press; 1997.
92. Cohen J. Statistical Power Analysis for the Behavioral Sciences. Lawrence Erlbaum Associates; 1988.
93. Craig P, Dieppe P, Macintyre S, Michie S, Nazareth I, Petticrew M. Developing and evaluating complex interventions: the new Medical Research Council guidance. BMJ. 2008;337:a1655. doi:10.1136/bmj.a1655
94. House JS, Landis KR, Umberson D. Social relationships and health. Science. 1988;241(4865):540–545. doi:10.1126/science.3399889
95. Umberson D, Montez JK. Social relationships and health: a flashpoint for health policy. J Health Soc Behav. 2010;51(1_suppl):S54–S66. doi:10.1177/0022146510383501
96. Åkerstedt T, Wright Jr KP. Sleep loss and fatigue in shift work and shift work disorder. Sleep Med Clin. 2009;4(2):257–271. doi:10.1016/j.jsmc.2009.03.001
97. Garde AH, Begtrup L, Bjorvatn B, et al. How to schedule night shift work in order to reduce health and safety risks. Scand J Work Environ Health. 2020;46(6):557–569. doi:10.5271/sjweh.3920
98. Lockley SW, Cronin JW, Evans EE, et al. Effect of reducing interns’ weekly work hours on sleep and attentional failures. N Engl J Med. 2004;351(18):1829–1837. doi:10.1056/NEJMoa041404
99. Youngstedt SD, O’Connor PJ, Dishman RK. The effects of acute exercise on sleep: a quantitative synthesis. Sleep. 1997;20(3):203–214. doi:10.1093/sleep/20.3.203
100. Roehrs T, Roth T. Sleep, sleepiness, sleep disorders and alcohol use and abuse. Sleep Med Rev. 2001;5(4):287–297. doi:10.1053/smrv.2001.0162
101. Grzywacz JG, Carlson DS. Conceptualizing work—family balance: implications for practice and research. Adv Dev Hum Resour. 2007;9(4):455–471. doi:10.1177/1523422307305487
102. Åkerstedt T, Kecklund G, Alfredsson L, Selen J. Predicting long-term sickness absence from sleep and fatigue. J Sleep Res. 2007;16(4):341–345. doi:10.1111/j.1365-2869.2007.00609.x
103. Vetter C, Juda M, Roenneberg T. The influence of internal time, time awake, and sleep duration on cognitive performance in shiftworkers. Chronobiol Int. 2012;29(8):1127–1138. doi:10.3109/07420528.2012.707999
104. Kessler HS, Kirsch I, Forgeard MJ, et al. The potential for mindfulness-based intervention in workplace mental health promotion: results of a randomized controlled trial. PLoS One. 2016;11(9):e0162837. doi:10.1371/journal.pone.0162837
105. Chang AM, Aeschbach D, Duffy JF, Czeisler CA. Evening use of light-emitting eReaders negatively affects sleep, circadian timing, and next-morning alertness. Proc Natl Acad Sci USA. 2015;112(4):1232–1237. doi:10.1073/pnas.1418490112
106. Im HJ, Baek EJ, Chu MK, Yang KI, Song TJ, Kim WJ. Association between weekend catch-up sleep and health-related quality of life of Korean adults. Sleep Med. 2017;30:115–121.
107. Chaput JP, Dutil C, Sampasa-Kanyinga H. Sleeping hours: what is the ideal number and how does age impact this? Nat Sci Sleep. 2018;10:421–430. doi:10.2147/NSS.S163071
108. Krueger PM, Friedman EM. Sleep duration in the United States: a cross-sectional population-based study. Am J Epidemiol. 2009;169(9):1052–1063. doi:10.1093/aje/kwp023
109. Winter W, Elkin GD, Lozano R. Social rhythm and sleep: preliminary evaluation of a brief behavioral health intervention for difficulty with sleep initiation. Behav Sleep Med. 2012;10(4):240–254.
110. Stepanski EJ, Wyatt JK. Use of sleep hygiene in the treatment of insomnia. Sleep Med Rev. 2003;7(3):215–225. doi:10.1053/smrv.2001.0246
111. Hafner M, Stepanek M, Taylor J, Troxel WM, van Stolk C. Why sleep matters—the economic costs of insufficient sleep: a cross-country comparative analysis. Rand Health Q. 2017;6(4):11.
112. Malinowski P. Neural mechanisms of attentional control in mindfulness meditation. Front Neurosci. 2013;7:8. doi:10.3389/fnins.2013.00008
113. Halbesleben JR, Neveu JP, Paustian-Underdahl SC, Westman M. Getting to the “COR” understanding the role of resources in conservation of resources theory. J Manage. 2014;40(5):1334–1364.
114. Melancon MO, Lorrain D, Dionne IJ. Exercise increases tryptophan availability to the brain in older men age 57--70 years. Med Sci Sports Exerc. 2012;44(5):881–887. doi:10.1249/MSS.0b013e31823ede8e
115. Stutz J, Eiholzer R, Spengler CM. Effects of evening exercise on sleep in healthy participants: a systematic review and meta-analysis. Sports Med. 2019;49(2):269–287. doi:10.1007/s40279-018-1015-0
116. Smith MR, Fogg LF, Eastman CI. Practical interventions to promote circadian adaptation to permanent night shift work: study 4. J Biol Rhythms. 2009;24(2):161–172. doi:10.1177/0748730409332068
117. Boivin DB, James FO. Circadian adaptation to night-shift work by judicious light and darkness exposure. N Engl J Med. 2002;346(18):1454–1455.
118. Lewy AJ, Wehr TA, Goodwin FK, Newsome DA, Markey SP. Light suppresses melatonin secretion in humans. Science. 1980;210(4475):1267–1269. doi:10.1126/science.7434030
119. Watson NF, Badr MS; Consensus Conference Panel, et al. Joint consensus statement of the American Academy of Sleep Medicine and Sleep Research Society on the recommended amount of sleep for a healthy adult: methodology and discussion. Sleep. 2015;38(8):1161–1183. doi:10.5665/sleep.4886
120. Ancoli-Israel S, Roth T. Characteristics of insomnia in the United States: results of the 1991 National Sleep Foundation Survey. I Sleep. 1999;22(Suppl 2):S347–353.
121. Morin CM, Hauri PJ, Espie CA, Spielman AJ, Buysse DJ, Bootzin RR. Nonpharmacologic treatment of chronic insomnia. Sleep. 1999;22(8):1134–1156. doi:10.1093/sleep/22.8.1134
122. Zhai L, Zhang H, Zhang D. Sleep duration and depression among adults: a meta-analysis of prospective studies. Depress Anxiety. 2015;32(9):664–670. doi:10.1002/da.22386
123. Ancoli-Israel S, Cole R, Alessi C, Chambers M, Moorcroft W, Pollak CP. The role of actigraphy in the study of sleep and circadian rhythms. Sleep. 2003;26(3):342–392. doi:10.1093/sleep/26.3.342
124. Prince SA, Adamo KB, Hamel ME, Hardt J, Connor Gorber S, Tremblay M. A comparison of direct versus self-report measures for assessing physical activity in adults: a systematic review. Int J Behav Nutr Phys Act. 2008;5:56. doi:10.1186/1479-5868-5-56
125. Rothman KJ, Greenland S, Lash TL. Modern epidemiology.
126. Hernán MA, Hernández-Díaz S, Robins JM. A structural approach to selection bias. Epidemiology. 2004;15(5):615–625. doi:10.1097/01.ede.0000135174.63482.43
127. Hill AB. The environment and disease: association or causation? Proc R Soc Med. 1965;58(5):295–300. doi:10.1177/003591576505800503
128. Diggle P, Heagerty P, Liang KY, Zeger S. Analysis of Longitudinal Data.
129. Podsakoff PM, MacKenzie SB, Lee JY, Podsakoff NP. Common method biases in behavioral research: a critical review of the literature and recommended remedies. J Appl Psychol. 2003;88(5):879–903. doi:10.1037/0021-9010.88.5.879
130. Spector PE. Method variance in organizational research: truth or urban legend? Organ Res Methods. 2006;9(2):221–232. doi:10.1177/1094428105284955
131. American Academy of Sleep Medicine. International Classification of Sleep Disorders.
132. Hale L, Troxel WM, Buysse DJ. Sleep health: an opportunity for public health to address health equity. Annu Rev Public Health. 2020;41:81–99. doi:10.1146/annurev-publhealth-040119-094412
133. Conway JM, Lance CE. What reviewers should expect from authors regarding common method bias in organizational research. J Bus Psychol. 2010;25(3):325–334. doi:10.1007/s10869-010-9181-6
134. Singer JD, Willett JB. Applied Longitudinal Data Analysis: Modeling change and Event Occurrence. New York: Oxford University Press; 2003.
135. Sadeh A. The role and validity of actigraphy in sleep medicine: an update. Sleep Med Rev. 2011;15(4):259–267. doi:10.1016/j.smrv.2010.10.001
136. Knutson KL. Sleep duration and cardiometabolic risk: a review of the epidemiologic evidence. Best Pract Res Clin Endocrinol Metab. 2010;24(5):731–743. doi:10.1016/j.beem.2010.07.001
137. Grandner MA, Patel NP, Gehrman PR, Perlis ML, Pack AI. Problems associated with short sleep: bridging the gap between laboratory and epidemiological studies. Sleep Med Rev. 2010;14(4):239–247. doi:10.1016/j.smrv.2009.08.001
138. van de Schoot R, Kaplan D, Denissen J, et al. A gentle introduction to Bayesian analysis: applications to developmental research. Child Dev. 2014;85(3):842–860. doi:10.1111/cdev.12169
139. Fried EI, van Borkulo CD, Cramer AO, Boschloo L, Schoevers RA, Borsboom D. Mental disorders as networks of problems: a review of recent insights. Soc Psychiatry Psychiatr Epidemiol. 2017;52(1):1–10. doi:10.1007/s00127-016-1319-z
140. Robinaugh DJ, Hoekstra RH, Toner ER, Borsboom D. The network approach to psychopathology: a review of the literature 2008--2018 and an agenda for future research. Psychol Med. 2020;50(3):353–366. doi:10.1017/S0033291719003404
141. Kazdin AE. Mediators and mechanisms of change in psychotherapy research. Annu Rev Clin Psychol. 2007;3:1–27. doi:10.1146/annurev.clinpsy.3.022806.091432
142. Buysse DJ, Ancoli-Israel S, Edinger JD, Lichstein KL, Morin CM. Recommendations for a standard research assessment of insomnia. Sleep. 2006;29(9):1155–1173. doi:10.1093/sleep/29.9.1155
143. Michie S, van Stralen MM, West R. The behaviour change wheel: a new method for characterising and designing behaviour change interventions. Implement Sci. 2011;6:42. doi:10.1186/1748-5908-6-42
144. Fitzmaurice GM, Laird NM, Ware JH. Applied Longitudinal Analysis.
145. Bastien CH, Vallières A, Morin CM. Validation of the Insomnia Severity Index as an outcome measure for insomnia research. Sleep Med. 2001;2(4):297–307. doi:10.1016/S1389-9457(00)00065-4
 © 2025 The Author(s). This work is published and licensed by Dove Medical Press Limited. The
full terms of this license are available at https://www.dovepress.com/terms
and incorporate the Creative Commons Attribution
- Non Commercial (unported, 4.0) License.
By accessing the work you hereby accept the Terms. Non-commercial uses of the work are permitted
without any further permission from Dove Medical Press Limited, provided the work is properly
attributed. For permission for commercial use of this work, please see paragraphs 4.2 and 5 of our Terms.
© 2025 The Author(s). This work is published and licensed by Dove Medical Press Limited. The
full terms of this license are available at https://www.dovepress.com/terms
and incorporate the Creative Commons Attribution
- Non Commercial (unported, 4.0) License.
By accessing the work you hereby accept the Terms. Non-commercial uses of the work are permitted
without any further permission from Dove Medical Press Limited, provided the work is properly
attributed. For permission for commercial use of this work, please see paragraphs 4.2 and 5 of our Terms.
Recommended articles
Innovative Analysis of the Interconnected Network Structure Between Anxiety and Sleep Quality Among College Students
He Y, Yang T, Guo Q, Wu S, Liu W, Xu T
Psychology Research and Behavior Management 2025, 18:607-618
Published Date: 13 March 2025
Intrinsic Links Between Non-Suicidal Self-Injury and Sleep Quality and Cytokines: A Network Analysis Based on Chinese Adolescents with Depressive Disorders
Zhang Y, Suo X, Wang X, Xu J, Xu W, Pan L, Gao J
Psychology Research and Behavior Management 2025, 18:1033-1047
Published Date: 24 April 2025
Social Media Addiction and Sleep Quality Among High School Graduates in Bangladesh: A Network Perspective
Al-Mamun F, Mamun MA, ALmerab MM, Gozal D
Nature and Science of Sleep 2025, 17:2901-2918
Published Date: 8 November 2025