Back to Journals » Journal of Inflammation Research » Volume 16
Unveiling FOS as a Potential Diagnostic Biomarker and Emetine as a Prospective Therapeutic Agent for Diabetic Nephropathy
Authors Lin J ![]() , Li X, Lin Y
, Li X, Lin Y ![]() , Huang Z, He F, Xiong F
, Huang Z, He F, Xiong F
Received 15 August 2023
Accepted for publication 30 November 2023
Published 13 December 2023 Volume 2023:16 Pages 6139—6153
DOI https://doi.org/10.2147/JIR.S435596
Checked for plagiarism Yes
Review by Single anonymous peer review
Peer reviewer comments 3
Editor who approved publication: Professor Ning Quan
Jiaqiong Lin,1 Xiaoyong Li,2 Yan Lin,3 Zena Huang,3 Fei He,4 Fu Xiong4,5
1Dongguan Maternal and Child Health Care Hospital, Postdoctoral Innovation Practice Base of Southern Medical University, Dongguan, People’s Republic of China; 2General Surgery Department; Guangdong Provincial Key Laboratory of Major Obstetric Diseases; Guangdong Provincial Clinical Research Center for Obstetrics and Gynecology; The Third Affiliated Hospital of Guangzhou Medical University, Guangzhou, People’s Republic of China; 3Yunkang School of Medicine and Health, Nanfang College, Guangzhou, People’s Republic of China; 4Department of Medical Genetics/Experimental Education/Administration Center, School of Basic Medical Sciences, Southern Medical University, Guangzhou, 510515, People’s Republic of China; 5Department of Fetal Medicine and Prenatal Diagnosis, Zhujiang Hospital, Southern Medical University, Guangzhou, People’s Republic of China
Correspondence: Fu Xiong, Department of Medical Genetics/Experimental Education/Administration Center, School of Basic Medical Sciences, Southern Medical University, Guangzhou, 510515, People’s Republic of China, Email [email protected]
Background: Diabetic nephropathy (DN) is one of the primary causes of end-stage renal disease, yet effective therapeutic targets remain elusive. This study aims to identify novel diagnostic biomarkers and potential therapeutic candidates for DN.
Methods: Differentially expressed genes (DEGs) in GSE96804 and GSE142025 were identified and functional enrichment analysis was performed. Diagnostic biomarkers were selected using machine learning algorithms and evaluated by Receiver Operating Characteristic analysis. c-Fos expression was validated in an established DN mouse model. Immune infiltration levels were assessed with Single-Sample Gene Set Enrichment Analysis. Co-expression analysis revealed regulatory relationships involving FOS. cMAP predicted potential therapeutic candidates. Transcriptome sequencing and experiments in RAW264.7 cells was performed to investigate molecular mechanisms of emetine.
Results: In both datasets, we identified 44 upregulated and 74 downregulated DEGs involved in focal adhesion, ECM-receptor interaction, and the PI3K-Akt signaling pathway. FOS emerged as a robust diagnostic marker with decreased expression in DN patients and DN mouse. Co-expression analysis revealed potential regulatory mechanisms of FOS, implicating the MAPK signaling pathway, regulation of cell proliferation and apoptotic signaling pathways. Immune dysregulation was observed in DN patients. Notably, emetine was identified as a potential therapeutic candidate. Transcriptome sequencing and experimental validation demonstrated emetine suppressed M1 macrophage polarization by inhibiting the activation of NF-κB signaling pathway, as well as reducing the expression of Il-18 and Ccl5.
Conclusion: In conclusion, our study identified FOS as a promising diagnostic biomarker and emetine as a potential therapeutic candidate for DN. These findings enhance our understanding of DN pathogenesis and present novel prospects for therapeutic strategies.
Keywords: diabetic nephropathy, diagnostic markers, FOS, emetine, immune infiltration, inflammation
Introduction
Diabetic nephropathy (DN), a prevalent vascular complication of diabetes mellitus, has significantly increased in incidence, especially in China.1 It has become a prominent contributor to disability and mortality in diabetic patients. However, the current diagnostic tools for DN, such as glomerular filtration rate and urinary albumin-to-creatinine ratio, have limitations regarding their sensitivity and specificity, making early detection challenging.2
Clinical symptoms such as proteinuria, edema, hypertension, and renal insufficiency typically appear later in the progression of DN.3 Conversely, molecular abnormalities, particularly those associated with oxidative stress and inflammation, are evident at an earlier stage.4,5 Many inflammatory markers and cytokines, including omentin, kidney injury molecule, C-reactive protein, mean platelet volume, systemic inflammatory index, monocyte/lymphocyte ratio, neuregulin, and uric acid/HDL cholesterol ratio, have been reported to be associated with DN.6–13 The temporal discrepancy between clinical manifestations and molecular changes suggests potential for earlier DN detection and intervention through molecular markers. Several studies have focused on identifying potential biomarkers for DN. For instance, a significant correlation between 25-hydroxyvitamin D and DN albuminuria has been explored.14 Moreover, Chen et al highlighted COL1A2 as a promising biomarker for DN.15 While these advancements, limitations persist, including small sample sizes and inadequate validation.
In light of these challenges, our study utilizes bioinformatics techniques to analyze transcriptome data from DN patients, aiming to identify potential diagnostic and therapeutic targets. Specially, we focus on FOS, a gene implicated in inflammatory responses, and emetine, a traditional anti-protozoal agent with possible anti-inflammatory properties. FOS, a transcriptional activator of AP-1 complex, was involved in regulating multiple signaling pathways and gene expressions implicated in cell proliferation and apoptotic cell death.16,17 In addition, FOS gene has been linked with inflammatory responses,18,19 aligning with existing literature that emphasizes the role of inflammation in both type 2 diabetes mellitus and DN.20,21 Notably, emetine has been reported to exhibit anti-inflammatory properties and regulate immune responses. Previous research indicated that the application of emetine restrained TNF level and insulitis in diabetes mellitus mouse.22 However, the role of emetine in DN has not been clearly clarified.
Presently, glycemic control and blood pressure regulation are emphasized as management strategies for DN.23 Nonetheless, the need persists for novel early diagnostic markers, drug targets, and treatment strategies. Our study employed bioinformatics to conduct a comprehensive analysis of DN transcriptome data. Our objectives are to unravel the molecular mechanisms implicated in DN, identify potential key molecules critical for DN progression, and explore potential therapeutic drugs. We hope our efforts will enhance the understanding of DN and potentially inform more targeted treatment approaches. Recognizing the exploratory nature of our work, we believe it emphasizes the importance of bioinformatics in dissecting complex diseases like DN and suggests potential for more effective interventions.
Method
Data Acquisition
In this study, the research data was obtained from the Gene Expression Omnibus (GEO) database. Specifically, GSE96804 encompassed glomeruli samples from 20 normal control (NC) and 41 DN patients, while GSE142025 consisted kidney biopsy samples collected from 9 NC and 27 DN patients. Data normalization was performed before conducting the analysis.
Identification of Differentially Expressed Genes and Functional Enrichment Analysis
The identification of differentially expressed genes (DEGs) was carried out using the “Limma” R package, employing a threshold of |log2FC|>1 and adj.p value <0.05. Additionally, the visualization of volcano plots was accomplished using the “ggplot2” R package. UpSet analysis was then performed to visualize the overlaps of upregulated and downregulated genes across GSE96804 and GSE142025. To gain insights into the biological functions and pathways related to the common DEGs, functional enrichment analysis was conducted using the “clusterProfiler” R package. This analysis encompassed the evaluation of Gene Ontology (GO) terms and Kyoto Encyclopedia of Genes and Genomes (KEGG) pathways.24
Protein-Protein Interaction (PPI) Network Establishment
To explore the network’s protein interactions, we established a PPI network by utilizing an online dataset (http://string.embl.de/). Subsequently, CytoHub plugin in Cytoscape incorporates multiple centrality algorithms, including Maximum Connected Component (MCC), Maximum Neighbor Component (MNC), Degree, and Closeness, which was utilized to evaluate the importance of each gene in the network. The top 20 genes with the highest centrality scores from each algorithm were toke for intersection.
Screening and Validation of Diagnostic Biomarkers
Feature selection and feature importance were evaluated using multiple machine learning algorithms, such as Least Absolute Shrinkage and Selection Operator (LASSO), Support Vector Machine Recursive Feature Elimination (SVM-RFE), and Random Forest analysis. To obtain a robust set of diagnostic biomarkers, we took the intersection obtained from each algorithm. The effectiveness of FOS in diagnosis was assessed by employing Receiver Operating Characteristic (ROC) analysis.
Measurement of Immune Infiltration Level by Single-Sample Gene Set Enrichment Analysis (ssGSEA)
For measuring the level of activity or presence for each immune cell type, ssGSEA was utilized to compute the enrichment score. A greater enrichment score indicated a higher degree of infiltration.
Correlation Analysis
Spearman correlation analysis was conducted to investigate the potential functions of FOS through gene co-expression analyses in GSE96804 and GSE142025 datasets. The top 600 genes, representing the most strongly co-expressed genes with FOS in each dataset, were identified for intersection analysis. Subsequently, functional analysis was conducted using the metascape dataset (https://metascape.org/gp/index.html) on the shared genes to elucidate the underlying functional roles of FOS.
Drug Prediction
We utilized the comprehensive the Connectivity Map (cMAP) database (https://clue.io), which encompasses a diverse compilation of gene expression profiles derived from different cell lines following treatment with a wide array of small molecules. We queried the cMAP database to identify drugs that showed similar or opposite gene expression patterns compared to the DEGs of interest. Each drug received a connectivity score between −100 and 100, reflecting the strength of correlation between the drug’s gene expression profile and the DEGs.
Transcriptome Sequencing and Data Processing
To examine the mechanisms of emetine on M1 macrophage polarization under high glucose (HG, 40 mmol/L) conditions, we performed transcriptome sequencing using total RNA extracted from RAW264.7 cells after treatment with emetine. Following the removal of reads with low quality, the remaining high-quality reads were aligned to GRCm39 mouse reference genome using Hisat2 tool. Gene expression qualification was performed utilizing StringTie tool. DEG-seq2 was employed for differential expression analysis, where genes were considered as DEGs based on the criteria of p value <0.05 and |log2FC|>0.5.
Animals
The animal experiments conducted in this study adhered to the guidelines for the ethical treatment and care of animals, including the Public Health Service Policy on Humane Care and Use of Laboratory Animals and the NIH Guide for the Care and Use of Laboratory Animals. Ethical approval was obtained from the Animal Ethics Committee of Guangzhou Medical University. The experimental subjects for this study were male mice (C57BL/6, six weeks old), which were bred in specific pathogen-free conditions. To induce diabetes, established research protocols were employed.25 The mice were initially divided into two groups (n=8 in each group): a normal diet group (with 10% fat calories, 20% protein calories, and 70% carbohydrate) and a high-fat diet group (with 45% fat calories, 20% protein calories, and 35% carbohydrate). The control group was administered a standard chow diet for a duration of 15 weeks. The high-fat diet group of mice was fed for a period of five weeks. After 35, 36, and 37 days of high-fat feeding, diabetes was induced through STZ injections at a dose of 40 mg/kg. Following an additional four-week period, blood glucose levels were assessed. At the 15th week of the study, the mice were anesthetized using a 1% sodium pentobarbital injection administered intraperitoneally at a dosage of 50mg/kg. Following successful anesthesia, the mice were euthanized humanely through cervical dislocation. Histopathological analysis confirmed the success of the DN model. The summary of phenotypic characteristics in wild type and DN mouse models were listed in Table 1.
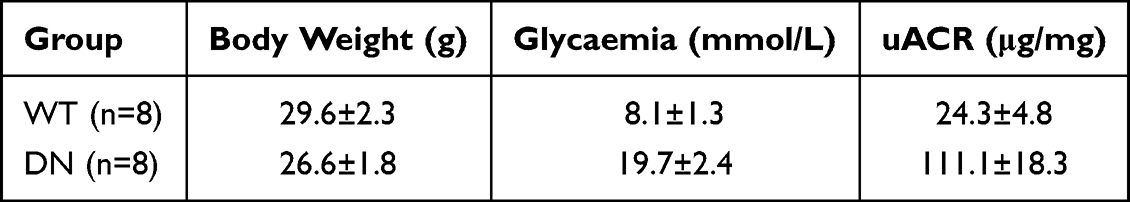 |
Table 1 Characteristics of Wild Type and Diabetic Nephropathy Mouse |
Cell Lines and Culture
RAW 264.7 cells (Procell Life Science & Technology Co., Ltd) were cultured in Dulbecco’s Modified Eagle Medium supplemented with 10% fetal bovine serum. For investigating the effects of emetine, the cells were categorized into three distinct groups: normal glucose group (5.5 mM), HG group (40 mM), and HG group with pre-treatment of emetine (5 nM).
Immunohistochemical Staining of c-Fos Antibody
After collection, kidney tissues were subjected to fixation in a 4% paraformaldehyde solution for 24 h. After sectioning, immunohistochemical staining was conducted according to the established protocol using c-Fos antibody (Proteintech, Wuhan, China).
Pathway Gene Set Variation Analysis (GSVA)
In order to explore the disturbed biological pathways in our investigation, we conducted GSVA utilizing the MH gene set obtained from the Molecular Signatures Database (MSigDB).
RT-PCR and Western Blot
Total RNA was isolated from the study samples using Trizol reagent (Invitrogen, California, USA). Upon eliminating genomic DNA contamination, reverse transcription was performed using a reverse transcription kit. Following that, the PCR reactions were established with a PCR master mix (Vazyme, Nanjing, CHINA). The reference gene employed in this analysis was Gapdh. The primer sequences used in this experiment are presented in Table 2. Western blot analysis was conducted following the established protocol. Antibodies against Gapdh (1:5000) and iNOS (1:1000) were procured from proteintech (Wuhan, CHINA), whereas p65 (1:1000) and p-p65 (1:1000) antibodies were obtained from CST (Boston, USA).
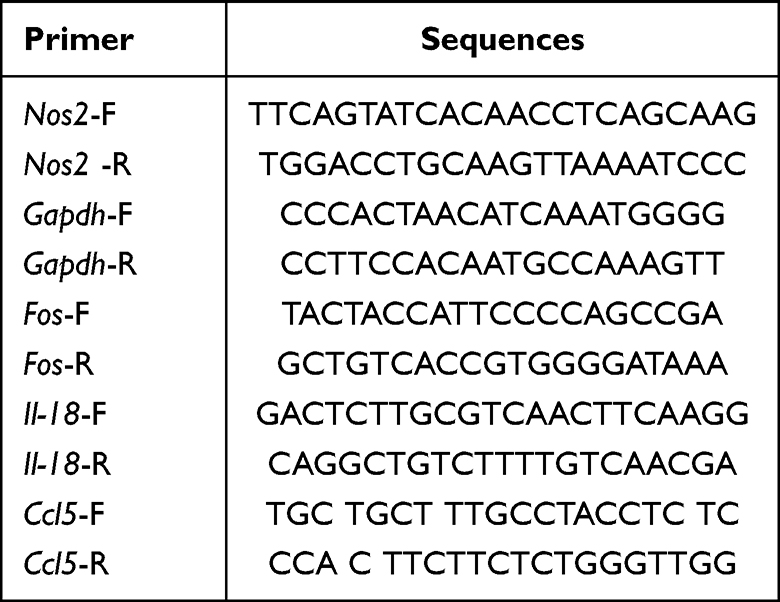 |
Table 2 Primer Sequences |
Statistical Analysis
The results of the analysis were presented as mean ± SD values. The gene expression levels between NC and DN mice were compared using two independent samples t-tests. A p-value less than 0.05 was considered to indicate a statistically significant difference.
Result
Characterization of DEGs in DN
To investigate the pathogenesis of DN, we analyzed the DEGs in GSE96804 and GSE142025. Our analysis resulted in the identification of 621 DEGs in GSE96804 and 1166 DEGs in GSE142025, as represented in Figure 1A and B, respectively. Subsequently, we performed an intersection analysis of the DEGs from both datasets, revealing 44 upregulated DEGs and 74 downregulated DEGs that were commonly observed (Figure 1C). To further elucidate the underlying mechanisms of DN, functional enrichment analysis was conducted on these DEGs, which were identified as being common to both datasets. The results from the GO analysis exhibited significant enrichment in several biological processes, including extracellular structure organization, collagen fibril organization and collagen-containing extracellular matrix (Figure 1D). Furthermore, the KEGG pathway analysis demonstrated notable enrichment in various pathways, such as focal adhesion, ECM-receptor interaction, PI3K-Akt signaling pathway, drug metabolism-cytochrome P450, metabolism of xenobiotics by cytochrome P450, and retinol metabolism (Figure 1E).
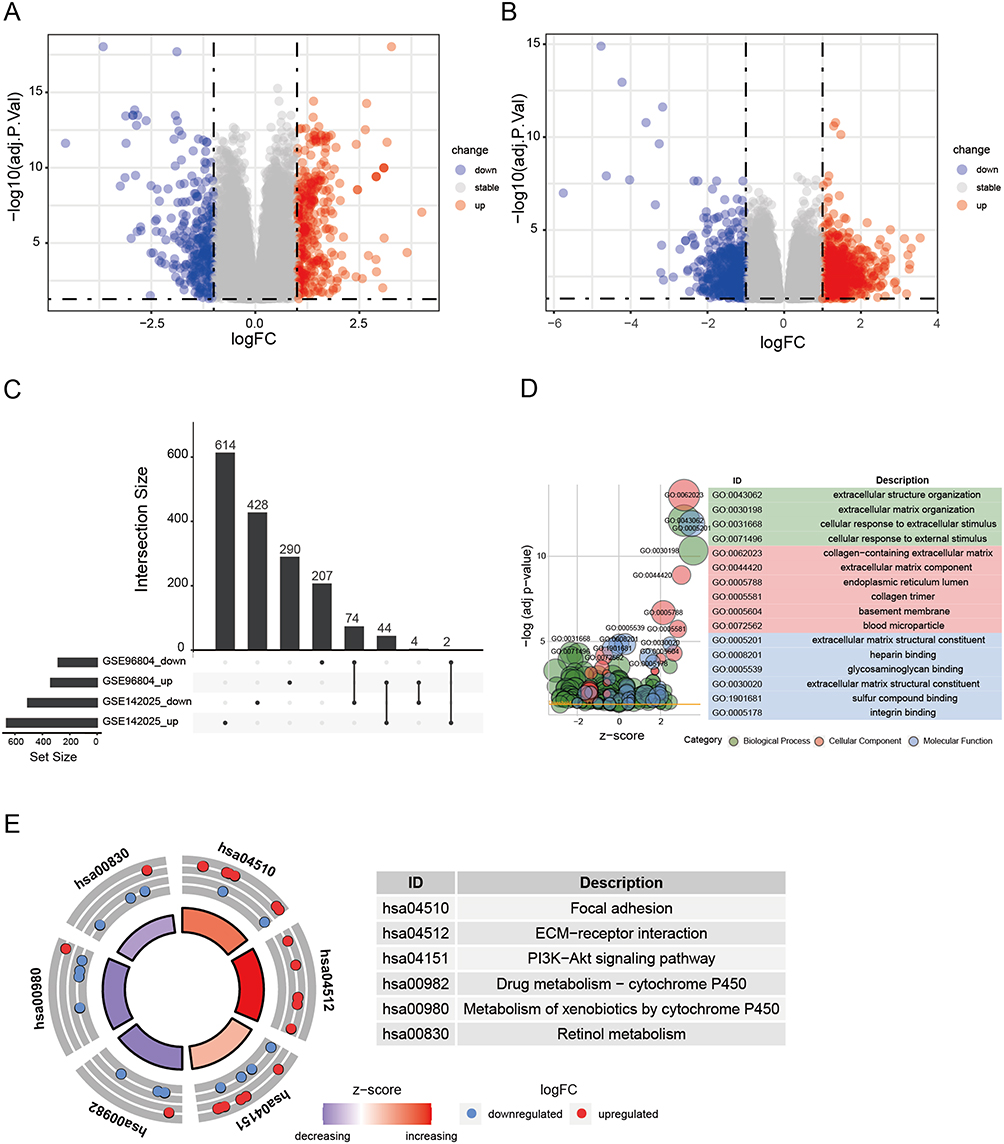 |
Figure 1 Identification and functional enrichment analysis of differentially expressed genes (DEGs) between health individuals and diabetic nephropathy patients. (A) The volcano plot of DEGs in GSE96804. (B) The volcano plot of DEGs in GSE142025. (C) The upset plot displaying common up-regulated and down-regulated DEGs of GSE96804 and GSE142025. (D) GO enrichment analysis of DEGs. (E) KEGG enrichment analysis of DEGs. |
Identification and Evaluation of Diagnostic Markers
The PPI network, comprising 118 overlapping DEGs, was established using the STRING dataset. The network was further analyzed utilizing the CytoHubba plugin within the Cytoscape software. Subsequently, 14 hub genes were selected by identifying intersecting genes with the highest centrality scores across multiple algorithms, including MCC, MNC, Degree, and Closeness (Figure 2A). To identify potential diagnostic biomarkers, we applied various algorithms, including LASSO, SVM-RFE, and Random Forest (Figure 2B–D). By intersecting the top-ranked features obtained from each algorithm, FOS was identified as a promising candidate for a diagnostic biomarker (Figure 2E). Furthermore, we assessed the diagnostic efficiency of FOS using ROC analysis. In GSE96804, the area under the ROC curve for FOS was determined to be 0.999, while in GSE142025, it was 0.971 (Figure 2F). These results demonstrated the potential of FOS as a diagnostic biomarker for DN.
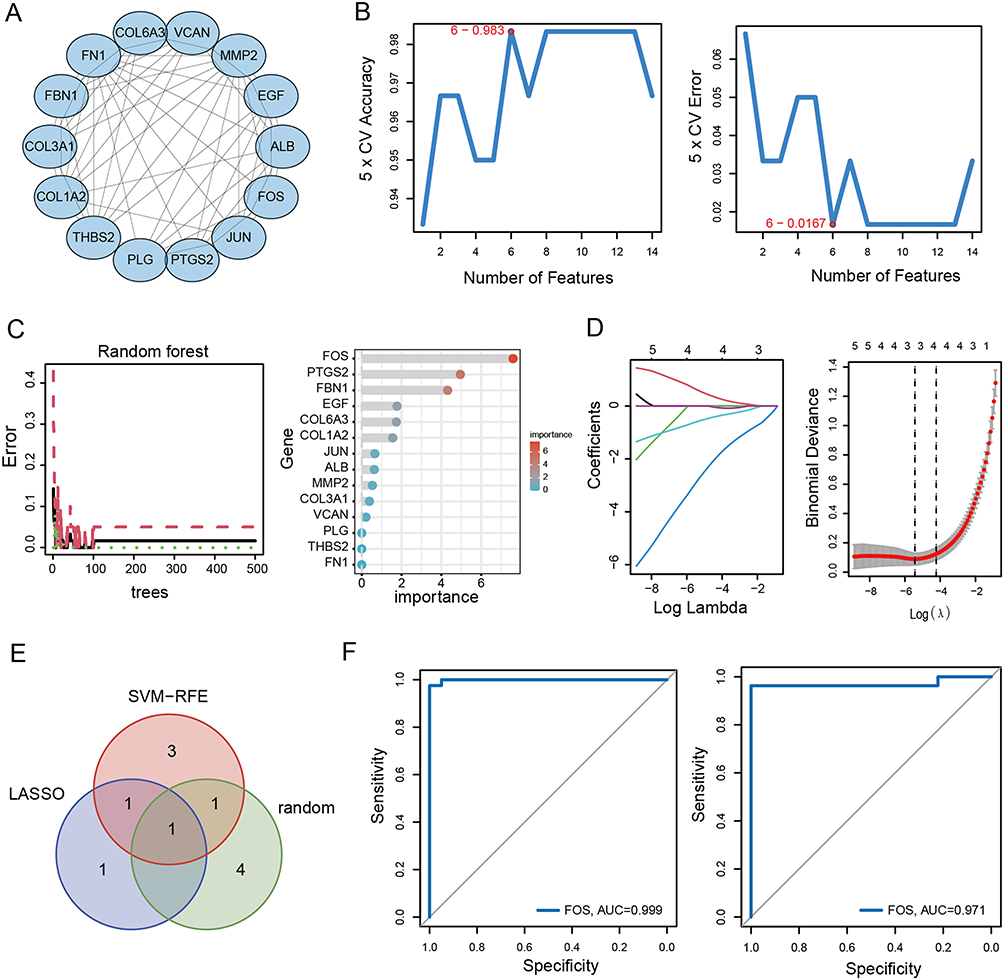 |
Figure 2 Identification of biomarkers using machine learning. (A) PPI network of hub genes. (B) SVM-RFE algorithm. (C) Random forest algorithm. (D) LASSO regression algorithm. (E) Venn diagram of overlapping hub genes identified by SVM-RFE, Random forest and LASSO regression algorithm. (E) ROC curve of FOS in GSE96804. (F) ROC curve of FOS in GSE142025. |
Examining the Expression Pattern and Elucidating the Molecular Mechanism Underlying FOS in DN
Compared with the NC group, DN patients exhibited a marked decrease in the expression level of FOS as evidenced by data from both GSE96804 and GSE142025 datasets (Figure 3A and B). To further validate these findings, a mouse model of DN was established to investigate the expression of Fos and validate its significance. Consistently, qPCR and immunohistochemistry analyses revealed a notable downregulation of c-Fos expression within the kidney tissue of DN mice (Figure 3C and D). To explore the potential molecular functions of FOS, co-expression analysis was carried out. Through a comprehensive analysis of the co-expression patterns regarding genes correlated with FOS in both datasets (Figure 3E and F), we gained valuable insights into their regulatory relationships. To visually depict the shared co-expression of genes, we utilized an Upset plot (Figure 3G), which succinctly presents the overlapping co-expressed genes. Functional enrichment analysis of these genes revealed their significant enrichment in key pathways such as MAPK signaling pathway, regulation of apoptotic signaling pathway, negative regulation of cell proliferation, and growth (Figure 3H), highlighting the potential molecular functions and biological processes associated with FOS in DN.
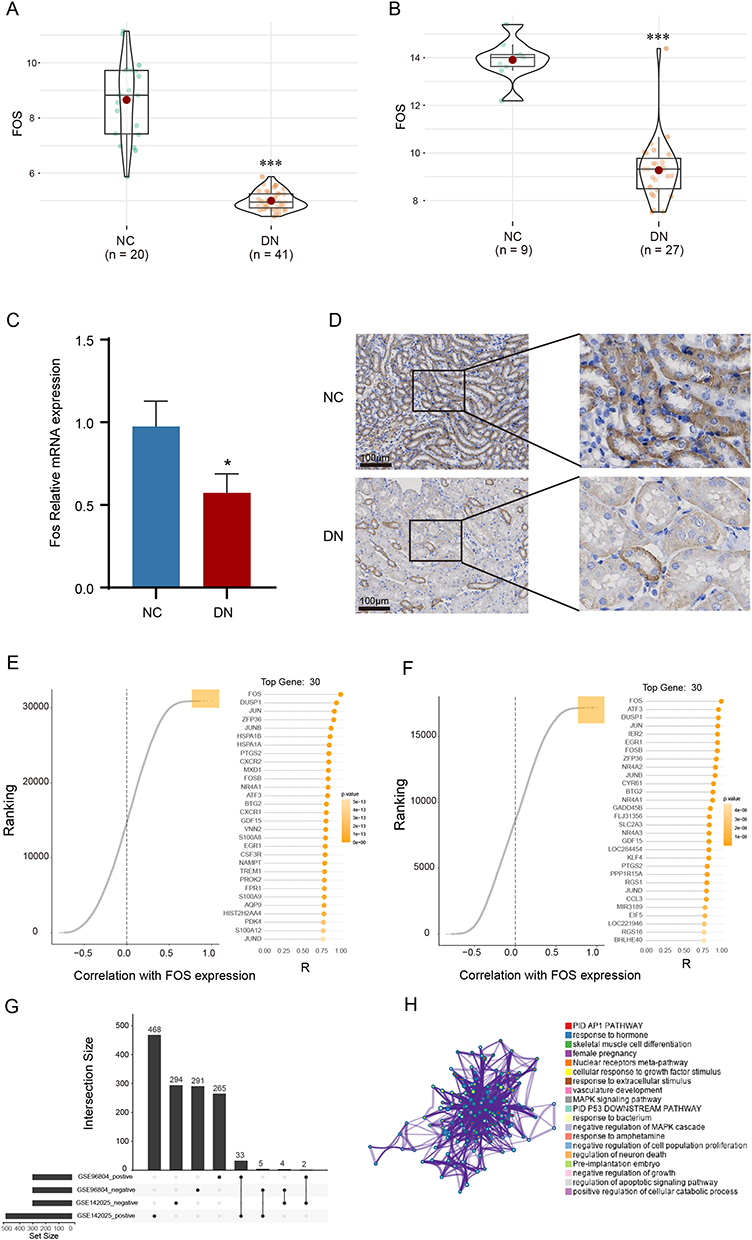 |
Figure 3 Validation of FOS expression in DN mouse model and identification of potential mechanism. (A) Expression level of FOS in GSE96804. (B) Expression level of FOS in GSE142025. (C) mRNA expression level of Fos in DN mouse model. (D) Immumohistochemical staining of c-Fos in DN mouse model. (E) Identification of co-expression genes with FOS in GSE96804. (F) Identification of co-expression genes with FOS in GSE142025. (G) The upset plot presenting common negative and positive co-expression genes in GSE96804 and GSE142025. (H) Functional enrichment analysis of co-expression genes. NC, normal control. DN, diabetic nephropathy. *p<0.05 vs NC group. ***p<0.001 vs NC group. |
Drug Predictive Analysis Identified Emetine as a Promising Therapeutic Candidate
Drug prediction was conducted using the cMAP database to identify potential therapeutic agents based on shared DEGs. The top 10 drugs with the highest scores, encompassing both positive and negative values, were selected for presentation (Figure 4). Notably, emetine exhibited the highest connectivity score among the top-scoring drugs, indicating a robust correlation with the gene expression signature observed in our study. This finding highlights the potential therapeutic relevance of emetine in DN, thereby prompting its selection for further investigation and exploration.
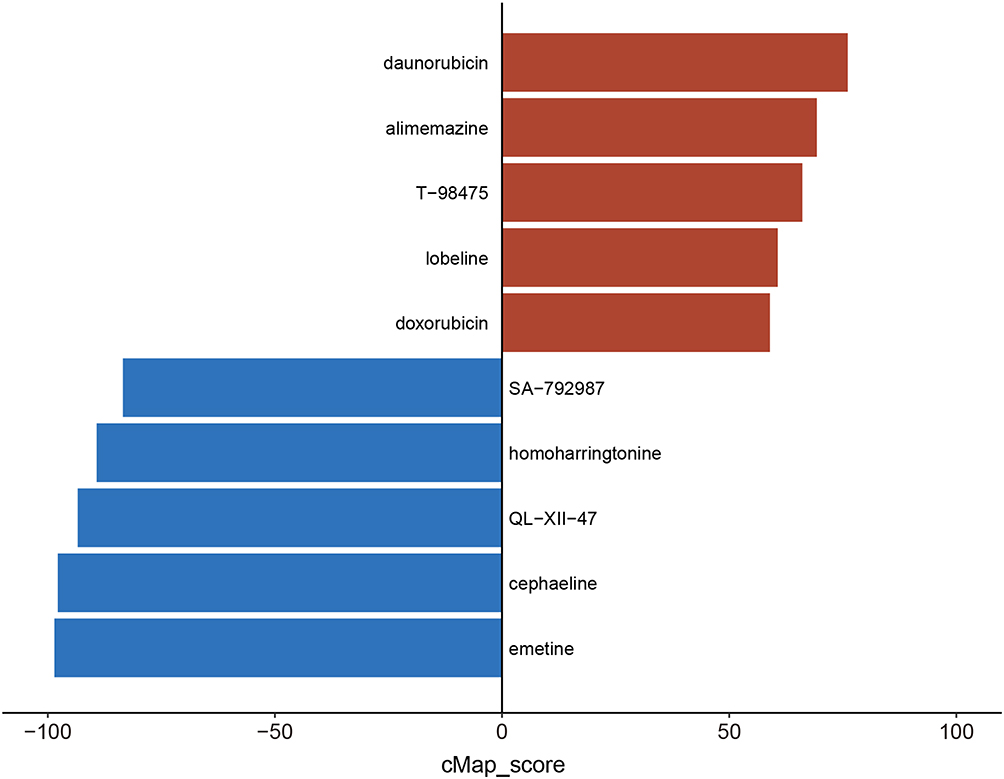 |
Figure 4 Drug prediction. The top 10 possible medicines were predicted by cMAP. The red color represents the positive correlation, while the blue means the negative. |
Measurement of Immune Infiltration Level in DN
To gain insights into the immune dysregulation associated with DN, we quantified the degree of immune infiltration in DN patients compared to NC. By analyzing two independent datasets, GSE96804 and GSE142025, our findings revealed significantly elevated immune infiltration levels in DN patients (Figure 5A and B). Specifically, macrophage infiltration exhibited a marked increase consistently observed across both datasets. The heightened presence of macrophages within the renal microenvironment suggests an intensified inflammatory response in DN patients. Given the previous evidence showcasing the potential anti-inflammatory properties of emetine, we speculate whether emetine exerts its anti-inflammatory effects through modulation of macrophages.
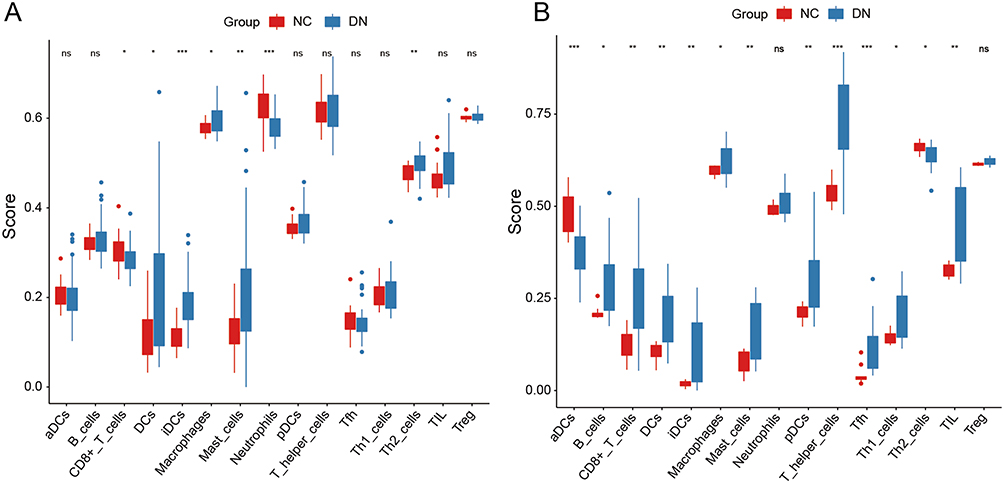 |
Figure 5 Measurement of immune infiltration level by ssGSEA. (A) Immune infiltration level in GSE96804. (B) Immune infiltration level in GSE142025. NC, normal control. DN, diabetic nephropathy. *p<0.05 vs NC group. **p<0.01 vs NC group. ***p<0.001 vs NC group. ns, no significance. |
Transcriptomic Analysis Revealed Mechanisms and Signaling Pathways Impacted by Emetine in M1 Macrophage Polarization
To examine the impact of emetine on macrophages, we utilized RAW264.7 macrophages to establish a HG-induced cell model. The expression of Nos2 was measured in RAW 264.7 cells exposed to HG conditions to assess the polarization of M1 macrophages. In comparison to the control group, a pronounced elevation in Nos2 expression was evident in the HG-treated group. Conversely, pretreatment with emetine exhibited a noteworthy decrease in Nos2 expression relative to the HG-treated group (Figure 6A). Similar results were observed at the protein expression level (Figure 6B). To gain further insights into the mechanisms underlying emetine’s inhibitory effects on M1 macrophage polarization, we performed transcriptome sequencing. Differential analysis revealed a total of 106 DEGs (Figure 6C). Subsequently, functional enrichment analysis was conducted, revealing significant enrichment in various GO categories. These included regulation of response to cytokine stimulus, regulation of cytokine-mediated signaling pathway, regulation of chemokine production, NF-κB signaling pathway, kinase regulator activity, death domain binding, and host cellular component (Figure 6D–F). Moreover, KEGG analysis demonstrated significant enrichment in the NOD-like receptor (NLR) and toll-like receptor (TLR) signaling pathways, as well as Type 1 diabetes mellitus (Figure 6G). Additionally, GSVA indicated negative enrichment scores for NF-κB and KRAS signaling pathways, along with interferon α/γ response activity upon emetine treatment (Figure 6H). To validate these findings, Western blot experiments were performed, confirming that emetine significantly reduced the activation of the NF-κB pathway (Figure 6I). Moreover, a notable decrease in the expression of Il-18 and Ccl5 was observed upon emetine treatment (Figure 6J).
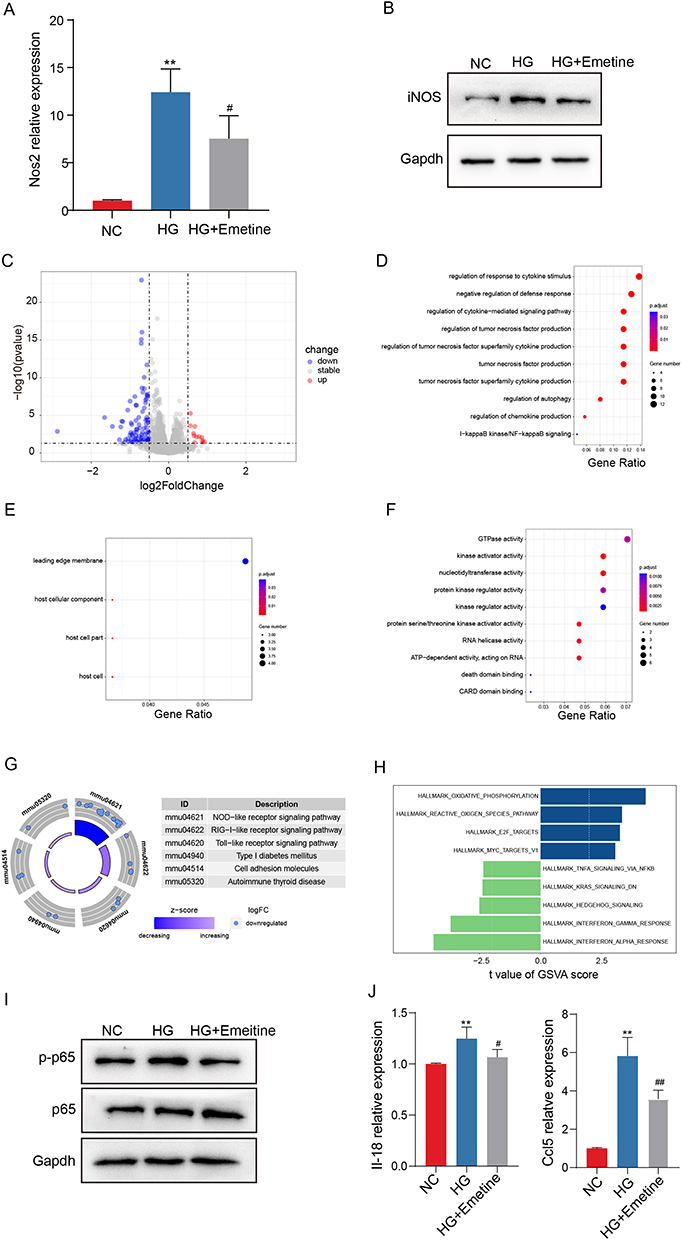 |
Figure 6 Protection mechanism of emetine. RAW264.7 cells were stimulated with HG, which were pretreated with or without emetine. (A) mRNA expression level of Nos2. (B) Protein expression level of iNOS. (C) The volcano plot presented up-regulated and down-regulated DEGS of RAW264.7 cells pretreated with or without emetine under HG stimulation. (D) GO-BP terms of DEGs. (E) GO-CC terms of DEGs. (F) GO-MF terms of DEGs. (G) KEGG enrichment analysis. (H) GSVA analysis. (I) Western blot detection of NF-κB pathway. (J) mRNA expression levels of Il-18 and Ccl5. NC, normal control. HG, high glucose. **p<0.01 vs NC group. #p<0.05 vs HG group. ##p<0.01 vs HG group. |
Discussion
DN is widely acknowledged as the primary etiology of end-stage renal disease, imposing substantial psychological and economic burdens on individuals and society. The discovery of diagnostic biomarkers for the early identification of DN and the development of novel therapeutic approaches are critical. Therefore, the objective of our study was to discover prospective biomarkers and therapeutic agents for the prompt diagnosis and management of DN. Through a comprehensive analysis of DEGs, we sought to uncover key gene alterations associated with DN and their functional implications.
By analyzing the DEGs from two independent datasets (GSE96804 and GSE142025), we discovered an overlap of 44 DEGs exhibiting upregulation and 74 DEGs displaying downregulation. Our analysis has shed light on several pathways, including the focal adhesion, ECM-receptor interaction, PI3K-Akt signaling pathway, drug metabolism, metabolism of xenobiotics by cytochrome P450, and retinol metabolism. These findings not only elaborate on the complex molecular mechanisms of DN but also lend support to the validity of our research methodology. Focal adhesion, a crucial process for cell-cell and cell-extracellular matrix interactions, along with disrupted ECM-receptor interactions, have been implicated in DN progression.26,27 Specifically, the PI3K-Akt signaling pathway, known for its role in cellular growth, insulin signaling, and cell survival, has been closely linked with cell apoptosis and epithelial-mesenchymal transition in DN in previous studies.28,29 The concurrence of these findings with our own underscores the reliability of our approach. Cytochrome P450 are involved in the process of drug metabolism. The enrichment in drug metabolism-cytochrome P450 and xenobiotic metabolism pathways suggested alterations in the metabolic processes involved in drug breakdown and detoxification in individuals with DN. These changes can impact the effectiveness of treatments and result in the accumulation of harmful substances within the kidney, worsening DN progression. Therefore, understanding drug metabolism and the relationship between cytochrome P450 and DN will guide improved drug therapy strategies. Additionally, the enrichment of the retinol metabolism pathway indicated a potential relationship between retinol and DN. Retinol has diverse effects on renal function, including its influence on inflammation, fibrosis, and cell differentiation.30 However, further investigation is needed to comprehensively elucidate the involvement of retinol metabolism in DN development. The results of KEGG analysis highlight the complexity of DN and provide valuable insights into the molecular mechanisms involved. Additionally, the alignment of our findings with previous studies provides a degree of validation for our analytical approach. We hope that these contributions to the field will be useful for future investigations into DN and may support the development of novel therapeutic strategies.
To identify potential diagnostic biomarkers, we constructed a PPI network and identified 14 hub genes. Utilizing algorithms such as LASSO, SVM-RFE, and random forest, we determined that FOS could serve as a promising candidate for a diagnostic biomarker in DN. The ROC curve further validated the favorable diagnostic potential of FOS in DN. Consistent with transcriptome data, c-Fos expression was significantly reduced in the DN mouse model, evidencing by qPCR analysis and immunohistochemical staining. Specially, activation of FOS expression has been associated with HG-induced glomerular mesangial cell injury.31 Notably, a separate study corroborated our findings by demonstrating a marked decrease in FOS expression among patients with DN.32 The inconsistency between these results may be attributed to differences in disease mechanisms between animal models or human subjects and in vitro cell cultures, as well as variations in FOS expression across different cellular models and disease stages. These novel insights provide valuable leads for future investigations, emphasizing the importance of including larger clinical cohorts and exploring FOS expression in diverse cellular models. Such endeavors will undoubtedly enhance our comprehension of the intricate role played by FOS in the pathogenesis of DN. Additionally, co-expression analysis revealed regulatory relationships that shed light on the intricate network involving FOS. Furthermore, functional enrichment analysis highlighted critical pathways associated with FOS, including the apoptosis, MAPK signaling pathway, and suppression of cell proliferation, while the dysregulation of these pathways was often observed in DN.33,34 Understanding the regulatory relationships and critical pathways associated with FOS in DN will pave the way for further research. By elucidating downstream targets and the transcriptional regulation of FOS, we can gain deeper insights into the molecular functions and complex signal networks involving FOS in DN. Moreover, these findings open up potential avenues for developing therapeutic interventions targeting the molecular pathways associated with FOS.
Using the cMAP database for predictive drug analysis, emetine emerged as a potential candidate for DN treatment due to its high connectivity score with the common DEGs derived from the GSE96804 and GSE142025 datasets. This indicates a strong correlation between emetine’s underlying molecular mechanisms and the gene expression profile observed in DN. Emetine’s known anti-inflammatory properties and ability to regulate immune responses also support its candidacy. Notably, immune infiltration analysis revealed significantly elevated levels of immune cell infiltration, particularly macrophages, in DN patients. Macrophages, being a vital constituent of the immune cell population, assume a key role in modulating immune responses and inflammatory processes. Prior investigations have unequivocally demonstrated the participation of macrophages in the pathogenesis of DN. Upon exposure to HG, renal parenchymal cells exhibited augmented expression of inflammatory cytokines and chemokines, notably including IL-1β, CCL2 and CCL5, thereby facilitating the mobilization and activation of macrophages.35 Consequently, these activated macrophages exacerbated renal injury.36 In mouse models of HG-induced kidney dysfunction, it has been observed that HG promoted M1 macrophage activation via the HIF-α/Notch1 pathway, resulting in kidney injury.37 Furthermore, compelling evidence from other studies suggested that restraining M1 macrophage polarization or suppressing chemokine activation significantly mitigated the inflammatory response in DN mice,38,39 highlighting potential therapeutic avenues for managing DN. Considering emetine’s potential anti-inflammatory properties and regulation of immune responses, we postulated that its effects may be mediated through the regulation of macrophages. Thus, experiment validation was performed in our study.
As a results, our findings highlighted that emetine treatment effectively inhibited M1 macrophages polarization under HG conditions. Transcriptome sequencing was executed to delve into the underlying mechanisms, resulting in the identification of several DEGs and revealing functional enrichments in GO categories related to inflammatory responses. Additionally, KEGG and GSVA analysis demonstrated significant enrichments in pivotal signaling pathways implicated in immune responses and metabolic disorders. Notably, The NLR, TLR and NF-KB signaling pathways were crucial components of the immune response, responsible for triggering immune reactions.40–42 In particular, the activation of macrophages via the NF-κB signaling pathway has been shown to contribute to Tim-3-induced podocyte injury.43 Furthermore, our assessment of Ccl5 and Il-18 levels, which are indicators relating to inflammation, supported the effectiveness of emetine as an intervention. Notably, NF-κB signaling pathway, which plays a crucial role in activating macrophages and triggering immune reactions, was identified as a potential mechanism through which emetine suppressed M1 macrophage polarization. Our findings provide preliminary insights into the potential for emetine as a therapeutic strategy in DN treatment.
It is important to acknowledge certain limitations in the present study. While we identified FOS as a promising biomarker and validated its significance using public datasets and a DN mouse model, we recognize the need for further verification within our own collected cohort samples to enhance the reliability and applicability of our findings. To address this limitation, we plan to further explore the potential of FOS as a biomarker in DN by collecting peripheral blood samples. Peripheral blood collection offers potential advantages such as non-invasiveness and ease of accessibility. Moreover, it could complement existing diagnostic methods and potentially provide additional valuable information for the assessment of DN.
Conclusion
Our study unveils novel perspectives on DN by identifying novel biomarkers and potential therapeutic drugs. The discovery of FOS as a prospective biomarker offers potential for early diagnosis and monitoring of DN, enabling timely interventions to prevent disease progression. Additionally, our investigation highlights emetine as a potential therapeutic drug that holds promise in slowing down the advancement of DN. In summary, our study offers valuable insights into the diagnosis and treatment of DN, offering promising prospects for improved management strategies.
Abbreviations
DN, Diabetic nephropathy; DEGs, differentially expressed genes; NC, normal control; GO, Gene Ontology; GEO, Gene Expression Omnibus; KEGG, Kyoto Encyclopedia of Genes and Genomes; PPI, Protein-Protein Interaction; MCC, Maximum Connected Component; MNC, Maximum Neighbor Component; LASSO, Least Absolute Shrinkage and Selection Operator; SVM-RFE, Support Vector Machine Recursive Feature Elimination; cMAP, Connectivity Map; MSigDB, Molecular Signatures Database; ROC, Receiver Operating Characteristic; ssGSEA, Single-Sample Gene Set Enrichment Analysis; HG, high glucose; GSVA, Gene Set Variation Analysis.
Data Sharing Statement
The sequencing data utilized in this study are accessible through online repositories named NCBI GEO, with the accession number GSE239385.
Ethical Approval and Consent to Participate
Ethical approval was obtained from the animal ethical committee of Guangzhou Medical University (No.GY2019-027).
Acknowledgments
We acknowledge to GEO researchers for sharing the data.
Author Contributions
All authors have collectively contributed significantly to the reported work. Their contributions span various aspects, including conception, study design, data acquisition, execution, analysis, and interpretation. Additionally, all authors have participated in drafting, revising, and critically reviewing the article. They have provided final approval for the version intended for publication and reached an agreement on the target journal. Furthermore, all authors acknowledge their accountability for all aspects of the work.
Funding
This work was supported by Guangdong Basic and Applied Basic Research Foundation (2022A1515111203, 2022A1515012621, K223283115), National Key S&T Special Projects (2021YFC1005301, 2022YFC2703303), National Natural Science Foundation of China (32170617, 31970558), Guangzhou Science and Technology Program (202102080037).
Disclosure
All authors declare no conflicts of interest in this work.
References
1. Lin YK, Gao B, Liu L, et al. The prevalence of diabetic microvascular complications in China and the USA. Curr Diab Rep. 2021;21(6):16. doi:10.1007/s11892-021-01387-3
2. Klessens CQ, Woutman TD, Veraar KA, et al. An autopsy study suggests that diabetic nephropathy is underdiagnosed. Kidney Int. 2016;90(1):149–156. doi:10.1016/j.kint.2016.01.023
3. Alicic RZ, Rooney MT, Tuttle KR. Diabetic kidney disease: challenges, progress, and possibilities. Clin J Am Soc Nephrol. 2017;12(12):2032–2045. doi:10.2215/CJN.11491116
4. Fu J, Sun Z, Wang X, et al. The single-cell landscape of kidney immune cells reveals transcriptional heterogeneity in early diabetic kidney disease. Kidney Int. 2022;102(6):1291–1304. doi:10.1016/j.kint.2022.08.026
5. Su S, Ma Z, Wu H, Xu Z, Yi H. Oxidative stress as a culprit in diabetic kidney disease. Life Sci. 2023;322:121661. doi:10.1016/j.lfs.2023.121661
6. Tekce H, Tekce BK, Aktas G, Alcelik A, Sengul E. Serum omentin-1 levels in diabetic and nondiabetic patients with chronic kidney disease. Exper Clin Endocrinol Diabetes. 2014;122(8):451–456. doi:10.1055/s-0034-1375674
7. Kin Tekce B, Tekce H, Aktas G, Sit M. Evaluation of the urinary kidney injury molecule-1 levels in patients with diabetic nephropathy. Clin Invest Med. 2014;37(6):E377–E383. doi:10.25011/cim.v37i6.22242
8. Bilgin S, Kurtkulagi O, Atak Tel BM, et al. Does C-reactive protein to serum Albumin Ratio correlate with diabEtic nephropathy in patients with type 2 dIabetes mellitus? The CARE TIME study. Prim Care Diabetes. 2021;15(6):1071–1074. doi:10.1016/j.pcd.2021.08.015
9. Kocak MZ, Aktas G, Erkus E, Duman TT, Atak BM, Savli H. Mean platelet volume to lymphocyte ratio as a novel marker for diabetic nephropathy. J Coll Physicians Surg Pak. 2018;28(11):844–847. doi:10.29271/jcpsp.2018.11.844
10. Taslamacioglu Duman T, Ozkul FN, Balci B. Could systemic inflammatory index predict diabetic kidney injury in type 2 diabetes mellitus? Diagnostics. 2023;13(12):2063. doi:10.3390/diagnostics13122063
11. Kocak MZ, Aktas G, Duman TT, et al. Monocyte lymphocyte ratio as a predictor of diabetic kidney injury in type 2 diabetes mellitus; The MADKID Study. J. Diabetes Metab Disord. 2020;19(2):997–1002. doi:10.1007/s40200-020-00595-0
12. Kocak MZ, Aktas G, Atak BM, et al. Is Neuregulin-4 a predictive marker of microvascular complications in type 2 diabetes mellitus? Eur J Clin Invest. 2020;50(3):e13206. doi:10.1111/eci.13206
13. Aktas G, Yilmaz S, Kantarci DB, et al. Is serum uric acid-to-HDL cholesterol ratio elevation associated with diabetic kidney injury? Postgrad Med. 2023;135(5):519–523. doi:10.1080/00325481.2023.2214058
14. Huang B, Wen W, Ye S. Correlation between serum 25-Hydroxyvitamin D levels in albuminuria progression of diabetic kidney disease and underlying mechanisms by bioinformatics analysis. Front Endocrinol. 2022;13:880930. doi:10.3389/fendo.2022.880930
15. Chen C, Liu L, Luo J. Identification of the molecular mechanism and candidate markers for diabetic nephropathy. Ann Transl Med. 2022;10(22):1248. doi:10.21037/atm-22-5128
16. Ray JD, Kener KB, Bitner BF, et al. Nkx6.1-mediated insulin secretion and β-cell proliferation is dependent on upregulation of c-Fos. FEBS Letters. 2016;590(12):1791–1803. doi:10.1002/1873-3468.12208
17. Liang F, Luo YF, Guo Z, Qian Q, Meng XB, Mo ZH. MicroRNA-139-5p mediates BMSCs impairment in diabetes by targeting HOXA9/c-Fos. FASEB J. 2023;37(1):e22697. doi:10.1096/fj.202201059R
18. Ding S, Gan T, Xiang Y, et al. FOS gene associated immune infiltration signature in perivascular adipose tissues of abdominal aortic aneurysm. Gene. 2022;831:146576. doi:10.1016/j.gene.2022.146576
19. Zhu J, Yao K, Guo J, et al. miR-181a and miR-150 regulate dendritic cell immune inflammatory responses and cardiomyocyte apoptosis via targeting JAK1-STAT1/c-Fos pathway. J Cell Mol Med. 2017;21(11):2884–2895. doi:10.1111/jcmm.13201
20. Kocak MZ, Aktas G, Erkus E, et al. Neuregulin-4 is associated with plasma glucose and increased risk of type 2 diabetes mellitus. Swiss Med Wkly. 2019;149:w20139.
21. Aktas G. Association between the prognostic nutritional index and chronic microvascular complications in patients with type 2 diabetes mellitus. J Clin Med. 2023;12(18):5952. doi:10.3390/jcm12185952
22. Hudson LK, Dancho ME, Li J, et al. Emetine Di-HCl attenuates type 1 diabetes mellitus in mice. Mol Med. 2016;22(1):585–596. doi:10.2119/molmed.2016.00082
23. Umanath K, Lewis JB. Update on Diabetic Nephropathy: core Curriculum 2018. Am J Kidney Dis. 2018;71(6):884–895. doi:10.1053/j.ajkd.2017.10.026
24. Yu G, Wang LG, Han Y, He QY. clusterProfiler: an R package for comparing biological themes among gene clusters. Omics. 2012;16(5):284–287. doi:10.1089/omi.2011.0118
25. Wang Y, Li M, Chen L, et al. Natural killer cell-derived exosomal miR-1249-3p attenuates insulin resistance and inflammation in mouse models of type 2 diabetes. Signal Transduct Target Ther. 2021;6(1):409. doi:10.1038/s41392-021-00805-y
26. Kim DY, Kang MK, Kim YH, et al. Eucalyptol ameliorates dysfunction of actin cytoskeleton formation and focal adhesion assembly in glucose-loaded podocytes and diabetic kidney. Mol Nutr Food Res. 2019;63(22):e1900489. doi:10.1002/mnfr.201900489
27. Hu C, Sun L, Xiao L, et al. Insights into the mechanisms involved in the expression and regulation of extracellular matrix proteins in diabetic nephropathy. Curr Med Chem. 2015;22(24):2858–2870. doi:10.2174/0929867322666150625095407
28. Su WY, Li Y, Chen X, et al. Ginsenoside Rh1 improves type 2 diabetic nephropathy through AMPK/PI3K/Akt-mediated inflammation and apoptosis signaling pathway. Am J Chin Med. 2021;49(5):1215–1233. doi:10.1142/S0192415X21500580
29. Xu Z, Jia K, Wang H, et al. METTL14-regulated PI3K/Akt signaling pathway via PTEN affects HDAC5-mediated epithelial-mesenchymal transition of renal tubular cells in diabetic kidney disease. Cell Death Dis. 2021;12(1):32. doi:10.1038/s41419-020-03312-0
30. Chen A, Liu Y, Lu Y, Lee K, He JC. Disparate roles of retinoid acid signaling molecules in kidney disease. Am J Physiol Renal Physiol. 2021;320(5):F683–F692. doi:10.1152/ajprenal.00045.2021
31. Huang K, Huang J, Chen C, et al. AP-1 regulates sphingosine kinase 1 expression in a positive feedback manner in glomerular mesangial cells exposed to high glucose. Cell Signalling. 2014;26(3):629–638. doi:10.1016/j.cellsig.2013.12.002
32. Wei R, Qiao J, Cui D, Pan Q, Guo L. Screening and identification of hub genes in the development of early diabetic kidney disease based on weighted gene co-expression network analysis. Front Endocrinol. 2022;13:883658. doi:10.3389/fendo.2022.883658
33. Bhattacharjee N, Barma S, Konwar N, Dewanjee S, Manna P. Mechanistic insight of diabetic nephropathy and its pharmacotherapeutic targets: an update. Eur J Pharmacol. 2016;791:8–24. doi:10.1016/j.ejphar.2016.08.022
34. Shen S, Ji C, Wei K. Cellular senescence and regulated cell death of tubular epithelial cells in diabetic kidney disease. Front Endocrinol. 2022;13:924299. doi:10.3389/fendo.2022.924299
35. Tang SCW, Yiu WH. Innate immunity in diabetic kidney disease. Nat Rev Nephrol. 2020;16(4):206–222. doi:10.1038/s41581-019-0234-4
36. Tang PM, Nikolic-Paterson DJ, Lan HY. Macrophages: versatile players in renal inflammation and fibrosis. Nat Rev Nephrol. 2019;15(3):144–158. doi:10.1038/s41581-019-0110-2
37. Feng X, Gao X, Wang S, et al. PPAR-α agonist fenofibrate prevented diabetic nephropathy by inhibiting M1 macrophages via improving endothelial cell function in db/db mice. Front Med. 2021;8:652558. doi:10.3389/fmed.2021.652558
38. Guiteras R, Sola A, Flaquer M, Manonelles A, Hotter G, Cruzado JM. Exploring macrophage cell therapy on Diabetic Kidney Disease. J Cell Mol Med. 2019;23(2):841–851. doi:10.1111/jcmm.13983
39. Boels MGS, Koudijs A, Avramut MC, et al. Systemic monocyte chemotactic protein-1 inhibition modifies renal macrophages and restores glomerular endothelial glycocalyx and barrier function in diabetic nephropathy. Am J Pathol. 2017;187(11):2430–2440. doi:10.1016/j.ajpath.2017.07.020
40. Zhao J, Chen J, Li YY, Xia LL, Wu YG. Bruton’s tyrosine kinase regulates macrophage‑induced inflammation in the diabetic kidney via NLRP3 inflammasome activation. Int J Mol Med. 2021;48(3). doi:10.3892/ijmm.2021.5010
41. Ito S, Nakashima H, Ishikiriyama T, et al. Effects of a CCR2 antagonist on macrophages and Toll-like receptor 9 expression in a mouse model of diabetic nephropathy. Am J Physiol Renal Physiol. 2021;321(6):F757–F770. doi:10.1152/ajprenal.00191.2021
42. Ma T, Li X, Zhu Y, et al. Excessive activation of notch signaling in macrophages promote kidney inflammation, fibrosis, and necroptosis. Front Immunol. 2022;13:835879. doi:10.3389/fimmu.2022.835879
43. Yang H, Xie T, Li D, et al. Tim-3 aggravates podocyte injury in diabetic nephropathy by promoting macrophage activation via the NF-κB/TNF-α pathway. Mol Metabol. 2019;23:24–36. doi:10.1016/j.molmet.2019.02.007
 © 2023 The Author(s). This work is published and licensed by Dove Medical Press Limited. The
full terms of this license are available at https://www.dovepress.com/terms
and incorporate the Creative Commons Attribution
- Non Commercial (unported, 3.0) License.
By accessing the work you hereby accept the Terms. Non-commercial uses of the work are permitted
without any further permission from Dove Medical Press Limited, provided the work is properly
attributed. For permission for commercial use of this work, please see paragraphs 4.2 and 5 of our Terms.
© 2023 The Author(s). This work is published and licensed by Dove Medical Press Limited. The
full terms of this license are available at https://www.dovepress.com/terms
and incorporate the Creative Commons Attribution
- Non Commercial (unported, 3.0) License.
By accessing the work you hereby accept the Terms. Non-commercial uses of the work are permitted
without any further permission from Dove Medical Press Limited, provided the work is properly
attributed. For permission for commercial use of this work, please see paragraphs 4.2 and 5 of our Terms.
Recommended articles
Uncovering the Role of Anoikis-Related Genes in Modulating Immune Infiltration and Pathogenesis of Diabetic Kidney Disease
Lin J, Lin Y, Li X, He F, Gao Q, Wang Y, Huang Z, Xiong F
Journal of Inflammation Research 2024, 17:4975-4991
Published Date: 24 July 2024
Comprehensive Analysis and Experimental Validation of Immune-Related Biomarkers and Immune Microenvironment in Diabetic Nephropathy
Zhou W, Zeng Z, Li X, Yang M
Journal of Inflammation Research 2025, 18:13711-13726
Published Date: 3 October 2025