Back to Journals » ImmunoTargets and Therapy » Volume 15
Unveiling a ceRNA Network Involving IL-8 and TNF-α in Active Generalized Vitiligo by Multi-Omics Integration
Authors Ge K ![]() , Zhao Y
, Zhao Y ![]() , Zhang R
, Zhang R
Received 12 January 2026
Accepted for publication 28 May 2026
Published 5 June 2026 Volume 2026:15 595534
DOI https://doi.org/10.2147/ITT.S595534
Checked for plagiarism Yes
Review by Single anonymous peer review
Peer reviewer comments 2
Editor who approved publication: Professor Michael Shurin
Kang Ge,1– 3 Yilu Zhao,4 Ruzhi Zhang1
1Department of Dermatology and STD, The Second Affiliated Hospital of Wannan Medical College, Wuhu, 241000, People’s Republic of China; 2Department of Dermatology, The Third Affiliated Hospital of Soochow University, Changzhou, 213003, People’s Republic of China; 3Jiaxing Key Discipline of Medicine Dermatology and Venereology, The Affiliated Hospital of Jiaxing University, The First Hospital of Jiaxing, Jiaxing, 314000, People’s Republic of China; 4Department of Dermatology, Union Hospital, Tongji Medical College, Huazhong University of Science and Technology, Wuhan, 430000, People’s Republic of China
Correspondence: Ruzhi Zhang, Email [email protected]
Background: Active generalised vitiligo (AGV) is an autoimmune disorder characterised by progressive melanocyte loss. However, the molecular mechanisms underlying AGV, particularly the roles of non-coding RNAs and their interaction with proteomic changes, remain poorly understood. The aim of this study was to systematically identify key regulatory networks and molecular changes in AGV by integrating proteomic and whole-transcriptome data.
Methods: Data-independent acquisition mass spectrometry (DIA-MS) and whole transcriptome sequencing (WTS) were performed on whole blood samples from three AGV patients and three healthy individuals (HIs). Bioinformatic analyses were then used to identify differentially expressed proteins (DEPs), messenger RNAs (mRNAs), long non-coding RNAs (lncRNAs), circular RNAs (circRNAs) and microRNAs (miRNAs). Co-expression and competing endogenous RNA (ceRNA) networks were constructed and visualised using Cytoscape. Key hub genes and cytokine levels were then validated using quantitative reverse transcription PCR (qRT-PCR) and immunoassays in an independent cohort.
Results: We identified 15 DEPs and 669 differentially expressed mRNAs (DEmRNAs), as well as significant alterations in 258 lncRNAs, 29 miRNAs and 44 circRNAs in AGV. Functional enrichment analysis revealed their involvement in chemokine signaling and lysosomal pathways. Protein-protein interaction network analysis revealed ten hub genes, including CXCL8, CXCR1, CXCR2 and IL1R2. We established a core ceRNA regulatory network featuring long non-coding RNAs (eg NUTM2B-AS1, LINC00894), circular RNAs (eg ASAP1, CDR2) and microRNAs (eg hsa-mir-3613-3p, hsa-mir-511-5p) that potentially modulate inflammatory responses. Experimental validation confirmed significantly elevated levels of the pro-inflammatory cytokines IL-8 and TNF-α in AGV patients, and qRT-PCR results for nine of the ten hub genes were consistent with the sequencing data.
Conclusion: Our integrated multi-omics analysis uncovers a novel ceRNA network and highlights the significant upregulation of IL-8 and TNF-α in AGV. These findings provide new insights into the post-transcriptional regulatory mechanisms and inflammatory pathways driving AGV and offer potential therapeutic targets.
Keywords: active generalized vitiligo, proteomics, whole-transcriptome sequencing, competing endogenous RNA, interleukin-8
Introduction
Vitiligo is an autoimmune skin condition characterised by the progressive loss of functional melanocytes, resulting in the chronic depigmentation of the skin and mucous membranes.1 Vitiligo is one of the most common depigmenting skin disorders, affecting approximately 0.5–2% of the global population. While not life-threatening or physically disabling, vitiligo carries a substantial psychosocial burden. Patients often experience significant emotional distress, social stigma, low self-esteem, and a reduced quality of life comparable to or even worse than that of patients with psoriasis or atopic dermatitis. The unpredictable course of the disease, including episodes of progression and stabilization, further exacerbates patient anxiety.2 Therefore, there is an urgent need for in-depth studies to identify new molecular markers and develop more effective therapeutic targets for vitiligo.
Recent research has emphasised the important role of cytokines in diagnosing vitiligo.3 Changes in protein levels at different stages of the disease aid in the diagnosis and the evaluation of treatment efficacy. Elevated levels of specific autoantibodies, cytokines and oxidative stress-related proteins have been identified as biomarkers for early diagnosis of vitiligo.4 Conversely, changes in these proteins, such as a decrease in inflammatory markers and an increase in proteins associated with melanin synthesis, have been observed during treatment and are indicative of its efficacy.5
Competing endogenous RNAs (ceRNAs) are a class of non-coding RNAs, including long non-coding RNAs (lncRNAs) and circular RNAs (circRNAs), that regulate gene expression by acting as natural miRNA sponges. According to the ceRNA hypothesis, lncRNAs and circRNAs can competitively bind to shared microRNAs (miRNAs), thereby modulating the expression of miRNA target mRNAs.6 This regulatory mechanism has been implicated in various autoimmune and inflammatory diseases. However, the role of ceRNA networks in active generalized vitiligo (AGV) remains largely unexplored.
Several multi-omics studies have explored vitiligo pathogenesis. Dysregulated lncRNAs and ceRNA networks in vitiligo lesions have been identified by transcriptomic analysis, and altered oxidative stress‑related proteins in the serum of active vitiligo patients have been revealed by proteomic approaches.7 However, most studies focused on localized or stable vitiligo, leaving the integrated proteomic and transcriptomic landscape of active generalized vitiligo (AGV) largely unknown. Thus, we performed comprehensive multi-omics analysis of AGV using DIA-MS and whole transcriptome sequencing to address this gap.
Mass spectrometry (MS) is a key technology in proteomics, used to identify and quantify the expression levels of proteins and peptides. Data Independent Acquisition Mass Spectrometry (DIA-MS) is a cutting-edge proteomic approach that facilitates the generation of permanent digital proteome maps, enabling highly reproducible retrospective analysis of cellular and tissue samples.8 By characterizing the molecular profile of diverse samples, DIA-MS, coupled with advanced bioinformatics analysis, demonstrates increased sensitivity in detecting peptides and proteins that are typically missed by conventional MS experiments. Research has identified candidate urinary protein biomarkers for predicting treatment response using proteomic analysis.9 The present study was designed to investigate the cellular and molecular changes in patients with active generalized vitiligo (P-AGV).
Materials and Methods
Patient Enrolment and Whole Blood Samples (WBS) Collection
Whole blood samples (WBS) were collected from three P-AGV and from three HIs. The clinical diagnosis and classification of vitiligo were made according to the criteria of the Chinese Society of Dermatology. This study was conducted in accordance with the principles of the Declaration of Helsinki. The study was approved by the Ethics Committee of the Third Affiliated Hospital of Soochow University (approval number 201202013–02). Written informed consent was obtained from all subjects who provided samples, including the patient whose images are presented in Figure 1. Sera were used for 4D-labelled quantitative proteomic assays, and peripheral blood mononuclear cells (PBMCs) were used for transcriptomic analysis.
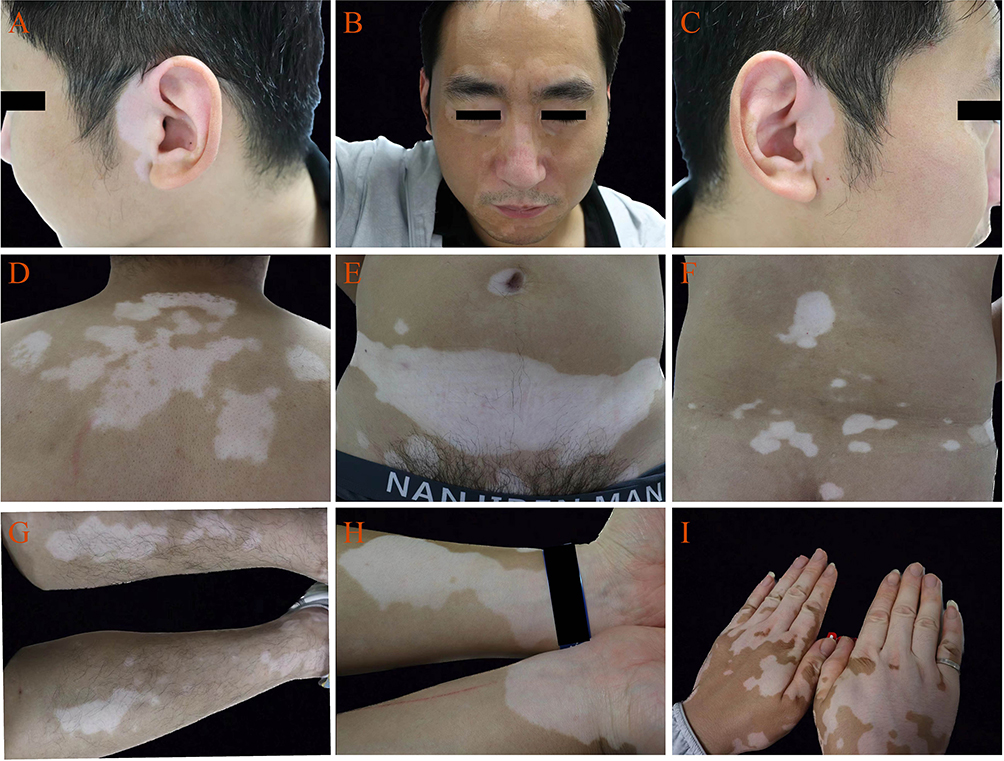 |
Figure 1 Skin lesions in P-AGV. (A) Left preauricular area; (B) Midface. (C) Right preauricular area; (D) Back of shoulder; (E) Abdomen; (F) Lower back; (G) Flexor side of left upper extremity; (H) Flexor side of wrists; (I) Back of hands and fingers. |
Analysis of Data Dependent and Independent Acquisition
Each sample was prepared independently and subjected to proteolytic digestion and DIA analysis. The resulting DIA files were imported into Spectronaut Pulsar (Biognosys AG, Schlieren, Switzerland) for analysis, providing a comprehensive characterization and quantification of all samples. MS analysis included protein extraction, peptide digestion, chromatographic classification and liquid chromatography-tandem MS (LC-MS) of dependent acquisition (DDA). The experimental procedures included DIA analysis, quality control and bioinformatic analysis.
Database Search, RNA Sequencing, Bioinformatics and Annotation
The DDA data were identified using MaxQuant (version 1.5.3.30; https://maxquant.org). RNA sequencing of various types, including mRNAs, miRNAs, lncRNAs and circRNAs, was performed by Shanghai Applied Protein Technology (Zhejiang, China) using the Illumina TruseqTM RNA Sample Preparation Kit. Further details on the RNA sequencing process can be found in the Supplementary Information (Supplementary 1–4). Analysis of differentially expressed genes (DEGs) was performed using the edgeR programme. Gene Ontology (GO) functions and Kyoto Encyclopedia of Genes and Genomes (KEGG) pathways were evaluated in differentially expressed proteins (DEPs) and DEGs.
Co-Expression Network of Differentially Expressed lncRNAs and mRNAs
Co-expression networks were constructed by calculating the Pearson correlation coefficients and p-value between multiple genes. Transcripts were filtered using log2 fold change>0 and p < 0.05. The transcripts of the top 44 differentially expressed mRNAs and long non-coding RNAs (lncRNAs) were selected to construct co-expression networks. The resulting co-expression and competing endogenous RNA (ceRNA) networks were then visualized using Cytoscape software (version 3.9.1; https://cytoscape.org).
Construction of ceRNA Networks
The co-expression relationships of lncRNA - mRNAs and circRNA - mRNAs, and the regulatory relationships of differentially expressed miRNA-mRNAs and miRNA-lncRNAs were integrated. The positive correlation expressions of circRNA-mRNAs and lncRNA-mRNAs, the miRNAs that could simultaneously regulate lncRNAs/circRNAs and mRNAs, and the relationships between these mRNAs and lncRNA/circRNAs regulated by the miRNAs were given more attention. To facilitate understanding, the resulting networks were visually displayed using Cytoscape software (version 3.9.1; https://cytoscape.org).
Quantitative Real-Time Polymerase Chain Reaction (qRT-PCR)
PBMCs were isolated from three millilitres of each WBS using Ficoll-Paque (Sigma Aldrich, St. Louis, MO, US) by density gradient centrifugation, followed by two washes with 1X phosphate buffer saline (PBS). The PBMC pellets were then subjected to RNA isolation. Twenty milligrams of each total RNA was converted to cDNA by RT-qPCR using a Maxima First Strand cDNAs Synthesis Kit (Thermo Fisher Scientific). The expression levels of cell cycle regulatory genes (HBB, MME, CXCL8, IL1R2, KITLG, FCGR3B, CXCL1, XCR1, CXCR1 and CXCR2) were then detected using GAPDH as a reference gene. The specific primer sequences are listed in Table 1. The amplification reactions were performed in 20 μL reaction volumes containing 10 µL 2X TB GreenTM Premix Ex TaqTM II (TaKaRa, site).
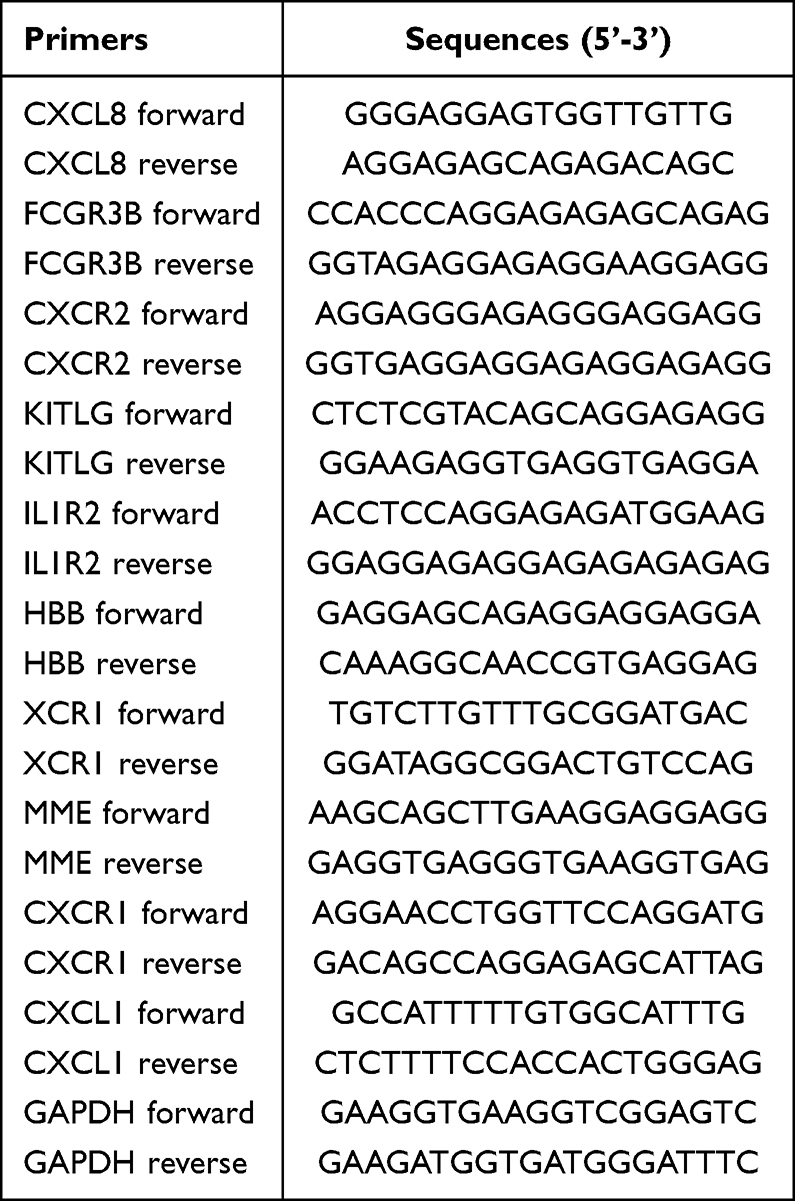 |
Table 1 Sequence of Primers |
Enzyme-Linked Immunosorbent Assay (ELISA) and Flow Cytometry
Serum levels of cytokines and autoantibodies were measured using commercial ELISA kits following the manufacturers’ instructions (IL-8, IL-10, IL-12p70, TNF-α, A-TG, A-TPO). Lymphocyte subsets (CD3+, CD4+, CD8+, CD19+) were determined by flow cytometry. Peripheral blood samples were centrifuged at 3000 rpm for 10 minutes to separate serum, which was stored at −80°C until analysis. Levels of cytokines were determined by flow cytometry using fluorescence-conjugated antibodies according to standard protocols.
Statistical Analysis
Statistical analyses were performed using GraphPad Prism 8 (GraphPad Software, San Diego, CA, USA) and SPSS (version 25.0, Chicago, IL, USA). Non-normally distributed data were analyzed using the Mann–Whitney U-test; paired sample comparisons were performed using the Wilcoxon signed-rank test. For correlation analysis between proteomic and transcriptomic data, Pearson’s correlation coefficient (r) with 95% CI Statistically significant values were defined as p <0.05.
Results
Screening of DEPs in WBS from P-AGV and HIs
Comprehensive transcriptomic and proteomic studies were performed on WBS from three pairs of P-AGV and HIs samples using DIA and RNA-Seq analyses. All samples passed quality control. The P-AGV samples exhibited characteristic skin lesions (Figure 1). A total of 602 proteins were identified, 572 of which were calculated with a false discovery rate (FDR) of 1%. DEPs were designated based on relative quantity changes greater than 1.5-fold and p < 0.05. Among the identified proteins, eight DEPs were significantly downregulated and seven were upregulated, whereas the majority showed no statistically significant changes. Volcano plots were used to visualize these results and showed significant differences (Figure 2A). To further analyze the DEPs, they were grouped and classified using a hierarchical clustering algorithm and presented as a heat map (Figure 2B).
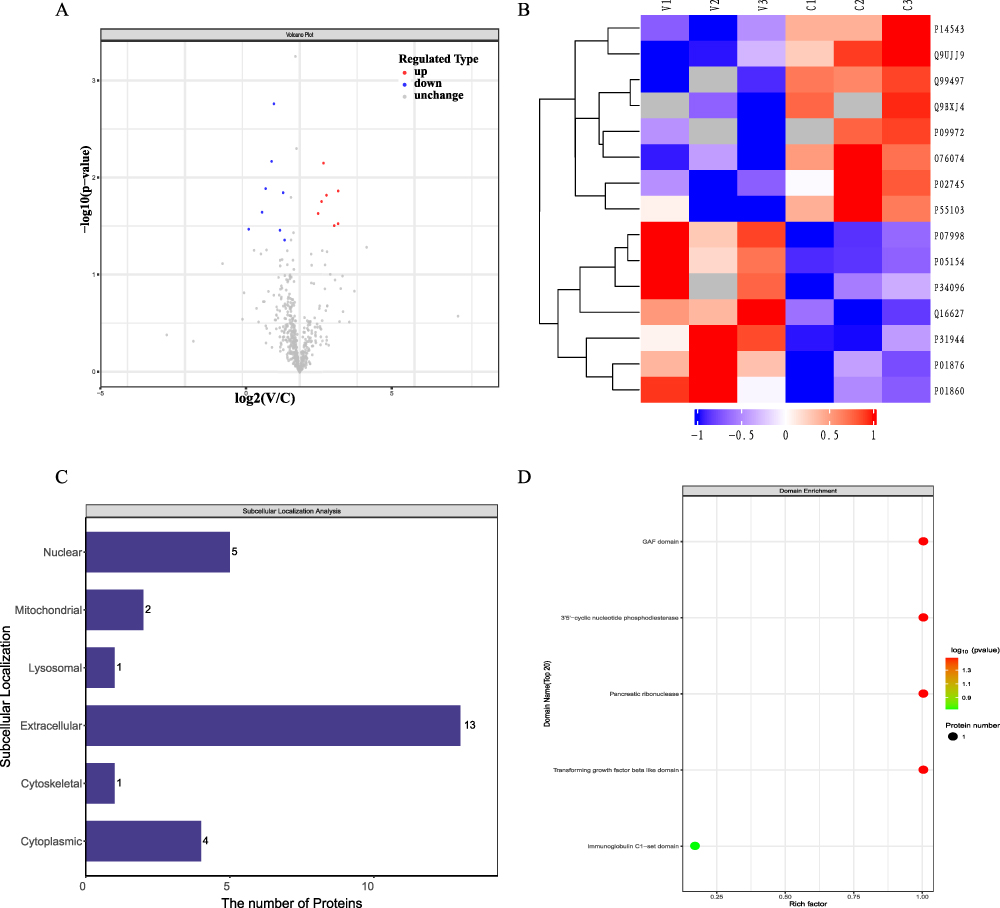 |
Figure 2 Volcano plots (A) and heat map (B) of the DEPs between the P-AGV and the HIs (fold change>1.5 and p<0.05); organelle localization of DEPs (C); domain prediction of DEPs (D). |
Biological Dysfunction in AGV
The organelle localization of DEPs was analyzed using CELLO software, which showed that extracellular, nuclear and cytoplasmic locations are significant sites for DEPs function (Figure 2C). The domain prediction of DEPs was performed using the Interproscan domain measurement software. Subsequently, the domain enrichment of DEPs was subjected to Fisher’s exact test. This revealed that the GAF domain, 3’5’-cyclic nucleotide phosphodiesterase, pancreatic ribonuclease and transforming growth factor beta-like domain may play important roles in the key functional regions and biological functions of DEGs (Figure 2D).
GO and KEGG Enrichment Analysis of DEPs
GO enrichment analysis of DEPs was performed using Blast2Go software (https://www.blast2go.com/). The resulting DAGs (https://www.rdocumentation.org/) illustrate hierarchical functional domains, in which lower branches represent more specific terms. The analysis revealed an enrichment of DEPs in collagen trimer, RNA phosphodiester bond hydrolysis and ribonuclease A activity (Figures 3A–C). KEGG pathway analysis revealed the most significant pathways to be chemokines and lysosomes, which are important signaling pathways (Figure 3D).
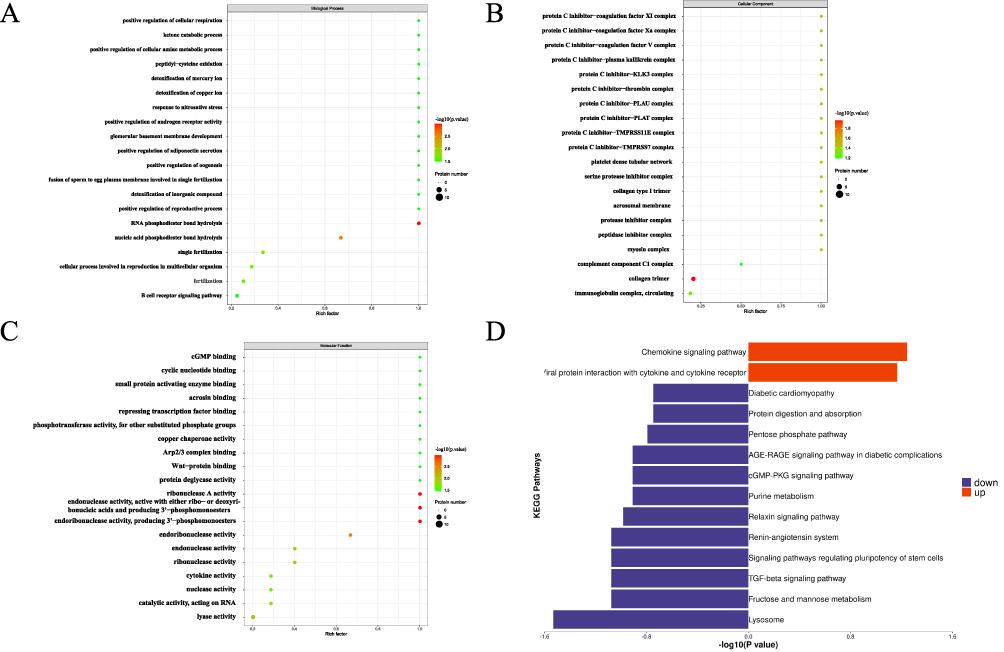 |
Figure 3 Enrichment analysis of DEPs. (A–C) Biological process (BP), cellular component and molecular function (MF) in the enrichment analysis of GO; (D) Enrichment analysis of KEGG. |
Identification of Differentially Expressed mRNAs, miRNA, circRNAs and lncRNAs
To further identify regulatory networks, a comparative transcriptomic study of three pairs of WBSs was conducted simultaneously. The analysis identified the following that met the cut-off criteria of |log2FoldChange|>0 and p<0.05: 669 differentially expressed mRNAs (245 up and 424 down), 258 differentially expressed lncRNAs (93 up and 165 down), 29 differentially expressed miRNAs (20 up and 9 down), and 44 differentially expressed circRNAs (23 up and 21 down) (Figure 4A–D).
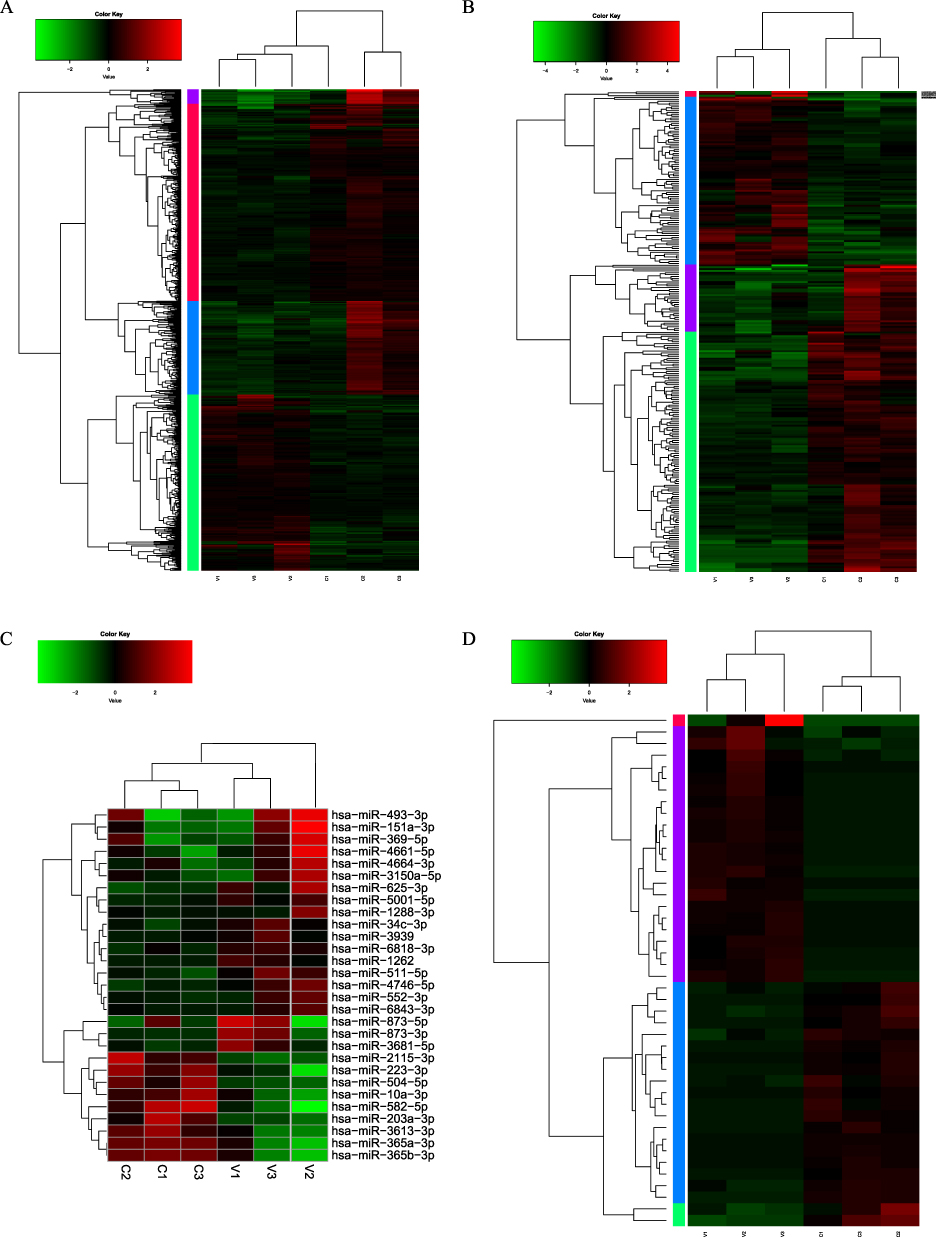 |
Figure 4 Heatmaps illustrating the differential expression of RNAs between P-AGV and HIs. (A) mRNA, (B) lncRNA, (C) miRNA, (D) circRNA. |
Subsequent analysis of the differentially expressed mRNAs, circRNAs and lncRNAs revealed the presence of four modules (red, blue, purple and green). The mRNAs with the greatest differential expression were KBTBD11-OT1, KCNJ15, PGPEP1 and CNTNAP3, while the lncRNAs with the greatest differential expression were AC107959.4, AC003973.3, AL353746.1 and AC215522.2. The circRNAs with the greatest differential expression included ABCA13, AFF2, ANKRD36, and RPRD1A. The most differentially expressed miRNAs were hsa-miR-582-5p, hsa-miR-625-3p, hsa-miR-2115-3p and hsa-miR-151a-3p.
Functional Enrichment Analysis of lncRNAs, miRNAs Target Genes and circRNAs Parent Genes
To gain insight into the proteins identified and quantified in these data, GO function and KEGG pathway analyses were performed on the parent genes of circRNAs, as well as the target genes of miRNAs and lncRNAs. GO enrichment analysis revealed that the BP represented included the regulation of organelle organization (GO:0033043), the metabolic process of cellular macromolecules (GO:0044260), and the negative regulation of biological processes (GO:0048519). The CC was found to be the nucleoplasm (GO:0005654) and the transport vesicle (GO:0030133). The MF was found to be the ATPase-coupled vitamin B12 transmembrane transporter activity (GO:0015420). Meanwhile, the NF-kappa B signalling, cancer and endocytosis pathways were identified as the top KEGG enrichment pathways (Figure 5).
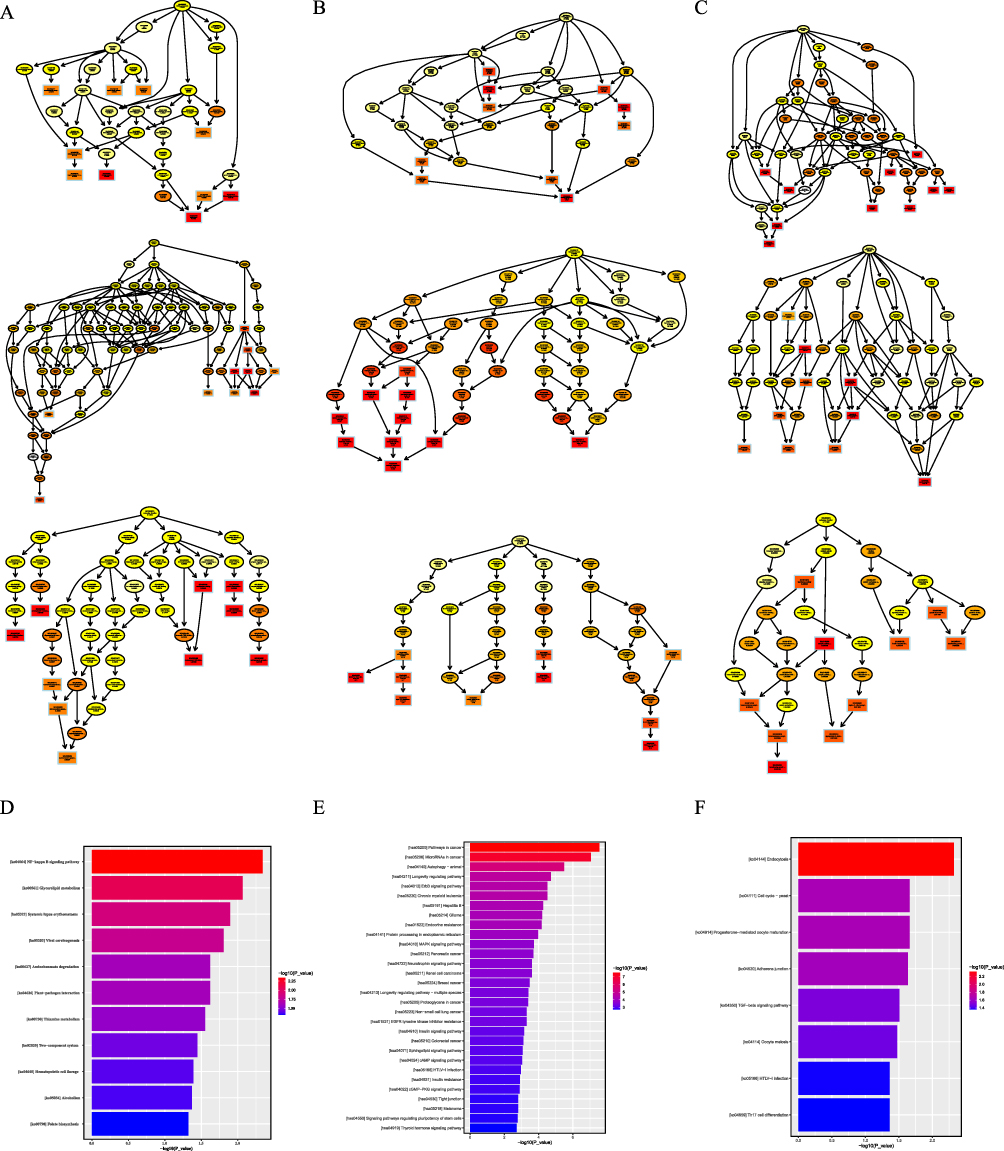 |
Figure 5 Enrichment analysis of target genes of lncRNAs and miRNAs and parental genes of circRNAs. GO analysis of differentially expressed target genes of lncRNAs (A) and miRNAs (B) and parental genes of circRNAs (C); KEGG pathway analysis of target genes of lncRNAs (D), miRNAs (E) and circRNAs (F). |
Correlation Analysis Between Proteomics and Transcriptomics
A total of 362 DEPs and 669 DEGs were identified. However, no significant co-expression was detected between the DEPs and DEGs. (Table 2 and Figure 6A). The expression trend was then analysed using a correlation test on all quantified proteins and transcripts in the two sample sets. The resulting correlation coefficient was −0.0199 (Figure 6B). Cluster analysis provides a more visual representation of the expression patterns of mRNAs and proteins (Figure 6C). Functional enrichment analyses were then performed on the proteomics and transcriptomics data. The results of these analyses indicated significant negative regulation of muscle contraction (biological process). No significant enrichment was observed for molecular functions or cellular components. (Figure 6D–F).
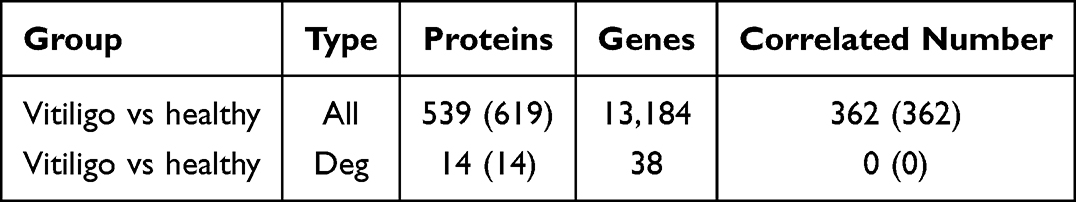 |
Table 2 Correlation Between Proteins and Genes |
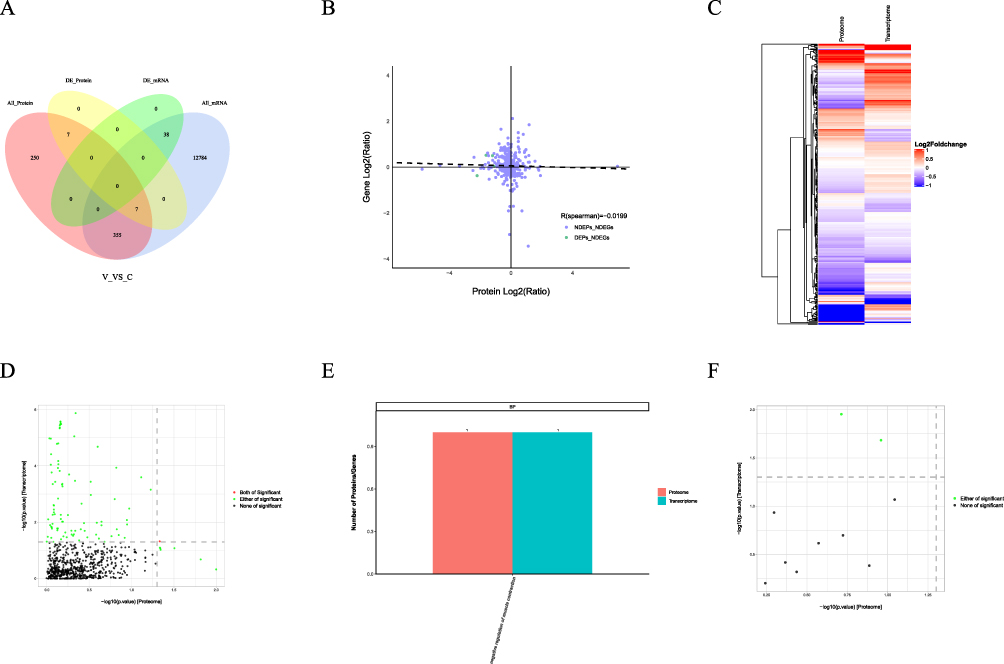 |
Figure 6 Correlation analysis of proteomes and transcriptomes. (A) Venn diagram showing the overlap between proteomes and transcriptomes; the association between quantitative proteins and their transcripts (B); cluster analysis of protein and mRNA expression patterns (C); correlation analysis of GO enriched associated entries (D); (E) GO enrichment analysis; (F) correlation analysis of KEGG enriched associated entries. |
Construction of ceRNA Networks in AGV
A protein-protein interaction (PPI) network analysis of the top 60 differentially expressed mRNAs was performed using the STRING database (https://string-db.org/) and Cytoscape software (version 3.9.1). The results revealed that CXCR1, CXCR2, CXCL1, CXCL8, IL1R2, KITLG, FCGR3B, XCR1, HBB and MEE as hub genes, as determined by Spearman correlation (Figure 7A). The mRNA, miRNA, lncRNA and circRNA data from the whole transcriptome sequencing were integrated to construct ceRNA regulatory networks. First, TargetScan and miRWalk were used to predict interactions between miRNAs and mRNA mRNAs in both databases, and these were then incorporated into the ceRNA network. Genes with opposing expression trends relative to their respective miRNAs were then identified. MiRanda, PITA and RNA hybrid analysis were then used to predict lncRNA and miRNA pairs. Finally, the co-expression of mRNA-lncRNA and mRNA-circRNA pairs was analyzed and the ceRNA network mapped using Cytoscape (version 3.9.1) (Figure 7B). A total of eight lncRNAs, twenty-five miRNAs and thirty-two mRNAs were included in the ceRNA network. The circRNA-miRNA-mRNA network, comprising 17 circRNAs, 22 miRNAs and 32 mRNAs, was analyzed and visualized using Cytoscape (version 3.9.1) (Figure 7C). The ceRNA network analysis identified several key regulators potentially involved in AGV. These included lncRNAs (NUTM2B-AS1, LINC00894, HELLPAR, AL590787.1), miRNAs (hsa-miR-3613-3p, hsa-miR-511-5p, hsa-miR-6818-3p), and circRNAs (ASAP1, CDR2, C18orf25).
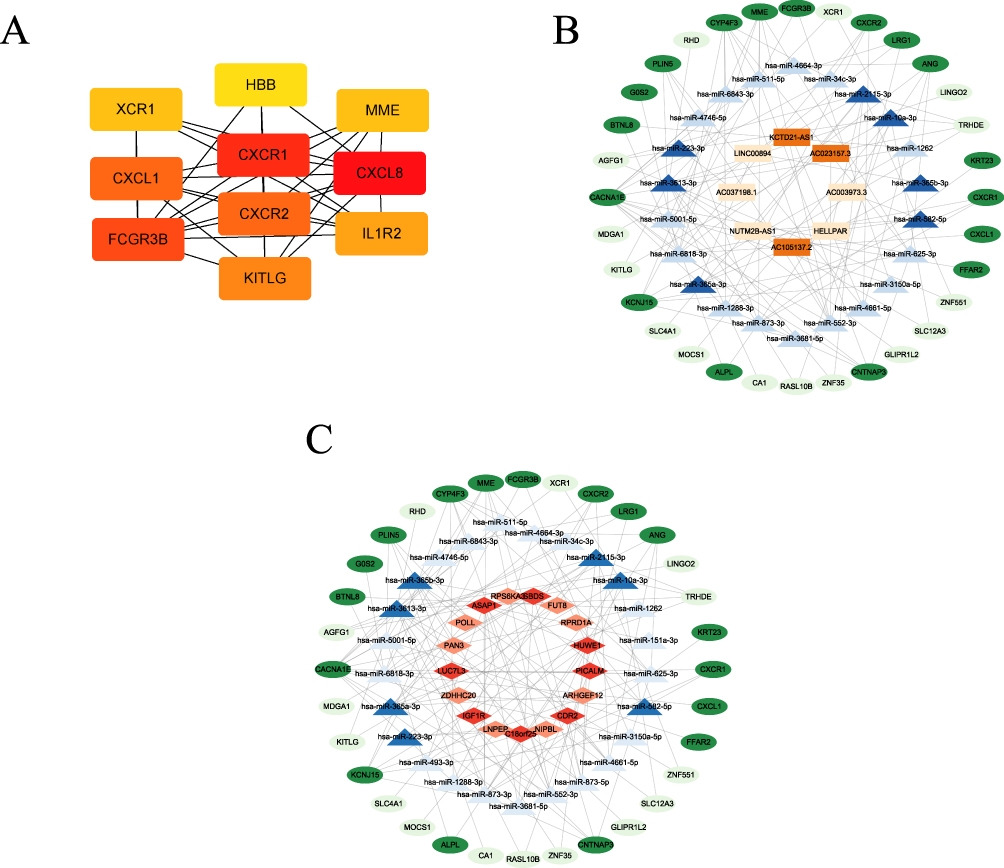 |
Figure 7 The network of lncRNAs, circRNAs, miRNAs and mRNAs. (A) Ten hub genes of the top 60 differentially expressed mRNAs identified by CytoHubba; the network diagram of lncRNA-miRNA-mRNA (B) and circRNA-miRNA-mRNA (C); the colours represent the following: blue for miRNA, green for mRNA, Orange for lncRNA, red for circRNA. Dark colours represent down-regulated genes and light colours represent up-regulated genes. |
A total of ten pairs of P-AGV and HIs were selected for additional blood sampling. During the active phase of vitiligo, the levels of the pro-inflammatory cytokines IL-8 and TNF-α increased significantly (Table 3), though the levels of CD3+, CD4+, CD8+, CD19+, IL-10, IL-12p70, A-TG and A-TPO did not changed significantly. To verify the expression levels of these 10 hub genes further, an additional 10 pairs of PBMC samples from P-AGV and HIs were collected for validation. The experimental results demonstrated that the expression levels of nine genes were consistent with the sequencing results, with the exception of FCGR3B. Comparative analysis of the expression levels of selected genes in the study and control groups revealed a statistically significant increase in the expression of genes such as CXCL8, CXCR2, IL1R2, MME, CXCR1 and CXCL1. Conversely, the expression of KITLG, HBB and XCR1 showed a significant decrease (Figure 8).
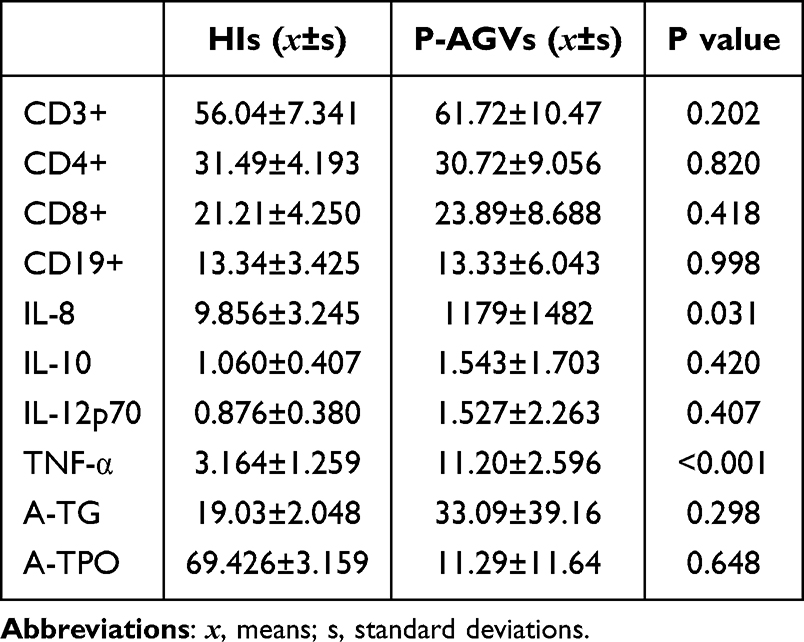 |
Table 3 Levels of Cytokines in P-AGVs |
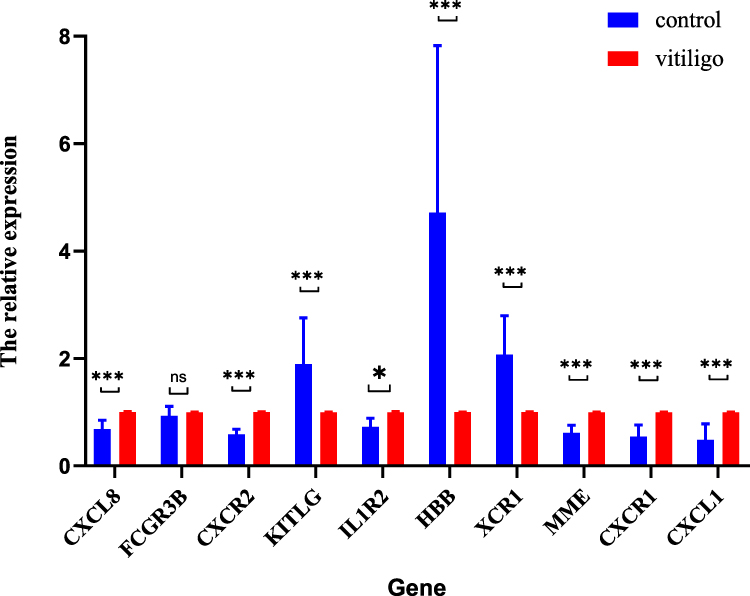 |
Figure 8 Ten hub genes differ between P-AGV and HIs. The significance levels are indicated by the following p-values: *p < 0.05, **p < 0.01, ***p < 0.001; The term “ns” indicates that the difference is not significant. |
Discussion
The onset and progression of vitiligo depend on the number and function of melanocytes (MCs) in the skin. Two key factors contributing to the destruction of MCs are oxidative stress and immune dysregulation.10 Levels of reactive oxygen species (ROS) are positively correlated with levels of pro-inflammatory cytokines. Studies has demonstrated increased serum levels of pro-inflammatory factors (IL-6, TNF-α and IL-8) and certain anti-inflammatory/immunomodulatory cytokines (IL-5 and IL-10) in individuals with active vitiligo.11 Furthermore, HMGB1, which is released by MCs under conditions of oxidative stress, has been shown to promote IL-8 secretion by keratinocytes.12 IL-8, a versatile cytokine, plays a central role in acute inflammatory responses to infection and injury. In addition to its role in the immune system, IL-8 has been shown to inhibit proliferation of MCs and induce their apoptosis,13 as well as inducing chemotaxis of neutrophils. IL-8 expression levels was significantly higher in P-AGV than in His.14 Taken together, these observations suggest a key role for IL-8 in the progression of vitiligo.
The substantial role of IL-8 in the progression of vitiligo emphasises the significant impact of cytokines and chemokines on the disease process. Building on this observation, other biomarkers such as IL-1R2 have also been associated with the immune dysregulation observed in vitiligo, which further emphasises the complex interplay of these factors in disease progression. IL-1R2 is a gene that encodes a membrane-bound protein and has been identified as a critical regulator of immune responses. Furthermore, IL-1R2 has been proposed to act as a decoy receptor for IL-1.15 The membrane-bound form of SCF (also known as KITLG) is overexpressed in vitiligo lesions, suggesting that mSCF (stem cell factor) stimulates melanogenesis in response to injury.16 Autoimmunity is a key mechanism involved in the progression of vitiligo. Changes in the expression levels of various cytokines (IFN-γ, TNF-α, interleukins and chemokines) and their interactions promote immune responses that induce or exacerbate the appearance and development of vitiligo.17 Paolo Custurone et al have proposed that TNF-alpha exerts a bidirectional effect on melanin formation On the one hand, TNF-α has been shown to induce MC damage and inhibit melanin production.3 On the other hand, it has also been shown to improve MC function and maintain their survival.
Genomics, particularly functional genomics (including transcriptomics, proteomics, metabolomics and epigenomics), has been explored to identify potential therapeutic molecular targets for non-neoplastic diseases.18 An increasing number of clinical datasets are being made publicly available, and the Gene Expression Omnibus (GEO) public database can be used to identify novel targets, drug indications and drug response biomarkers.19 Integrating data mining and analytical tools into the biomedical pipeline could accelerate development times, reduce costs, and improve bioactive compounds compared to traditional experimental approaches. A substantial body of sequence, gene expression, proteomics and metabolomics data is now available for vitiligo studies.
The lack of significant co-expression between the proteomic and transcriptomic data can be attributed to a number of factors. Firstly, the limited sample size in this study may have reduced the statistical power, thereby hindering the detection of significant co-expression patterns. Secondly, tissue specificity is a crucial, as gene expression can vary widely between different tissues, leading to discrepancies between mRNA and protein levels.20 Post-transcriptional regulation, including mRNA stability, alternative splicing and miRNA-mediated regulation, can affect protein synthesis independently of transcript abundance.21 Post-transcriptional modifications, such as phosphorylation and acetylation, can also regulate protein function and stability, which are not captured by transcriptomic data.22 Finally, discrepancies in mRNA and protein half-lives can contribute to the temporal discrepancy between transcript and protein levels, as proteins tend to have longer half-lives than their corresponding mRNAs.23 The combined effect of these factors leads to the lack of substantial co-expression observed between the proteomic and transcriptomic data.
Research has shown a strong correlation between the development of vitiligo and the presence of lncRNAs and circRNAs.24 These non-coding RNA molecules perform a variety of biological functions. In recent years, the mechanisms underlying these functions have gradually been elucidated, including the ceRNA hypothesis and the miRNA sponge effect. The ceRNA hypothesis proposes that lncRNAs and circRNAs can act as miRNA sponges to regulate the expression of target genes. For instance, hsa-miR-3613-3p, hsa-miR-511-5p and hsa-miR-6818-3p have been associated with regulating immune response, which is a vital component of autoimmune diseases such as vitiligo and may play a significant role in AGV pathogenesis.25 Secondly, lncRNAs can act as ceRNAs to modulate the expression of target genes. For instance, NUTM2B-AS1 and LINC00894 have been found to interact with transcription factors and protein complexes, thereby regulating mRNA transcription and immune cell signalling. LINC00894 has been shown to regulate immune cell differentiation and inflammatory responses26 that are critical in autoimmune diseases such as AGV. Furthermore, some lncRNAs, including HELLPAR and AL590787.1, have been found to contain open reading frames (ORFs) that may encode functional peptides or small proteins.27 These peptides may modulate immune responses and melanocyte function in AGV. Screening of lncRNAs and circRNAs was performed using co-expression analysis, and the ceRNA network was subsequently mapped. Further investigation is required into the prognostic value and underlying mechanisms of the identified miRNAs, lncRNAs and circRNAs.
Hsa-miR-511-5p acts as a master regulator of immune homeostasis. It promotes M1 macrophage polarisation by inhibiting STAT3/SOCS3, enhances dendritic cell function by suppressing BYSL to boost CD8+ T cell activity and exerts anti-inflammatory effects by targeting TRAF6/NF-κB to reduce IL-6/TNF-α production.28 In vitiligo, deficiency of hsa-miR-511-5p disrupts DC-T cell communication, impairs antioxidant defences (KEAP1/Nrf2/HO-1) and disrupts the Th17/Treg balance. This increases a pro-oxidant autoimmune microenvironment that targets melanocytes. Hsa-miR-3613-3p modulates cell cycle (BIRC5/CDK1/NUF2) and the responses to oxidative stress.29 In vitiligo, its downregulation may impair Nrf2-mediated antioxidant defences (HO-1/SOD2), while BIRC5 overexpression promotes autoantigen exposure and CD8+ T cell activation.4 Concurrent CDK1 dysregulation can disrupt the T cell cycle, exacerbating the Th17/Treg (IL-17) imbalance and autoimmune melanocyte destruction. HELLPAR promotes RRM2 expression by sponging hsa-let-7i-5p, thereby exacerbating oxidative stress (ROS) and impaired antioxidant responses (HO-1/SOD2).30 Through STAT3 activation and impaired autoantigen presentation, it can drive Th17 polarisation (IL-17) while suppressing Tregs, thereby promoting an inflammatory milieu for melanocyte attack.27
C18ORF25 regulates melanocyte function by maintaining calcium homeostasis, its deficiency disrupts the balance of intracellular calcium, leading to oxidative stress and apoptosis. As an AMPK substrate, C18ORF25 modulates cell survival via the AMPK/mTOR autophagy pathway.31 Immunologically, C18ORF25 influences GTPase (Rac1/RhoA) activity to promote Th17 responses and cytotoxic T cell infiltration, while impaired PKA/cAMP signalling enhances the production of pro-inflammatory cytokines (IFN-γ/IL-17). Furthermore, C18ORF25 dysfunction triggers the release of damage-associated molecular patterns (DAMPs), which activate dendritic cells and autoantibody production, thereby accelerating vitiligo progression. ASAP1 regulates immune cell migration (macrophage polarisation and T-cell activation) and suppresses NF-κB-mediated inflammatory responses to maintain immune homeostasis.32 Its deficiency may activate AKT signalling, leading to melanocyte oxidative stress and autophagy dysfunction, while promoting self-antigen (HSP70) exposure and Th17 differentiation, thereby triggering autoimmune attack against melanocytes and contributing to the pathogenesis of vitiligo.
Our findings align with previous reports of elevated IL-8 and TNF-α in active vitiligo, yet extend them by integrating these cytokines into a ceRNA regulatory framework.13 Compared with transcriptome-only studies, our multi-omics approach reveals previously unrecognized interactions among lncRNAs, circRNAs, and miRNAs that may govern inflammatory pathways in AGV. Similar ceRNA networks involving chemokine signaling have been implicated in other autoimmune diseases, such as rheumatoid arthritis and psoriasis, suggesting shared post-transcriptional mechanisms. Thus, our study not only corroborates existing evidence but also provides a novel molecular landscape that bridges cytokine dysregulation with non-coding RNA networks in AGV.
In this study, we conducted a quantitative proteomics analysis of blood samples from P-AGV. This analysis was based on DIA labeling combined with RNA-Seq transcriptomics. Our analysis revealed the differential expression of 15 proteins, 669 mRNAs, 258 lncRNAs, 29 miRNAs and circRNAs in WBS from P-AGV compared to HIs. As proteins are recognized as the primary molecular building blocks, this highlights the need for further proteomic research. Functional enrichment analysis of the DEPs revealed that they were primarily involved in chemokine signalling pathways and lysosomes. By contrast, the differentially expressed mRNAs were predominantly enriched in the haematopoietic lineage, leishmaniasis and phagosomes. The discrepancies observed between the proteome and the transcriptome may be due to the use of PBMCs and sera instead of tissue samples.
In addition, 10 hub genes were identified from the top 60 differentially expressed mRNAs (30 up-regulated and 30 down-regulated), including CXCR1, CXCR2 and XCR1 (chemokine receptors), CXCL1, CXCL8 (chemokines), IL1R2, KITLG, FCGR3B, HBB and MEE. It has been shown that when the chemokine CXCL8 binds to CXCR1, it promotes the entry of T cells and neutrophils into sites of inflammation. Research has shown increased levels of these chemokines in the sera of patients with active and stable vitiligo, suggesting a potential role in the progression and maintenance of the condition.33 Furthermore, another study demonstrated that CXCL1, CXCL8 and their receptor CXCR2 are components of the autocrine machinery present in proliferating human MCs.34
In this study, we identified 15 differentially expressed proteins (DEPs) and 669 differentially expressed mRNAs (DEmRNAs) in active generalized vitiligo (AGV) and established a core competing endogenous RNA (ceRNA) network involving lncRNAs, circRNAs, and miRNAs. Furthermore, we validated significantly elevated levels of IL-8 and TNF-α in AGV patients and confirmed the clinical relevance of hub genes including CXCL8, CXCR1, and CXCR2.
The present study used the same cohort of samples to explore the target of precision medicine treatment and to avoid the potential effects of between-sample heterogeneity. However, this study is limited by the small sample size of just three pairs of AGV patients and healthy controls, which could reduce statistical power and affect the generalizability of the results. A small sample size increases the risk of Type II errors (false negatives) and may lead to overfitting, resulting in less reproducible results in larger cohorts.
While our multi-omics findings provide novel insights into the IL-8/TNF-α axis and ceRNA networks in active generalized vitiligo, their translation into clinical practice requires further validation. Currently, the high cost and complexity of DIA-MS and whole transcriptome sequencing preclude routine diagnostic use. However, identified biomarkers such as IL-8, TNF-α, CXCR1, and CXCR2 could potentially be measured via ELISA, qRT-PCR, or flow cytometry in future clinical settings. Our work lays a molecular foundation for developing simplified, cost-effective assays to guide treatment decisions and disease activity monitoring after rigorous clinical validation.
Conclusions
Our integrated multi-omics analysis uncovers a novel ceRNA network and highlights the significant upregulation of IL-8 and TNF-α in AGV. These findings provide new insights into the post-transcriptional regulatory mechanisms and inflammatory pathways driving AGV and offer potential therapeutic targets.
Data Sharing Statement
The data supporting the results of this study are available upon request from the corresponding author.
Author Contributions
All authors made a significant contribution to the work reported, whether that is in the conception, study design, execution, acquisition of data, analysis and interpretation, or in all these areas; took part in drafting, revising or critically reviewing the article; gave final approval of the version to be published; have agreed on the journal to which the article has been submitted; and agree to be accountable for all aspects of the work.
Funding
This work was supported by the Frontier Technology of Cell Therapy Foundation of Changzhou Xitaihu (Grant/Award Number: 2022-P-014), the Jiaxing Science and Technology Public Welfare Research Special Project (Grant/Award Number: 2025CGW072), the Postgraduate Academic Innovation Project in Anhui Province (Grant/Award Number: 2022xscx123) and the Project Fund for Excellent Research and Innovation Teams in Universities of Anhui Province (Grant/Award Number: 2024AH010032).
Disclosure
The authors declare no competing interests in this work.
References
1. Giri P, Desai D, Dwivedi M. Animal models unraveling the complexity of vitiligo pathogenesis. Autoimmun Rev. 2024;23(4):103515. doi:10.1016/j.autrev.2024.103515
2. Singh M, Kotnis A, Jadeja SD, Mondal A, Mansuri MS, Begum R. Cytokines: the yin and yang of vitiligo pathogenesis. Expert Rev Clin Immunol. 2019;15(2):177–16. doi:10.1080/1744666X.2019.1550358
3. Migayron L, Bordes S, Closs B, Seneschal J, Boniface K. Type-2 immunity associated with type-1 related skin inflammatory diseases: friend or foe? Front Immunol. 2024;15:1405215. doi:10.3389/fimmu.2024.1405215
4. Dwivedi M, Laddha NC, Arora P, Marfatia YS, Begum R. Decreased regulatory T-cells and CD4(+) /CD8(+) ratio correlate with disease onset and progression in patients with generalized vitiligo. Pigm Cell Melanoma Res. 2013;26(4):586–591. doi:10.1111/pcmr.12105
5. Berrevoet D, Van Nieuwerburgh F, Deforce D, Speeckaert R. Proteomics data in vitiligo: a scoping review. Front Immunol. 2024;15:1387011. doi:10.3389/fimmu.2024.1387011
6. Mansuri MS, Singh M, Begum R. miRNA signatures and transcriptional regulation of their target genes in vitiligo. J Dermatol Sci. 2016;84(1):50–58. doi:10.1016/j.jdermsci.2016.07.003
7. Mansuri MS, Singh M, Laddha NC, Dwivedi M, Marfatia YS, Begum R. Skin miRNA profiling reveals differentially expressed miRNA signatures from non-segmental vitiligo patients. Mol Cytogenet. 2014;7(Suppl 1):P118. eCollection 2014.; 2014. doi:10.1186/1755-8166-7-S1-P118
8. Frohlich K, Fahrner M, Brombacher E, et al. Data-independent acquisition: a milestone and prospect in clinical mass spectrometry-based proteomics. Mol Cell Proteomics. 2024;23(8):100800. doi:10.1016/j.mcpro.2024.100800
9. Qian YT, Liu XY, Sun HD, et al. Urinary proteomics analysis of active vitiligo patients: biomarkers for steroid treatment efficacy prediction and monitoring. Front Mol Biosci. 2022;9:761562. doi:10.3389/fmolb.2022.761562
10. Wilcock DJ, Badrock AP, Wong CW, et al. Oxidative stress from DGAT1 oncoprotein inhibition in melanoma suppresses tumor growth when ROS defenses are also breached. Cell Rep. 2022;39(12):110995. doi:10.1016/j.celrep.2022.110995
11. Liu K, Zhou L, Shi M, et al. JAK inhibitors in immune regulation and treatment of vitiligo. Cytokine Growth Factor Rev. 2024;80:87–96. doi:10.1016/j.cytogfr.2024.11.002
12. Jin Y, Liu X, Liang X, et al. Resveratrol rescues cutaneous radiation-induced DNA damage via a novel AMPK/SIRT7/HMGB1 regulatory axis. Cell Death Dis. 2023;13(10):847. doi:10.1038/s41419-022-05281-y
13. Chen S, Zhou Y, Wu J, et al. Interleukin 8 exacerbates age-related hearing loss through regulating perivascular-resident macrophage-like melanocytes viability and the permeability of the endothelial cells. Int Immunopharmacol. 2025;146:113820. doi:10.1016/j.intimp.2024.113820
14. Liu W, Zhang X, Chen X. Unraveling the causal associations between systemic cytokines and six inflammatory skin diseases. Cytokine. 2025;185:156810. doi:10.1016/j.cyto.2024.156810
15. Calabrese L, Fiocco Z, Mellett M, et al. Role of the NLRP1 inflammasome in skin cancer and inflammatory skin diseases. Br J Dermatol. 2024;190(3):305–315. doi:10.1093/bjd/ljad421
16. Wilamowska-Kokoszko D, Lukasik K, Szepietowski JC, et al. Assessment of stem cell factor expression and its c-KIT receptor in patients with vitiligo. Postepy Dermatol Alergol. 2022;39(4):762–767. doi:10.5114/ada.2021.110266
17. Khaitan BK, Sindhuja T. Autoimmunity in vitiligo: therapeutic implications and opportunities. Autoimmun Rev. 2022;21(1):102932. doi:10.1016/j.autrev.2021.102932
18. Lu J, Song L, Luan J, et al. Identification of shared biomarkers and immune infiltration signatures between vitiligo and hashimoto’s thyroiditis. Clin Cosmet Invest Dermatol. 2024;17:311–327. doi:10.2147/CCID.S451080
19. Huang H, Chen K, Zhu Y, et al. A multi-dimensional approach to unravel the intricacies of lactylation related signature for prognostic and therapeutic insight in colorectal cancer. J Transl Med. 2024;22(1):211. doi:10.1186/s12967-024-04955-9
20. Blotas C, Ferec C, Moisan S. Tissue-specific regulation of CFTR gene expression. Int J Mol Sci. 2023;24(13):10678. doi:10.3390/ijms241310678
21. Brito Querido J, Diaz-Lopez I, Ramakrishnan V. The molecular basis of translation initiation and its regulation in eukaryotes. Nat Rev Mol Cell Biol. 2024;25(3):168–186. doi:10.1038/s41580-023-00624-9
22. Cambier S, Gouwy M, Proost P. The chemokines CXCL8 and CXCL12: molecular and functional properties, role in disease and efforts towards pharmacological intervention. Cell Mol Immunol. 2023;20(3):217–251. doi:10.1038/s41423-023-00974-6
23. Cesaro B, Tarullo M, Fatica A. Regulation of gene expression by m6Am RNA modification. Int J Mol Sci. 2023;24(3):2277. doi:10.3390/ijms24032277
24. Feghahati FS, Ghafouri-Fard S. A comprehensive outline of the role of non-coding RNAs in vitiligo. Biochem Biophys Rep. 2025;41:101916. doi:10.1016/j.bbrep.2025.101916
25. Yang M, Su Y, Zheng H, et al. Identification of the potential regulatory interactions in rheumatoid arthritis through a comprehensive analysis of lncRNA-related ceRNA networks. BMC Musculoskelet Disord. 2023;24(1):799. doi:10.1186/s12891-023-06936-3
26. Hu H, Liu Y, Qiu C, Zhang L, Cui H, Gu J. LINC00894 inhibited neuron cellular apoptosis and regulated activating transcription factor 3 expression. Gene. 2024;927:148670. doi:10.1016/j.gene.2024.148670
27. Zhu H, Tan J, Pan X, et al. HELLPAR/RRM2 axis related to HMMR as novel prognostic biomarker in gliomas. BMC Cancer. 2023;23(1):125. doi:10.1186/s12885-023-10596-w
28. Wang ZZ, Yao GT, Wang LZ, Zhu YJ, Chen JH. Increased expression and prognostic significance of BYSL in melanoma. J Immunother. 2024;47(8):279–302. doi:10.1097/CJI.0000000000000530
29. Szydelko J, Czop M, Petniak A, et al. Identification of plasma miR-4505, miR-4743-5p and miR-4750-3p as novel diagnostic biomarkers for coronary artery disease in patients with type 2 diabetes mellitus: a case-control study. Cardiovasc Diabetol. 2024;23(1):278. doi:10.1186/s12933-024-02374-0
30. Ganapathy K, Ngo C, Andl T, Coppola D, Park J, Chakrabarti R. Anticancer function of microRNA-30e is mediated by negative regulation of HELLPAR, a noncoding macroRNA, and genes involved in ubiquitination and cell cycle progression in prostate cancer. Mol Oncol. 2022;16(16):2936–2958. doi:10.1002/1878-0261.13255
31. Blazev R, Carl CS, Ng YK, et al. Phosphoproteomics of three exercise modalities identifies canonical signaling and C18ORF25 as an AMPK substrate regulating skeletal muscle function. Cell Metab. 2022;34(10):1561–1577e1569. doi:10.1016/j.cmet.2022.07.003
32. Xie W, Han Z, Zuo Z, et al. ASAP1 activates the IQGAP1/CDC42 pathway to promote tumor progression and chemotherapy resistance in gastric cancer. Cell Death Dis. 2023;14(2):124. doi:10.1038/s41419-023-05648-9
33. Touni AA, Shivde RS, Echuri H, et al. Melanocyte-keratinocyte cross-talk in vitiligo. Front Med Lausanne. 2023;10:1176781. doi:10.3389/fmed.2023.1176781
34. Long F, Wei X, Chen Y, et al. Gasdermin E promotes translocation of p65 and c-jun into nucleus in keratinocytes for progression of psoriatic skin inflammation. Cell Death Dis. 2024;15(3):180. doi:10.1038/s41419-024-06545-5
 © 2026 The Author(s). This work is published and licensed by Dove Medical Press Limited. The
full terms of this license are available at https://www.dovepress.com/terms
and incorporate the Creative Commons Attribution
- Non Commercial (unported, 4.0) License.
By accessing the work you hereby accept the Terms. Non-commercial uses of the work are permitted
without any further permission from Dove Medical Press Limited, provided the work is properly
attributed. For permission for commercial use of this work, please see paragraphs 4.2 and 5 of our Terms.
© 2026 The Author(s). This work is published and licensed by Dove Medical Press Limited. The
full terms of this license are available at https://www.dovepress.com/terms
and incorporate the Creative Commons Attribution
- Non Commercial (unported, 4.0) License.
By accessing the work you hereby accept the Terms. Non-commercial uses of the work are permitted
without any further permission from Dove Medical Press Limited, provided the work is properly
attributed. For permission for commercial use of this work, please see paragraphs 4.2 and 5 of our Terms.