")
Back to Journals » Infection and Drug Resistance » Volume 16
Untargeted Metabolomics of Feces Reveals Diagnostic and Prognostic Biomarkers for Active Tuberculosis and Latent Tuberculosis Infection: Potential Application for Precise and Non-Invasive Identification
Authors Luo D, Yang BY, Qin K , Shi CY, Wei NS, Li H, Qin YX, Liu G, Qin XL, Chen SY, Guo XJ, Gan L, Xu RL, Dong BQ, Li J
Received 15 June 2023
Accepted for publication 31 August 2023
Published 12 September 2023 Volume 2023:16 Pages 6121—6138
DOI https://doi.org/10.2147/IDR.S422363
Checked for plagiarism Yes
Review by Single anonymous peer review
Peer reviewer comments 2
Editor who approved publication: Professor Suresh Antony
Dan Luo,1,2,* Bo-Yi Yang,3,* Kai Qin,4 Chong-Yu Shi,3 Nian-Sa Wei,4 Hai Li,1 Yi-Xiang Qin,1 Gang Liu,1 Xiao-Ling Qin,1 Shi-Yi Chen,1 Xiao-Jing Guo,1 Li Gan,1 Ruo-Lan Xu,1 Bai-Qing Dong,1 Jing Li5
1Department of Biostatistics, School of Public Health and Management of Guangxi University of Chinese Medicine, Nanning, Guangxi, People’s Republic of China; 2Guangxi Key Laboratory of Translational Medicine for Treating High-Incidence Infectious Diseases with Integrative Medicine, Guangxi University of Chinese Medicine, Nanning, Guangxi, People’s Republic of China; 3The First Affiliated Hospital, Guangxi Medical University, Nanning, Guangxi, People’s Republic of China; 4The Second Affiliated Hospital, Guangxi Medical University, Nanning, Guangxi, People’s Republic of China; 5Deparment of Physiology, School of Basic Medical Sciences of Guangxi Medical University, Nanning, Guangxi, People’s Republic of China
*These authors contributed equally to this work
Correspondence: Bai-Qing Dong, Guangxi University of Chinese Medicine, 13 Wuhe Road, Nanning, Guangxi, 530200, People’s Republic of China, Tel/Fax +86-771-4928360, Email [email protected] Jing Li, Guangxi Medical University, 22 Shuangyong Road, Nanning, Guangxi, 530021, People’s Republic of China, Tel/Fax +86-771-5358212, Email [email protected]
Purpose: Distinguishing latent tuberculosis infection (LTBI) from active tuberculosis (ATB) is important to control the prevalence of tuberculosis; however, there is currently no effective method. The aim of this study was to discover specific metabolites through fecal untargeted metabolomics to discriminate ATB, individuals with LTBI, and healthy controls (HC) and to probe the metabolic perturbation associated with the progression of tuberculosis.
Patients and Methods: Liquid chromatography-tandem mass spectrometry (LC-MS/MS) was performed to comprehensively detect compounds in fecal samples from HC, LTBI, and ATB patients. Differential metabolites between the two groups were screened, and their underlying biological functions were explored. Candidate metabolites were selected and enrolled in LASSO regression analysis to construct diagnostic signatures for discriminating between HC, LTBI, and ATB. A receiver operating characteristic (ROC) curve was applied to evaluate diagnostic value. A nomogram was constructed to predict the risk of progression of LTBI.
Results: A total of 35 metabolites were found to exist differentially in HC, LTBI, and ATB, and eight biomarkers were selected. Three diagnostic signatures based on the eight biomarkers were constructed to distinguish between HC, LTBI, and ATB, demonstrating excellent discrimination performance in ROC analysis. A nomogram was successfully constructed to evaluate the risk of progression of LTBI to ATB. Moreover, 3,4-dimethylbenzoic acid has been shown to distinguish ATB patients with different responses to etiological tests.
Conclusion: This study constructed diagnostic signatures based on fecal metabolic biomarkers that effectively discriminated HC, LTBI, and ATB, and established a predictive model to evaluate the risk of progression of LTBI to ATB. The results provide scientific evidence for establishing an accurate, sensitive, and noninvasive differential diagnosis scheme for tuberculosis.
Keywords: feces, latent tuberculosis infection, active tuberculosis, biomarkers, progression, metabolomics
Introduction
Tuberculosis (TB), an infectious disease caused by Mycobacterium tuberculosis (M.tb), is still a worldwide plague.1 Although the incidence of TB is decreasing worldwide, its mortality rate remains high,2 partly due to the lack of simple and effective diagnostic methods resulting in misdiagnosis and missed diagnosis. According to the “Classification of Tuberculosis” (WS 196-2017) standard issued by the National Health Commission of the People’s Republic of China,3 TB can be categorized into latent tuberculosis infection (LTBI), active tuberculosis (ATB), and non-active tuberculosis. Accurately diagnosing LTBI and providing early prophylactic treatment are important measures for controlling the spread of TB. However, the prognosis of LTBI is highly unstable, posing significant challenges to the control of the TB epidemic.4 It has been reported that approximately 5–15% of LTBI will progress to ATB if no preventive measures are taken.5 The major immunological methods currently employed to diagnose LTBI are the tuberculin skin test (TST) and the interferon-release assay (IGRA),6 however their specificity and sensitivity are insufficient.7 In addition, LTBI usually does not have any clinical symptoms or characteristic chest imaging changes,8 making it difficult to differentiate from healthy controls (HC) and further increasing the difficulty of diagnosing LTBI. Early identification and treatment are of great significance for improving the prognosis of ATB. Although there are many methods available for diagnosing ATB, including immunological detection,6 genomic detection,9 and molecular marker detection,10 these methods are not accurate enough and cannot effectively differentiate between LTBI and ATB.1 Therefore, there is an urgent need for effective biomarkers to differentiate HC, LTBI, and ATB in order to achieve early diagnosis and treatment of various types of TB.
Metabolomics is a science that aims to explore how organisms change their metabolism under external stimuli by obtaining fingerprints of all metabolites in tested samples, and has emerged as an effective tool for identifying biomarkers of various diseases.11 Certain metabolites found in biological specimens such as serum, urine, and pleural effusion have been discovered in recent years and may be possible indicators of TB infection, treatment efficacy, and prognosis.12–16 However, the current amount of research is still limited, and few studies have focused on fecal metabolites to elucidate the pathological alterations and discover new diagnostic markers of TB. In addition, certain intestinal metabolites (such as short-chain fatty acids) have been found to regulate lung immunity and are involved in several respiratory diseases, including chronic obstructive pulmonary disease and asthma.17 However, little is known concerning the involvement of intestinal metabolites in the pathogenesis or progression of tuberculosis. Based on previous studies, we hypothesized that specific changes in fecal metabolites may provide novel pathological insights into TB development, and that some metabolites may be applied as biomarkers for distinguishing HC, LTBI, and ATB.
In this study, liquid chromatography-tandem mass spectrometry (LC-MS/MS) was applied to screen fecal metabolites in HC, LTBI, and ATB. Multivariate analyses were used to identify biomarkers that could discriminate between the three groups. We further analyzed the effectiveness of biomarkers in discriminating between ATB patients with different responses to etiological tests. Finally, we developed a model to predict the risk of progression of LTBI. These findings provide a theoretical basis for establishing an accurate, sensitive, and non-invasive differential diagnosis scheme for TB.
Materials and Methods
Study Cohort
Between January 2022 and June 2022, 30 fecal samples from HC (age 49.1 [range 23–70] years; males, n = 15 [42.9%]), 30 samples from individuals with LTBI (age 45.7 [range 18–68] years; males, n = 13 [36.1%]), and 33 samples from patients newly diagnosed with ATB (age 48.3 [range 18–72] years; males, n = 13 [39.4%]) were collected in Pingnan People’s Hospital, Guigang, Guangxi Zhuang Autonomous Region. The samples were collected in the next morning after definite diagnosis and before taking the medication. Samples enrolled in this study met the following criteria: (1) the patients with ATB were all incident cases and had no previous history of TB; (2) the enrolled individuals with LTBI must have tested positive in both the IGRA and TST tests to exclude BCG-induced positive TST response; (3) treatment or preventive therapy was administered after fecal samples were collected; (4) fresh fecal samples (100 mg) from the three groups were retrieved in the morning to minimize the impact of confounding factors, then frozen instantly in liquid nitrogen and stored at −80 °C.
The diagnostic criteria of patients involved in this study were formulated according to the Technical Guidelines for Tuberculosis Prevention and Control in China issued by the Chinese Center for Disease Control and Prevention (CDC) in 2021.18 Of the ATB patients enrolled in this study, only 19 tested positive for etiology, whereas the remaining 14 tested negative for etiology. Among ATB patients, 19 patients with a positive etiology met at least one of the following three inclusion criteria: (1) M. tuberculosis was identified by sputum microscopy, (2) M. tuberculosis could be identified after sputum culture, and (3) the results of PCR for M. tuberculosis were positive. The 14 patients who tested negative for etiology met none of the above three criteria but had typical symptoms and characteristic changes of TB on chest imaging. After fecal samples were collected, anti-TB treatment was administered immediately, and the therapeutic strategy was effective. The enrolled patients with LTBI met the following criteria: (1) no previous history of TB, (2) no clinical symptoms and signs related to ATB, (3) no abnormality on chest imaging examination, (4) negative pathogenic examination of sputum samples, and (5) positive IGRA and TST tests. There was no difference in the three groups’ baseline characteristics. (p > 0.05). Table 1 shows the general diagnostic criteria for the individuals enrolled in this study.
 |
Table 1 Clinical Characteristics of the Enrolled Individuals |
All individuals enrolled in this study signed informed consent forms, and the study protocol was approved by the Ethics Committee on Human Research of Guangxi University of Chinese Medicine.
Metabolites Extraction
Individual fecal samples (100 mg) were crushed with liquid nitrogen, and the homogenate was vortexed in prechilled 80% methanol. The samples were placed on ice for 5 minutes before being centrifuged at 15,000 g for 20 minutes at 4 °C. LC-MS/MS grade water was used to dilute some of the supernatant to a final concentration of 53% methanol. The samples were then transferred to new Eppendorf tubes and centrifuged at 15,000 g for 20 minutes at 4 °C. The supernatant was then fed into the LC-MS/MS apparatus for analysis.19 To evaluate the stability of LC-MS/MS analysis, quality control (QC) samples were created by pooling equal quantities of each sample.
LC-MS/MS Analysis
To detect as many metabolites as possible, LC-MS/MS analysis was performed in both positive and negative ion mode. LC-MS/MS analyses were carried out at Novogene Co. Ltd. (Beijing, China) utilizing a Vanquish UHPLC system (Thermo Fisher, Germany) in conjunction with an Orbitrap Q Exactive TMHF-X mass spectrometer (Thermo Fisher, Germany). Using a 12-min linear gradient at a flow rate of 0.2 mL/min, samples were injected onto a Hypersil Gold column (100 2.1 mm, 1.9 m). Eluents A (0.1% FA in water) and B (methanol) were used for the positive polarity mode. Eluents A (5 mM ammonium acetate, pH 9.0) and B (methanol) were used for the negative polarity mode. The solvent gradient was set to be as follows: 2% B for 1.5 minutes; 2–85% B for 3 minutes; 85–100% B for 10 minutes; 100–2% B for 10.1 minutes; 2% B for 12 minutes. The spray voltage of 3.5 kV, capillary temperature of 320 °C, sheath gas flow rate of 35 psi, auxiliary gas flow rate of 10 L/min, S-lens RF level of 60, and auxiliary gas heater temperature of 350 °C were used to run the Q ExactiveTM HF-X mass spectrometer in both positive and negative polarity modes.
The experimental and QC samples were delivered to the apparatus in a specified order. The first three QC samples delivered at the beginning of LC-MS/MS analysis were used to monitor the working status of the experimental apparatus and balance the LC-MS/MS system. Three additional QC samples were subsequently scanned, and their secondary spectrograms were employed for qualitative analysis of metabolites along with the experimental samples. After the experimental samples were delivered to the apparatus, a QC sample was interspersed every 10 samples to assess the stability during the entire LC-MS/MS analysis.
Data Processing and Metabolite Identification
The raw data files from the LC-MS/MS were processed using a Thermo Fisher Compound Discoverer 3.1 (CD3.1) to perform peak alignment, peak selection, and quantification of each metabolite. The following were the primary parameters: retention time tolerance =0.2 minutes; real mass tolerance =5 ppm; signal intensity tolerance =30%; signal/noise ratio =3; and minimum intensity =100,000. Peak intensity was normalized to total spectral intensity. The molecular formulas were predicted using normalized data based on additive ions, molecular ion peaks, and fragment ions. To acquire precise qualitative and quantitative results, the peaks were matched using the mzCloud (https://www.mzcloud.org/), mzVault, and MassList databases. Statistical studies were carried out using the statistical tools R (version R-3.4.3), Python (version 2.7.6), and CentOS (CentOS release 6.6). When the data were not normally distributed, the area-normalization method was used to try normal transformations.
Statistical Analysis
The KEGG database (https://www.genome.jp/kegg/pathway.html), the HMDB database (https://hmdb.ca/metabolites), and the LIPIDMaps database (http://www.lipidmaps.org/) were used to annotate these metabolites. Principal components analysis (PCA) and partial least squares discriminant analysis (PLS-DA) were completed at metaX (a flexible and comprehensive software for processing metabolomics data).20 We applied univariate analysis (t-test) to calculate the statistical significance (P-value). Metabolites with VIP > 1 and p-value< 0.05 and fold change (FC) ≥1.5 or FC ≤0.667 were considered to be differential metabolites. Using the “ggplot2” package of R language (4.2.2), volcano plots were used to visualize the differential metabolites selected between every two groups based on log2(FoldChange) and -log10(p-value) of metabolites, and “pheatmap” package of R language (4.2.2) was applied to exhibit the intersected differential metabolites and candidate biomarkers.
The correlation between various metabolites was investigated using cor () in R (method = Pearson). The cor.mtest() function in R (4.2.2) was used to calculate statistically significant correlations between various metabolites. The statistical significance level was set at p<0.05, and correlation graphs were created in R using the corrplot tool. The KEGG database was used to investigate the roles of these metabolites and metabolic pathways. Metabolic pathway enrichment of differential metabolites was done, and the metabolic route was termed enriched when the ratio x/n > y/N was satisfied. The metabolic pathways were regarded substantially enriched when the p-value was less than 0.05. The “glmnet” package of R language (4.2.2) was used to compute the least absolute shrinkage and selection operator (LASSO) regression analysis and 10-fold cross validation was set. The value of the penalty parameter (λ) was calculated based on the lowest partial likelihood deviation, and a combined signature was constructed. Nomogram was plotted by the “rms” package of R language (4.2.2).
Results
Data Quality Control
PCA was performed on all samples, including QC samples, in both positive and negative ion modes (ESI+ and ESI-). The stability of the detection process and the quality of the data were ensured since the dots in Figure 1A and B, which represent the QC samples, were aggregated and showed tiny variations between QC samples. Additionally, in both modes, all Pearson correlation values across QC samples were higher than 0.9, demonstrating excellent stability during the detection process (Figure 1C and D).
 |
Figure 1 Data quality control. PCA analysis of all samples in (A) ESI− and (B) ESI+. The purple dots grouped together represent QC samples; The heatmaps of correlation analysis of QC samples in (C) ESI− and (D) ESI+. Abbreviations: QC, quality control; ESI−, negative ion mode; ESI+, positive ion mode; PCA, principal component analysis. |
Comparative Analysis of Metabolic Profiles of ATB Group, LTBI Group and HC Group
The metabolic differences between the ATB, LTBI, and HC groups in both ESI+ and ESI were investigated using PCA and PLS-DA. The three groups in the PCA models could not be separated from one another (Figure 2). The PLS−DA models demonstrated that the three groups were clearly separated, particularly the ATB and HC groups. Permutation tests of the PLS−DA models were conducted, illustrating the high predictive efficacy and lack of overfitting of these models (Figure 3).
 |
Figure 2 PCA scores scatter plots of the three groups. The horizontal axis PC1 and vertical axis PC2 represent the scores of the first and second ranked principal components, respectively. Scatters of different colors represent samples from different experimental groups, and ellipses represent 95% confidence intervals. (A) LTBI vs HC in ESI−; (B) LTBI vs HC in ESI+; (C) ATB vs LTBI in ESI−; (D) ATB vs LTBI in ESI+; (E) ATB vs HC in ESI−; (F) ATB vs HC in ESI+. Abbreviations: PCA, principal component analysis; PC, principal component; HC, healthy controls; LTBI, latent tuberculosis infection; ATB, active tuberculosis; ESI−, negative ion mode; ESI+, positive ion mode. |
 |
Figure 3 PLS−DA score scatter plots and permutation test results of the three groups. In the scatter plots of PLS-DA models, the horizontal axis represents the score of the sample on the first principal component, and the vertical axis represents the score of the sample on the second principal component. In the line graphs of permutation tests, R2Y represents the explanatory power of the model, while Q2Y is used to evaluate the predictive ability of the PLS-DA model. (A) LTBI vs HC in ESI−; (B) LTBI vs HC in ESI+; (C) ATB vs LTBI in ESI−; (D) ATB vs LTBI in ESI+; (E) ATB vs HC in ESI−; (F) ATB vs HC in ESI+. Abbreviations: PLS−DA, partial least squares discriminant analysis; HC, healthy controls; LTBI, latent tuberculosis infection; ATB, active tuberculosis; ESI−, negative ion mode; ESI+, positive ion mode. |
Screening Out of Differential Metabolites Between Different Groups
Based on PLS-DA models, differential metabolites between several groups were retrieved. Differential metabolites were discovered between the two groups in both ion modes following filtering utilizing the difference criteria of p < 0.05, FC >1.5, or FC <0.667 and VIP >1.0. These metabolites were then further displayed using volcano plots. A total of 223 metabolites with different abundances were acquired between the LTBI and HC groups, including 46 up-regulated and 177 down-regulated metabolites in the LTBI group (Figure 4A, Supplementary Table S1). In the comparison of the ATB and LTBI groups, 438 metabolites were differentially expressed, and there were 127 up-regulated and 311 down-regulated metabolites in the ATB group relative to the LTBI group (Figure 4B, Supplementary Table S2). There were 555 differential metabolites between the ATB and HC groups, of which 125 were up-regulated and 430 were down-regulated in the ATB group (Figure 4C, Supplementary Table S3).
 |
Figure 4 Screening and functional analysis of differential metabolites. The horizontal axis represents the multiple variation of differences in metabolites among different groups (log2FC), the vertical axis represents the level of significance of differences (- log10 (P-value)). Each point in the volcanic map represents a metabolite. (A) LTBI group vs HC group. Metabolites up-regulated in LTBI group were labeled red; (B) ATB group vs LTBI group. Metabolites up-regulated in ATB group were labeled red; (C) ATB group vs HC group. Metabolites up-regulated in ATB group were labeled red. (D) Enriched metabolic pathways between LTBI and HC; (E) Enriched metabolic pathways between ATB and LTBI; (F) Enriched metabolic pathways between ATB and HC. Abbreviations: HC, healthy controls; LTBI, latent tuberculosis infection; ATB, active tuberculosis. |
Functional Enrichment Analysis of Differential Metabolites
In order to look into the biological and pathological alterations connected with the progression, differential metabolites that were filtered out in both ESI- and ESI+ were employed in the KEGG enrichment analysis. The results showed that purine metabolism was highlighted in all three comparison groups (LTBI vs HC, ATB vs LTBI, and ATB vs HC) and was the most frequently enriched metabolic pathway (Figure 4D–F, and Table 2). Pyrimidine metabolism was the most significant pathway in the two comparison groups (LTBI vs HC, and ATB vs HC). The results showed that purine and pyrimidine metabolism in the gut may be associated with the pathogenesis (Figure 4D–F, and Table 2).
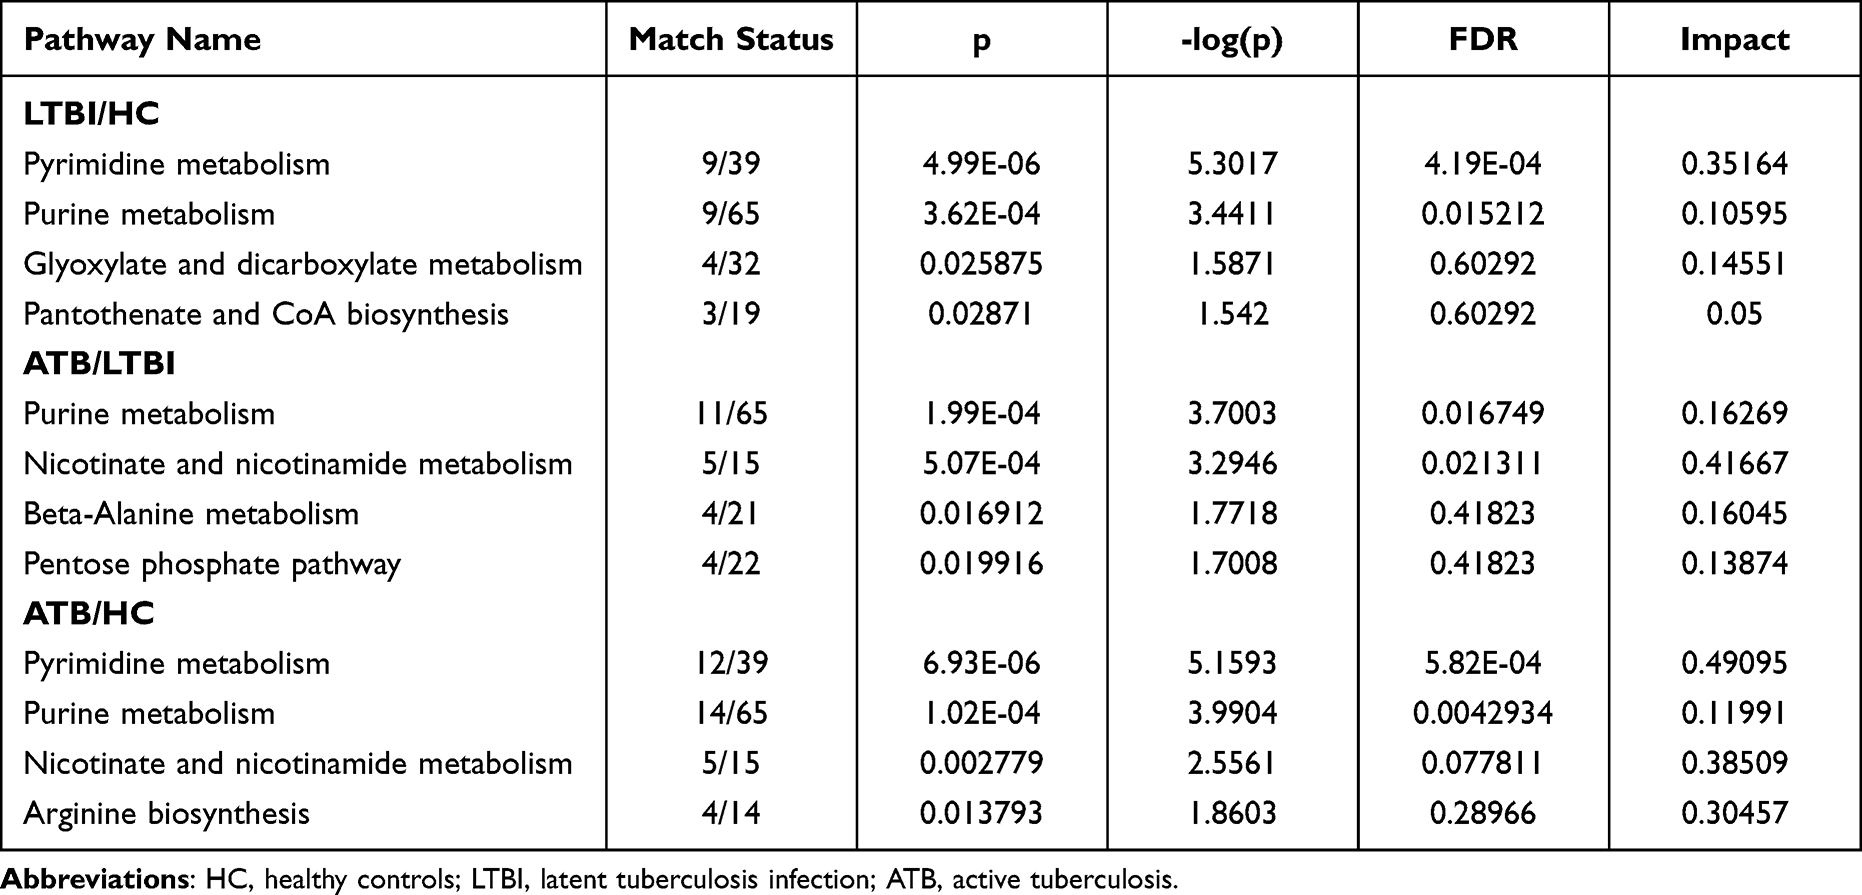 |
Table 2 Enriched Metabolic Pathways Between Every Two Groups |
Screening of the Intersected Differential Metabolites
By intersecting the metabolite lists of the three comparison groups (LTBI vs HC, ATB vs LTBI, and ATB vs HC), 35 overlapping differential metabolites (26 in ESI- and 9 in ESI+) were obtained (Figure 5A–C). Supplementary Table S4 presents these metabolites and comprehensively ranks them in order of fold-change values, VIP scores, and p-values.
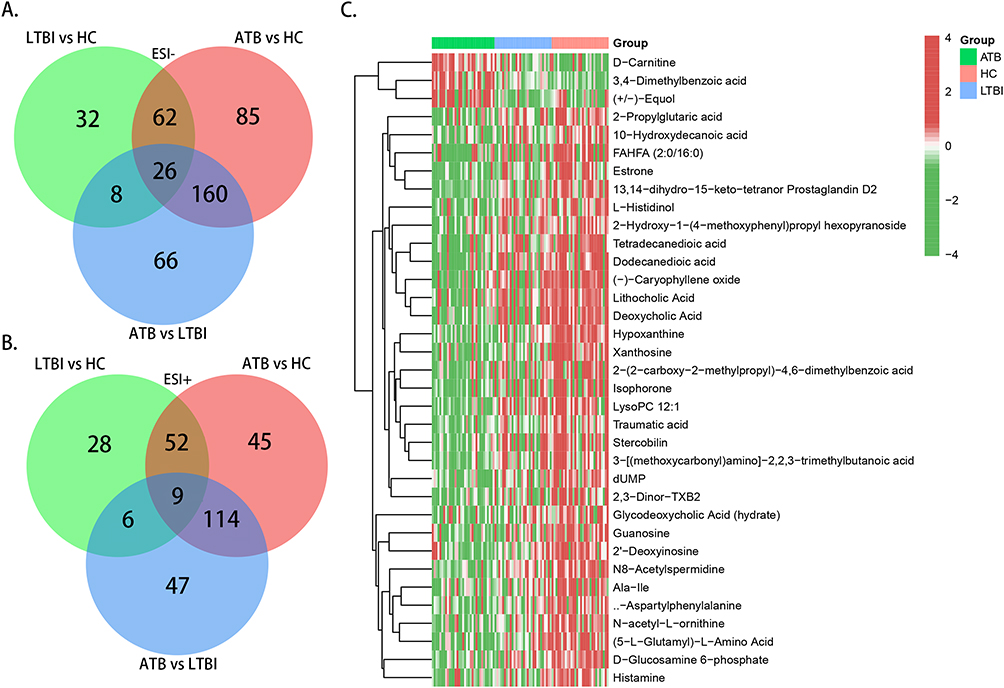 |
Figure 5 Selection of intersected differential metabolites. (A) Venn graph of differential metabolites in ESI− mode; (B) Venn graph of differential metabolites in ESI+ mode; (C) Heatmap of the 35 intersected differential metabolites. Abbreviations: ESI−, negative ion mode; ESI+, positive ion mode. |
Selection and Evaluation of Certain Metabolites as Potential Biomarkers
The top eight metabolites in Supplementary Table S4 were selected and viewed as candidate biomarkers for discriminating HC, LTBI, and ATB, including hypoxanthine, 13,14-dihydro-15-keto-tetranor prostaglandin D2, deoxycholic acid, N8-acetylspermidine, xanthosine, lysoPC 12:1, (5-L-glutamyl)-L-amino acid, and 3,4-dimethylbenzoic acid. A scatter plot (Figure 6A) and heatmap (Figure 6B) demonstrate the content differences of these eight metabolites between the HC, LTBI, and ATB groups. In comparison to the HC group, the content of 3,4-dimethylbenzoic acid in the LTBI and ATB groups was decreased, whereas the rest seven metabolites were increased (Figure 6A). When compared with the LTBI group, all metabolites except 3,4-dimethylbenzoic acid were up-regulated, while 3,4-dimethylbenzoic acid was down-regulated in the ATB group (Figure 6A).
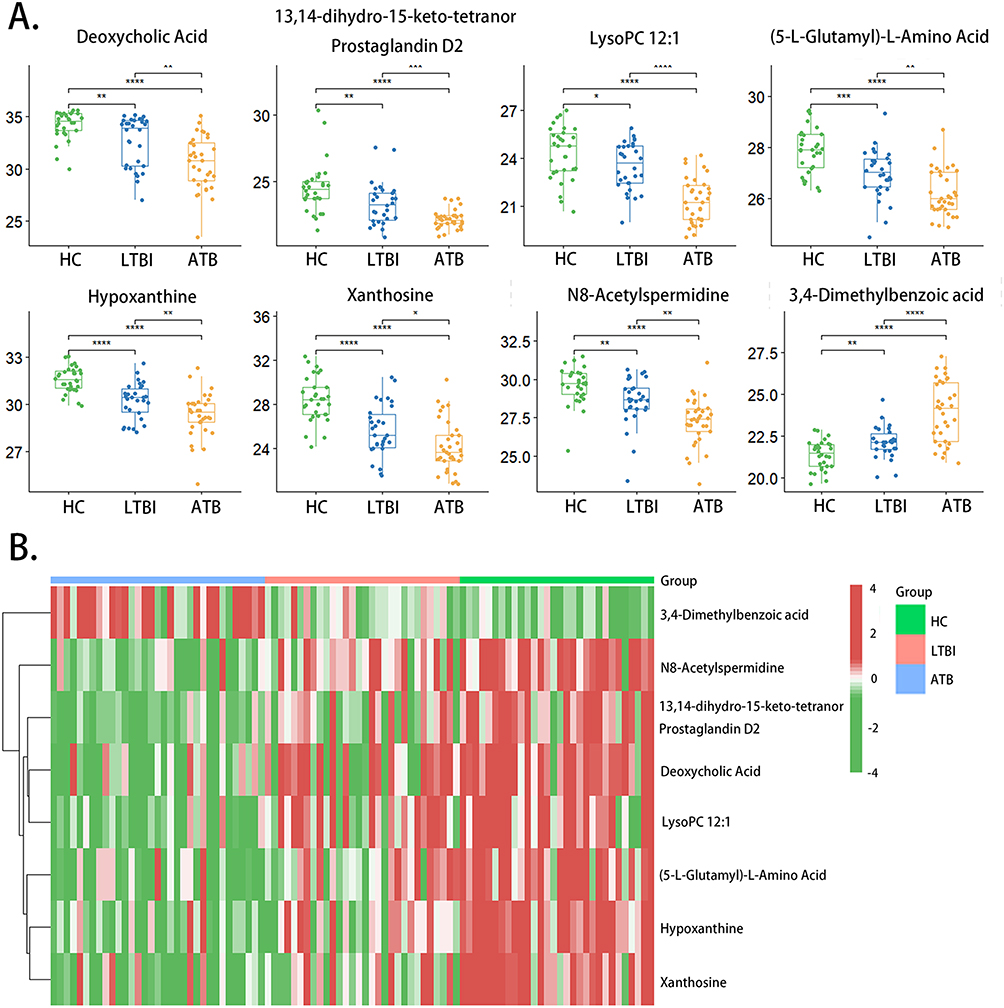 |
Figure 6 Scatter plot and heatmap of 8 candidate biomarkers among HC, LTBI and ATB group. (A) Scatter plot; (B) heatmap (*p-value < 0.05; ** p-value < 0.01; *** p-value < 0.001; **** p-value < 0.0001; ns: p-value > 0.05). Abbreviations: HC, healthy controls; LTBI, latent tuberculosis infection; ATB, active tuberculosis. |
To assess the diagnostic value of these eight candidate biomarkers, a classical univariate receiver operating characteristic curve (ROC) analysis was performed. When distinguishing between the LTBI and HC groups, only hypoxanthine (AUC = 0.83), xanthosine (AUC = 0.821), and (5-L-glutamyl)-L-amino acid (AUC = 0.75) showed great efficacy in differential diagnosis (Table 3). When discriminating between the ATB and LTBI groups, only lysoPC 12:1 (AUC = 0.847), N8-acetylspermidine (AUC = 0.784), and 3,4-dimethylbenzoic acid (AUC = 0.773) showed excellent diagnostic performance (Table 3). When discriminating between the ATB and HC groups, the AUC values for hypoxanthine, 13,14-dihydro-15-keto-tetranor prostaglandin D2, deoxycholic acid, N8-acetylspermidine, xanthosine, lysoPC 12:1, (5-L-glutamyl)-L-amino acid, and 3,4-dimethylbenzoic acid were 0.930, 0.920, 0.912, 0.909, 0.909, 0904, 0.893, and 0.889, respectively, all of which exhibited high diagnostic performance (Table 3).
 |
Table 3 The AUC and 95% CI of the 8 Candidate Biomarkers |
To further improve the diagnostic efficacy of the candidate biomarkers, LASSO regression was performed for each distinction to select optimal biomarkers. Using 10-fold cross validation, the value of the penalty parameter (λ) was calculated based on the lowest partial likelihood deviation, and a combined signature was constructed. When comparing LTBI and HC, five metabolites were identified to improve discrimination: 13,14-dihydro-15-keto-tetranor prostaglandin D2, hypoxanthine, xanthosine, N8-acetylspermidine and 3,4-dimethylbenzoic acid. When comparing ATB and LTBI, two metabolites were tightly associated with the distinction, LysoPC 12:1 and 3,4-dimethylbenzoic acid. Comparing ATB and HC, six metabolites were identified: deoxycholic acid, 13,14-dihydro-15-keto-tetranor prostaglandin D2, hypoxanthine, xanthosine, N8-acetylspermidine and 3,4-dimethylbenzoic acid. The coefficients are presented in Table 4. The diagnostic efficacy of each LASSO regression equation was evaluated using the ROC curve. The results indicated that the AUC values of all equations exceeded 0.9, indicating the excellent performance of the LASSO regression equations (Figure 7A–C).
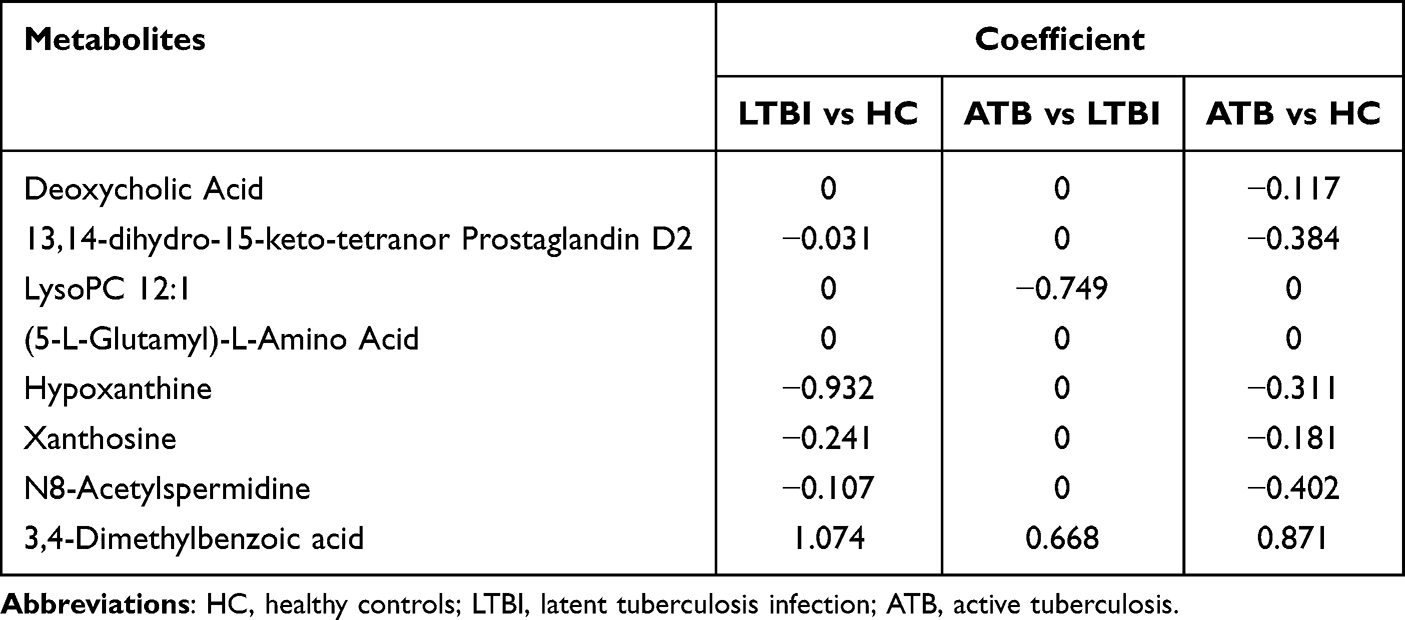 |
Table 4 Coefficients of Candidate Biomarkers in LASSO Regression Analysis |
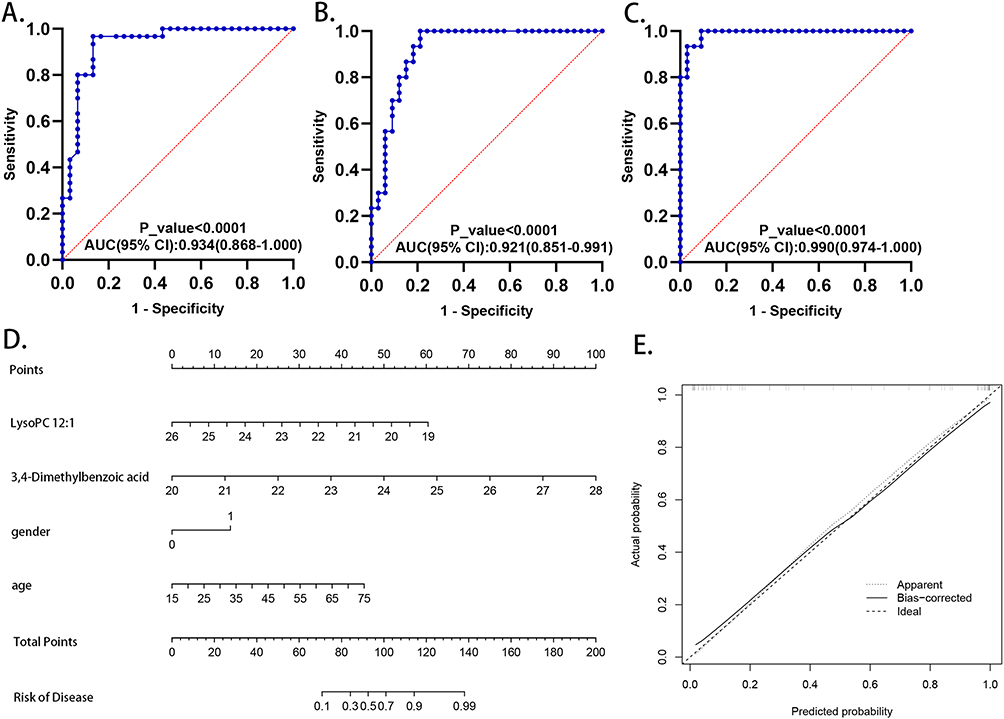 |
Figure 7 The diagnostic and prognostic value of metabolic biomarkers. ROC model of the combined metabolites included in the LASSO regression equation for distinction between (A) HC and LTBI; (B) LTBI and ATB; (C) HC and ATB. (D) Construction of a nomogram for predicting the risk of progressing into ATB from LTBI. (E) Calibration curve of the nomogram. Abbreviations: ROC curve, receiver operating characteristic curve; LASSO, least absolute shrinkage and selection operator; HC, healthy controls; LTBI, latent tuberculosis infection; ATB, active tuberculosis. |
Construction of Nomogram for Predicting the Risk of Progressing into ATB Among Individuals with LTBI
To quantitatively evaluate the risk of progression to ATB in individuals with LTBI, a nomogram was constructed based on the metabolites identified through LASSO regression, lysoPC 12:1 and 3,4-dimethylbenzoic acid, as well as sex (1, male; 0, female) and age. (Figure 7D). A calibration curve was generated by plotting the actual probability of progression (y-axis) against the predicted probability (x-axis), and the results indicated a good correlation between the actual probability and prediction, indicating the successful construction of this nomogram model (Figure 7E).
Correlation Between the Eight Metabolites
Pearson correlation analysis was used to investigate the correlations between the eight metabolites listed above. As shown in Figure 8, deoxycholic acid was positively associated with 13,14-dihydro-15-keto-tetranor prostaglandin D2, lysoPC 12:1, (5-L-glutamyl)-L-amino acid, and xanthosine in the HC group, LTBI group and ATB group (p < 0.05). In addition, hypoxanthine positively correlated with xanthosine in all three groups (p < 0.01). LysoPC 12:1 was positively correlated with hypoxanthine levels in the HC group and LTBI group (p < 0.001), but the correlation was not significant in the ATB group (p > 0.05).
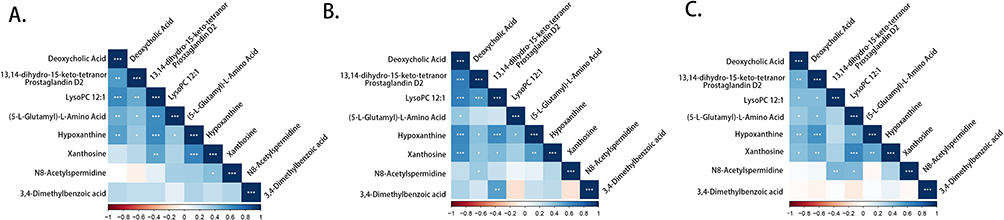 |
Figure 8 Correlation analysis between the eight metabolites. The heatmaps of correlation analysis in (A) HC group, (B) LTBI group and (C) ATB group (*p-value < 0.05; ** p-value < 0.01; *** p-value < 0.001). Abbreviations: HC, healthy controls; LTBI, latent tuberculosis infection; ATB, active tuberculosis. |
The Potential of 3,4-Dimethylbenzoic Acid in Diagnosing ATB Patients Presenting Negative in Etiological Detection
Given the fact that 14 patients from the ATB group tested negative for etiology, we divided the patients of ATB group into two subgroups based on their response to the etiological test and compared the contents of the eight metabolites mentioned above in the two subgroups. Only one metabolite, 3,4-dimethylbenzoic acid, showed a statistically significant difference between “positive” and “negative” groups (p < 0.01) (Figure 9A). In ROC analysis, 3,4-dimethylbenzoic acid demonstrated its capacity in distinguishing between the “positive” group and “negative” group (AUC: 0.759; 95% CI: 0.5886–0.9302) (Figure 9B).
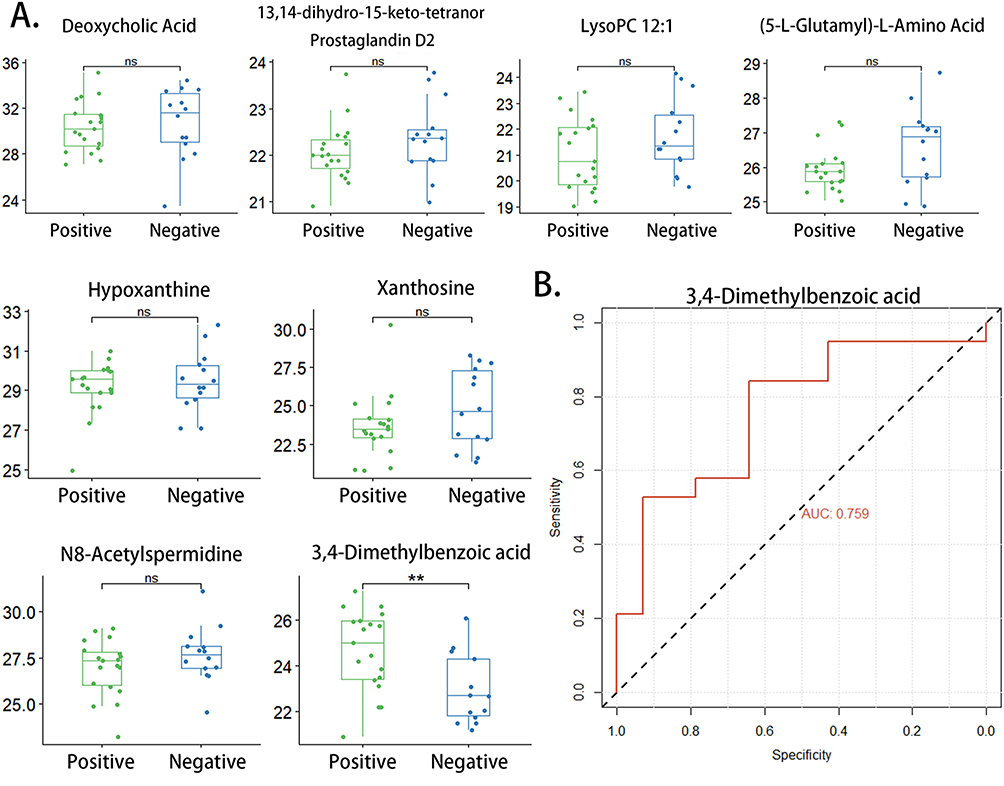 |
Figure 9 Evaluation of the eight candidate biomarkers in discriminating ATB patients with different etiological detection results. (A) Scatter plot depicting relative abundance of eight metabolites in etiologically positive group and etiologically negative group; (B) The ROC curve estimating the efficacy of 3,4-dimethylbenzoic acid in distinguishing etiologically positive group and etiologically negative group (** p-value < 0.01; ns: p-value > 0.05). Abbreviations: ATB, active tuberculosis; ROC curve, receiver operating characteristic curve. |
Discussion
TB has become an infectious issue that disturbs global public health, especially in developing countries.1 This situation partly results from the lack of effective diagnostic methods to discriminate between TB patients in different pathological stages.4 Therefore, it is extremely critical to search for valid biomarkers to distinguish ATB patients, individuals with LTBI, and HC. Based on advanced LC-MS/MS techniques, our study innovatively used feces to characterize intestinal metabolic changes associated with different TB infection statuses and to probe the diagnostic value of certain fecal metabolites.
In this study, hypoxanthine and xanthine levels were lower in the LTBI group than in the HC group, and lower in the TB group than in the LTBI group. At the functional level, purine metabolism was significantly highlighted in all three comparison groups. Ye et al compared the composition of gut microbes between pulmonary TB patients and healthy controls and discovered that Lactobacillus was found in substantial amounts in the feces of pulmonary tuberculosis patients.21 Purines, acting as the precursors for DNA synthesis, are vital to the growth and propagation of Lactobacillus.22 And it was proved that Lactobacillus could inhibit the absorption of purines through intestinal epithelial cells, including hypoxanthine, IMP, and inosine; therefore, this bacterial strain has the ability to enhance the health of hyperuricemia patients.22,23 These findings suggest that the decreased levels of purines in the feces of TB patients may be due to the enrichment of Lactobacillus in the gut, which could explain the results of our study. Besides, purines were found to be absorbed largely by M.tb to synthesize DNA.24 And The key enzyme in purine salvage pathway, hypoxanthine-guanine phosphoribosyltransferase (HGPRT), is indispensable to the survival and propagation of M.tb.25 Additionally, HGPRT inhibitors may be the new anti-TB drugs for its interference with the process of purine utilization in M.tb.25,26 In the study of Huang H et al, it was discovered that the level of xanthine in plasma was lower in TB patients, which further confirmed the above findings.25 Therefore, according to the “gut-lung axis” theory, we assumed that the decrease of intestinal purines, especially hypoxanthine and xanthine, corresponded with the large consumption of purines in M.tb and may be the risk markers indicating the aggravation of TB.
In our study, deoxycholic acid, which is strongly associated with the intestinal flora, was identified as a biomarker for discrimination. Intestinal Lactobacillus was reported to reduce the levels of deoxycholic acid in gut.26 Meanwhile, Clostridiales and Bacteroidales were able to transform cholic acid into deoxycholic acid.27–29 According to previous research focused on the alteration of gut microbes in patients with TB, Lactobacillus was enriched in patients with ATB, while Clostridiales and Bacteroidales were relatively enriched in HC.30–33 This suggests a decrease in deoxycholic acid in the intestines of patients with ATB compared with those of HC, which is in line with our results.
N8-Acetylspermidine, a derivative of spermidine, belongs to the polyamine family. Spermidine is reported to inhibit systemic inflammatory responses extensively in various tissues, including colonic epithelial cells, myocardial cells, and lung tissues.34–36 It is shown that the spermidine levels in bronchoalveolar lavages from asthma patients were decreased compared with those from healthy controls, and the secretion of cytokines derived from NF-κB activation were inhibited by spermidine.37 Moderate accumulation of spermidine was also observed to promote the repair process of bronchial epithelial cells in the mouse model of asthma.36 Interestingly, oral intake of spermidine can significantly reduce airway inflammation.37 These findings suggest a protective effect of spermidine in inflammatory respiratory diseases, and that enteric spermidine may be transported to the lungs and fulfill its function. In the study of Guilhermina M. Carriche, intestinal Th17 and Treg were vital in resisting infection and restraining excessive inflammation, respectively, and intestinal spermidine was found to down-regulate IL-17 secreted from Th17 and induce the differentiation of Treg cells, a process further balanced the homeostasis between Th17 and Treg and prevented detrimental inflammation in the gut.38 This suggests that spermidine is capable of controlling unrestrained inflammation via regulating the equilibrium between Th17 and Treg, two immune cells that are also important in the inflammation course of TB.39 Increased infiltration of Th17 and secretion of IL-17 were reported to be involved in the pathogenesis of TB, based on their role in inducing and maintaining ultra inflammation.39 However, uncontrolled inflammation contributed to the progression of TB, which is characterized by impairment of lung tissue and even pulmonary dysfunction.40–42 More importantly, Treg extracted from ATB patients showed its function in mTOR inhibition, which could prevent the initiation of pro-inflammatory responses.43 What is more, in the study of Marcin Wawrzyniak, it was assumed that intestinal spermidine have indirect impacts on the lungs by influencing the immune infiltration in impaired lung tissues based on their succession of research.37,44,45 Thus, these findings indicate that enteric spermidine may have the potential to halt the progression of TB by coordinating the balance of Th17 and Treg and thus controlling excessive inflammation. In our study, the level of N8-acetylspermidine was significantly down-regulated in the ATB group than that in the LTBI group, further demonstrating its role in alleviating inflammation and impeding TB progression.
(5-L-Glutamyl)-L-amino acids can be degraded to 5-oxoproline and L-amino acids. Plasma 5-oxoproline was reported to decrease in patients with ATB, and the decrease in 5-oxoproline was linked to lung damage caused by TB.46 Our study showed that (5-L-glutamyl)-L-amino acid demonstrated a descending trend from the HC group to the LTBI group and then to the ATB group, indicating that fecal 5-oxoproline may have the same trend. Although it is unknown whether the variation in fecal (5-L-glutamyl)-L-amino acids is concordant with that in serum 5-oxoproline, our results further revealed the importance of (5-L-glutamyl)-L-amino acids and 5-oxoproline in TB pathogenesis. LysoPC 12:1 belongs to the lysophosphatidylcholine (LPC) family. According to previous research, decreased serum lysophosphatidylcholines have been found in patients with TB.46 However, the available literature on the etiology of this finding remains limited. The variation trend of lysoPC 12:1 in our study was the same as that of (5-L-glutamyl)-L-amino acids, which may also give insights into the pathophysiology of TB. 13,14-dihydro-15-keto-tetranor prostaglandin D2 is derived from prostaglandin D2. However, to the best of our knowledge, no research have investigated its function. 15-Deoxy-D-Δ12,14-prostaglandin J2 (15d-PGJ2), reported to have anti-inflammatory effects, was also derived from prostaglandin D2 and has a similar structure to 13,14-dihydro-15-keto-tetranor prostaglandin D2.47 Although these metabolites have not been thoroughly studied, they showed great diagnostic capacity in discriminating between every two groups in the ROC analysis.
Among the eight selected biomarkers, 3,4-dimethylbenzoic acid was the only metabolite that showed an upward trend in the ranking of HC, LTBI, and ATB. Unfortunately, literature on the elucidation of the function of 3,4-dimethylbenzoic acid is limited. In the study conducted by Swiercz et al, 3,4-dimethylbenzoic acid was detected in the urine of Wistar rats after inhalation of pseudocumene and the urinal level of 3,4-dimethylbenzoic acid was significantly positively linked with the exposure concentration of pseudocumene, which indicated that 3,4-dimethylbenzoic acid may be the end product of the toxic agent, pseudocumene.48 It was shown that the injury of intestinal epithelial cells caused by intestinal epithelial cells aggravated when exposed to 3,4-dimethylbenzoic acid.49 Besides, Chen et al revealed that serum 3,4-dimethylbenzoic acid was predicted to become an effective biomarker for the advanced pulmonary fibrosis.50 In our study, 3,4-dimethylbenzoic acid was assumed to be a potential biomarker of ATB. These findings suggest that 3,4-dimethylbenzoic acid may be a health risk factor. In addition, after dividing ATB patients into two subgroups according to their response to etiological tests, the fecal level of 3,4-dimethylbenzoic acid in the group that tested positive for etiology was up-regulated compared to that in the group that tested negative for etiology, and it was expected to be a diagnostic biomarker for distinguishing between ATB patients that tested positive for etiology. However, the mechanism requires further investigation.
Although various studies have analyzed the metabolic changes associated with TB infection in various specimens and identified several biomarkers, our study represents one of the first constructions of diagnostic models based on fecal metabolites that can effectively distinguish HC, LTBI, and ATB.12,14,15,51 The operation of feces collection is simple and non-invasive compared to drawing blood or thoracentesis, thus making our research findings possible to translate into clinical practice. What is more, the AUC value of three diagnostic signatures all exceed 0.9, which means that early and accurate screening of TB may be achieved based on such great discriminative performance. However, the diagnostic models in most similar studies based on other biological samples did not exhibit such performance. In this study, eight fecal metabolites were eventually chosen as biomarkers, and LASSO regression analysis was conducted to select the optimal markers for each distinction. This combination of optimal markers strengthened the distinction between the HC, LTBI, and ATB groups compared to a single biomarker. Notably, the AUC value was 0.990 in discriminating the ATB and HC groups after combining the six optimal biomarkers, exhibiting excellent specificity and sensitivity. Interestingly, Huang et al identified serum xanthine as a novel biomarker for pulmonary TB.24 And in a study conducted by Conde et al, serum hypoxanthine was found to enable the diagnosis of TB.52 Among the eight metabolites in our study, hypoxanthine and xanthine showed great efficacy in discriminating between every two groups, and the value of AUC even exceeded 0.9 in the distinction between the ATB and LTBI groups. Additionally, hypoxanthine and xanthine were positively correlated with xanthosine in the HC, LTBI, and ATB groups (p < 0.01) in the Pearson correlation analysis. Hypoxanthine and xanthine are strongly linked to the pathogenesis and progression of TB, and their value in diagnosing TB in different states requires further exploration and validation. 3,4-dimethylbenzoic acid also showed great diagnostic value in both groups (AUC > 0.7). Importantly, it can discriminate between ATB patients with different responses to etiological tests. 3,4-Dimethylbenzoic acid may have an advantage in identifying patients who test negative for etiology, which is promising for facilitating the accurate diagnosis of TB patients. This exciting result has not yet been reported, and we will further explore its function and diagnostic efficacy.
It should be noted that this study had some limitations. First, the number of patients enrolled was relatively small. Further studies in multiple research units with larger sample sizes are required. Second, although LC-MS/MS enables the identification of as many molecules as possible, metabolites with relative molecular weights less than 100 are difficult to screen. Hence, further exploration can apply other techniques, such as NMR or GS-MS, in a more comprehensive manner. Finally, our study lacked validation of the eight selected biomarkers; therefore, further verification is required.
Conclusion
In summary, this study aimed to gain a better understanding of the pathogenesis and progression of TB from the perspective of fecal metabolic alterations. Eight metabolites with the potential to be novel diagnostic indices for patients with LTBI and ATB were selected, and the optimal diagnostic biomarkers among these eight metabolites were further chosen for better discrimination for every two groups. Two fecal metabolites associated with sex and age were used to evaluate the risk of progression in individuals with LTBI. However, further exploration and validation are required. Our findings provide scientific evidence for establishing an accurate, sensitive, and non-invasive differential diagnosis scheme for tuberculosis.
Abbreviations
TB, tuberculosis; HC, healthy controls; LTBI, latent tuberculosis infection; ATB, active tuberculosis; QC, quality control; ESI−, negative ion mode; ESI+, positive ion mode; PCA, principal component analysis; PLS−DA, partial least squares discriminant analysis; ROC curve, receiver operating characteristic curve; AUC, area under curve; 95% CI, 95% confidence interval; LASSO, least absolute shrinkage and selection operator; mTOR, mammalian target of rapamycin; Th17, T helper cell 17; IL-17, interleukin 17; Treg, regulatory cell.
Data Sharing Statement
The datasets are available from one of the corresponding authors on reasonable request (Jing Li, email: [email protected]; Bai-Qing Dong, email: [email protected]).
Ethics Approval and Consent to Participate
This study has been approved by the Ethics Committee on Human Research of Guangxi University of Chinese Medicine. All individuals enrolled in this study gave written informed consent. The study removed all the relevant personal information of the individuals except age and gender. This research based on human fecal samples have been performed in accordance with the principles stated in the Declaration of Helsinki.
Acknowledgments
We thank the relevant staff from the Guigang Center for Disease Control and Prevention and Pingnan People’s Hospital for their support with case enrollment and sample collection. We also thank Novogene Co. Ltd. for their technical support.
Funding
This study was supported by the Natural Science Foundation of Guangxi (2017GXNSFAA0198330), Guangxi University of Chinese Medicine−Shenzhen Kangtai Biological Products Co.LTD. Guangxi Hepatitis B Prevention and Control Project (QT022019), and National College Students’ innovation and Entrepreneurship Training Program (202310598006).
Disclosure
The authors report no conflicts of interest in this work.
References
1. Dheda K, Barry CE, Maartens G. Tuberculosis. Lancet. 2016;387(10024):1211–1226. doi:10.1016/S0140-6736(15)00151-8
2. World health statistics. 2022: Monitoring Health for the Sdgs, Sustainable Development Goals. Geneva: World Health Organization;2022. Licence: CC BY-NC-SA 3.0 IGO.
3. National Health Commission of the People’s Republic of China WS 196-2017, classification of tuberculosis; 2017.
4. Blumberg HM, Ernst JD. The challenge of latent TB infection. JAMA. 2016;316(9):931–933. doi:10.1001/jama.2016.11021
5. Campbell JR, Winters N, Menzies D. Absolute risk of tuberculosis among untreated populations with a positive tuberculin skin test or interferon-gamma release assay result: systematic review and meta-analysis. BMJ. 2020;368:m549. doi:10.1136/bmj.m549
6. World Health Organization. Latent Tuberculosis Infection: Updated and Consolidated Guidelines for Programmatic Management. World Health Organization; 2018.
7. Pai M, Denkinger CM, Kik SV, et al. Gamma interferon release assays for detection of Mycobacterium tuberculosis infection. Clin Microbiol Rev. 2014;27(1):3–20. doi:10.1128/CMR.00034-13
8. Pai M, Behr MA, Dowdy D, et al. Tuberculosis. Nat Rev Dis Primers. 2016;2(1):16076. doi:10.1038/nrdp.2016.76
9. Furin J, Cox H, Pai M. Tuberculosis. Lancet. 2019;393(10181):1642–1656. doi:10.1016/S0140-6736(19)30308-3
10. Yerlikaya S, Broger T, MacLean E, Pai M. A tuberculosis biomarker database: the key to novel TB diagnostics. Int J Infect Dis. 2017;56:253–257.
11. Ellis DI, Dunn WB, Grifn JL, Allwood JW, Goodacre R. Metabolic fingerprinting as a diagnostic tool. Pharmacogenomics. 2007;8(9):1243–1266. doi:10.2217/14622416.8.9.1243
12. Cho Y, Park Y, Sim B, et al. Identification of serum biomarkers for active pulmonary tuberculosis using a targeted metabolomics approach. Sci Rep. 2020;10(1):3825. doi:10.1038/s41598-020-60669-0
13. Andreas NJ, Basu Roy R, Gomez-Romero M, et al. Performance of metabonomic serum analysis for diagnostics in paediatric tuberculosis. Sci Rep. 2020;10(1):7302. doi:10.1038/s41598-020-64413-6
14. Izquierdo-Garcia JL, Comella-Del-Barrio P, Campos-Olivas R, et al. Discovery and validation of an NMR-based metabolomic profile in urine as TB biomarker. Sci Rep. 2020;10(1):22317. doi:10.1038/s41598-020-78999-4
15. Mahapatra S, Hess AM, Johnson JL, et al. A metabolic biosignature of early response to anti-tuberculosis treatment. BMC Infect Dis. 2014;31(14):53. doi:10.1186/1471-2334-14-53
16. Luo P, Mao K, Xu J, et al. Metabolic characteristics of large and small extracellular vesicles from pleural effusion reveal biomarker candidates for the diagnosis of tuberculosis and malignancy. J Extracell Vesicles. 2020;9(1):1790158. doi:10.1080/20013078.2020.1790158
17. Dang AT, Marsland BJ. Microbes, metabolites, and the gut-lung axis. Mucosal Immunol. 2019;12(4):843–850. doi:10.1038/s41385-019-0160-6
18. Zhao Y, Chen M. Technical Guidelines for Tuberculosis Prevention and Control in China. People’s Medical Publishing House; 2021:170–172.
19. Want EJ, Masson P, Michopoulos F, et al. Global metabolic profiling of animal and human tissues via UPLC-MS. Nat Protoc. 2012;8(1):17–32. doi:10.1038/nprot.2012.135
20. Wen B, Mei Z, Zeng C, et al. metaX: a flexible and comprehensive software for processing metabolomics data. BMC Bioinform. 2017;18(1):1. doi:10.1186/s12859-017-1579-y
21. Ye S, Wang L, Li S, et al. The correlation between dysfunctional intestinal flora and pathology feature of patients with pulmonary tuberculosis. Front Cell Infect Microbiol. 2022;12:1090889. doi:10.3389/fcimb.2022.1090889
22. Yamada N, Saito-Iwamoto C, Nakamura M, et al. Lactobacillus gasseri PA-3 Uses the Purines IMP, Inosine and Hypoxanthine and Reduces their Absorption in Rats. Microorganisms. 2017;5(1):10. doi:10.3390/microorganisms5010010
23. Li M, Yang D, Mei L, Yuan L, Xie A, Yuan J. Screening and characterization of purine nucleoside degrading lactic acid bacteria isolated from Chinese sauerkraut and evaluation of the serum uric acid lowering effect in hyperuricemic rats. PLoS One. 2014;9(9):e105577. doi:10.1371/journal.pone.0105577
24. Huang H, Shi LY, Wei LL, et al. Plasma metabolites Xanthine, 4-Pyridoxate, and d-glutamic acid as novel potential biomarkers for pulmonary tuberculosis. Clin Chim Acta. 2019;498:135–142. doi:10.1016/j.cca.2019.08.017
25. Knejzlík Z, Herkommerová K, Hocková D, Pichová I, Becker A. Hypoxanthine-Guanine Phosphoribosyltransferase Is Dispensable for Mycobacterium smegmatis Viability. J Bacteriol. 2020;202(5):e00710–19. doi:10.1128/JB.00710-19
26. Eng WS, Rejman D, Pohl R, et al. Pyrrolidine nucleoside bisphosphonates as antituberculosis agents targeting hypoxanthine-guanine phosphoribosyltransferase. Eur J Med Chem. 2018;159:10–22. doi:10.1016/j.ejmech.2018.09.039
27. Devlin AS, Fischbach MA. A biosynthetic pathway for a prominent class of microbiota-derived bile acids. Nat Chem Biol. 2015;11(9):685–690. doi:10.1038/nchembio.1864
28. Ridlon JM, Kang DJ, Hylemon PB, Bajaj JS. Bile acids and the gut microbiome. Curr Opin Gastroenterol. 2014;30(3):332–338. doi:10.1097/MOG.0000000000000057
29. Fukiya S, Arata M, Kawashima H, et al. Conversion of cholic acid and chenodeoxycholic acid into their 7-oxo derivatives by Bacteroides intestinalis AM-1 isolated from human feces. FEMS Microbiol Lett. 2009;293(2):263–270. doi:10.1111/j.1574-6968.2009.01531.x
30. Luo M, Liu Y, Wu P, et al. Alternation of Gut Microbiota in patients with pulmonary tuberculosis. Front Physiol. 2017;8:822. doi:10.3389/fphys.2017.00822
31. Namasivayam S, Maiga M, Yuan W, et al. Longitudinal profiling reveals a persistent intestinal dysbiosis triggered by conventional anti-tuberculosis therapy. Microbiome. 2017;5(1):71. doi:10.1186/s40168-017-0286-2
32. Winglee K, Eloe-Fadrosh E, Gupta S, Guo H, Fraser C, Bishai W. Aerosol Mycobacterium tuberculosis infection causes rapid loss of diversity in gut microbiota. PLoS One. 2014;9(5):e97048. doi:10.1371/journal.pone.0097048
33. Namasivayam S, Kauffman KD, McCulloch JA, et al. Correlation between disease severity and the intestinal Microbiome in Mycobacterium tuberculosis-Infected Rhesus Macaques. mBio. 2019;10(3):e01018–19. doi:10.1128/mBio.01018-19
34. Kurihara S. Polyamine metabolism and transport in gut microbes. Biosci Biotechnol Biochem. 2022;86(8):957–966. doi:10.1093/bbb/zbac080
35. Nayak A, Liu C, Mehta A, et al. N8-Acetylspermidine: a polyamine biomarker in ischemic cardiomyopathy with reduced ejection fraction. J Am Heart Assoc. 2020;9(11):e016055. doi:10.1161/JAHA.120.016055
36. Jain V, Raina S, Gheware AP, et al. Reduction in polyamine catabolism leads to spermine-mediated airway epithelial injury and induces asthma features. Allergy. 2018;73(10):2033–2045. doi:10.1111/all.13472
37. Wawrzyniak M, Groeger D, Frei R, et al. Spermidine and spermine exert protective effects within the lung. Pharmacol Res Perspect. 2021;9(4):e00837. doi:10.1002/prp2.837
38. Carriche GM, Almeida L, Stüve P, et al. Regulating T-cell differentiation through the polyamine spermidine. J Allergy Clin Immunol. 2021;147(1):335–348.e11. doi:10.1016/j.jaci.2020.04.037
39. Tiwari D, Martineau AR. Inflammation-mediated tissue damage in pulmonary tuberculosis and host-directed therapeutic strategies. Semin Immunol. 2023;65:101672. doi:10.1016/j.smim.2022.101672
40. Hunter RL. Tuberculosis as a three-act play: a new paradigm for the pathogenesis of pulmonary tuberculosis. Tuberculosis. 2016;97:8–17. doi:10.1016/j.tube.2015.11.010
41. Allwood BW, Byrne A, Meghji J, Rachow A, van der Zalm MM, Schoch OD. Post-tuberculosis lung disease: clinical review of an under-recognised global challenge. Respiration. 2021;100(8):751–763. doi:10.1159/000512531
42. Shah M, Reed C. Complications of tuberculosis. Curr Opin Infect Dis. 2014;27(5):403–410. doi:10.1097/QCO.0000000000000090
43. Zhang X, Huang T, Wu Y, et al. Inhibition of the PI3K-Akt-mTOR signaling pathway in T lymphocytes in patients with active tuberculosis. Int J Infect Dis. 2017;59:110–117. doi:10.1016/j.ijid.2017.04.004
44. Pugin B, Barcik W, Westermann P, et al. A wide diversity of bacteria from the human gut produces and degrades biogenic amines. Microb Ecol Health Dis. 2017;28(1):1353881. doi:10.1080/16512235.2017.1353881
45. Michalovich D, Rodriguez-Perez N, Smolinska S, et al. Obesity and disease severity magnify disturbed microbiome-immune interactions in asthma patients. Nat Commun. 2019;10(1):5711. doi:10.1038/s41467-019-13751-9
46. Che N, Cheng J, Li H, et al. Decreased serum 5-oxoproline in TB patients is associated with pathological damage of the lung. Clin Chim Acta. 2013;423:5–9. doi:10.1016/j.cca.2013.04.010
47. Scher JU, Pillinger MH. The anti-inflammatory effects of prostaglandins. J Investig Med. 2009;57(6):703–708. doi:10.2310/JIM.0b013e31819aaa76
48. Swiercz R, Rydzyński K, Wasowicz W, Majcherek W, Wesołowski W. Toxicokinetics and metabolism of pseudocumene (1,2,4-trimethylbenzene) after inhalation exposure in rats. Int J Occup Med Environ Health. 2002;15(1):37–42.
49. Tovaglieri A, Sontheimer-Phelps A, Geirnaert A, et al. Species-specific enhancement of enterohemorrhagic E. coli pathogenesis mediated by microbiome metabolites. Microbiome. 2019;7(1):43. doi:10.1186/s40168-019-0650-5
50. Chen Y, Li L, Wang W, et al. Serum metabolomic research of the anti-pulmonary fibrosis effects of Shuangshen Pingfei Formula on bleomycin-induced pulmonary fibrosis rats. J Chromatogr B Analyt Technol Biomed Life Sci. 2022;1(1197):123225. doi:10.1016/j.jchromb.2022.123225
51. Albors-Vaquer A, Rizvi A, Matzapetakis M, et al. Active and prospective latent tuberculosis are associated with different metabolomic profiles: clinical potential for the identification of rapid and non-invasive biomarkers. Emerg Microbes Infect. 2020;9(1):1131–1139. doi:10.1080/22221751.2020.1760734
52. Conde R, Laires R, Gonçalves LG, et al. Discovery of serum biomarkers for diagnosis of tuberculosis by NMR metabolomics including cross-validation with a second cohort. Biomed J. 2022;45(4):654–664. doi:10.1016/j.bj.2021.07.006
 © 2023 The Author(s). This work is published and licensed by Dove Medical Press Limited. The full terms of this license are available at https://www.dovepress.com/terms.php and incorporate the Creative Commons Attribution - Non Commercial (unported, v3.0) License.
By accessing the work you hereby accept the Terms. Non-commercial uses of the work are permitted without any further permission from Dove Medical Press Limited, provided the work is properly attributed. For permission for commercial use of this work, please see paragraphs 4.2 and 5 of our Terms.
© 2023 The Author(s). This work is published and licensed by Dove Medical Press Limited. The full terms of this license are available at https://www.dovepress.com/terms.php and incorporate the Creative Commons Attribution - Non Commercial (unported, v3.0) License.
By accessing the work you hereby accept the Terms. Non-commercial uses of the work are permitted without any further permission from Dove Medical Press Limited, provided the work is properly attributed. For permission for commercial use of this work, please see paragraphs 4.2 and 5 of our Terms.