Back to Journals » International Journal of Chronic Obstructive Pulmonary Disease » Volume 18
Unleashing the Power of Very Small Data to Predict Acute Exacerbations of Chronic Obstructive Pulmonary Disease
Authors Jacobson PK ![]() , Lind L
, Lind L ![]() , Persson HL
, Persson HL ![]()
Received 13 April 2023
Accepted for publication 20 June 2023
Published 18 July 2023 Volume 2023:18 Pages 1457—1473
DOI https://doi.org/10.2147/COPD.S412692
Checked for plagiarism Yes
Review by Single anonymous peer review
Peer reviewer comments 2
Editor who approved publication: Dr Jill Ohar
Petra Kristina Jacobson,1,2 Leili Lind,3,4 Hans Lennart Persson1,2
1Department of Health, Medicine and Caring Sciences, Linköping University, Linköping, Sweden; 2Department of Respiratory Medicine in Linköping, Linköping University, Linköping, Sweden; 3Department of Biomedical Engineering/Health Informatics, Linköping University, Linköping, Sweden; 4Digital Systems Division, Unit Digital Health, RISE Research Institutes of Sweden, Linköping, Sweden
Correspondence: Petra Kristina Jacobson, Department of Respiratory Medicine in Linköping, Linköping University, Linköping, SE-581 85, Sweden, Tel +46 10 1031162, Email [email protected]
Introduction: In this article, we explore to what extent it is possible to leverage on very small data to build machine learning (ML) models that predict acute exacerbations of chronic obstructive pulmonary disease (AECOPD).
Methods: We build ML models using the small data collected during the eHealth Diary telemonitoring study between 2013 and 2017 in Sweden. This data refers to a group of multimorbid patients, namely 18 patients with chronic obstructive pulmonary disease (COPD) as the major reason behind previous hospitalisations. The telemonitoring was supervised by a specialised hospital-based home care (HBHC) unit, which also was responsible for the medical actions needed.
Results: We implement two different ML approaches, one based on time-dependent covariates and the other one based on time-independent covariates. We compare the first approach with standard COX Proportional Hazards (CPH). For the second one, we use different proportions of synthetic data to build models and then evaluate the best model against authentic data.
Discussion: To the best of our knowledge, the present ML study shows for the first time that the most important variable for an increased risk of future AECOPDs is “maintenance medication changes by HBHC”. This finding is clinically relevant since a sub-optimal maintenance treatment, requiring medication changes, puts the patient in risk for future AECOPDs.
Conclusion: The experiments return useful insights about the use of small data for ML.
Keywords: machine learning, telehealth or digital health, COX proportional hazards, random survival forests, random forests, mHealth
Introduction
Acute exacerbations of chronic obstructive pulmonary disease (AECOPDs) are commonly defined as acute events with worsening of respiratory symptoms beyond normal day-to-day variations.1 AECOPDs, particularly those requiring hospitalisation, are associated with significant morbidity and mortality. Patient recovery is slow and is a major burden for health services. For these reasons, remote monitoring of COPD patients and care at home with the view of early detection of AECOPD is of paramount importance. The benefit of creating prediction models to detect AECOPDs in advance is generally acknowledged, because, with timely treatments, they could help reduce AECOPD severity and recovery time. To the best of our knowledge, the use of small data to build predictive models for AECOPDs that are trustworthy in real-world scenarios has never been discussed explicitly before. The purpose of the experiments presented in this article is therefore to explore to what extent it is possible to leverage on very small data to build machine learning (ML) models that predict AECOPDs. ML is a subset of artificial intelligence (AI).
Previous Work
Extensive previous work exists on the effect of telehealth and regular self-monitoring on patients affected by long-term diseases, including COPD. A recent survey by Metting et al summarises the findings based on investigations carried out on respiratory and systemic symptoms of asthma and COPD.2 According to this survey, remote patient monitoring helps patients improve disease-related self-management and care-plan adherence, boosts involvement in care and improves patient experience and satisfaction, especially when an educational component is included regarding different aspects of self-management.2 This picture is confirmed by other studies that point out how daily monitoring of COPD is an essential step to prevent the occurrence and the risk of future AECOPDs, eg, the studies by Rassouli et al with Swiss COPD patients,3,4 and the studies by Persson and Lyth et al with Swedish patients.5–7
Predictions are important for optimising remote patient care. Unfortunately, predicting AECOPDs is considered as one of the most difficult tasks in the medical field.8 Many studies (summarised in Table 1) and systematic reviews9 describe the application of ML algorithms to predict AECOPDs. In the survey by Guerra et al,10 the prediction models displayed great heterogeneity regarding the quantity and nature of predictors, time horizon, statistical methods employed, and metrics used to evaluate model performance. Furthermore, it was determined that only two of the 25 studies validated the accuracy of the model developed. The evaluation of the models means that the reliability of the approach is assessed, thus, to see whether a model is successful or not. Indeed, evaluation is one of the core tasks in an ML workflow. Model evaluation involves assessing the effectiveness of a system’s predictions. This is achieved by evaluating the performance of the newly trained model using a new and independent dataset. Since normally ML algorithms work well when they are fed with sizeable amount of data, to date, no study exists that investigates whether it is possible to build ML models for AECOPD prediction based on very small data.
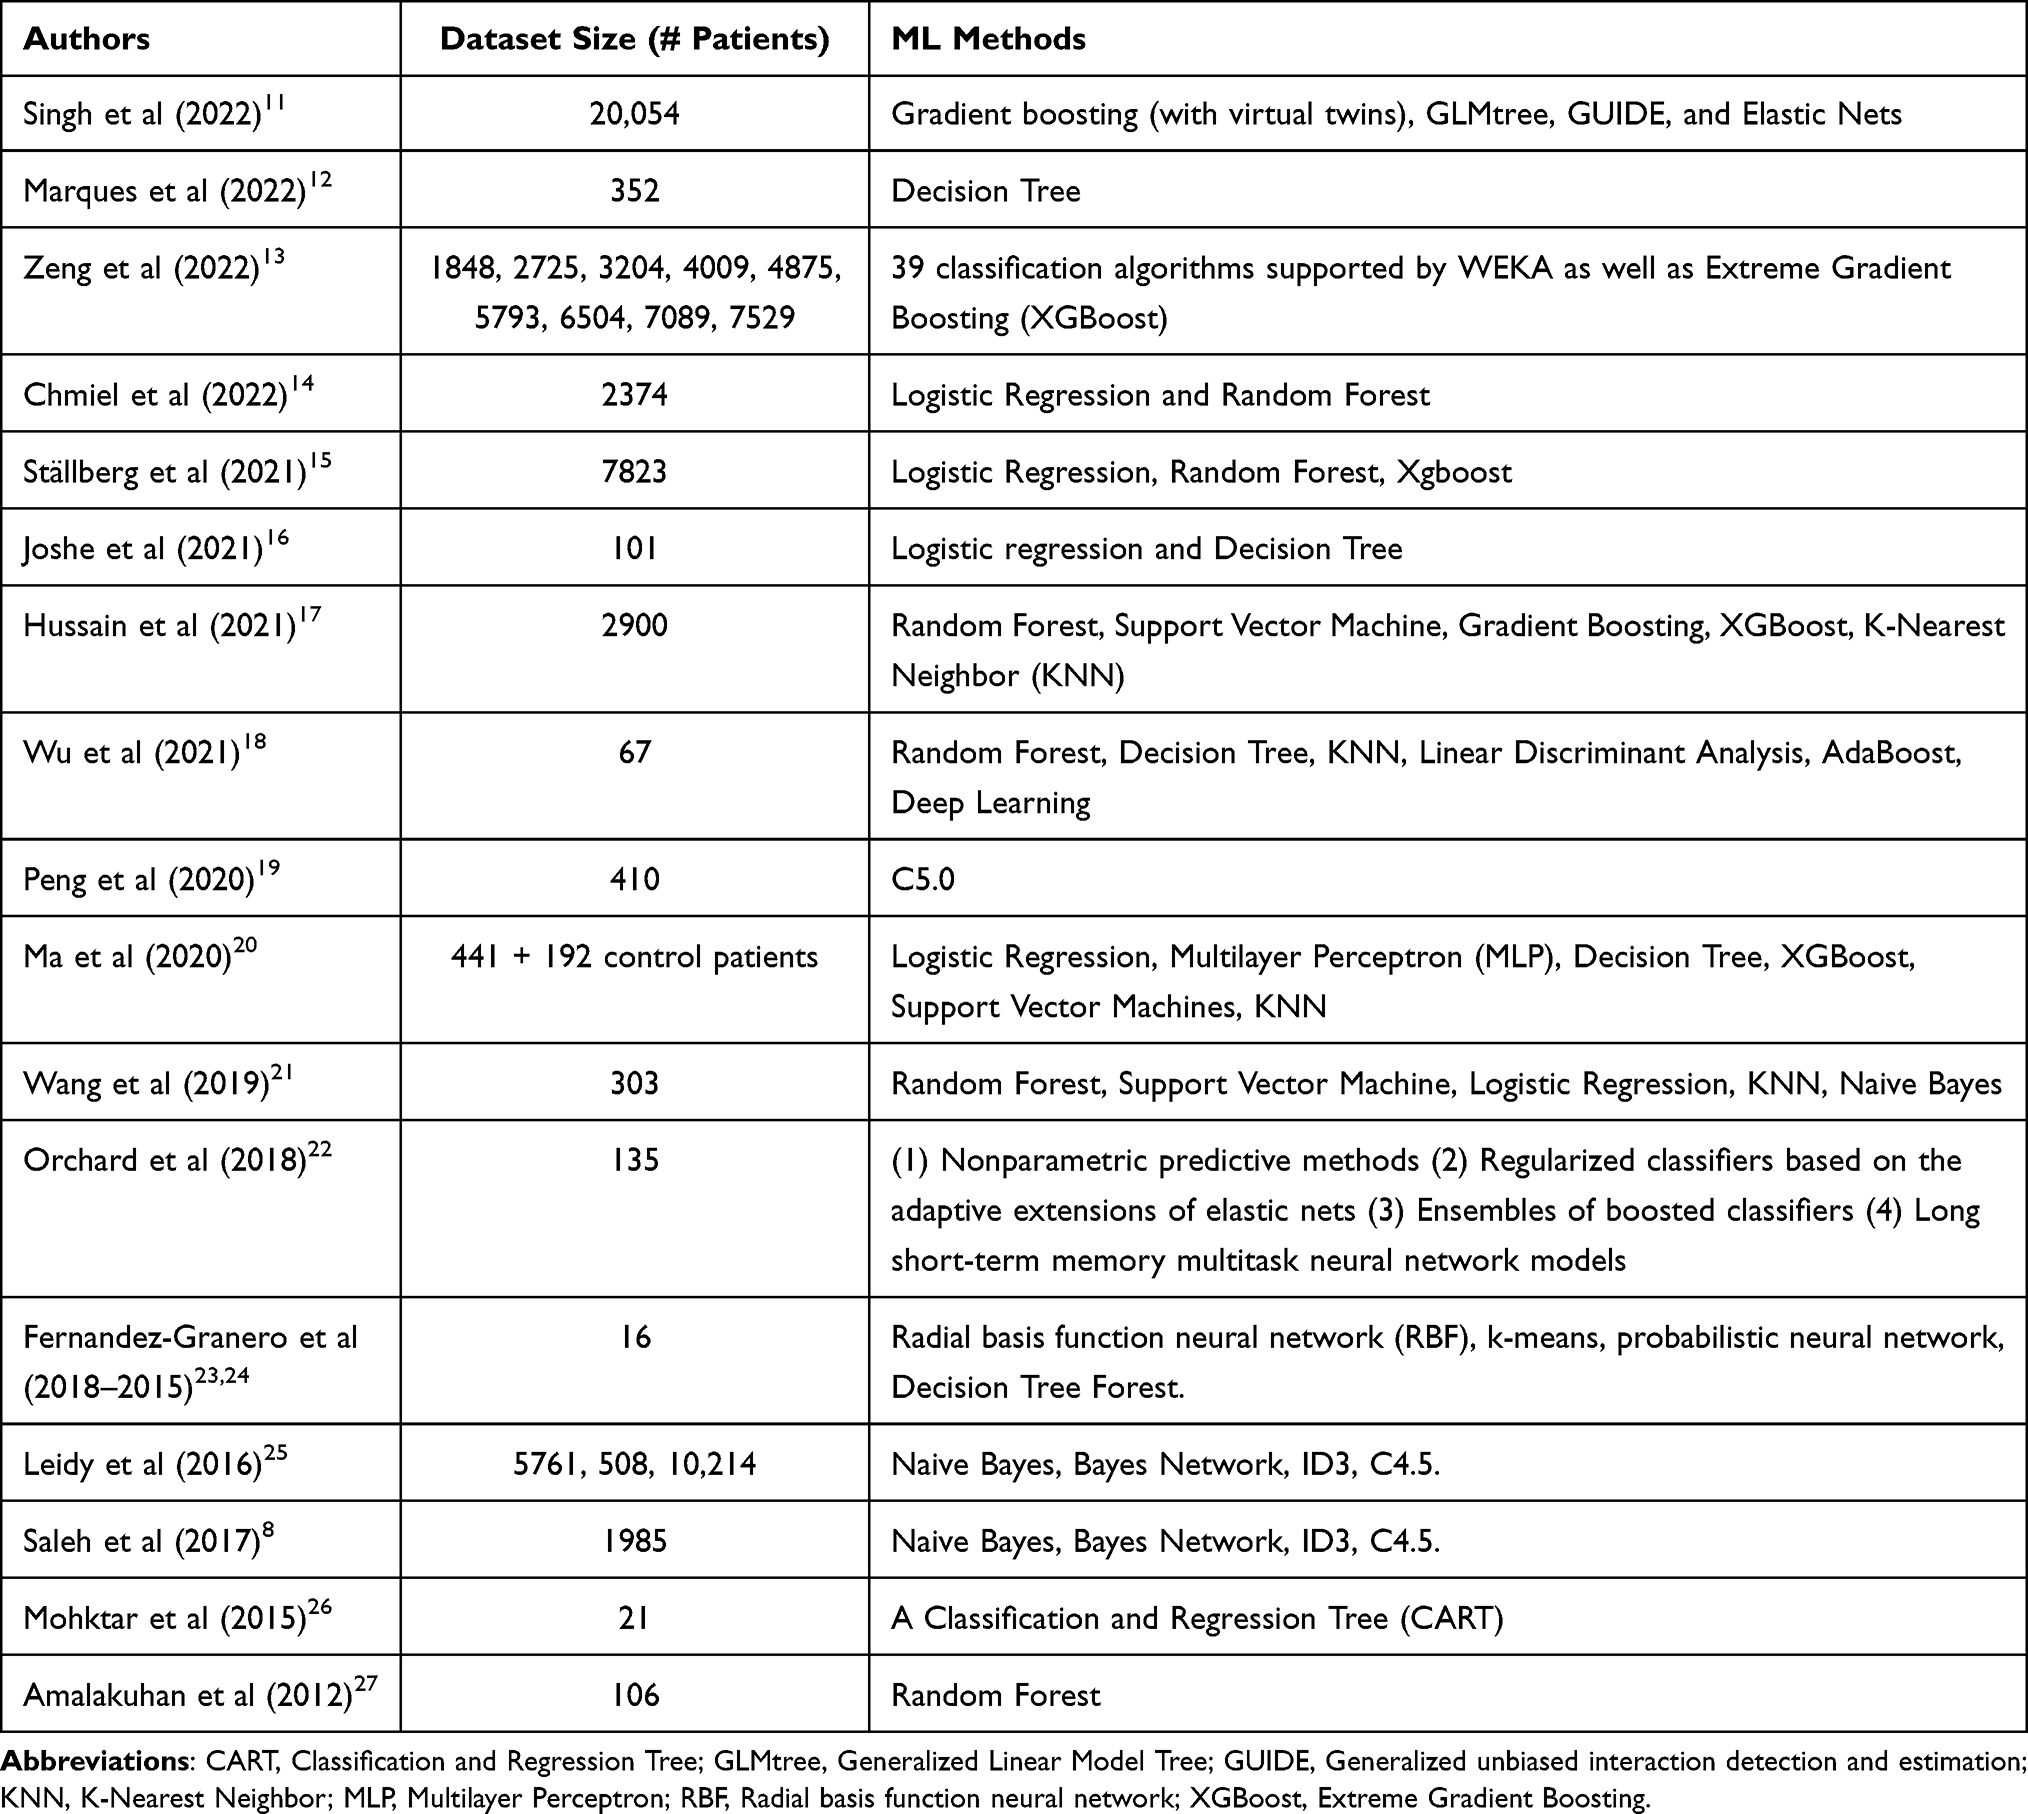 |
Table 1 Previous Studies That Build Predictive Models for AECOPDs Employing ML |
The term “small dataset” implies a small number of records. The quantity depends on the nature of the problem to be solved. In this context, “small” means between a couple of dozens. The risk with models that are built on small datasets is that they either underfit, ie, they are under-specified, and results are vague, or they overfit, ie, they are over-specified and results are good, but valid only for the sample that has been used to train the algorithm. In both underfitting and overfitting, the model is unable to generalise, which refers to the capacity to make correct predictions on data that the model has not seen before, as it is always the case in real-world scenarios. In Table 1, we list a few studies (the list is indicative and not systematic) and show the datasets in terms of size and ML methods used by the authors to build predictive models for AECOPDs.
With the exceptions of the studies by Fernandez-Granero et al23,24 which present a special case of predictive model based on respiratory sounds recorded for six months with an ad-hoc designed electronic sensor, and with the exception of Mohktar et al,26 who themselves point out the issues related to small sample sizes in respiratory-related telehealth research, the size of all the datasets shown in Table 1 is large and varies from 7823 to 67 subjects.
The eHealth Diary Study: Initial Cohort, Samples and Datasets
The eHealth Diary study is a 12-month longitudinal telemonitoring study, in which data was collected between 2013 and 2017 in Östergötland, Sweden. The telemonitoring system, the Health Diary, is based on patients’ use of a digital pen for health state reporting to a specialised hospital-based home care (HBHC) unit.5–7 The underlying assumption behind the telemonitoring, based on the Health Diary, is that patients with advanced COPD would undergo fewer AECOPDs due to regular home monitoring administered via a digital diary and the digital pen. Once included in the study, according to the criteria described in Lyth et al,7 patients were introduced to the telemonitoring system, which was supervised by the specialised HBHC unit. Staff associated with this unit were responsible for the health care provided during the period of the study. The study included patients with COPD, aged ≥65 years, who were frequently hospitalised due to AECOPDs – at least two inpatient episodes within the last 12 months. A total of 36 COPD patients with advanced stages of disease were included. Previous statistical and qualitative analysis report that the number of hospitalisations was significantly reduced, and quality of life was improved for COPD patients participating in telemonitoring.5–7
To apply ML consistently and to avoid distortion in the results, we applied several eligibility criteria to the cohort described above. Criterium 1. A patient must have recorded symptom assessments via the Health Diary during at least 75 days along one year, not necessarily contiguous. If the patients, who enrolled in the study, did not explicitly drop-out for internal or external reasons, and if they did not die during the study period, we assumed that they wanted to be included in the study up to the end, even if there might be many missing data. We counted the average number of days with recorded symptom assessments per patient in one year, defining the minimum as 75 days. This assumption was to show that the treatment during the study was effective/not effective. Criterium 2. Patients who died during the study period were excluded. Since it is impossible to establish whether the death of these patients was caused by the inefficacy of the treatment during the study or for natural causes, such as advanced age, it is hard to make any initial hypothesis. Therefore, we excluded these patients from our ML experiments. Criterium 3. Some patients dropped out because they relocated or because they were admitted to care home or palliative care. We excluded these patients from ML analysis, as well, because they did not fulfil criterium 1. Once the eligibility criteria were applied, we ended up with a total of 18 patients suitable for ML experiments.
In our experiments, patients were represented by four constants (ie, values that do not vary during the study period), ie, gender, age at study inclusion, the number of hospitalisations during the year before the study and the forced expiratory volume in one second (FEV1) value at study inclusion, plus three sets of variables, namely symptoms [breathlessness at rest (BaR), breathlessness at physical activity (BaPA), mucus and cough], contacts with HBHC (patient calls HBHC nurse, HBHC physician calls patient, home visit by HBHC physician, HBHC nurse calls patient and home visit by HBHC nurse) and medications (maintenance medication changes by HBHC, and intake of the P.R.N. medications anxiolytics, antibiotics, cortisone, extra inhalations or other medications), whose values are recorded on a daily basis or when they occur.
We used the number of AECOPDs during the study as class (or dependent variable) and all the other variables as attributes (or independent variables) characterising the class. All the predictive models created in these experiments relied on supervised learning, which is a subcategory of ML. This means that an algorithm is trained on input data, which have been labelled to predict a particular output (the class). Supervised learning is good for both classification (when the class is a word) and regression problems (when the class is a number). Since the variable “number of exacerbations during the study” is a number, we applied supervised algorithms for regression, namely Random Survival Forest (RSF) on time-dependent data and Reduced Error Pruning Tree (REPTree) and Random Forest (RF) for time-independent data. These two algorithms have been used previously on medical data with good results, both on big datasets28,29 and relatively small datasets.30
Time-Dependent and Time-Independent Representations
From raw data, two representations were created, one based on time-dependent variables, and the other one based on time-independent variables. We created several datasets based on these two representations. The data collected in the eHealth Diary study were specified by the patients via the Health Diary forms.5 The data were stored in an SQL database and then manually migrated to Excel sheets. The data in the Excel files were organised per patient and the assessments and the events in chronological order by date. From these raw data, several datasets were extracted. All the data were anonymised.
The datasets used with survival algorithms (see Cox Proportional Hazards Models for details) were organised by day number, ie, the number of the day during the 365-day long study, when an assessment or an event occurred. We call them time-dependent datasets, meaning that they contain 365 rows per patient, and each patient is described every day by the assessments and the events that occurred that day. For example, one patient had an exacerbation on day number 5 and that day the BaR value was 5, the BaPa value was 8, and so on. We used this representation for COX Proportional Hazards (CPH) and for RSF. The datasets used for REPTree and RF were instead time-independent, meaning that each patient was represented by the sum of the events occurred during 365 days or the mean of the assessments. For example, one patient, who was a female and aged 69 at the time of the study inclusion, had 5 exacerbations during the study period, the overall average of BaR was 3.32 for 365 days, the Mucus mean was 2.97 and so on. The time-based representation helped us to track the progress of the exacerbation events during the study and most influential factors in that progression. On the other hand, the time-independent datasets gave us a quantitative/cumulative representation of assessments and events characterising each patient, who attended the study for 365 days.
If missing data occurred on the same day that an exacerbation event occurred, the missing data were searched for in the medical records and filled-up manually. If the missing data occurred during days without an exacerbation event, all the records containing missing data were removed with the command na.omit() in R.
Statistical Measures Used to Describe the Samples
In the descriptive statistics of the COPD sample used in this study, we described the numeric data using four measures of central tendency, namely min, max, mean, mode, and four measures of spread, ie, standard deviation (SD), skewness, kurtosis, and standard error (SE). The analysis of AECOPD rate was carried out using both Poisson regression and negative binomial regression. Both methods have been used in previous COPD research.3
Methods Used in the Experiment
Cox Proportional Hazards Models
We applied the “coxph(Surv(time, status).)” model in the comparison with RSF. It calculates a standard COX model with right censored data. This format is called “timeline data”.31–34 Timeline data comprises a case identifier and a timeline variable, with a unique value pair for each row. The remaining covariates consist of any number of variables, the values of which were observed at that particular time, or missing if there was no observation of that variable at that time.31–34 COX models assume time-dependent covariates to be constant in each risk interval,31–34 for this reason it is called “proportional”. The proportional hazards assumption can be verified by conducting statistical tests and graphical diagnostics that employ the scaled Schoenfeld residuals.31–34 A non-significant relationship between residuals and time confirms the proportional hazards assumption, whereas a significant relationship contradicts it.
Interpretation and Evaluation
Survival analyses produce p-values for three tests to determine the overall significance of the model: the likelihood-ratio test, the Wald test and the score log-rank statistics. For global statistical significance of the CPH model, we used the likelihood ratio test, because it has better behaviour for small sample sizes.31–34 COX regression coefficients relate to Hazard, that is, a positive coefficient indicates a poorer prognosis, and a negative coefficient suggests a protective influence of the variable it is linked to.
The concordance index, also known as the C-index, is the most employed assessment metric for survival models. It quantifies the degree of rank correlation between predicted risk scores. The concordance statistics, also called the C-statistics, compute the agreement between an observed response and a predictor. It is defined as the ratio of correctly ordered (concordant) pairs to comparable pairs. The C-statistic is a measure of goodness of fit. Thus, the C-index reflects the discrimination power by the individual risk level, from those with a low risk to those with a high risk. In clinical studies, the C-index gives the probability that a randomly selected patient, who experienced an event (eg, in our case an AECOPD), had a higher risk score than a patient who had not experienced the event. When the model is no better than predicting an outcome than random chance the value is 0.5. Values over 0.7 indicate a good model, while values over 0.8 indicate a strong model. A value of 1 means that the model perfectly predicts those group members, who will experience a certain outcome and those who will not.35,36
The Akaike information criterion (AIC) is a mathematical approach to assess the degree of fit between a model and the data it was created from. In statistics, the AIC is employed to compare numerous models and identify the one that best fits the data.37 To achieve a balance between bias and variance or accuracy (fit) and simplicity of the model, the information criterion is commonly employed for model comparison. There is no value for AIC that can be considered “good” or “bad”, because we simply use AIC to compare regression models. Thus, AIC is a relative measure that compares one model to another to choose the one that loses less information.
The Integrated Brier Score (IBS) provides an overall calculation of the model performance at all available times.38 It is known that the Brier score of a perfect predictive model is 0.02, while the Brier score of a trivial model is 0.25.39
Machine Learning Algorithms Used in the Experiments
Decision Tree for Regression (REPTree)
RepTree is a rapid decision tree learner that constructs a decision/regression tree utilising information gain as the splitting criterion and subsequently prunes it with a reduced error pruning algorithm.40 It is the most intuitive ML algorithm and is suitable for small data.
Random Forest
RF is a supervised ML algorithm that is extensively used in regression and classification problems. RF creates multiple decision trees on different samples and then utilizes their majority vote for classification or averaging for regression.41 The name Random Forest implies that the algorithm comprises numerous individual decision trees that operate as an ensemble. Each tree in the RF produces a class prediction, and the one with the highest number of votes is ultimately selected as the model’s prediction.42 Each tree is trained on different objects and different features.
Random Survival Forest
Traditionally, ML for time-dependent data is less developed than for other types of data. However, several ML algorithms (eg, RSF) can be used for time-dependent data, and especially for clinical studies. In this study, we compare the performance of two algorithms, ie, traditional survival analysis in the form of CPH and ML-based RSF on the same dataset. The same way of comparison has been applied previously on other diseases.30 In this study, we use R implantations of both algorithms, namely the survival package for survival analysis and the Random Forests for Survival, Regression and Classification (RFSRC) package. Like RF, RSF is also an ensemble ML method that utilises multiple independent decision trees. In the RSF model, each decision tree receives a random subset of samples and randomly selects a subset of variables at each split in the tree to make predictions. The final prediction of the RSF model is determined by averaging the predictions of each individual tree.30
Interpretation and Evaluation
The topmost node in the decision tree is called the root node, while the bottom-most node is called the leaf node. A node divided into sub-nodes is called a parent node, while the sub-nodes are called child nodes. The values on the lines joining the nodes represent the splitting criteria, which in turn are based on the values in the parent node feature. In the leaf node, the value before the parenthesis denotes the classification value and the first value in the first parenthesis is the total number of instances from the training set in that leaf. The second value is the number of instances incorrectly classified in that leaf and the first value in the second parenthesis is the total number of instances from the pruning set in that leaf. The second value is the number of instances incorrectly classified in that leaf. We evaluated the Reptree and RF with the root mean square error (RMSE). The RMSE value is calculated by taking the square root of the variance of the residuals. This value reveals how close the observed data points are to the model’s predicted values. While R-square is a comparative measure of how well a model performs, the RMSE is an absolute measure of fit. By interpreting the RMSE as the standard deviation of the unexplained variance, it helps to quantify the amount of variation that the model’s predictions do not account for. Generally, RMSE can be understood as a measure of the average error between a model’s predictions and the actual data, giving more weight to larger errors. Lower values of RMSE generally indicate a better fit of the model to the data. RMSE is a useful measure for assessing the ability of the model to predict the response variable. If the main goal of the model is prediction, then RMSE is the most important criterion for evaluating the quality of the model’s fit.43
We evaluated the RSF models with the concordance index (to make a comparison with CHP models), and with the out of bag (OOB) score. Each tree in the RSF is trained on a bootstrap resample of the training data, and an average 1/3 of the original training data is not used in training each tree. The whole point of the OOB is to have an estimate of the error for unseen data, but that is only an estimate, since not all trees in the RSF are contributing to the decision.
Two hyperparameters are important in RSF: number of randomly drawn candidate variables (mtry) and number of trees. Normally, mtry=p/3 for regression is reasonable, with p being the number of predictor variables. Depending on the number of covariates used to build the models, a varying number for this parameter is used. We used 300 trees.
Synthetic Data for Time-Independent Datasets
The COPD sample is small, which can affect the performance of the ML algorithm. One way to overcome this limitation is to create synthetic data. While there is no easy way to create synthetic data with time-independent datasets, some well-established algorithms exist. In these experiments, we used the R package bespoke to augment the time-independent datasets.44 Bespoke ML offers the possibility to evaluate the similarity of the distribution between authentic data and synthetic data. Augmentation is sometimes needed to avoid underfitting or overfitting. Underfitting is a situation in which a data model fails to accurately capture the relationship between input and output variables, resulting in high error rates on both training set and unseen data. It occurs when the model is too simplistic. Some reasons for underfitting include insufficient training time, limited input features, or excessive regularisation. Just like overfitting, underfitting also leads to training errors and poor model performance, as the model cannot capture the dominant trend in the data. If a model cannot generalise well to new data, then it cannot be used for classification or prediction tasks.
Results of the Sample COPD: 18 Patients
In this section, we describe the COPD sample and present experiments based on the sample.
Sample COPD: Descriptive Statistics
Table 2 summarises the descriptive statistics. We observed that anxiolytics, antibiotics, cortisone, inhalation, and other remedies had high SD, high SE, and high kurtosis. Women tended to be older (mean 76 years), while men had an average age of 72. The COPD sample was unbalanced for gender, since females (11 women) were overrepresented with respect to males (7 men). The variable “Exacerbations during the study” showed that most women experienced a higher number of AECOPDs than men did.
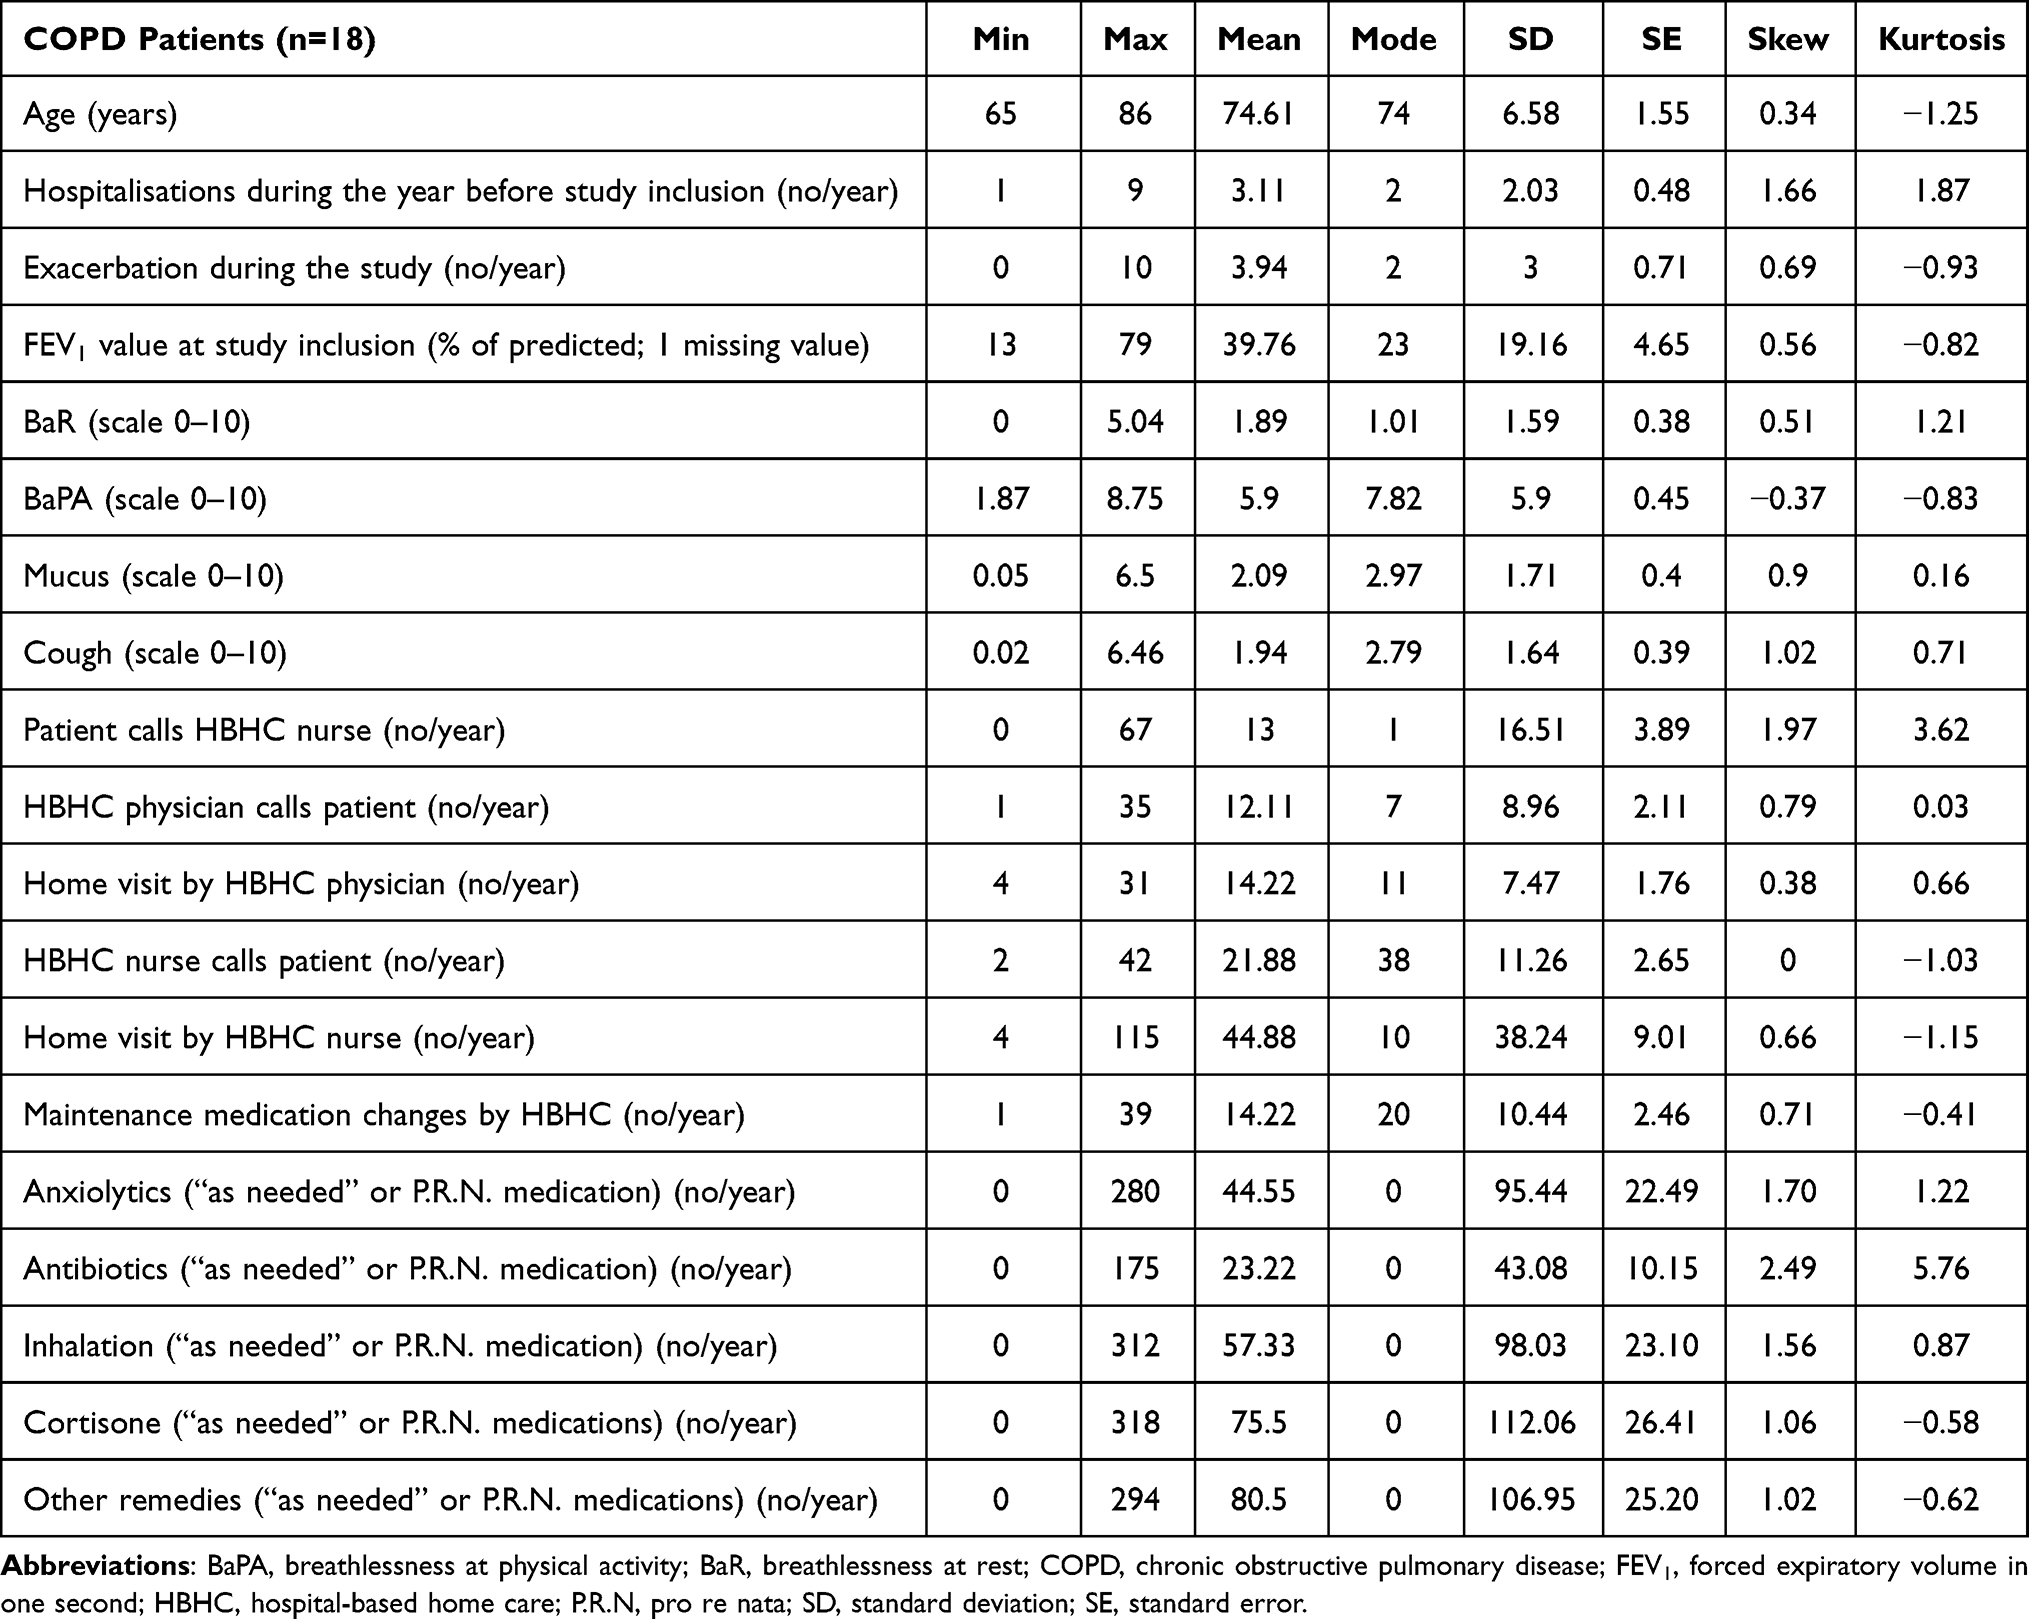 |
Table 2 The Descriptive Statistics of the COPD Sample |
The distribution of the 71 AECOPDs during the study (irrespective of gender division) was bimodal, showing a peak at 2 exacerbations (5 patients) and a lower peak at 8 exacerbations (2 patients; see the x-axis) (see Figure 1). It is important to notice that the distribution representation does not account for the progression of the exacerbations in the sample over time. This progression is shown in Sample COPD: COX and Time-Dependent Datasets (see Figure 2).
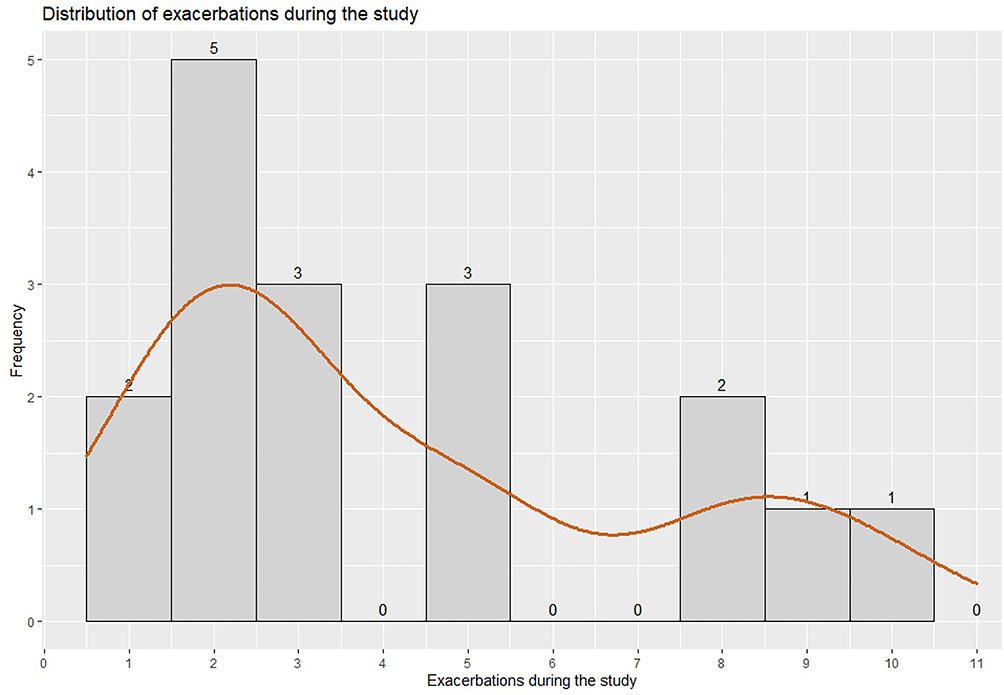 |
Figure 1 The distribution of exacerbations during the study (irrespective of gender division). |
 |
Figure 2 The Kapler–Meyer curve of AECOPD hazard probability. Abbreviation: AECOPD, acute exacerbation of chronic obstructive pulmonary disease. |
Sample COPD: COX and Time-Dependent Datasets
In this section, we compare two CPH models – the first one with 2 dates and the second one with only one date. After some empirical trials, we noticed that the P.R.N. attributes were not reliable, because when they were included in the modelling, the CPH assumptions were violated. For this reason, we excluded them from the CHP models presented below.
When two dates are specified with coxph [coxph(surv(time1, time2, status).)], together with time-dependent covariates, at each AECOPD the algorithm compared the current covariate values of the patient affected by AECOPD to the current values of all other patients, who were at risk at that time. We observed that in this model only two variables were statistically significant, namely “maintenance medication changes by HBHC” and “home visit by HBHC physician” (Table 3).
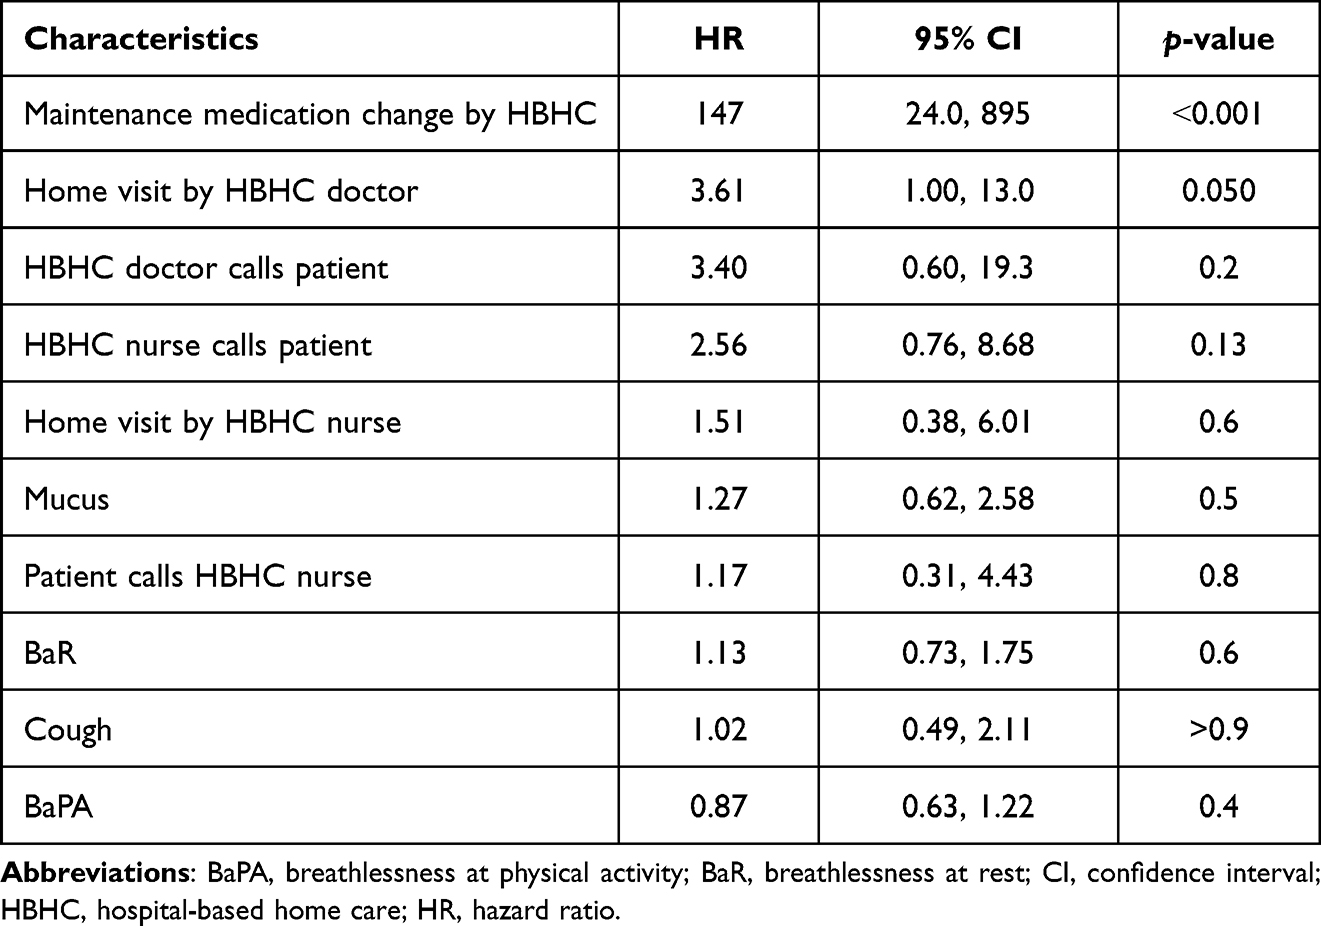 |
Table 3 The Results of the CPH Model with 2 Dates |
The variable “maintenance medication changes by HBHC” had a hazard ratio of 147, which told us that patients, who got a maintenance medication change, had an increased risk of getting an AECOPD. The corresponding 95% confidence interval was 24–895, which is significant. Seventy-one AECOPDs had occurred to the patients in the sample. The global p-value of the model was significant (p˂0.0001). C-index was very high (0.99), and AIC was quite low (77.03). The test for the proportional hazard assumption showed that the test was not statistically significant for any variable, including the global test. Thus, we could safely assume that the model was valid. The COX model with two dates was statistically significant; all tests (likelihood ratio test, Wald test, log-rank score test) demonstrated statistical significance (p˂0.00001). The Kapler–Meyer curve showed that there is a progressive decrease of AECOPD hazard probability, showing that patients become less exposed to AECOPD risk along the period of the telemonitoring study (see Figure 2).
In comparison, a COX model with only a single time indication violated the proportional assumptions, and the AIC was very high (meaning that the model was not parsimonious). Since this model did not comply with the COX assumptions, we discarded it.
Sample COPD: RandomForestSRC and Time-Dependent Dataset
For this experiment, we used the R package RandomForestSRC. RFSRC can handle only one date. We build a model with the following command:
rfsrc(Surv(Day_Number, Exacerbation_Event) ~ BaR + BaPA + Mucus + Cough + patient_calls_HBHC_nurse + HBHC_doctor_calls_patient + home_visit_by_HBHC_doctor + HBHC_nurse_calls_patient + home_visit_by_HBHC_nurse + medication_change, data=COPD_cox_df, mtry = 6, ntree = 300, nsplit = 10, ntime = 150, seed = 123,456,789, block.size = 10, importance=TRUE, splitrule=“logrank”)
The output is shown in Table 4. We observed a low error rate (OOB). Table 5 shows the importance for this model. The most important variable, as in the case of the COX model, was the “maintenance medication changes by HBHC” (shortened “medication_change”), followed by “home visit by HBHC doctor”.
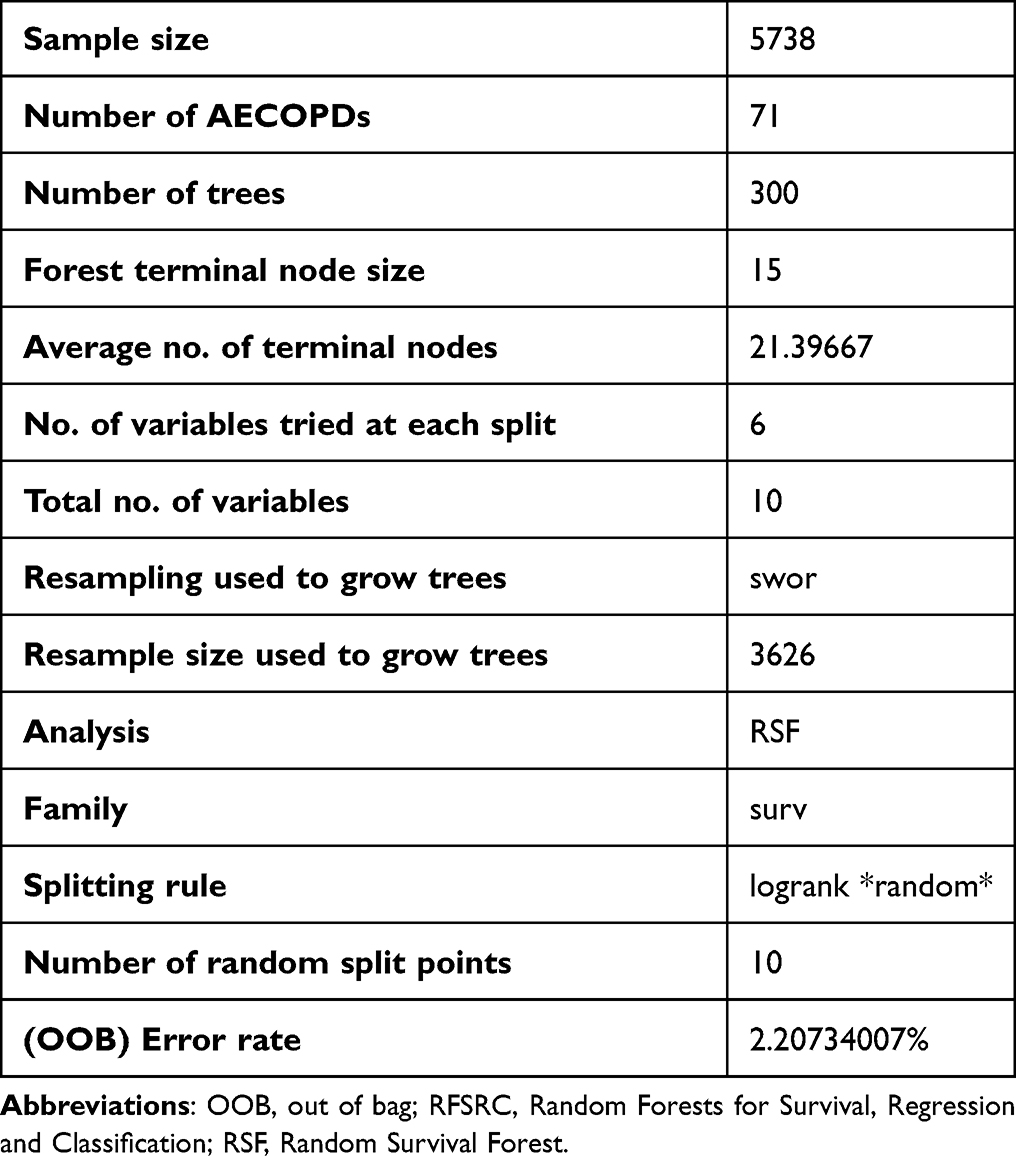 |
Table 4 RFSRC and Time-Dependent Dataset – Output Data |
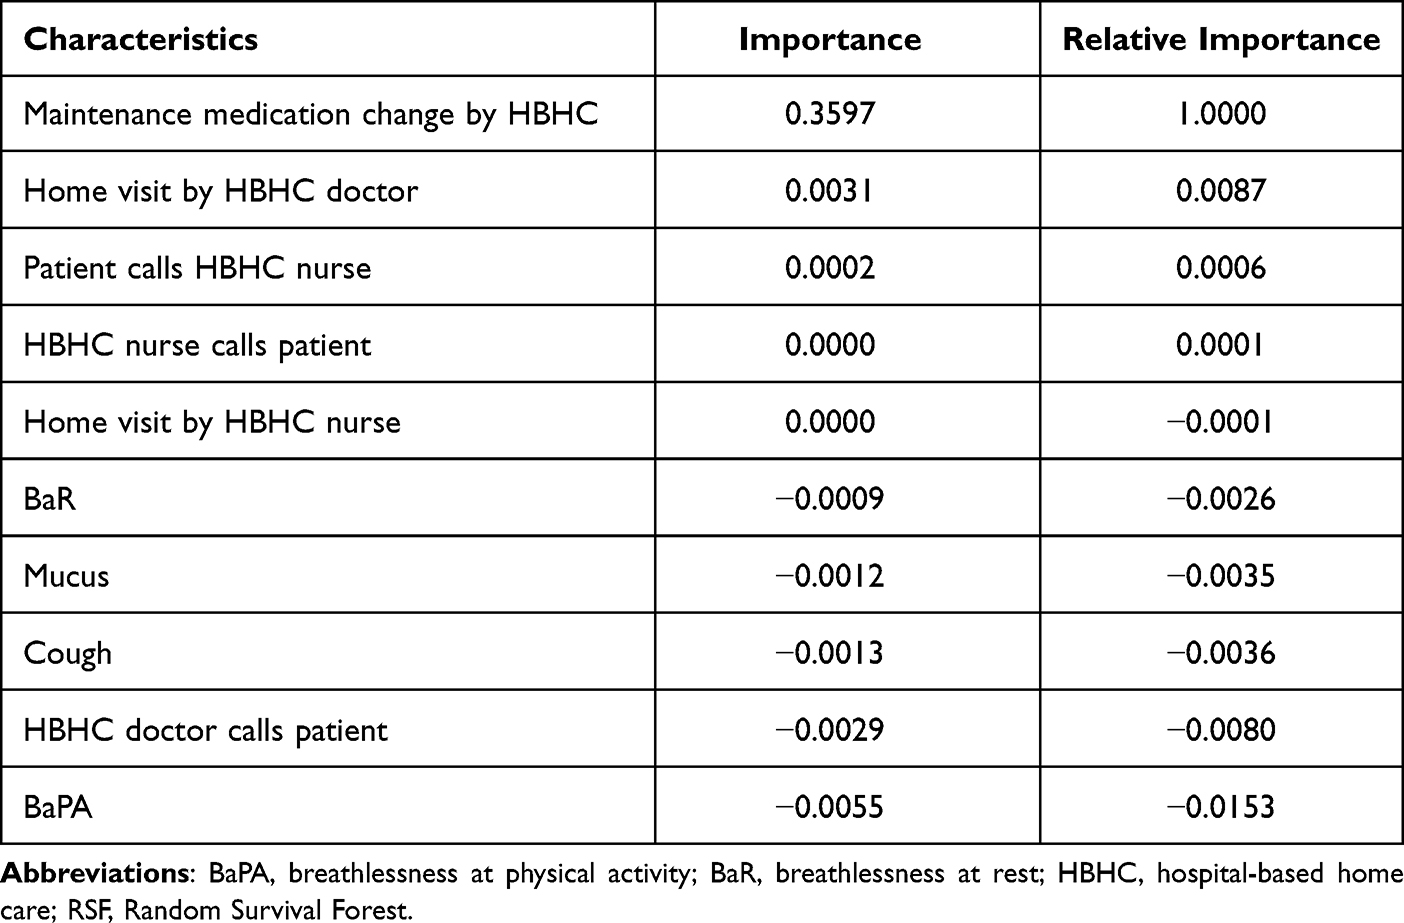 |
Table 5 The Results of the RSF Model |
We compared the cross validated (5-fold) C-index for both the COX model with 2-time indication and the RFSRC model with one-time indication. The plot showing the two cross-validated C-indexes is shown in Figure 3. Employing IBS, we also observed that the predictive power of the RSF model was higher than the COX model (see Figure 4).
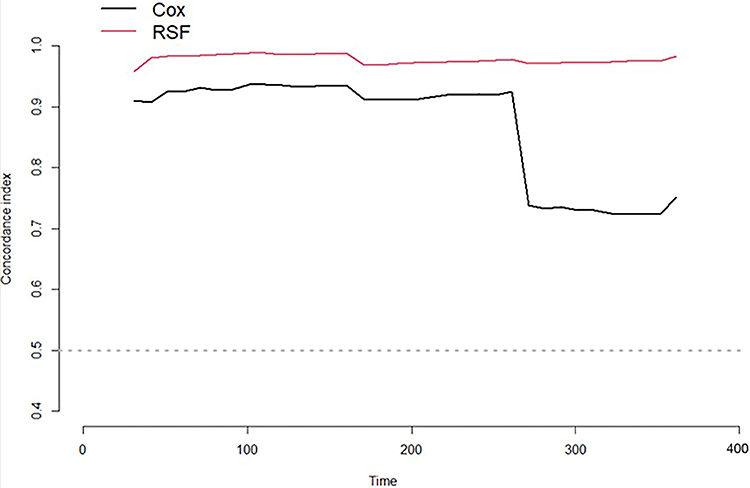 |
Figure 3 The two cross-validated C-indexes. Abbreviation: RSF, Random Survival Forest. |
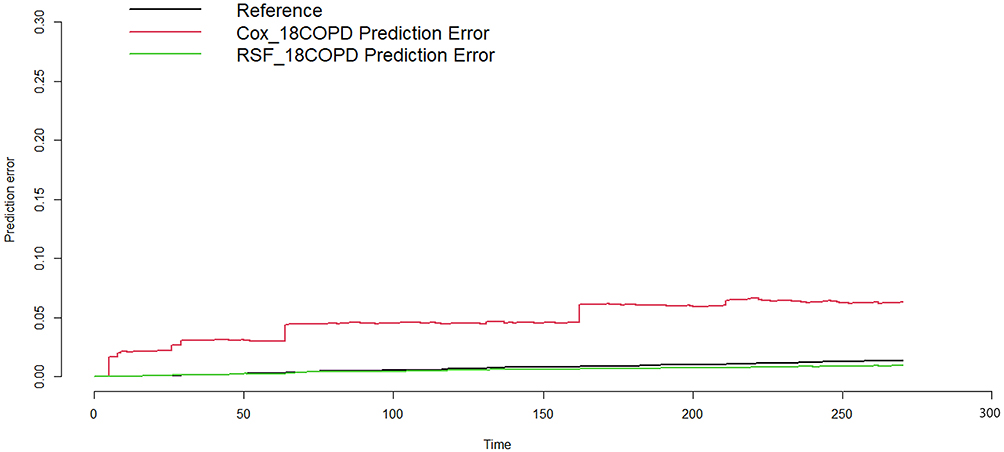 |
Figure 4 The predictive power of the models. Abbreviation: RSF, Random Survival Forest. |
Sample COPD: Time-Independent Synthetic Data and Trees-Based ML Algorithms
The purpose of these experiments was to predict the number of AECOPDs given a set of recorded values. Contrary to what happened with the survival models above, the P.R.N. attributes had a positive effect on the prediction models built with time-independent datasets. For this reason, we included them in the modelling described below. In this set of experiments, we used both the synthpop R package to create synthetic data and the Weka workbench to build predictive models. Both synthetic data and predictive algorithms were created.
First, we created a 10-cross-validated prediction model with the authentic data sample of 18 patients. The class is the number of AECOPDs so to frame the problem as regression. We evaluated the performance looking at correlation, RMSE and number of nodes for REPTree and correlation and RMSE for RF. We can see in Table 6 and the dataset “Authentic” that neither a simple tree algorithm like REPTree nor a more complex ensemble algorithm performed well on the authentic dataset, that is correlation was very low and RMSE was very high. This result confirmed that a very small dataset is indeed very challenging for ML. Naturally, lower values indicate a better fit of the model.
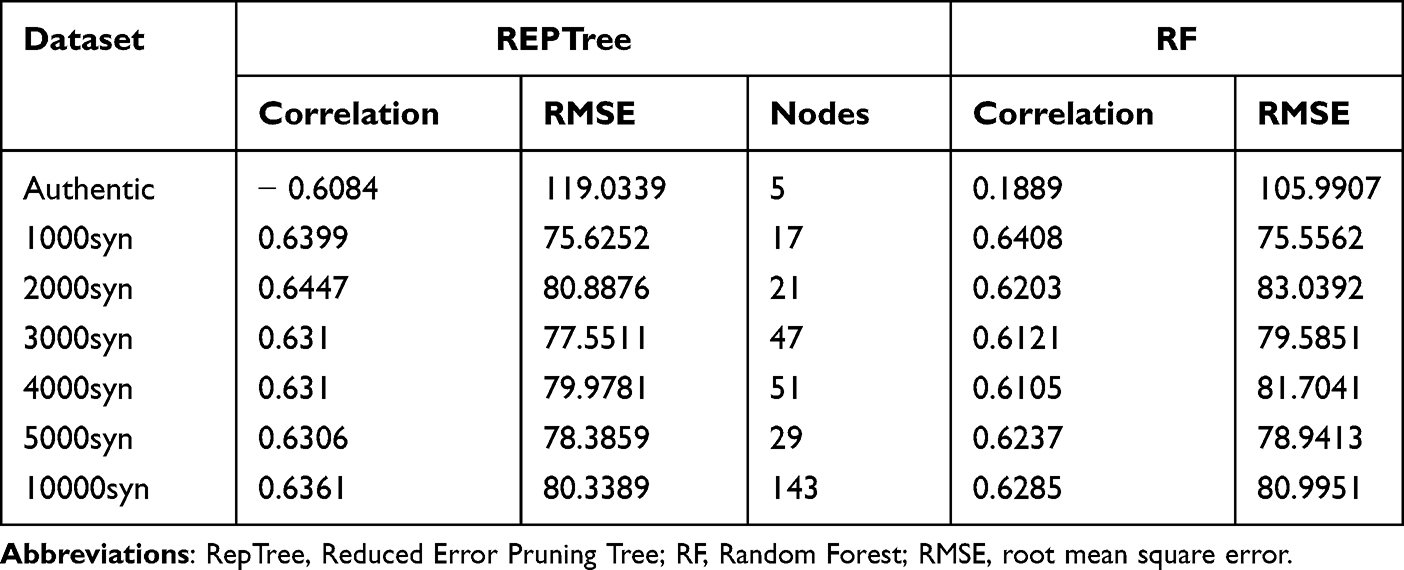 |
Table 6 10-Fold Cross-Validated Models |
For this type of data, there is a straightforward possibility to augment the dataset with synthetic data. To this end, we used the R package synthpop, which allowed to check the similarity of the synthetic data distribution compared to the observed, authentic distribution. We built 6 synthetic datasets increasing in size, thus, including 1000, 2000, 3000, 4000, 5000 and 10000 synthetic records. The distribution of the 1000 synthetic record dataset is shown in Figures 5A and B. For all variables, the authentic and the synthetic data demonstrated an excellent similarity as illustrated by the examples shown in Figures 5A and B.
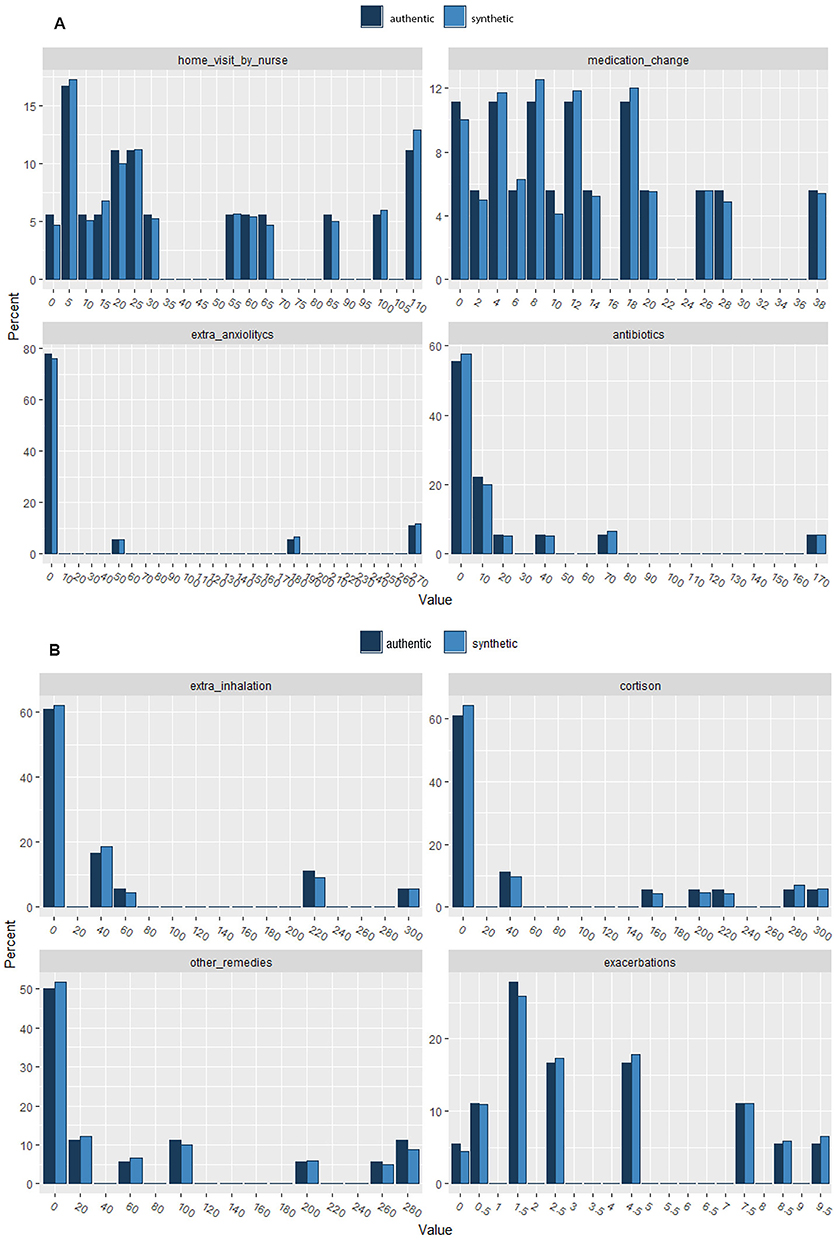 |
Figure 5 (A and B) The distribution of the 1000 synthetic record dataset. |
As shown in Table 6, the 1000 synthetic dataset had the best cross-validated performance, with the highest correlation score, the lowest RMSE, and the lowest number of trees (as for REPTree). Therefore, we took this model, and we tested it on authentic data. We observed that the validation on the authentic dataset was less optimistic than the validation achieved with the cross validated model, but still encouraging (Table 7). According to the tree constructed by the REPTree algorithm, the root node (ie, the node that evaluates the variable that best splits the data) was “Other remedies” (shortened “other”; see Figure 6).
 |
Table 7 The Performance of the 1000 Synthetic Dataset |
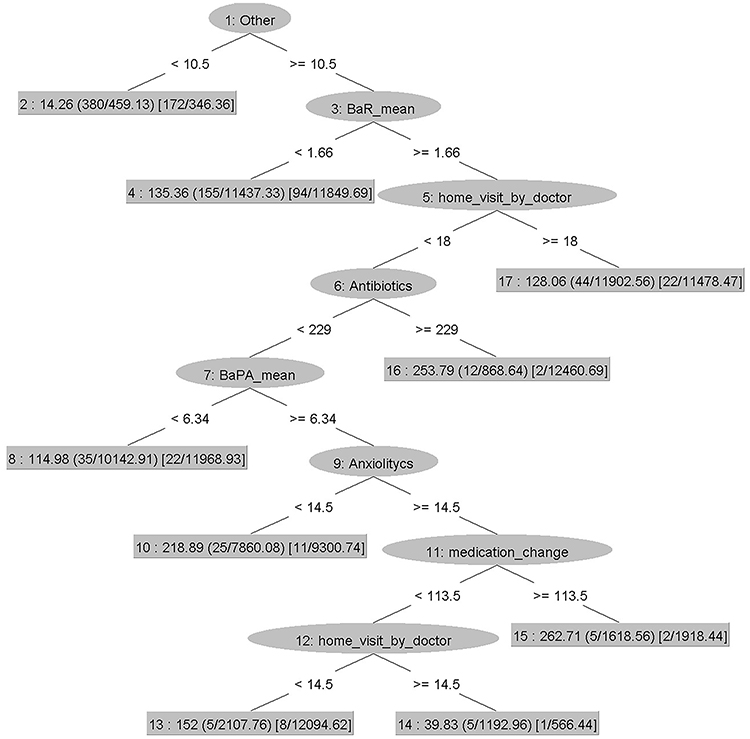 |
Figure 6 The REPTree algorithm. Abbreviations: BaR, breathlessness at rest; BaPA, breathlessness at physical activity; RepTree, Reduced Error Pruning Tree. |
Discussion
The focus on small data is dictated by privacy preserving legislation. Feng et al noticed that although several ML and AI methods have recently been applied, very few methods have significantly contributed to the clinical practice.45 Often, there is gap between research results and real-world applications. This drawback can be addressed by evaluating the generalisation power of ML models in real scenarios. Unfortunately, this is a difficult task, because the legal devices do not currently cover all the aspects implicit in data-driven applications as for data protection, private law liability and legal personhood.46 This means that if predictive models are built using private data, they cannot be used in real-world applications, so their potential remains unleashed. Since most clinical data have privacy restrictions, new approaches and new insights are required to overcome this loophole.
In these experiments, we therefore tried to apply the principle of data minimisation established by the EU General Data Protection Regulation (GDPR).47 The principle of data minimisation implies that only data necessary to fulfil a certain purpose should be used as stated in Article 5, 1c: “adequate, relevant and limited to what is necessary in relation to the purposes for which they are processed (‘data minimisation’)”.48 ML models normally require sizable data. However, to abide to the data minimisation principle, a new trend has emerged in AI and ML, namely the artificial-devised data minimisation.49,50 We observed, however, that there is not always the need to minimise data artificially, since many studies (especially in medicine) are focused and restricted to limited cohorts but produce indeed valuable data. Normally, this data is deemed to be too small to be used with ML. In this article, we present experiments to understand whether and to what extent it is possible to build ML models based on natural small data, thus avoiding artificial data minimisation.
The research question we wanted to answer with these experiments was: is it possible to build reliable ML models with small data to predict AECOPDs? The answer to this question is, yes, we can. However, as expected, modelling with small data is extremely challenging and extra care must be applied to avoid caveats and empirical limitations. The main caveats are underfitting and overfitting, which has to do with the lack of generalisation. Indeed, ML applied to small data sets, as in the present study, raises concerns about the generalisability to a larger population. We know that patients with COPD constitute a highly heterogenous group of people. Not only may the most common features of the COPD itself, that is airway obstruction, COPD symptoms and AECOPD frequency, vary a great deal between individuals, other phenotypic dimensions are created due to co-morbidities, fragility, etc. It should be pointed out that although the present study applied ML algorithms on a small population of patients with COPD, this population was highly homogenous, that is, exhibiting advanced COPD, great co-morbidity and fragility. Thus, the limitations of our study may be possible to compensate for by additional small datasets, employed for various ML approaches, on other phenotypes of COPD. Together, such experiments would make it possible to cover many patients with COPD, thus, collectively increasing the generalisability of the ML approaches.
To the best of our knowledge, the present ML study shows for the first time that the most important variable for an increased risk of future AECOPDs is the variable “maintenance medication changes by HBHC”, followed by “home visit by HBHC doctor”. These findings are clinically relevant as a sub-optimal maintenance treatment, requiring medication changes, puts the patient in risk for future AECOPDs. The importance of the variable “home visit by HBHC” is explained by the fact that the diagnosis AECOPD is made by the HBHC doctor, who also is responsible for starting the treatment for the AECOPD.
Conclusion and Future Work
Developing predictive algorithms with clinical reliability is a priority for the future development of telemonitoring of COPD. The possibility of creating predictive models based on small data would be a big asset for future health care, because often creating big datasets with patient data is prohibitive and expensive. Since many relatively small studies are carried out, it would be beneficial and profitable that these small data would be analysed not only qualitatively or manually or with traditional statistics but also with ML. Small data can be a trove of important information, but the challenge is to find methods that can generalise well on small datasets and make reliable predictions.
Data Sharing Statement
The data upon which this analysis was based are available from Professor Hans Lennart Persson in anonymised form, upon receipt of a reasonable request. Contact details are Professor Hans Lennart Persson, M.D., Ph.D., Department of Respiratory Medicine in Linköping, Linköping University, Linköping, Sweden. E-mail: [email protected]
Ethics Statement and Study Registration
All research participants gave written, informed consent and the study was approved by the Swedish Ethical Committee (dnr: 2020-03308; L. Lind) according to the guidelines of the Declaration of Helsinki and was registered at ISRCTN (ISRCTN34252610).
Acknowledgment
The authors would like to dedicate this work to the memory of a highly appreciated colleague, Dr Marina Santini. Thank you, Marina, for sharing your great knowledge and expertise.
Author Contributions
All authors made a significant contribution to the work reported, whether that is in the conception, study design, execution, acquisition of data, analysis, and interpretation, or in all these areas; took part in drafting, revising or critically reviewing the article; gave final approval of the version to be published; have agreed on the journal to which the article has been submitted; and agree to be accountable for all aspects of the work.
Funding
This work was supported by grants to P.K.J. and H.L.P from the Medical Research Council of Southeast Sweden (FORSS) (Grant No. FORSS-969385, FORSS-980999) and grants to L.L and H.L.P. from Sweden’s innovation agency Vinnova (Dnr: 2019-05402) in Swelife’s and Medtech4Health’s Collaborative projects for better health programme. The study sponsors had no role in study design, data collection, analysis, and interpretation; in the writing of the manuscript; nor in the decision to submit the manuscript for publication.
Disclosure
H.L.P. reports honoraria for advisory boards/lectures from AstraZeneca, Boehringer Ingelheim, GlaxoSmithCline, InterMune, Roche and the Swedish Medical Products Agency. The authors report no other conflicts of interest in this work.
References
1. Celli BR, Fabbri LM, Aaron SD, et al. An updated definition and severity classification of chronic obstructive pulmonary disease exacerbations: the Rome proposal. Am J Respir Crit Care Med. 2021;204(11):1251–1258. doi:10.1164/rccm.202108-1819PP
2. Metting E, Dassen L, Aardoom J, Versluis A, Chavannes N. Effectiveness of telemonitoring for respiratory and systemic symptoms of asthma and COPD: a narrative review. Life. 2021;11(11):1215. doi:10.3390/life11111215
3. Rassouli F, Pfister M, Widmer S, Baty F, Burger B, Brutsche MH. Telehealthcare for chronic obstructive pulmonary disease in Switzerland is feasible and appreciated by patients. Respiration. 2016;92(2):107–113. doi:10.1159/000448377
4. Rassouli F, Germann A, Baty F, et al. Telehealth mitigates COPD disease progression compared to standard of care: a randomized controlled crossover trial. J Intern Med. 2021;289(3):404–410. doi:10.1111/joim.13230
5. Persson HL, Lyth J, Wiréhn AB, Lind L. Elderly patients with COPD require more health care than elderly heart failure patients do in a hospital-based home care setting. Int J Chron Obstruct Pulmon Dis. 2019;2019(14):1569–1581. doi:10.2147/COPD.S207621
6. Persson HL, Lyth J, Lind L. The health diary telemonitoring and hospital-based home care improve quality of life among elderly multimorbid COPD and chronic heart failure subjects. Int J Chron Obstruct Pulmon Dis. 2020;2020(15):527–541. doi:10.2147/COPD.S236192
7. Lyth J, Lind L, Persson HL, Wiréhn AB. Can a telemonitoring system lead to decreased hospitalization in elderly patients? J Telemed Telecare. 2021;27(1):46–53. doi:10.1177/1357633X19858178
8. Saleh L, Mcheick H, Ajami H, Mili H, Dargham J. Comparison of machine learning algorithms to increase prediction accuracy of COPD domain. In
9. Sanchez-Morillo D, Fernandez-Granero MA, Leon-Jimenez A. Use of predictive algorithms in-home monitoring of chronic obstructive pulmonary disease and asthma: a systematic review. Chron Respir Dis. 2016;13(3):264–283. doi:10.1177/1479972316642365
10. Guerra B, Gaveikaite V, Bianchi C, Puhan MA. Prediction models for exacerbations in patients with COPD. Eur Respir Rev. 2017;26(143):160061. doi:10.1183/16000617.0061-2016
11. Singh D, Hurst JR, Martinez FJ, et al. Predictive modeling of COPD exacerbations rates using baseline risk factors. Adv Respir Dis. 2022;16:1–15. doi:10.1177/17534666221107314
12. Marques A, Souto-Miranda S, Machado A, et al. COPD profiles and treatable traits using minimal resources: identification, decision tree and stability over time. Respir Res. 2022;23(1):30. doi:10.1186/s12931-022-01954-6
13. Zeng S, Arjomandi M, Tong Y, Liao ZC, Luo G. Developing a machine learning model to predict severe chronic obstructive pulmonary disease exacerbations: retrospective cohort study. J Med Internet Res. 2022;24(1):e28953. doi:10.2196/28953
14. Chmiel FP, Burns DK, Pickering JB, Blythin A, Wilkinson T, Boniface MJ. Prediction of chronic obstructive pulmonary disease exacerbation events by using patient self-reported data in a digital health app: statistical evaluation and machine learning approach. JMIR Med Inform. 2022;10(3):e26499. doi:10.2196/26499
15. Ställberg B, Lisspers K, Larsson K, et al. Predicting Hospitalization Due to COPD Exacerbations in Swedish Primary Care Patients Using Machine Learning – based on the Arctic Study. Int J Chron Obstruct Pulmon Dis. 2021;16:677–688. doi:10.2147/COPD.S293099
16. Joshe MD, Emon NH, Islam M, Ria NJ, Masum AKM, Noori SRH. Symptoms analysis based chronic obstructive pulmonary disease prediction in Bangladesh using machine learning approach. In
17. Hussain A, Choi H, Kim H, Aich S, Saqlain M, Kim H. Forecast the exacerbation in patients of chronic obstructive pulmonary disease with clinical indicators using machine learning techniques. Diagnostics. 2021;11(5):829. doi:10.3390/diagnostics11050829
18. Wu C, Li G, Huang C, et al. Acute exacerbation of a chronic obstructive pulmonary disease prediction system using wearable device data, machine learning, and deep learning: development and cohort study. JMIR Mhealth Uhealth. 2021;9(5):e22591. doi:10.2196/22591
19. Peng J, Chen C, Zhou M, Xie X, Zhou Y, Luo C. A machine-learning approach to forecast aggravation risk in patients with acute exacerbation of chronic obstructive pulmonary disease with clinical indicators. Sci Rep. 2020;10(1):3118. doi:10.1038/s41598-020-60042-1
20. Ma X, Wu Y, Zhang L, et al. Comparison and development of machine learning tools for the prediction of chronic obstructive pulmonary disease in the Chinese population. J Transl Med. 2020;18(1):146. doi:10.1186/s12967-020-02312-0
21. Wang C, Chen X, Du L, Zhan Q, Yang T, Fang Z. Comparison of machine learning algorithms for the identification of acute exacerbations in chronic obstructive pulmonary disease. Comput Methods Programs Biomed. 2020;188:105267. doi:10.1016/j.cmpb.2019.105267
22. Orchard P, Agakova A, Pinnock H, et al. Improving prediction of risk of hospital admission in chronic obstructive pulmonary disease: application of machine learning to telemonitoring data. J Med Internet Res. 2018;20(9):e263. doi:10.2196/jmir.9227
23. Fernandez-Granero MA, Sanchez-Morillo D, Lopez-Gordo MA, Leon A. A machine learning approach to prediction of exacerbations of chronic obstructive pulmonary disease. In
24. Fernandez-Granero MA, Sanchez-Morillo D, Leon-Jimenez A. Computerised analysis of telemonitored respiratory sounds for predicting acute exacerbations of COPD. Sensors. 2015;15(10):26978–26996. doi:10.3390/s151026978
25. Leidy NK, Malley KG, Steenrod AW, et al. Insight into best variables four COPD case identification: and random forests analysis. Chronic Obstr Pulm Dis. 2016;3(1):406–418. doi:10.15326/jcopdf.3.1.2015.0144
26. Mohktar MS, Redmond SJ, Antoniades NC, et al. Predicting the risk of exacerbation in patients with chronic obstructive pulmonary disease using home telehealth measurement data. Artif Intell Med. 2015;63(1):51–59. doi:10.1016/j.artmed.2014.12.003
27. Amalakuhan B, Kiljanek L, Parvathaneni A, Hester M, Cheriyath P, Fischman D. A prediction model for COPD readmissions: catching up, catching our breath, and improving a national problem. J Community Hosp Intern Med Perspect. 2012;2(1). doi:10.3402/jchimp.v2i1.9915
28. Ooka T, Johno H, Nakamoto K, Yoda Y, Yokomichi H, Yamagata Z. Random forest approach for determining risk prediction and predictive factors of type 2 diabetes: large-scale health check-up data in Japan. BMJ Nutr Prev Health. 2021;4(1):140–148. doi:10.1136/bmjnph-2020-000200
29. Bohannan ZS, Coffman F, Mitrofanova A. Random survival forest model identifies novel biomarkers of event-free survival in high-risk pediatric acute lymphoblastic leukemia. Comput Struct Biotechnol J. 2022;20:583–597. doi:10.1016/j.csbj.2022.01.003
30. Qiu X, Gao J, Yang J, et al. A comparison study of machine learning (random survival forest) and classic statistic (cox proportional hazards) for predicting progression in high-grade glioma after proton and carbon ion radiotherapy. Front Oncol. 2020;10. doi:10.3389/fonc.2020.551420
31. Therneau TM. A Package for Survival Analysis in R; 2023. Available from: https://cran.r-project.org/web/packages/survival/vignettes/survival.pdf.
32. Statistical tools for high-throughput data analysis (STHDA). Cox model assumptions; 2023. Available from: http://www.sthda.com/english/wiki/cox-model-assumptions.
33. Statistical tools for high-throughput data analysis (STHDA). Cox proportional- hazards model; 2023. Available from: http://www.sthda.com/english/wiki/cox-proportional-hazards-model.
34. Datacamp. Survival analysis in R for beginners. Tutorial; 2023. Available from: https://www.datacamp.com/tutorial/survival-analysis-R.
35. Statistics How To. C-statistic: definition, examples, weighting and significance; 2023. Available from: https://www.statisticshowto.com/c-statistic/.
36. How to interpret the output for calculating concordance index (c-index); 2023. Available from: https://stats.stackexchange.com/questions/29815/how-to-interpret-The-output-for-calculating-concordance-index-c-index.
37. Scribbr. Akaike information criterion. When & how to use it (example); 2023. Available from: https://www.scribbr.com/statistics/akaike-information-criterion/.
38. Brier score and integrated brier score; 2022. Available from: https://square.github.io/pysurvival/metrics/brier_score.html.
39. Cross Validated. Interpreting an integrated brier score that is above 0.25; 2022. Available from: https://stats.stackexchange.com/questions/498655/interpreting-an-integrated-brier-score-that-is-above-0-25.
40. Mohamed WNHW, Salleh MNM, Omar AH. A comparative study of reduced error pruning method in decision tree algorithms. In
41. Understanding random forest; 2023. Available from: https://www.analyticsvidhya.com/blog/2021/06/understanding-random-forest/.
42. Decision trees explained; 2023. Available from: https://towardsdatascience.com/decision-trees-explained-3ec41632ceb6.
43. Stack overflow. What does it mean if an RMSE has a value far beyond 1; 2023. Available from: https://stackoverflow.com/questions/62122206/what-does-it-mean-if-an-rmse-has-a-value-far-beyond-1.
44. Nowok B, Raab GM, Dibben C. Synthpop: bespoke creation of synthetic data in R. J Stat Softw. 2016;74(11):1–26. doi:10.18637/jss.v074.i11
45. Feng Y, Wang Y, Zeng C, Mao H. Artificial intelligence and machine learning in chronic airway diseases: focus on asthma and chronic obstructive pulmonary disease. Int J Med Sci. 2021;18(13):2871–2889. doi:10.7150/ijms.58191
46. Hildebrandt M. Law for Computer Scientists and Other Folk.
47. Data protection in the EU. The General Data Protection Regulation (GDPR), the data protection law enforcement directive and other rules concerning the protection of personal data; 2023. Available from: https://commission.europa.eu/law/law-topic/data-protection/data-protection-eu_en.
48. Consolidated text: regulation (EU) 2016/679 of the European Parliament and of the council of 27 April 2016 on the protection of natural persons with regard to the processing of personal data and on the free movement of such data, and repealing directive 95/46/EC (general data protection regulation; 2023. Available from: https://eur-lex.europa.eu/eli/reg/2016/679/2016-05-04.
49. Goldsteen A, Ezov G, Shmelkin R, Moffie M, Farkash A. Data minimization for GDPR compliance in machine learning models. AI Ethics. 2021;221(2):477–491. doi:10.1007/s43681-021-00095-8
50. Shanmugam D, Diaz F, Shabanian S, Finck M, Biega A. Learning to limit data collection via scaling laws: a computational interpretation for the legal principle of data minimization. Facct. 2022;839–849. doi:10.1145/3531146.3533148
 © 2023 The Author(s). This work is published and licensed by Dove Medical Press Limited. The
full terms of this license are available at https://www.dovepress.com/terms
and incorporate the Creative Commons Attribution
- Non Commercial (unported, 3.0) License.
By accessing the work you hereby accept the Terms. Non-commercial uses of the work are permitted
without any further permission from Dove Medical Press Limited, provided the work is properly
attributed. For permission for commercial use of this work, please see paragraphs 4.2 and 5 of our Terms.
© 2023 The Author(s). This work is published and licensed by Dove Medical Press Limited. The
full terms of this license are available at https://www.dovepress.com/terms
and incorporate the Creative Commons Attribution
- Non Commercial (unported, 3.0) License.
By accessing the work you hereby accept the Terms. Non-commercial uses of the work are permitted
without any further permission from Dove Medical Press Limited, provided the work is properly
attributed. For permission for commercial use of this work, please see paragraphs 4.2 and 5 of our Terms.