")
Back to Journals » Clinical Epidemiology » Volume 15
Uneven Between-Hospital Distribution of Patient-Related Risk Factors for Adverse Outcomes of Colorectal Cancer Treatment: A Population-Based Register Study
Authors Rattenborg S , Möller S , Frostberg E , Rahr HB
Received 16 April 2023
Accepted for publication 4 July 2023
Published 22 July 2023 Volume 2023:15 Pages 867—880
DOI https://doi.org/10.2147/CLEP.S411392
Checked for plagiarism Yes
Review by Single anonymous peer review
Peer reviewer comments 3
Editor who approved publication: Professor Vera Ehrenstein
Søren Rattenborg,1,2 Sören Möller,3,4 Erik Frostberg,1,2 Hans B Rahr1,2,5
1Department of Surgery, Vejle Hospital, University Hospital of Southern Denmark, Vejle, Denmark; 2Colorectal Cancer Center South, Vejle, Denmark; 3Open Patient Data Exploratory Network, Odense University Hospital, Odense, Denmark; 4Department of Clinical Research, University of Southern Denmark, Odense, Denmark; 5Institute of Regional Health Research, University of Southern Denmark, Odense, Denmark
Correspondence: Søren Rattenborg, Department of Surgery, Vejle Hospital, Beriderbakken 4, Vejle, 7100, Denmark, Tel +45-79405000, Email [email protected]
Purpose: The purpose of this study was to elucidate between-hospital variation in the prevalence at the time of diagnosis of patient-related risk factors for adverse outcomes of colorectal cancer (CRC) treatment.
Patients and Methods: A register-based national cohort of 44,471 patients diagnosed with CRC and registered in the Danish Colorectal Cancer Group database in 2009– 2018 was included in the study. Patient-related risk factors present at diagnosis were collected from national Danish registers within the areas of demography, lifestyle factors, comorbidity, participation in screening, disease-related factors and socioeconomic factors. Prediction models of short-term postoperative outcomes and mortality were modelled to examine the potential aggregated impact of patient-related risk factors on outcomes, and variations between hospitals were examined.
Results: The most conspicuous variations found were for old age (75+ years), ranging from 31% (95% confidence interval (95% CI): 29– 33%) to 46% (95% CI: 43– 48%), Union for International Cancer Control Stage I ranging from 12% (95% CI: 10– 14%) to 21% (95% CI: 19– 22%), Stage IV ranging from 23% (95% CI: 21– 25%) to 35% (95% CI: 34– 37%) and American Society of Anesthesiologists score ≥III ranging from 18% (95% CI: 16– 19%) to 40% (95% CI: 37– 43%). Clinically significant variations were found in predicted probability of 30-day surgical complications which varied from 17% (95% CI: 16– 17%) to 23% (95% CI: 22– 23%) and 90-day postoperative mortality which varied between 3.2% (95% CI: 3– 3.4%) and 5.5% (95% CI: 4.9– 6%).
Conclusion: Marked variation in the prevalence of patient-related risk factors for adverse outcomes of colorectal cancer treatment exists between hospitals in Denmark. It seems reasonable to take these differences into account when comparing outcomes between hospitals.
Keywords: colorectal cancer, morbidity, mortality, risk factors, surgery
Introduction
Colorectal cancer (CRC) is among the most common malignant diseases, with more than 4000 patients diagnosed each year in Denmark.1 In recent years treatment and outcomes have improved vastly, but CRC treatment still entails substantial morbidity and mortality.2 In Denmark as well as in other countries, national cancer databases exist and annual reports are published to inform the professional community and the public about treatment statistics and outcomes.3–6 In some countries, these reports include outcome data on a hospital level, which allows for comparisons between individual hospitals as well as with present standards for selected indicator variables. Any deviations may be perceived by the public and decision-makers as credible expressions of the clinical quality delivered by the individual hospitals. However, this assumption may not be valid without adjustment for variation between hospitals in commonly known patient-related risk factors like demographics (eg age and sex), lifestyle (eg alcohol consumption and smoking), performance status, disease-related factors (eg stage of disease), comorbidity, and socioeconomic factors (eg educational level).7–11 If these patient-related risk factors are not equally distributed among hospitals, any comparison of the hospitals’ outcome data may potentially be biased. Previous studies on between-hospital variations in high-income countries with free access to health care have mainly compared hospitals by patient volume. Conflicting results were found, however, between patient volumes and both short- and long-term mortality,12–14 and all these studies lacked the ability to detect variation between hospitals with comparable patient volumes.
This study aimed to elucidate between-hospital variation in the prevalence of patient-related risk factors at the time of diagnosis and their association with adverse outcomes of colorectal cancer treatment by studying a nationwide cohort of colorectal cancer patients.
Materials and Methods
This study is a register-based cohort study using prospectively collected data in national Danish registers. The study population are all patients ≥18 years old diagnosed with a first-time CRC and registered in the national bowel cancer database between 1 January 2009 and 31 December 2018. This period was chosen in order to examine long-term outcomes of the population in further studies. Furthermore, the national treatment guidelines were rather consistent in this period,15 and the national bowel cancer screening programme was implemented halfway through it (in 2014). Patients were excluded if their date of surgery for CRC was more than one month before, or more than one year after, diagnosis, or if they had died or emigrated before diagnosis as shown in Figure 1.
 |
Figure 1 Definition of cohort for analyses and coupling of data. |
Data Sources and Linkage
The study population and its lifestyle- and disease-related data were retrieved from the national bowel cancer database, which is managed by the Danish Colorectal Cancer Group (DCCG) and hosted by the Danish Clinical Quality Program. It holds lifestyle-, disease-, and treatment-related data on virtually all (>96%) incident CRC patients diagnosed in Denmark.16 Surgeons enter data prospectively in the database, which is validated against the National Patient Register and the National Pathology Database.16 Data on participation in CRC screening were extracted from the National Danish Colorectal Cancer Screening Database (DCCSD).17 Data on comorbidity and socioeconomics were retrieved from the Danish Health Data Authority and Statistics Denmark.18 The common key to all these data is the unique personal registration number (CPR-number), assigned to all persons with permanent residency in Denmark.18 The data linkage is shown in brief in Figure 1.
Demographic Variables
The age and gender of the population were derived from the personal registration number. Age was reported on a categorical scale (≤49, 50–64, 65–74, 75–84 and ≥85 years). Performance status at diagnosis was found in the DCCG database, including both American Society of Anesthesiologists (ASA) score I–V,19 and the World Health Organization (WHO) performance status (PS) 0–4.20 The PS, however, was only available from 2014 onwards.
Lifestyle
Lifestyle data at the time of diagnosis were collected from the DCCG database and included alcohol consumption (≤14 and >14 units of 12 g pure ethanol per week), smoking status (never, ex-smoker and current smoker) and body mass index (BMI). Patients were classified as underweight (<18.5 kg/m2), normal weight (18.6–24.8 kg/m2), overweight (24.9–29.9 kg/m2), and obese (≥30 kg/m2) according to the WHO BMI classification.21
Comorbidity
The comorbidity score used in this study was derived from the Charlson comorbidity score,22 but with changed weights as proposed by Quan et al23 and categorized as 0, 1, 2, 3+. After exclusion of International Classification of Disease 10th version (ICD10) codes for CRC, binary variables for the presence of comorbidity were created from ICD10 codes for diagnosis, and from anatomical therapeutic chemical classification system (ATC) codes for drugs within the following somatic domains: cardiovascular disease, chronic pulmonary disease, diabetes, dementia, liver disease, kidney disease, chronic nerve disease, other cancer or tumors, and connective tissue disease. In addition, the following psychiatric domains: affective disorders, schizophrenic spectral disease, disorder of adult personality and behavior and disorders due to psychoactive substance abuse were included, as inspired by recent studies.9,24,25 ICD10 and ATC codes up to 10 years prior to diagnosis were included. A thorough overview of these domains, corresponding ICD-10/ATC codes and references, are provided in Supplementary Table 1.
Screening
Information on participation (at least once) in the CRC screening program prior to diagnosis was collected from DCCSD and categorized as yes, no (but invited to participate) and outside target group. The latter includes patients not registered in DCCSD. Main reasons for this would be patients younger than 50 years or older than 74 years, patients diagnosed before the screening program was introduced in 2014, or patient diagnosed less than 4½ months after invitation to first round of screening.
Cancer Related Factors
Locations of the primary tumor were aggregated to colon or rectum. The Union for International Cancer Control (UICC) Stage (I–IV) was available in the DCCG database (based on 8th edition of the American Joint Committee on Cancer TNM classification).26
Socioeconomic Factors
Socioeconomic variables included were educational level, annual family income and cohabitation status prior to diagnosis. The educational level was categorized according to International Standard of Classification (ISCED),27 and further aggregated to “short” (up to lower secondary level of education, ISCED 0–2), “medium” (from upper secondary to short cycle tertiary ISCED 3–5) and “long” (from bachelor to doctoral or equivalent, ISCED 6–8). The annual equated disposable income in Danish kroner (DKK) of the household before diagnosis was reported as median and quartiles. The equated income takes inflation into account, is adjusted to 2013 levels and scaled with size of family. It is merely a standardized measure of affluence and should not be compared with non-equated income.28 Cohabitation was categorized as living alone, cohabiting (living together or married) or unknown.
Postoperative Outcome Variables
Postoperative medical and surgical complications within 30 days, and death within 90 days, after surgery were derived from the DCCG database. Patients who had not undergone surgery, had a local resection (eg polypectomy) or had undergone an emergency surgery as definitive procedure were excluded from these analyses. Medical and surgical complications included all grades as classified by Dindo et al.29
Ethics and Permissions
Extraction of the study population from the DCCG database was approved by DCCG and Danish Clinical Quality Program (DCCG-2018-03-08a), and data management by the Danish Data Protection Agency through the local authorities (jr. nr. 18/15252). All data linkage was performed in accordance with the Danish Act on Processing of Personal Data with subsequent amendments and European regulations. This project was approved by The National Danish Health Authority and Statistics Denmark. No other approvals were required, in this register study under Danish law.30
Statistical Methods
Characteristics of the study population were presented by descriptive statistics. Between-hospital variation in distribution of risk factors was analysed by descriptive statistics and a table of frequencies and proportions is provided in Supplementary Table 2. Logit-transformed 95% confidence intervals (95% CI) were estimated when comparing proportions between hospitals.
In order to examine risk factors associated with surgical outcome measures, we performed multivariable logistic regressions of the surgical outcome measures including all aforementioned risk factors and year of diagnosis, but not treating hospital. Based on these regressions, the predicted probability of an adverse postoperative outcome (30-day complications, 90-day mortality) was estimated and depicted graphically along with the observed values for each hospital.
Missing data were reported in overview of the whole cohort and included in logistic regressions as separate categories, but excluded from formal comparisons. Imputation was not performed. Data was stored and managed on the secure servers of Statistics Denmark, using Stata IC/17 (StataCorp LLC, 4905 Lakeway Drive, TX, USA). Data were only extracted after anonymization.
Results
Five hundred and forty-one patients were excluded from the analyses (Figure 1). In total, 44,471 patients were included in the study.
An overview of the study population is seen in Table 1. There was a slight overweight of males (54%), and the median age overall was 71 (range 18–106) years. The majority (70%) of the patients had ASA score I–II, and the majority (72%) had a Charlson score of zero prior to the diagnosis. One-third of the patients were non-smokers, one-third ex-smokers and one-sixth were active smokers. Three out of four consumed less than 15 units of alcohol per week. Almost half of the patients were overweight or obese. Most patients had a short or medium educational level, and 17% had a long educational level. The median equated disposable household income was approximately 196,000 DKK, which equals approximately EUR 26,000 or USD 29,000 (with interquartile range of 157269–270125 DKK). In this cohort, 77% were not eligible for participation in the CRC screening program. Of those eligible, 72% participated in screening. A majority (59%) of the patients had a cohabitant at the time of diagnosis. See Table 1 for more details.
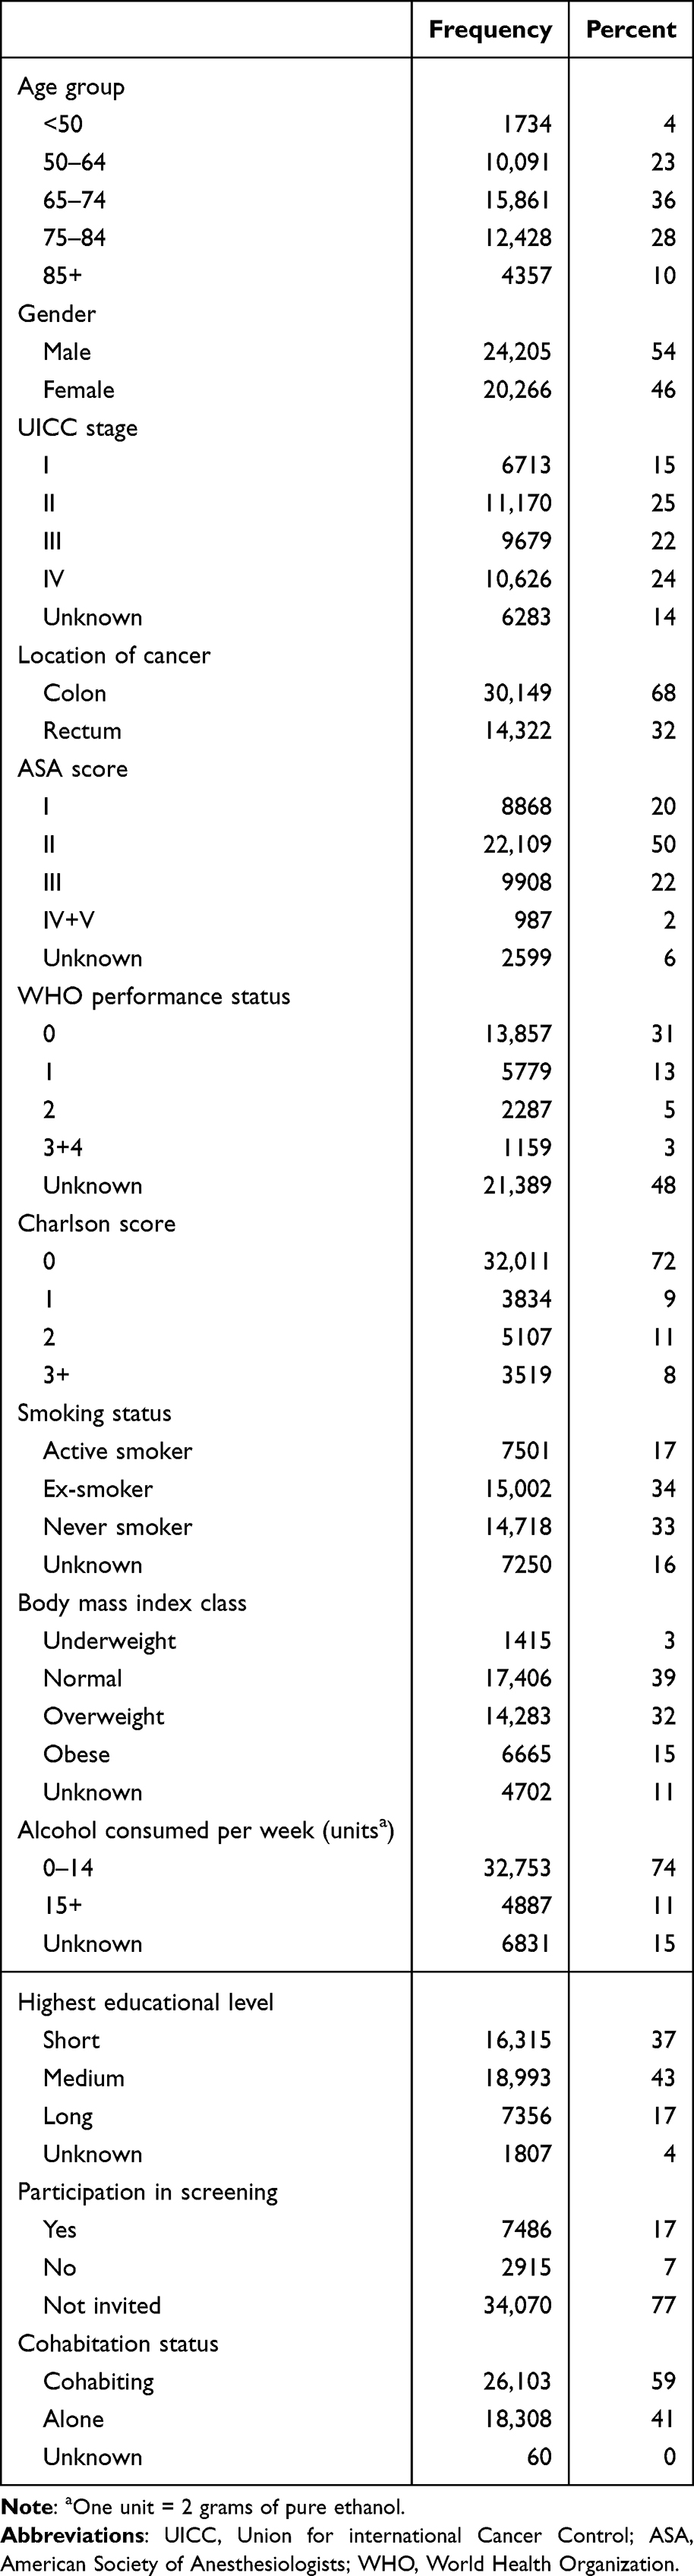 |
Table 1 Characteristics of 44,471 Patients with Colorectal Cancer Diagnosed in the Years 2009–2018 in Denmark |
Between-Hospital Variation in Prevalence of Risk Factors
The distribution of risk factors between hospitals is shown in Figures 2 and 3, with details in Supplementary Table 2. The main findings are summarized below.
 |
Figure 2 Distribution of demographics, performance score, lifestyle, participation in screening, socioeconomic and disease-related factors in a Danish cohort of patients with colorectal cancer. Hospitals ordered by patient volume, from low (left) to high volume (right). |
 |
Figure 3 Prevalence of somatic and psychiatric comorbidities in a Danish cohort of colorectal cancer patients. Hospitals ordered by patient volume, from low (left) to high volume (right). |
Demographic and Performance Variables
The distribution of demographic variables between hospitals is shown in Figure 2. The most marked variations were age ≥75 years ranging from 31% (95% CI: 29–33%) to 46% (95% CI: 43–48%), ASA III+ ranging from 18% (95% CI: 16–19%) to 40% (95% CI: 37–43%) and PS 2+ ranging from 8% (95% CI: 7–10%) to 20% (95% CI: 18–22%).
Lifestyle Variables and Participation in Screening
The distribution of lifestyle factors and participation in CRC screening between hospitals is shown in Figure 2. The most marked variations were in prevalence of heavy drinkers ranging from 4% (95% CI: 3–6%) to 20% (95% CI: 19–22%) and in patients who did not participate in CRC screening despite invitation ranging from 21% (95% CI: 18–25%) to 39% (95% CI: 35–43%).
Socioeconomic Variables
The distribution of socioeconomic variables between hospitals is seen from Figure 2. The most marked variations found were short education ranging from 26% (95% CI: 25–28%) to 50% (95% CI: 47–53%), lowest quartile of income ranging from 15% (95% CI: 14–16%) to 37% (95% CI: 35–40%) and patients living alone ranging from 36% (95% CI: 34–38%) to 54% (95% CI: 53–56%). Short education and low household income were more prevalent in more rural areas of Denmark (not shown).
Disease-Related Variables by Hospitals
The distribution of tumor location and stage between hospitals is seen in Figure 2. The most marked variations were in proportion of Stage I ranging from 12% (95% CI: 10–14%) to 21% (95% CI: 19–22%) and IV ranging from 23% (95% CI: 21–25%) to 35% (95% CI: 34–37%).
Comorbidity Variables
The prevalences of all the comorbidities are shown in Figure 3. Overall, the variations between hospitals in somatic comorbidities were small or with low absolute numbers (dementia, chronic nerve disease, liver and kidney disease). The most marked variation in psychiatric comorbidities was substance abuse disorder ranging from 1% (95% CI: 1–2%) to 10% (95% CI: 9–11%), with the highest prevalence in the capital area of Denmark (not shown).
Multiple Logistic Regression Analyses of Short-Term Postoperative Outcomes
Multiple logistic regressions of surgical and medical complications and postoperative mortality within 90 days were calculated and the multiple logistic regressions are seen in Table 2. We applied the Hosmer-Lemeshow Goodness of Fit test with twenty groups, giving high associated p-values for all three outcomes, indicating acceptable model fit. As judged by the odds ratios and corresponding confidence intervals the most pronounced associated risk factors were: i) for medical complications: Age 75+ years, male gender, Stage IV, ASA score II+, PS 2+, chronic pulmonary disease and kidney disease; ii) for surgical complications: male gender, location in rectum, ASA score II+, active smoking and obesity; iii) for mortality within 90 days after surgery: Age 75+ years, male gender, Stage IV, ASA II+, PS 1+, liver disease, schizophrenic spectrum disease and underweight. Being overweight or obese was associated with a lower 90-day postoperative mortality and was underrepresented in the group with UICC Stage IV (not shown).
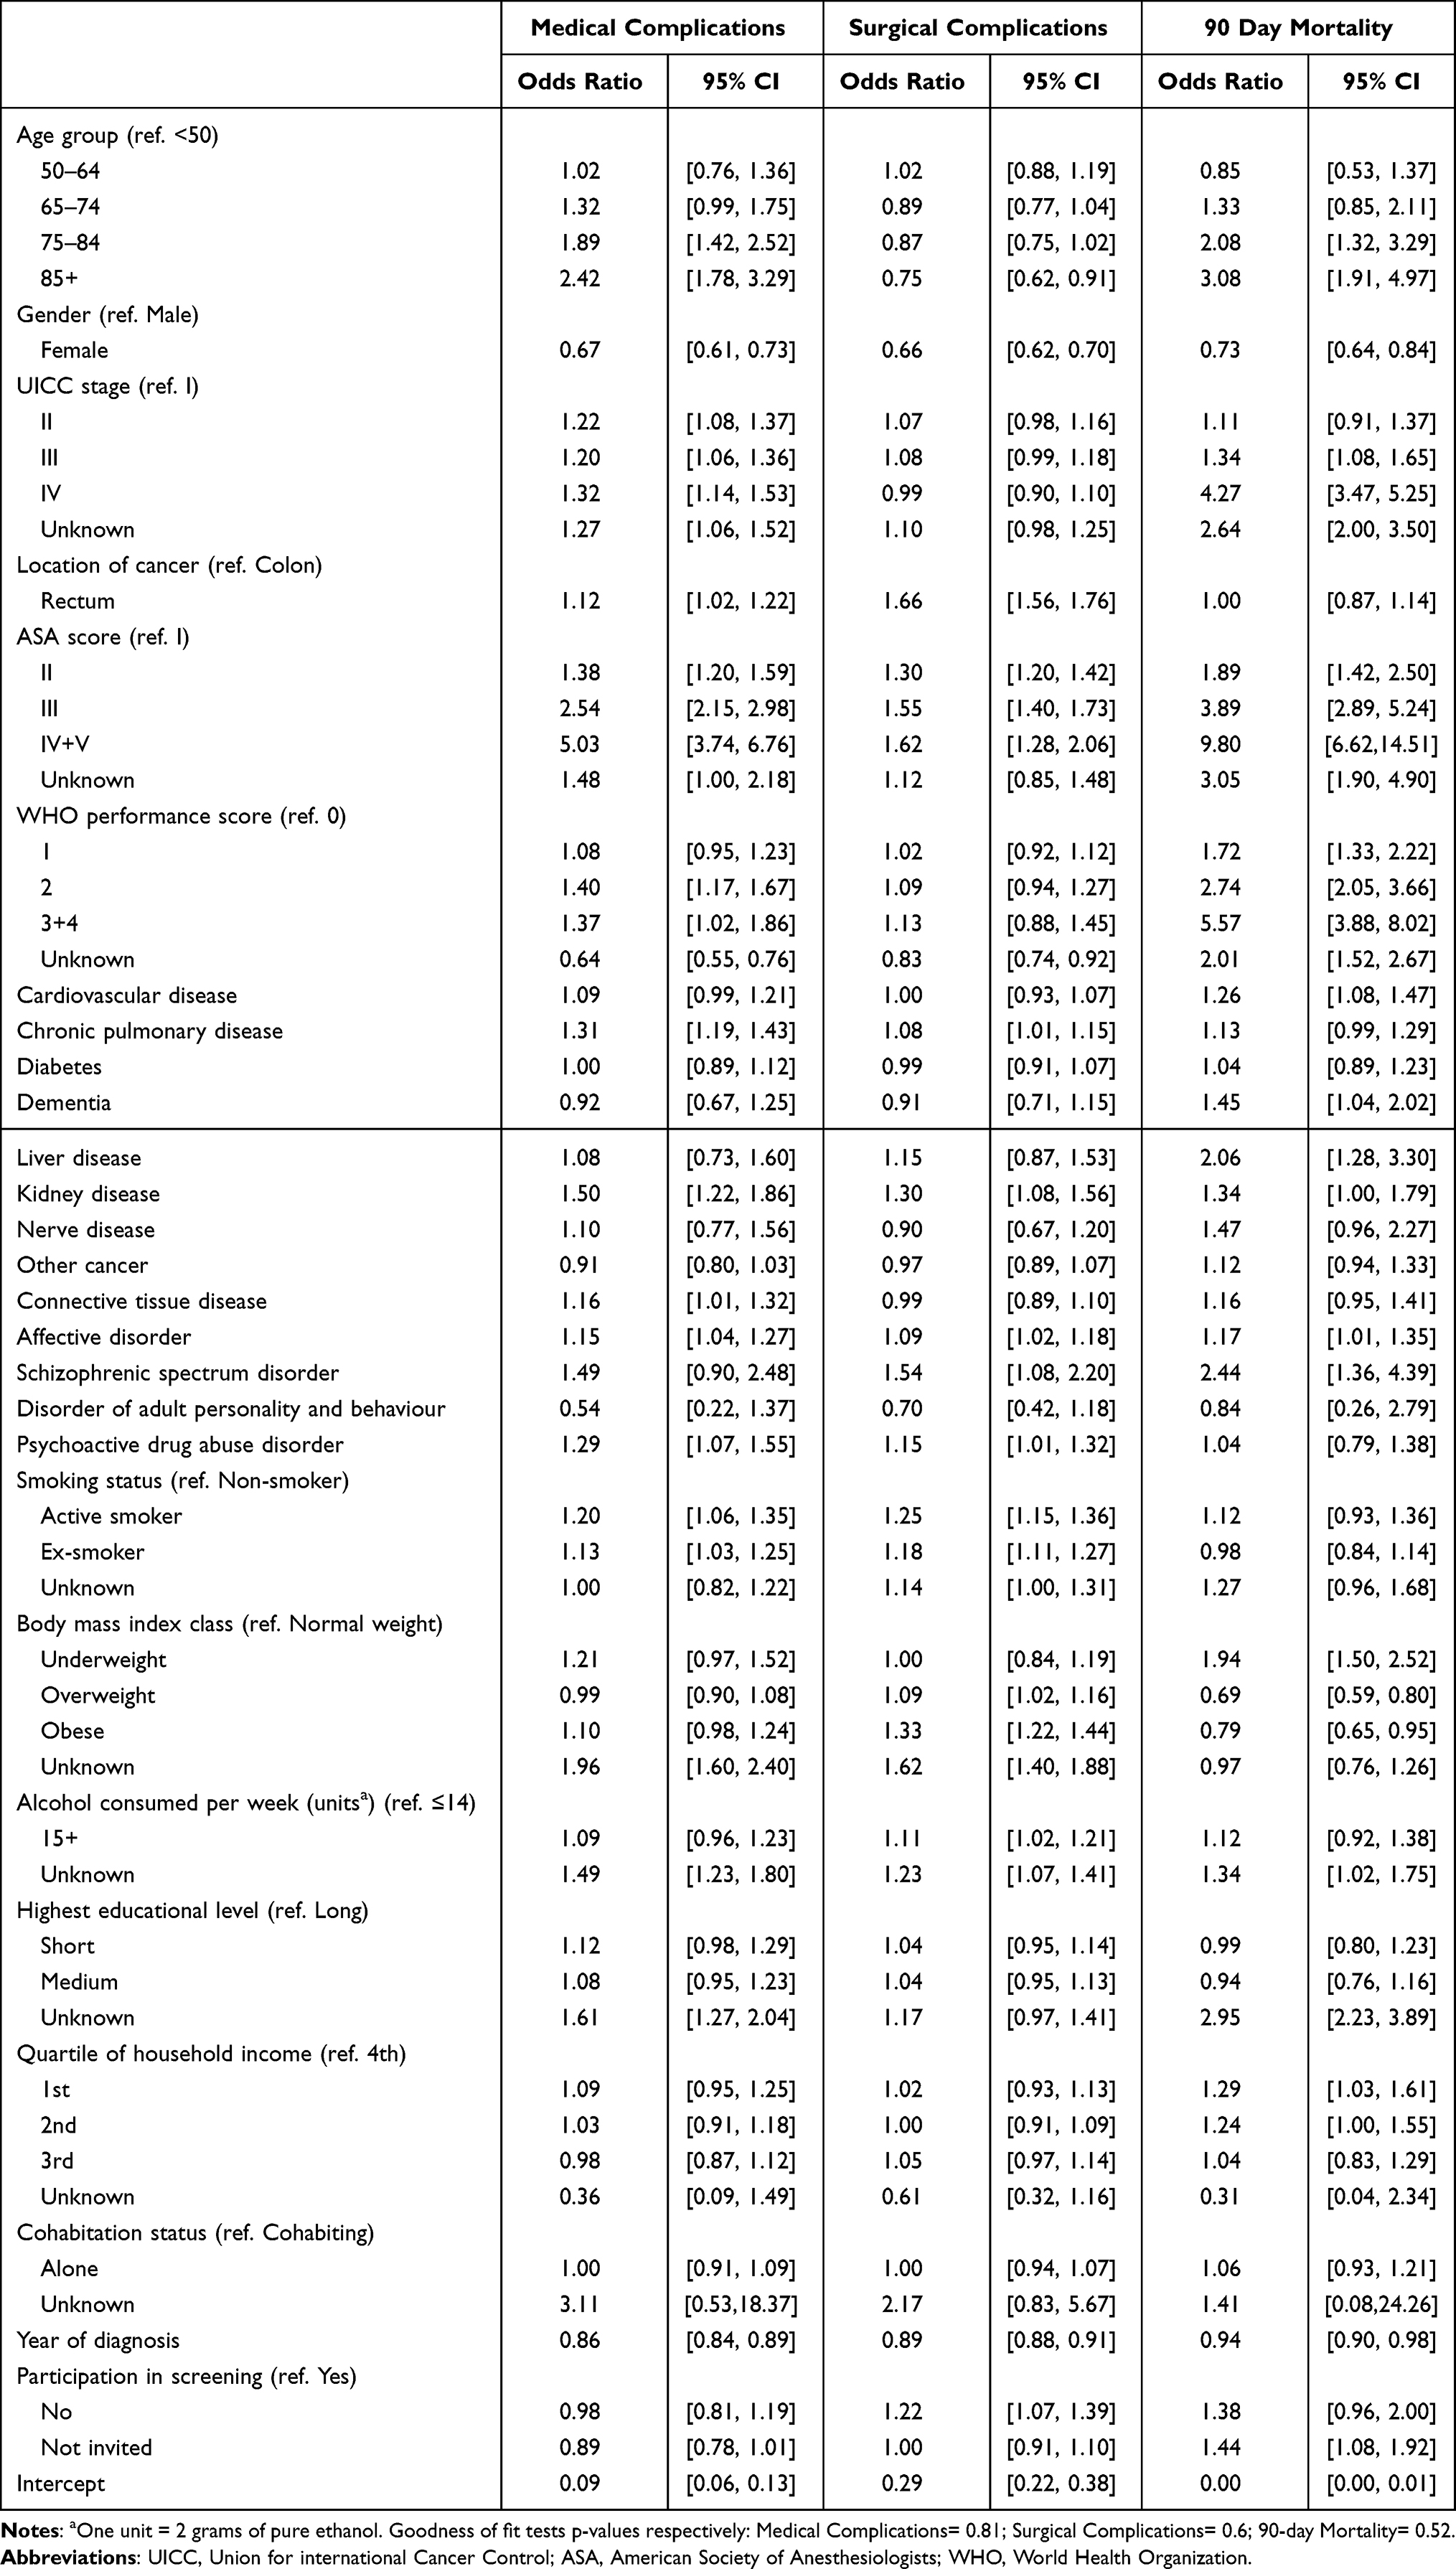 |
Table 2 Multiple Logistic Regressions of 30 Day Postoperative Surgical and Medical Complications and 90 Day Postoperative Mortality, Adjusted for Patient-Related Risk Factors |
Predicted and Observed Short-Term Outcomes
The predicted probabilities of an adverse postoperative short-term outcome based on the prediction model, and the actual percentage for each hospital are shown in Figure 4.
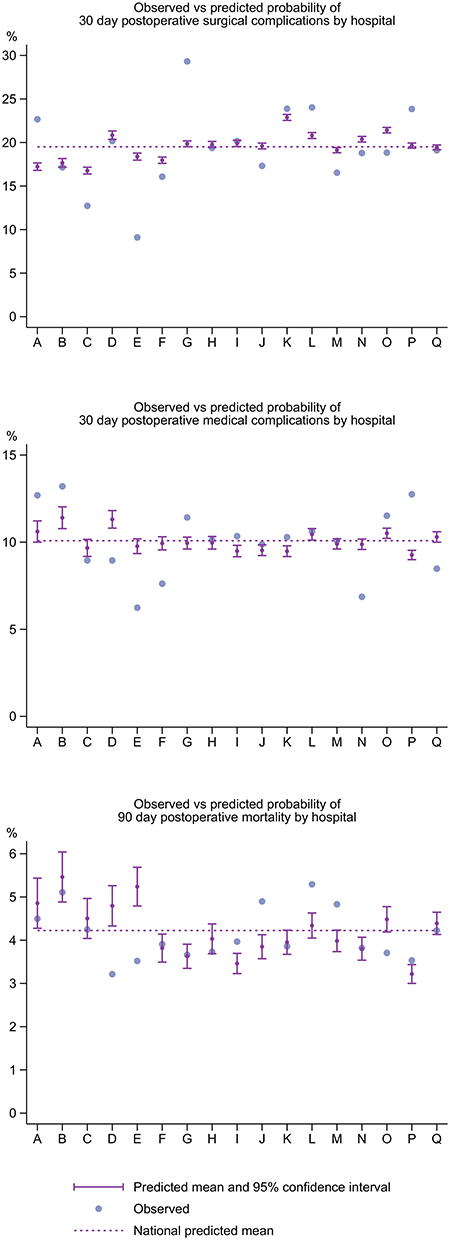 |
Figure 4 Predicted and observed frequencies of postoperative medical and surgical complications, and 90-day postoperative mortality, in a Danish cohort of patients with colorectal cancer. Hospitals ordered by patient volume, from low (left) to high volume (right). |
The predicted probability of medical complications showed no clinically meaningful variation between hospitals, whereas the observed percentage varied more from 6% (95% CI: 5–8%) to 13% (95% CI: 11–16%). The within-hospital differences between predicted and observed percentages varied in several hospitals as seen in Figure 4.
The predicted probability of surgical complications varied between 17% (95% CI: 16–17%) and 23% (95% CI: 22–23%), and the observed percentage of surgical complications varied more from 9% (95% CI: 8–11%) to 29% (95% CI: 27–31%). Within-hospital differences between predicted and observed levels are shown in Figure 4.
The predicted probability of 90-day postoperative mortality showed a pronounced between-hospital variation from 3.2% (95% CI: 3–3.4%) to 5.5% (95% CI: 4.9–6%). The observed mortality rate did not differ between the highest (5.3%, 95% CI: 4.4–6.2%) and the lowest (3.2%, 95% CI: 2.3–4.4%). The intra-hospital differences are shown in Figure 4.
Discussion
This register-based study aimed to elucidate the distribution of patient-related risk factors among Danish hospitals treating colorectal cancer in order to investigate between-hospital variation. We also attempted to estimate the potential clinical impact of the variation found on generally accepted quality indicators by entering each hospital’s patient cohort into a common prediction model. The prediction models were applied as an attempt to estimate the aggregated impact of the patient-related risk factors on each short-term outcome and should only be regarded as such.
Potentially important variables for our purpose would obviously be those that show a clinically significant association with the adjusted prediction model and vary markedly between hospitals.
High age, tumor stage, ASA and PS score were markedly associated with short-term outcomes and varied markedly between hospitals. It should be noted, however, that PS in particular was missing in a large proportion of patients (48%). Also, some less common comorbidities (kidney, liver and schizophrenic spectrum disease) were strongly associated with adverse outcomes, but rather few in number and therefore probably of less importance on an overall level. Being overweight or obese was, in our data, associated with a lower 90-day postoperative mortality.
The probabilities of short-term medical and surgical complications in each hospital varied from 11% (95% CI: 11–11%) to 15% (95% CI: 14–16%) and 17% (95% CI: 16–17%) to 23% (95% CI: 22–23%), respectively, in the prediction models, indicating differences between hospitals in aggregated risks of these short-term outcomes. Predicted 90-day postoperative mortality varied from 3.2% (95% CI: 3–3.4%) to 5.5% (95% CI: 4.9–6.1%). It is very important to note, however, that the prediction model does not predict the final outcomes since it does not include treatment information. The model was applied as an aggregated measure of the potential impact that patient-related factors prior to treatment might have on clinical outcomes. This is clearly reflected in Figure 4, in which the predicted and actual mortalities show no obvious relationship.
Other studies also examined between-hospital variations. Morris et al31 found that 30-day postoperative mortality was associated with high age, male gender, socioeconomic deprivation, emergency surgery, rectal location, comorbidity and advanced stage. They found between hospital variations in 30-day mortality from 5.4 to 6.4%. Another study by Osler et al32 also examined 30-day postoperative mortality and found emergency surgery and ASA score to be predictors. Moreover, their study showed that at most 5.7% of the variation in outcome could be explained by the treating hospital. Both Morris and Osler were based on data collected 20 years ago, when both the number of treating hospitals and the postoperative mortality were much higher. Obesity is most commonly known to be associated with a higher risk of postoperative mortality in colorectal cancer.33,34 The most comparable study to ours is Juvik et al,33 which partially include the same cohort as our study. Our results are conflicting probably due to eligibility criteria, since Juvik et al33 excluded Stage IV (who we found were underrepresented in the overweight category) and included acute cases. Axt et al34 examined in-hospital mortality, within an unspecified period. Some studies found no association between overweight and short-term mortality.35,36
In some annual reports,3,6 outcome data have been adjusted for risk factors, most thoroughly in the UK, where annual reports from National Bowel Cancer Audit present outcome data both unadjusted and adjusted for age, age squared, sex, ASA score, T-, N-, and M-category, tumor location, acute/planned admission, and Charlson comorbidity score. For some outcome indicators, this adjustment moves the results from certain hospitals inside the confidence interval of the indicator. In our opinion, this approach would allow for a more valid and fair comparison of outcome data, as also suggested by Morris et al.31
Strengths and Limitations
Strengths of this study include its size and the almost 100% coverage of the national database.16 It is also a strength that all data were prospectively collected, although with the limitations associated with routine data collection in a busy clinical service, meaning that both predictors and outcome measures may be subject to recall bias and underreporting (eg alcohol consumption, complications), interobserver variation (eg ASA score, PS) and misclassification (eg TNM staging). These limitations do not apply to postoperative death, of course. Specific limitations apply to the PS variable with its unfortunate large proportion of missing values. Sensitivity analyses were used to assess the importance of these limitations. Another strength of the study is the completeness and high quality of the Danish national registers, which in combination with the unique individual personal registration number of each patient allows for complete and accurate merging of data from multiple sources.
Perspectives
We suggest that reporting of hospital outcomes adjusted for patient-related risk factors could lead to more fair and valid comparisons between hospitals and may aid the individual hospitals in their improvement efforts. Identifying problem areas becomes easier when deviations from average values of the population are considered valid and trustworthy. Future studies should correlate risk factors with treatment choices in order to examine variations between hospitals further.
Conclusion
Marked variation in the prevalence of patient-related risk factors for adverse outcomes of colorectal cancer treatment exist between hospitals in Denmark. It seems reasonable to consider these differences when comparing outcomes between hospitals.
Acknowledgments
The authors would like to thank Region of Southern Denmark and Lillebaelt Hospital for financial support for this project. In addition, the authors would like to thank DCCG for assistance and permission to extract the population and colorectal-specific data essential for this study.
Disclosure
The authors report no conflicts of interest in this work.
References
1. Danish Colorectal Cancer Group (DCCG). Landsdækkende database for kræft i tyk- og endetarm. Årsrapport. [Danish colorectal cancer group (DCCG) annual report]; 2020. Available from: https://dccg.dk/wp-content/uploads/2021/10/DCCG-Aarsrapport-2020-publiceret.pdf.
2. Danish Colorectal Cancer Group (DCCG). Landsdækkende database for kræft i tyk- og endetarm. Årsrapport. [Danish colorectal cancer group (DCCG) annual report]; 2021. Available from: https://dccg.dk/wp-content/uploads/2022/10/DCCG-Aarsrapport-2021-offentliggjort-version-20221003.pdf.
3. National Bowel Cancer Audit (NBOCA). Annual report; 2022. Available from: https://www.nboca.org.uk/reports/annual-report-2022/.
4. Dagher H, Ahern S, Egwunye J, et al. The 2020 data Binational Colorectal Cancer Audit (BCCA) report; 2021. Available from: https://bowelcanceraudit.com/annual-reports.
5. Nasjonalt kvalitetsregister for tykk- og endetarmskreft. Årsrapport 2021. [National quality register for colorectal cancer, annual report 2021]; 2022. Available from: https://www.kreftregisteret.no/globalassets/publikasjoner-og-rapporter/arsrapporter/publisert-2022/arsrapport-2021-nasjonalt-kvalitetsregister-for-tykk--og-endetarmskreft.pdf.
6. Svenska Kolorektalcancerregistret (SCRCR). Nationell kvalitetsrapport för år 2021 från Svenska Kolorektalcancerregistret [Annual report 2021 from the register of colorectal cancer in Sweden]; 2022. Available from: https://cancercentrum.se/samverkan/cancerdiagnoser/tjocktarm-andtarm-och-anal/tjock--och-andtarm/kvalitetsregister/.
7. Bojesen RD, Friis M, Gögenur I. Age is an individual risk factor for not being referred to adjuvant chemotherapy in patients resected for UICC III colorectal cancer: a nationwide cohort study. Acta Oncol. 2020;59(12):1538–1542. doi:10.1080/0284186X.2020.1795251
8. Iversen LH. Aspects of survival from colorectal cancer in Denmark. Dan Med J. 2012;59(4):B4428.
9. Frederiksen BL, Osler M, Harling H, Ladelund S, Jørgensen T. Do patient characteristics, disease, or treatment explain social inequality in survival from colorectal cancer? Soc Sci Med. 2009;1107–1115. doi:10.1016/j.socscimed.2009.07.040
10. Søgaard M, Thomsen RW, Bossen KS, Sørensen HT, Nørgaard M. The impact of comorbidity on cancer survival: a review. Clin Epidemiol. 2013;5(Suppl 1):3–29.
11. Bojesen RD, Degett TH, Dalton SO, Gögenur I. High World Heath Organization performance status is associated with short- and long-term outcomes after colorectal cancer surgery: a nationwide population-based study. Dis Colon Rectum. 2021;64(7):851–860. doi:10.1097/DCR.0000000000001982
12. Archampong D, Borowski D, Wille-Jørgensen P, Iversen LH. Workload and surgeon’s specialty for outcome after colorectal cancer surgery. Cochrane Database Syst Rev. 2012;3:Cd005391.
13. Bos AC, van Erning FN, Elferink MA, et al. No difference in overall survival between hospital volumes for patients with colorectal cancer in the Netherlands. Dis Colon Rectum. 2016;59(10):943–952. doi:10.1097/DCR.0000000000000660
14. Rosander E, Holm T, Sjövall A, Hjern F, Weibull CE, Nordenvall C. The impact of hospital volume on survival in patients with locally advanced colonic cancer. BJS Open. 2022;6(6). doi:10.1093/bjsopen/zrac140
15. Danish Colorectal Cancer Group (DCCG). Oversigt over DCCG’s aktuelle retningslinjer. [Overview of current national guidelines of DCCG]. Available from: https://dccg.dk/retningslinjer/kolorektal-cancer/.
16. Klein MF, Gögenur I, Ingeholm P, Njor SH, Iversen LH, Emmertsen KJ; for Danish Colorectal Cancer Group. Validation of the Danish Colorectal Cancer Group (DCCG.dk) database – on behalf of the Danish Colorectal Cancer Group. Colorectal Dis. 2020;22(12):2057–2067. doi:10.1111/codi.15352
17. Dansk Tarmkræftscreeningsdatabase Årsrapport 2019 [National Danish Colorectal Cancer Screening Database Annual report 2019]; 2021. Available from: https://www.sundhed.dk/sundhedsfaglig/kvalitet/kliniske-kvalitetsdatabaser/screening/dansk-tarmkraeftscreeningsdatabase/.
18. Schmidt M, Schmidt SAJ, Adelborg K, et al. The Danish health care system and epidemiological research: from health care contacts to database records. Clin Epidemiol. 2019;11:563–591. doi:10.2147/CLEP.S179083
19. Owens WD, Felts JA, Spitznagel EL Jr. ASA physical status classifications: a study of consistency of ratings. Anesthesiology. 1978;49(4):239–243. doi:10.1097/00000542-197810000-00003
20. Oken MM, Creech RH, Tormey DC, et al. Toxicity and response criteria of the Eastern Cooperative Oncology Group. Am J Clin Oncol. 1982;5(6):649–655. doi:10.1097/00000421-198212000-00014
21. World Health Organization. Obesity and overweight [homepage on the Internet]. Available from: https://www.who.int/en/news-room/fact-sheets/detail/obesity-and-overweight.
22. Charlson ME, Pompei P, Ales KL, MacKenzie CR. A new method of classifying prognostic comorbidity in longitudinal studies: development and validation. J Chronic Dis. 1987;40(5):373–383. doi:10.1016/0021-9681(87)90171-8
23. Quan H, Li B, Couris CM, et al. Updating and validating the Charlson comorbidity index and score for risk adjustment in hospital discharge abstracts using data from 6 countries. Am J Epidemiol. 2011;173(6):676–682. doi:10.1093/aje/kwq433
24. Kristensen KB, Lund LC, Jensen PB, et al. Development and validation of a Nordic multimorbidity index based on hospital diagnoses and filled prescriptions. Clin Epidemiol. 2022;14:567–579. doi:10.2147/CLEP.S353398
25. Krupchanka D, Mladá K, Winkler P, Khazaal Y, Albanese E. Mortality in people with mental disorders in the Czech Republic: a nationwide, register-based cohort study. Lancet Public Health. 2018;3(6):e289–e295. doi:10.1016/S2468-2667(18)30077-X
26. Weiser MR. AJCC 8th Edition: colorectal cancer. Ann Surg Oncol. 2018;25(6):1454–1455. doi:10.1245/s10434-018-6462-1
27. UNESCO. International Standard Classification of Education, ISCED 2011; 2012:86. Available from: https://uis.unesco.org/sites/default/files/documents/international-standard-classification-of-education-isced-2011-en.pdf.
28. FAMAEKVIVADISP_13 [Equated disposable family income] [homepage on the Internet]. Statistics Denmark. Available from: https://www.dst.dk/da/Statistik/dokumentation/Times/familieindkomst/famaekvivadisp-13.
29. Dindo D, Demartines N, Clavien P-A. Classification of surgical complications: a new proposal with evaluation in a cohort of 6336 patients and results of a survey. Ann Surg. 2004;240(2):205–213. doi:10.1097/01.sla.0000133083.54934.ae
30. Thygesen LC, Daasnes C, Thaulow I, Brønnum-Hansen H. Introduction to Danish (nationwide) registers on health and social issues: structure, access, legislation, and archiving. Scand J Public Health. 2011;39(7 Suppl):12–16. doi:10.1177/1403494811399956
31. Morris EJ, Taylor EF, Thomas JD, et al. Thirty-day postoperative mortality after colorectal cancer surgery in England. Gut. 2011;60(6):806–813. doi:10.1136/gut.2010.232181
32. Osler M, Iversen LH, Borglykke A, et al. Hospital variation in 30-day mortality after colorectal cancer surgery in Denmark: the contribution of hospital volume and patient characteristics. Ann Surg. 2011;253(4):733–738. doi:10.1097/SLA.0b013e318207556f
33. Juvik AF, Fransgaard T, Roikjær O. Post-operative complications after colorectal cancer surgery increased with higher BMI. Dan Med J. 2023;70(4):A09220566.
34. Axt S, Wilhelm P, Spahlinger R, et al. Impact of preoperative body mass index and weight loss on morbidity and mortality following colorectal cancer-a retrospective cohort study. Int J Colorectal Dis. 2022;37(9):1983–1995. doi:10.1007/s00384-022-04228-1
35. Smith RK, Broach RB, Hedrick TL, Mahmoud NN, Paulson EC. Impact of BMI on postoperative outcomes in patients undergoing proctectomy for rectal cancer: a national surgical quality improvement program analysis. Dis Colon Rectum. 2014;57(6):687–693. doi:10.1097/DCR.0000000000000097
36. Manfredi S, Jooste V, Gay C, Faivre J, Drouillard A, Bouvier AM. Time trends in colorectal cancer early postoperative mortality. A French 25-year population-based study. Int J Colorectal Dis. 2017;32(12):1725–1731. doi:10.1007/s00384-017-2918-1
 © 2023 The Author(s). This work is published and licensed by Dove Medical Press Limited. The full terms of this license are available at https://www.dovepress.com/terms.php and incorporate the Creative Commons Attribution - Non Commercial (unported, v3.0) License.
By accessing the work you hereby accept the Terms. Non-commercial uses of the work are permitted without any further permission from Dove Medical Press Limited, provided the work is properly attributed. For permission for commercial use of this work, please see paragraphs 4.2 and 5 of our Terms.
© 2023 The Author(s). This work is published and licensed by Dove Medical Press Limited. The full terms of this license are available at https://www.dovepress.com/terms.php and incorporate the Creative Commons Attribution - Non Commercial (unported, v3.0) License.
By accessing the work you hereby accept the Terms. Non-commercial uses of the work are permitted without any further permission from Dove Medical Press Limited, provided the work is properly attributed. For permission for commercial use of this work, please see paragraphs 4.2 and 5 of our Terms.