Back to Journals » OncoTargets and Therapy » Volume 11
Underexpression of INPPL1 is associated with aggressive clinicopathologic characteristics in papillary thyroid carcinoma
Authors Zhou YL, Zheng C, Chen YT, Chen XM
Received 30 August 2018
Accepted for publication 10 October 2018
Published 1 November 2018 Volume 2018:11 Pages 7725—7731
DOI https://doi.org/10.2147/OTT.S185803
Checked for plagiarism Yes
Review by Single anonymous peer review
Peer reviewer comments 2
Editor who approved publication: Dr Sanjay Singh
Yi-Li Zhou,1,* Chen Zheng,1,* Yi-Tong Chen,2 Xue-Min Chen1
1Department of Thyroid and Breast Surgery, The First Affiliated Hospital of Wenzhou Medical University, Wenzhou, Zhejiang, China; 2Department of Clinical Medicine, Tai Zhou University Medical School, Taizhou, Zhejiang, China
*These authors contributed equally to this work
Purpose: To study the relationship between INPPL1 gene and clinicopathologic characteristics of papillary thyroid carcinoma (PTC).
Patients and methods: INPPL1 expression in PTCs was tested by quantitative real-time reverse transcription PCR. The Cancer Genome Atlas (TCGA) RNA-seq data and our mRNA data were used to analyze and reveal the relationship between INPPL1 and aggressive clinicopathologic characteristics of PTC.
Results: When compared to normal thyroid tissues, INPPL1 was significantly downregulated in PTC tissues, as revealed by our data and TCGA data. INPPL1 underexpression was remarkably related to aggressive clinicopathologic characteristics such as lymph node metastasis (LNM), histological type, tumor size, mulitifocality, and disease stage in TCGA data. Meanwhile, LNM was confirmed to be associated with underexpression of INPPL1 in our data. In addition, logistic analysis clearly showed that underexpression of INPPL1 was an independent factor for LNM in PTC.
Conclusion: INPPL1 may be a novel tumor suppressor gene in PTC, which was significantly correlated with aggressive clinicopathologic characteristics, especially LNM.
Keywords: papillary thyroid carcinoma, INPPL1 expression, lymph node metastasis, The Cancer Genome Atlas
Introduction
Thyroid cancer is the most common malignant tumor in the endocrine system and among the neck tumors, whose incidence is increasing globally in recent years. In the USA, ~56,870 new cases were estimated in 2017.1 The prognosis of most thyroid cancer patients is good,2 especially in those with papillary thyroid carcinoma (PTC) which is the most common type of thyroid cancer and accounts for ~80% of all thyroid cancer cases.3 However, PTC is highly metastatic and recurrent after routine treatment, and some patients of PTC have poor prognosis such as disease recurrence and even death.4 Certain clinical and pathological characteristics such as advanced disease stages, extrathyroidal extension, and lymph node metastasis (LNM) have been associated with a poor prognosis of this disease.5 LNM is a major factor for recurrence and mortality,6–8 whose incidence ranges from 20% to 50%9,10 and which leads to recurrence and secondary surgery.11–13 The occurrence and development of thyroid carcinoma are mainly affected by genomic variation, including activation of oncogene and silencing of tumor suppressor gene. It has been proved that BRAF mutation promotes the occurrence and development of thyroid carcinoma by abnormal activation of MAPK pathway,14 and that the mutation of TERT promoter15 and PIK 3CA gene16 also plays an important role. Although great progress has been made in gene research, the pathogenesis and many features of thyroid cancer are still unknown. Therefore, searching for new potential molecular markers and elucidating their molecular mechanisms in the development of thyroid cancer become necessary.
Inositol phosphatase 1 (INPPL1), which is located on chromosome 11, encodes an SH2-containing 5′-inositol phosphatase (SHIP2), a member of the inositol 5-phosphatase family, which is involved in the regulation of insulin function. SHIP2 also plays a role in the regulation of EGFR turnover and actin remodeling.17,18 SHIP2 dephosphorylates 5-phosphate of phosphatidylinositol-3,4,5-trisphosphate and plays important roles in regulating the PI3K/Akt pathway in physiology and disease. SHIP2 is widely expressed in human type II diabetes mellitus and multiple dysplasia, but its role in human cancer remains unclear. In recent years, it has been reported that SHIP2 has both tumor-promoting and antitumor functions in human tumors, which largely depend on the cell model.19 In the glioblastoma cell line 1321 N1, which does not express PTEN, downregulation of SHIP2 expression promotes cell proliferation by reducing the expression of key regulatory proteins (such as p27) in cell cycle and is involved in the migration by controlling phosphatidylinositol 4,5-bisphosphate in the cell membrane.19,20 SHIP2 is frequently downregulated in gastric cancer, and its underexpression promotes the development and proliferation of gastric cancer by activating PI3K/AKT signal.21 However, high expression of SHIP2 was found in breast cancer, hepatocellular carcinoma, non-small cell lung cancer, and colorectal cancer, which was associated with poor survival.22–26 It can be seen that INPPL1 gene plays different roles in different tumors. The expression and role of INPPL1 gene in thyroid carcinoma have not been reported. It is important to study the expression and biological function of human INPPL1 gene in thyroid carcinoma to understand the occurrence and development of thyroid carcinoma.
As next generation sequence has developed, our previous study performed whole transcriptome sequencing of 19 pairs of primary thyroid cancer samples with matched adjacent normal thyroid tissues.27 The present study found by application of bioinformatics that human INPPL1 expression is significantly downregulated in PTC tumors. Thus, we confirm this finding using quantitative real-time reverse transcription PCR (qRT-PCR) in 49 PTC samples. Also, we investigate the relationship between INPPL1 expression and the clinicopathologic characteristics in PTC using The Cancer Genome Atlas (TCGA) data and our data. Furthermore, the relationship between INPPL1 expression and LNM in PTC was assessed using logistic regression analysis. The role of INPPL1 gene in PTC has been discussed in this study.
Patients and methods
Patients and samples
Fresh paired samples including PTC tissues and noncancerous tissues from 49 PTC patients were collected. The samples after resection were immediately snap-frozen in liquid nitrogen and subsequently stored at −80°C before RNA extraction. Final histological diagnosis of all the samples was confirmed as PTC by two pathologists. The study was conducted with the approval of Ethics Committee of The First Affiliated Hospital of Wenzhou Medical University and the written informed consent was received from the patients.
RNA extraction and qRT-PCR
Total RNA was extracted from 49 paired samples using TRIzol reagent according to the manufacturer’s protocol (Thermo Fisher Scientific), and the ReverTra Ace qPCR RT Kit (Toyobo) was used for cDNA. qRT-PCR was conducted by Thunderbird SYBR qPCR Mix (Toyobo) on the Roche 480 System (Hoffman-La Roche Ltd). Each sample was in triplicate. GAPDH was used as an internal control. The primer sequences for INPPL1 were as follows: INPPL1, 5′-AGCTGCCCACGCTCAAACCAA-3′ (forward) and 5′-AGGTCAGGAACTGTTGGGCCGT-3′ (reverse).
TCGA data
Thyroid cancer RNA-seq data and corresponding clinical information were downloaded from the TCGA database. INPPL1 expression data were available for 502 PTC cancer samples compared with 59 normal thyroid samples.
Statistical analysis
The normally distributed data were expressed as mean±SD and were evaluated by Student’s t-test. Categorical variables were expressed as percentage and evaluated by chi-squared test. Logistic regression analysis was conducted to estimate the ORs of certain factors. Variables with P<0.05 in the univariate analysis were used in a multivariate analysis. All P-values were two sided, and P-value <0.05 was considered statistically significant with SPSS. GraphPad Prism Version 6.0 was used for the graphs.
Results
INPPL1 was underexpressed in PTC
Completing the whole transcriptome sequencing of 19 pairs of tumor and paracancerous normal tissues, we found that the expression of INPPL1 in PTC tumor tissues was significantly lower than that in paracancerous normal tissues (Table 1). In order to validate the data of whole transcriptome resequencing, we began to assess INPPL1 mRNA expression in 49 samples of PTC tissues and noncancerous samples by qRT-PCR. As shown in Figure 1, INPPL1 mRNA expression was remarkably downregulated in tumors against that in the adjacent noncancerous tissues (P<0.001). The same trend was further validated in the TCGA cohort, which included 502 PTC samples and 59 normal thyroid tissues. Accordingly, INPPL1 mRNA expression was significantly lower in PTC tissues than that in normal tissues (P<0.001; Figure 2). These results revealed that INPPL1 gene may be a potential tumor suppressor gene in PTC patients.
 | Table 1 The expression of INPPL1 gene in 19 cases of thyroid papillary carcinoma was lower than that in normal tissue by whole transcriptome sequencing |
 | Figure 1 The mRNA expression of INPPL1 in our local cohort (n=49). |
 | Figure 2 The mRNA expression of INPPL1 in TCGA cohort, including 502 PTC samples and 59 noncancerous thyroid samples. |
Relationship between INPPL1 expression and clinicopathologic characteristics in PTC
In order to explore whether low INPPL1 expression was associated with tumorigenesis and progression of PTC, we studied the relationship of INPPL1 with clinicopathologic characteristics. We divided the 502 PTC patients into low INPPL1 expression group (n=252) and high INPPL1 expression (n=250) group on the basis of the median value according to the INPPL1 expression level in the TCGA cohort. Results showed that INPPL1 underexpression was related to histological type (P=0.001), tumor size (P=0.046), clinical stage (P=0.007), LNM (P=0.001), and multifocality (P=0.019), as shown in Table 2. However, age, gender, and distant metastasis were not found to have significant associations with INPPL1 expression (P≥0.05). At the same time, the results of our validation cohort were consistent with the TCGA finding that low INPPL1 expression corresponded to more LNM (P=0.038; Table 3). These findings supported INPPL1 gene as a tumor suppressor gene associated with PTC.
 | Table 2 The relationship between INPPL1 expression and clinicopathologic features in the TCGA cohort |
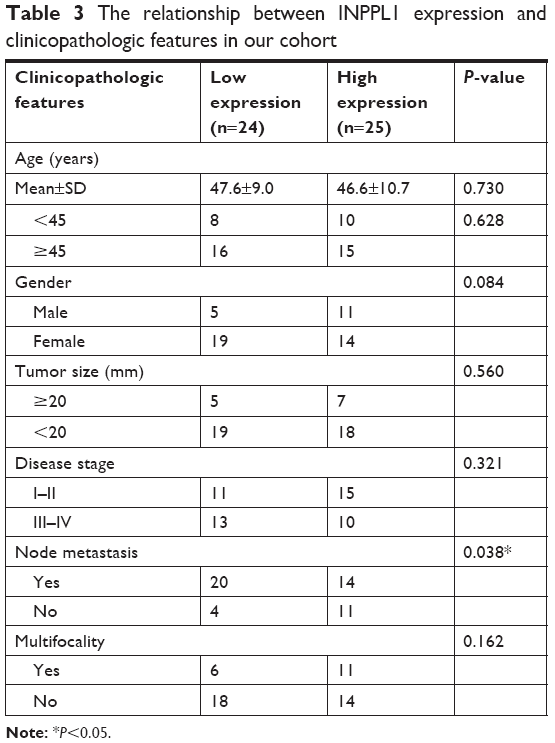 | Table 3 The relationship between INPPL1 expression and clinicopathologic features in our cohort |
INPPL1 underexpression was an independent indicator for LNM in PTC
Further study was conducted to find the relationship of INPPL1 expression with LNM. Univariate logistic regression analysis in TCGA data revealed that the relative variables for LNM were histological type (OR=2.383, 95% CI=1.544–3.680, P<0.001), age (OR=0.62, 95% CI=0.427–0.899, P=0.012), gender (OR=1.551, 95% CI=1.022–2.353, P=0.039), tumor size (OR=2.525, 95% CI=1.652–3.858, P<0.001), and INPPL1 expression (OR=0.335, 95% CI=0.242–0.520, P<0.001), as shown in Table 4. Multivariate logistic regression analysis in TCGA data also revealed that histological subtype (OR=2.281, 95% CI=1.440–3.613, P<0.001), age (OR=0.577, 95% CI=0.385–0.865, P=0.008), gender (OR=1.549, 95% CI=1.010–2.509, P=0.045), tumor size (OR=2.44, 95% CI=1.555–3.830, P<0.001), and INPPL1 expression (OR=0.360, 95% CI=0.241–0.540, P<0.001) were independent indicators for LNM (Table 5). Meanwhile, multivariate logistic regression analysis from our validation cohort also suggested that low INPPL1 expression aggravated the LNM risk of PTC patients (OR=0.156, 95% CI=0.033–0.742, P=0.020; Table 6), which was consistent with the TCGA findings. In general, INPPL1 underexpression can indicate the high risk of LNM independently in PTC.
 | Table 4 Univariate logistic regression analysis for the risk of lymph node metastasis in TCGA cohort |
 | Table 5 Multivariate logistic regression analysis for the risk of lymph node metastasis in TCGA cohort |
 | Table 6 Multivariate logistic regression analysis for the risk of lymph node metastasis in our cohort |
Discussion
PTC is the most common endocrine malignant tumor, and its incidence is increasing year by year.1 Although the prognosis of most thyroid cancer patients is favorable,2 some PTCs are characterized by capsular invasion and lymph node (the incidence being 20%–50%9,10) and distant metastasis, which lead to the possibility of disease recurrence and secondary surgery.11–13 PTCs show different biological behaviors during tumorigenesis due to genomic variations. It is insufficient to make individualized treatment strategies and assess the risk of each PTC patient based only on the current clinical and pathological parameters. Finding new molecular biomarkers to predict the clinical progress and metastasis of PTCs is urgent. So far, indicators to assess the status of LNM are still lacking.
High-throughput sequencing of variable gene variations has been widely used in the study of molecular mechanism of cancer. In our study, transcriptome sequencing was performed in 19 pairs of PTC tumors and adjacent normal tissues, and the results showed that the expression of INPPL1 in PTC tumor tissues was lower than that in adjacent normal thyroid tissues. This finding might suggest its possible role as a tumor suppressor in thyroid cancer.
INPPL1 encodes SHIP2, which is involved in the regulation of insulin function, EGFR turnover, and actin remodeling.17,18 INPPL1 may be a promising therapeutic target for not only type 2 diabetes, but also cancer, neurodegenerative diseases, and atherosclerosis.28 Among cancers, high expression of INPPL1 was found in breast cancer, hepatocellular carcinoma, non-small cell lung cancer, and colorectal cancer, where it is associated with poor survival.22-26 INPPL1 supports the metastatic growth in breast cancer and it is a valuable biomarker for breast cancer. By interacting with c-CBL, INPPL1 can prevent the conversion of EGFR and enhance the Akt activation induced by EGF, thus promoting the proliferation and metastasis of breast cancer cells.22,29 In ER-negative breast cancer stem cells, INPPL1 activates Akt and JNK and upregulates epithelial mesenchymal transition markers and vimentin.30 INPPL1 expression contributes to the malignant potential of colorectal cancer by enhancing chemoresistance, cell migration, and cell invasion.31 However, overexpression of INPPL1 in glioblastoma cells inhibits Akt activation and leads to cell cycle arrest and migration.19,20 INPPL1 is often downregulated in gastric cancer, and the decreased INPPL1 expression promotes the development and proliferation of gastric cancer by activating PI3K/AKT signal.21 It can be seen that INPPL1 plays different roles in different tumors.
In this study, we first reported the underexpression of INPPL1 in PTC and it was associated with aggressive clinicopathologic characteristics, especially LNM. INPPL1 mRNA expression detected by qRT-PCR was remarkably downregulated in PTC tissues against that in noncancerous tissues. This result was consistent with our finding of whole transcriptome sequencing. TCGA cohort analysis also confirmed this finding, which is similar to the expression of INPPL1 in gastric cancer.21 Clinicopathologic feature analysis in TCGA cohort showed that underexpression of NINPPL1 was remarkably related to aggressive clinicopathologic characteristics, including tumor size, multifocality, advanced disease stage, and LNM. In our cohort, LNM was confirmed to be associated with the underexpression of INPPL1, which was consistent with TCGA data. Other features have not shown statistical correlation, which may be due to the limited number of cases. Moreover, logistic regression analysis indicated that the underexpression of INPPL1 was an independent factor for LNM in PTCs. This seems to suggest that the INPPL1 gene may inhibit the migration of thyroid cancer, as it does in glioblastoma.20 All these findings support INPPL1 as a tumor suppressor gene associated with PTC and further study must to be conducted.
Our study still contains certain limitations. First, the cellular molecular mechanisms of INPPL1 in the progression of PTC need to be further investigated. Furthermore, the relationship between INPPL1 and prognosis of PTC in large samples needs to be studied.
Conclusion
INPPL1 was generally underexpressed in PTC. Low INPPL1 expression indicates high risk of LNM in PTC. INPPL1 may be a potential tumor suppressor gene in PTC, and it is worth studying further.
Acknowledgment
The Major Science and Technology Projects of Zhejiang Province (2015C03052) supported this work.
Disclosure
The authors report no conflicts of interest in this work.
References
Siegel RL, Miller KD, Jemal A. Cancer statistics, 2017. CA Cancer J Clin. 2017;67(1):7–30. | ||
Leboulleux S, Rubino C, Baudin E, et al. Prognostic factors for persistent or recurrent disease of papillary thyroid carcinoma with neck lymph node metastases and/or tumor extension beyond the thyroid capsule at initial diagnosis. J Clin Endocrinol Metab. 2005;90(10):5723–5729. | ||
Morris LG, Tuttle RM, Davies L. Changing trends in the incidence of thyroid cancer in the United States. JAMA Otolaryngol Head Neck Surg. 2016;142(7):709–711. | ||
Burns WR, Zeiger MA. Differentiated thyroid cancer. Semin Oncol. 2010;37(6):557–566. | ||
Ito Y, Miyauchi A. Prognostic factors and therapeutic strategies for differentiated carcinomas of the thyroid. Endocr J. 2009;56(2):177–192. | ||
Kim SK, Kwon AY, Back K, et al. Predictive factors of lymph node metastasis in follicular variant of papillary thyroid carcinoma. Ann Surg Oncol. 2017;24(9):2617–2623. | ||
Lundgren CI, Hall P, Dickman PW, Zedenius J. Clinically significant prognostic factors for differentiated thyroid carcinoma: a population-based, nested case–control study. Cancer. 2006;106(3):524–531. | ||
Zidan J, Karen D, Stein M, et al. Pure versus follicular variant of papillary thyroid carcinoma: clinical features, prognostic factors, treatment, and survival. Cancer. 2003;97(5):1181–1185. | ||
Mustafa M, Kuwert T, Weber K, et al. Regional lymph node involvement in T1 papillary thyroid carcinoma: a bicentric prospective SPECT/CT study. Eur J Nucl Med Mol Imaging. 2010;37(8):1462–1466. | ||
Schneider DF, Chen H. New developments in the diagnosis and treatment of thyroid cancer. CA Cancer J Clin. 2013;63(6):373–394. | ||
Lee YC, Na SY, Park GC, et al. Occult lymph node metastasis and risk of regional recurrence in papillary thyroid cancer after bilateral prophylactic central neck dissection: a multi-institutional study. Surgery. 2017;161(2):465–471. | ||
Lee YM, Sung TY, Kim WB, et al. Risk factors for recurrence in patients with papillary thyroid carcinoma undergoing modified radical neck dissection. Br J Surg. 2016;103(8):1020–1025. | ||
Liu FH, Kuo SF, Hsueh C, Chao TC, Lin JD. Postoperative recurrence of papillary thyroid carcinoma with lymph node metastasis. J Surg Oncol. 2015;112(2):149–154. | ||
Xing M. BRAF mutation in thyroid cancer. Endocr Relat Cancer. 2005;12(2):245–262. | ||
Xing M, Liu R, Liu X, et al. BRAF V600E and TERT promoter mutations cooperatively identify the most aggressive papillary thyroid cancer with highest recurrence. J Clin Oncol. 2014;32(25):2718–2726. | ||
Hou P, Liu D, Shan Y, Liu Z, et al. Genetic alterations and their relationship in the phosphatidylinositol 3-kinase/Akt pathway in thyroid cancer. Clin Cancer Res. 2007;13(4):1161–1170. | ||
Backers K, Blero D, Paternotte N, Zhang J, Erneux C. The termination of PI3K signalling by SHIP1 and SHIP2 inositol 5-phosphatases. Adv Enzyme Regul. 2003;43:15–28. | ||
Raaijmakers JH, Deneubourg L, Rehmann H, et al. The PI3K effector Arap3 interacts with the PI(3,4,5)P3 phosphatase SHIP2 in a SAM domain-dependent manner. Cell Signal. 2007;19(6):1249–1257. | ||
Elong Edimo W, Schurmans S, Roger PP, Erneux C. SHIP2 signaling in normal and pathological situations: its impact on cell proliferation. Adv Biol Regul. 2014;54:142–151. | ||
Elong Edimo W, Ghosh S, Derua R, et al. SHIP2 controls plasma membrane PI(4,5)P2 thereby participating in the control of cell migration in 1321 N1 glioblastoma cells. J Cell Sci. 2016;129(6):1101–1114. | ||
Ye Y, Ge YM, Xiao MM, et al. Suppression of SHIP2 contributes to tumorigenesis and proliferation of gastric cancer cells via activation of Akt. J Gastroenterol. 2016;51(3):230–240. | ||
Prasad NK, Tandon M, Badve S, Snyder PW, Nakshatri H. Phosphoinositol phosphatase SHIP2 promotes cancer development and metastasis coupled with alterations in EGF receptor turnover. Carcinogenesis. 2008;29(1):25–34. | ||
Fu M, Fan W, Pu X, et al. Elevated expression of SHIP2 correlates with poor prognosis in non-small cell lung cancer. Int J Clin Exp Pathol. 2013;6(10):2185–2191. | ||
Fu M, Gu X, Ni H, et al. High expression of inositol polyphosphate phosphatase-like 1 associates with unfavorable survival in hepatocellular carcinoma. Int J Clin Exp Pathol. 2013;6(11):2515–2522. | ||
Prasad NK, Tandon M, Handa A, et al. High expression of obesity-linked phosphatase SHIP2 in invasive breast cancer correlates with reduced disease-free survival. Tumour Biol. 2008;29(5):330–341. | ||
Yang J, Fu M, Ding Y, et al. High SHIP2 expression indicates poor survival in colorectal cancer. Dis Markers. 2014;2014:218968–7. | ||
Wang QX, Chen ED, Cai YF, et al. A panel of four genes accurately differentiates benign from malignant thyroid nodules. J Exp Clin Cancer Res. 2016;35(1):169. | ||
Suwa A, Kurama T, Shimokawa T. SHIP2 and its involvement in various diseases. Expert Opin Ther Targets. 2010;14(7):727–737. | ||
Prasad NK. SHIP2 phosphoinositol phosphatase positively regulates EGFR-Akt pathway, CXCR4 expression, and cell migration in MDA-MB-231 breast cancer cells. Int J Oncol. 2009;34(1):97–105. | ||
Fu CH, Lin RJ, Yu J, et al. A novel oncogenic role of inositol phosphatase SHIP2 in ER-negative breast cancer stem cells: involvement of JNK/vimentin activation. Stem Cells. 2014;32(8):2048–2060. | ||
Hoekstra E, das AM, Willemsen M, et al. Lipid phosphatase SHIP2 functions as oncogene in colorectal cancer by regulating PKB activation. Oncotarget. 2016;7(45):73525–73540. |
 © 2018 The Author(s). This work is published and licensed by Dove Medical Press Limited. The
full terms of this license are available at https://www.dovepress.com/terms
and incorporate the Creative Commons Attribution
- Non Commercial (unported, 3.0) License.
By accessing the work you hereby accept the Terms. Non-commercial uses of the work are permitted
without any further permission from Dove Medical Press Limited, provided the work is properly
attributed. For permission for commercial use of this work, please see paragraphs 4.2 and 5 of our Terms.
© 2018 The Author(s). This work is published and licensed by Dove Medical Press Limited. The
full terms of this license are available at https://www.dovepress.com/terms
and incorporate the Creative Commons Attribution
- Non Commercial (unported, 3.0) License.
By accessing the work you hereby accept the Terms. Non-commercial uses of the work are permitted
without any further permission from Dove Medical Press Limited, provided the work is properly
attributed. For permission for commercial use of this work, please see paragraphs 4.2 and 5 of our Terms.