")
Back to Journals » International Journal of Chronic Obstructive Pulmonary Disease » Volume 11 » Issue 1
Tryptophan catabolism in acute exacerbations of chronic obstructive pulmonary disease
Authors Gulcev M, Reilly C, Griffin T, Broeckling C, Sandri B, Witthuhn B, Hodgson S, Woodruff P, Wendt C
Received 5 March 2016
Accepted for publication 5 June 2016
Published 29 September 2016 Volume 2016:11(1) Pages 2435—2446
DOI https://doi.org/10.2147/COPD.S107844
Checked for plagiarism Yes
Review by Single anonymous peer review
Peer reviewer comments 3
Editor who approved publication: Dr Richard Russell
Makedonka Gulcev,1 Cavan Reilly,2 Timothy J Griffin,3 Corey D Broeckling,4 Brian J Sandri,1 Bruce A Witthuhn,3 Shane W Hodgson,1 Prescott G Woodruff,5 Chris H Wendt1,6,*
1Department of Medicine, 2Division of Biostatistics, School of Public Health, 3Department of Biochemistry, Molecular Biology and Biophysics, University of Minnesota, Minneapolis, MN, USA; 4Department of Computer Science, Colorado State University, Fort Collins, CO, USA; 5Division of Pulmonary, Critical Care, Sleep and Allergy, Department of Medicine and the CVRI, University of California, San Francisco, CA, USA; 6Department of Medicine, Minneapolis VA Medical Center, Minneapolis, MN, USA
*For the COPD Clinical Research Network
Introduction: Exacerbations are a leading cause of morbidity in COPD. The objective of this study was to identify metabolomic biomarkers of acute exacerbations of COPD (AECOPD).
Methods: We measured metabolites via mass spectrometry (MS) in plasma drawn within 24 hours of admission to the hospital for 33 patients with an AECOPD (day 0) and 30 days later and for 65 matched controls. Individual metabolites were measured via selective reaction monitoring with mass spectrometry. We used a mixed-effect model to compare metabolite levels in cases compared to controls and a paired t-test to test for differences between days 0 and 30 in the AECOPD group.
Results: We identified 377 analytes at a false discovery rate of 5% that differed between cases (day 0) and controls, and 31 analytes that differed in the AECOPD cases between day 0 and day 30 (false discovery rate: 5%). Tryptophan was decreased at day 0 of AECOPD compared to controls corresponding to an increase in indoleamine 2,3-dioxygenase activity.
Conclusion: Patients with AECOPD have a unique metabolomic signature that includes a decrease in tryptophan levels consistent with an increase in indoleamine 2,3-dioxygenase activity.
Keywords: Chronic Obstructive Pulmonary Disease, metabolomics, tryptophan
Introduction
Chronic obstructive pulmonary disease (COPD) is currently the third leading cause of death in the USA, and worldwide it is one of the most prevalent lung diseases causing significant morbidity and mortality.1,2 Some patients are prone to episodes of acute exacerbations of COPD (AECOPD) that are a frequent cause of medical visits and hospitalizations. AECOPD are a leading cause of morbidity and mortality in COPD, and there is evidence that frequent exacerbations might accelerate the natural course of COPD.3–6 Currently, there is no validated diagnostic test or biomarker to identify patients at risk of or with an exacerbation. Therefore, a diagnosis of an AECOPD is based on clinical symptoms for which there are no single standardized definition.
Recent technological advances in mass spectrometry have led to the emerging field of metabolomics, the study of small molecules. These small molecules consist of metabolic substrates and products, such as lipids, sugars, peptides, and foreign compounds such as drugs and their metabolites. Metabolomic profiling complements genomics and proteomics offering a snapshot into the physiology of human disease. In this respect, metabolomics has the opportunity to give us insight into mechanisms of disease and has the potential to identify biomarkers of disease.
In this study, we profiled the plasma metabolome in participants from the NIH-sponsored COPD Clinical Research Network. The cases were participants hospitalized for an AECOPD who had plasma collected within 24 hours of hospitalization and 30 days into recovery. Controls consisted of COPD participants matched for age and lung function in the absence of an AECOPD. We were able to characterize metabolomic profiles that distinguish an AECOPD and the presence of tryptophan catabolism via indoleamine 2,3-dioxygenase (IDO) activation.
Methods
Study population
Subjects (Table 1) were 33 individuals with COPD (defined as having forced expiratory volume in 1 second [FEV1] <60% predicted, FEV1 to forced vital capacity ratio <70%, and minimum 10 pack-years of smoking) hospitalized for an AECOPD in the NIH-sponsored LEUKO study.7 Plasma was collected within 24 hours of hospitalization (day 0) and then again in 30 days post-AECOPD (day 30). Controls (n=65) consisted of individuals with stable COPD from the NIH-sponsored MACRO study8 matched for age, sex, lung function, and pack-years of smoking. Participants in the MACRO study were considered high risk for exacerbation as they were either using continuous oxygen therapy or had received systemic glucocorticoid steroids, had gone to the emergency room or been hospitalized for an AECOPD within the previous year. Samples from controls were obtained at baseline, prior to randomization, and subjects had not been treated for AECOPD for at least 4 weeks at the time of the plasma collection. Two controls were matched to each case for age and lung function (FEV1) with the exception of one case with only one matched control identified. This study was approved by the University of Minnesota Institutional Review Board and met exempt status for patient consent.
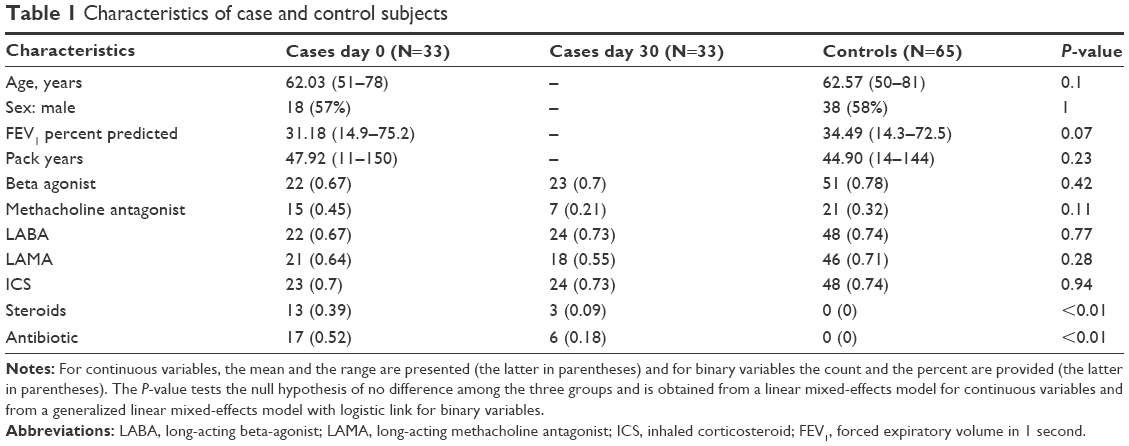 | Table 1 Characteristics of case and control subjects |
Sample preparation
Both cases and controls had identical protocols for obtaining plasma. These were nonfasting samples drawn at the time of enrollment into the study. Briefly, blood was drawn into an ethylenediaminetetraacetic acid-containing tube, inverted 8–10 times, and then centrifuged. Following centrifugation, 1.0 mL of plasma was transferred to a microtube (Sarstedt [Nümbrecht, Germany], RNAse, and DNAse free) and immediately frozen to −70°C. The samples remained at −70°C until use and were not freeze–thawed. Plasma samples were processed using a high-performance liquid chromatography-grade cold methanol (Sigma-Aldrich Co, St Louis, MO, USA) extraction method. The extraction methanol solution was cooled to −80°C. A volume of 400 μL of cold solvent was added to 100 μL of plasma. The mixture was gently shaken for 30 seconds and incubated for 6–8 hours at −20°C, then centrifuged for 15 minutes at 13,000 rpm at 4°C (in a cold room) and the supernatant transferred to a new tube. The pellet was rinsed twice with the cold solvent and the aforementioned procedure was repeated. The resulting supernatants were pooled and dried with a SpeedVac and stored at −80°C until further processing. A volume of the starting ultra-performance liquid chromatography (UPLC) buffer was added to the dried samples after they were acidified with formic acid (5 μL of formic acid [50% v/v]), to which 95 μL of the UPLC starting buffer was added (5% acetonitrile, 94.9% water, and 0.1% formic acid). After the samples were reconstituted, the solutions were centrifuged, to pellet out insoluble material, for 5 minutes at 13,000 rpm (4°C), and the supernatants were transferred to a Waters (Waters, Milford, MA, USA) 300 μL polypropylene plastic vial. For selective reaction monitoring (SRM) analysis, 100 μL of sample was added to 3 μL 100 μm kynurenine D6 and 3 μL 1 mm tryphtophan 13C11 (Cambridge Isotope Laboratories, Inc., Tewksbury, MA, USA) prior to protein precipitation. Samples were vacuum-dried and diluted to 10−3 for tryptophan and 10−2 for kynurenine with load buffer.
UPLC-MS analysis
For UPLC-MSe analysis, a Waters Acquity UPLC coupled to a Waters Synapt G2 HDMS quadrupole orthogonal acceleration time of flight mass spectrometer was used. A Waters Acquity BEH C18 2.1×100 mm column (1.7 μm diameter particles) at 35°C was used during the following 26 minutes gradient separation with A: Water containing 0.1% formic acid; B: high-performance liquid chromatography grade acetonitrile (Fisher Scientific, Pittsburg, PA, USA) containing 0.1% formic acid, at a flow rate of 0.4 mL/minute: 3% B, 0–3 minutes; 3% B–97% B, 3–18 minutes; 97% B, 18–21 minutes; 97% B–3% B, 21–23 minutes; 3% B 23–26 minutes. Simultaneous low- and high-collision energy (CE) mass spectra were collected in centroid mode over the range mass/charge (m/z) 100–1,200 every 0.1 second during the chromatographic separation. MSe parameters in positive electrospray ionization mode were as follows: capillary, 0.30 kV; sampling cone, 35.0 V; extraction cone, 4.0 V; desolvation gas flow, 800 L/hour; source temperature, 100°C; desolvation temperature, 350°C; cone gas flow, 20 L/hour; trap CE, off (low CE collection), ramp 15–65 V (high CE collection); Lockspray configuration consisted of infusion of a 5 μg/mL solution of leucine-enkephalin (Waters); and acquisition of one mass spectrum (0.2 second scan, m/z 100–1,200) every 10 seconds. Three lockspray m/z measurements of protonated leucine-enkephalin were averaged and used to apply corrections to measured m/z values during the course of the analysis. The R software package RAMClustR was used for analyte alignment and feature detection.9
SRM analysis of tryptophan and kynurenine
Samples (10 μL) for SRM analysis were subjected to injection using an Agilent autosampler with an analytical Acquity UPLC BEH C18, 1.7 μm, 2.1×50 mm column fit with an Acquity UPLC BEH shield RP18 precolumn connected to the Applied Biosystem 5500 iontrap fit with a turbo V electrospray source. The samples were subjected to a linear gradient of 2% acetonitrile, 0.1% formic acid to 98% acetonitrile 0.1% formic acid for 10 minutes at a column flow rate of 250 μL/minute. Transitions monitored are listed in Table S1, and these were established using the instrument optimization mode with direct injection of native and heavy tryptophan and kynurenin. The data were analyzed using MultiQuant™ (ABI Sciex, Framingham, MA, USA), which provided the peak area ratio of tryptophan/tryptophan 13C11 and kynurenine/kynurenine D6 for the transitions. A standard curve was constructed using concentration ratios of tryptophan/tryptophan 13C11 and kynurenine/kynurenine D6 (Cambridge Isotope Laboritories, Inc., Tewksbury, MA, USA) from picomole to nanomole in 10 μL. Samples were run in duplicate and concentrations were determined from the standard curve. The correlation across duplicates for tryptophan was 0.9839 and for kynurenine was 0.9589.
Statistics
The processed data from the MS experiments were transformed by adding 1 to all data points and taking the logarithm as the marginal distributions of the feature data were positively skewed (1 was added as many zeroes were observed in the data). To test for differences between cases and controls, a mixed-effects model was used with random effects for cluster membership (a case plus its two matched controls formed a cluster) and fixed effects for case–control status. The p-values from the test of no group effect were then adjusted for multiple comparisons using the method of Storey, and a false discovery rate (FDR) of 0.05 was used to select features for further investigation.10 To test for differences between day 0 and day 30 among the cases, a paired t-test was used and adjustments for multiple hypothesis testing were conducted in the same manner as the test for differences between cases and controls. For the analysis of the data arising from the SRM experiments, a single mixed-effects model was fit that allowed testing for differences between cases and controls and for changes from day 0 to day 30 for tryptophan and kynurenine and their ratio. No adjustment was made for multiple hypotheses testing after fitting these models. These models also included the effects of sex, age, pack-years of smoking, lung function, and medications (steroids and antibiotics) as fixed effects and case–control group and subject as random effects (with subject effects nested within the case–control group effects) for the SRM experiments.
Results
Characteristics of study participants
We analyzed two longitudinal plasma samples from 33 individuals with a COPD exacerbation who were recruited as part of the LEUKO study. Each subject had a plasma sample obtained within the first 24 hours of being hospitalized for a COPD exacerbation and a follow-up plasma sample obtained 30 days later. Controls consisted of individuals at high risk of developing AECOPD, but were currently free from an exacerbation (Table 1). All subjects had at least a ten pack-year history of smoking, with 27% of cases and 24% of controls reporting active smoking at the time of enrollment. The FEV1 ranged in severity from moderate to very severe according to the GOLD classification (GOLD II–IV), with the average FEV1 in the GOLD class III. The majority of subjects were on long- and short-acting β-agonists. The main difference in medications was more steroid and antibiotic use in the day 0 group compared to both day 30 and controls.
Analyte profiles
We detected over 3,000 analyte signals in the plasma. An analyte refers to a discreet m/z and retention time on the mass spectrometer that correlates with a yet unknown metabolite. Currently, there is no accepted methodology to quantify analytes detected by mass spectrometry. For our study, relative abundance was measured as the sum of all peak intensities detected by the mass spectrometer that associated with the given analyte. Using a mixed-effect model to account for the pairing of multiple controls to cases, we identified 583 analytes at 10% FDR and 386 analytes at a 5% FDR that were significantly different between samples at day 0 (cases) and controls. Using a paired t-test, we detected 54 analytes at 10% FDR and 34 analytes at a 5% FDR that were significantly different between samples at day 0 and day 30. A search within the Metlin library identified that several of the analytes found were consistent with the medications zileuton and prednisolone. These medications were anticipated since zileuton was the interventional drug administered in the LEUKO trial and since treatment with steroids is a common practice in an AECOPD. No other medications were identified. These analytes were eliminated, leaving 31 and 379 analytes at 5% FDR in the two groups (day 0 vs day 30 and controls vs day 0), respectively (Tables S2 and S3). We found considerable overlap in the analytes between the two groups as depicted in the Venn diagram (Figure 1). Of the 23 analytes in common between the two groups, nine are consistent with small peptides consisting of 3–4 amino acids and three are consistent with lipids (Table S2). Figure 2 demonstrates 25 representative analytes that are differentially expressed comparing day 0 to day 30, plus values for their respective controls. This figure demonstrates that the pattern of analytes show a similar value comparing day 0 and controls.
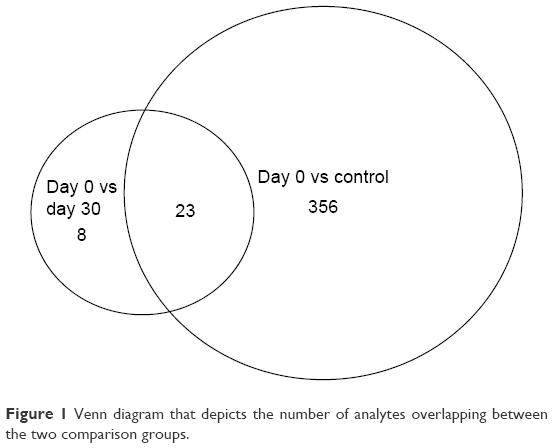 | Figure 1 Venn diagram that depicts the number of analytes overlapping between the two comparison groups. |
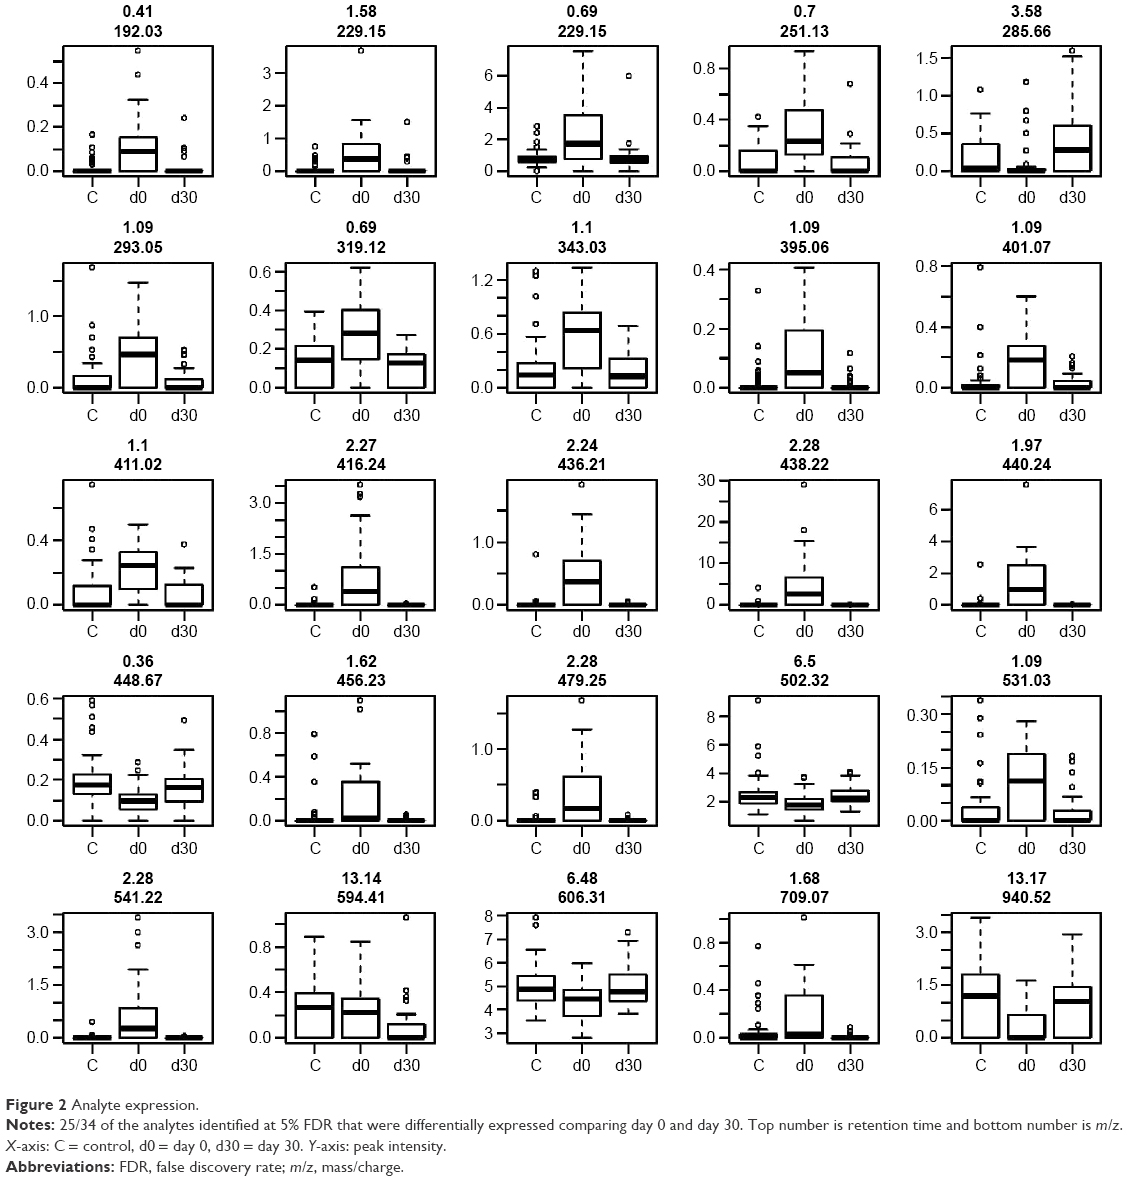 | Figure 2 Analyte expression. |
Tryptophan catabolism
One of the analytes differentially expressed in day 0 subjects compared to controls was consistent with the essential amino acid tryptophan (Trp, m/z 204.23 and 257.09 methoxytryptophan). Since tryptophan catabolism has been associated with both immune modulation and infection, we sought to quantify tryptophan and its major metabolite, kynurenine. To identify tryptophan and measure its concentration, we performed SRM. IDO is the main inducible and rate-limiting enzyme involved in tryptophan catabolism, with kynurenine as the main metabolite of the IDO pathway. IDO activity is expressed as a ratio of kynurenine to tryptophan (Kyn/Trp). Statistical models included controlling for the effects of sex, age, pack years, lung function, and medications (steroids and antibiotics). We found that tryptophan was lower at day 30 compared to day 0 and higher in controls than day 0, but this was not statistically significant after controlling for the potential confounders (Figure 3). We did find that kynurenine levels were significantly lower at day 30 compared to day 0 (P=0.00292, Figure 3). With respect to IDO activity as measured by the Kyn/Trp ratio, Kyn/Trp was higher at day 0 compared to day 30 (P=0.0352) and higher at day 0 than in controls (P=0.0338, Figure 4).
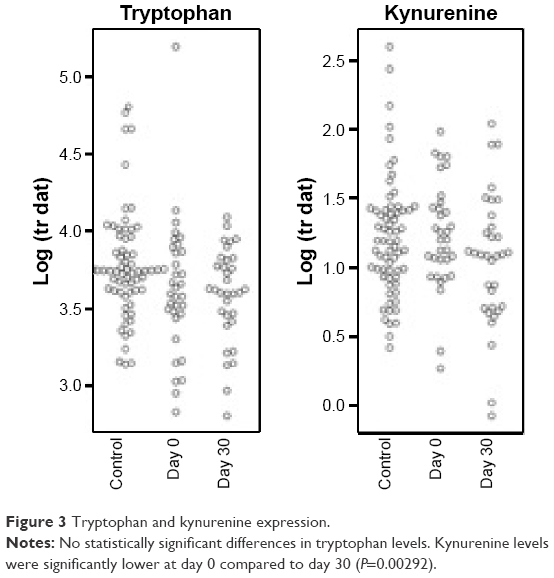 | Figure 3 Tryptophan and kynurenine expression. |
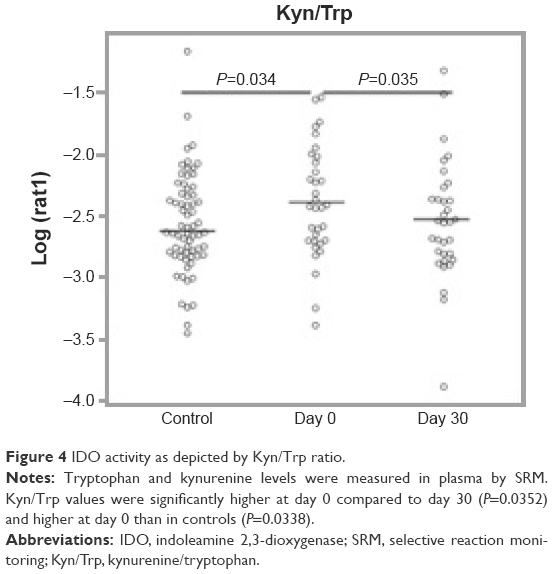 | Figure 4 IDO activity as depicted by Kyn/Trp ratio. |
Discussion
Patients with COPD often experience exacerbations, and, currently, there is no biomarker that either predicts or identifies those with an exacerbation. In this study, we identified a plasma metabolomic biosignature in COPD patients with an acute exacerbation. The largest profile was seen in COPD patients with an AECOPD (day 0) compared to matched controls. A smaller biosignature was identified in day 0 compared to day 30, and many of these analytes overlapped with the larger profile. This smaller biosignature suggests that full recovery from the exacerbation may not yet exist by day 30. This is not a surprise since one in eleven COPD patients are readmitted within 30 days following hospitalization.11 Therefore, full recovery following a severe exacerbation may take longer than 30 days. As expected among these analytes, zileuton and prednisolone were identified. Zileuton was the parent trial study drug, and patients are often immediately placed on prednisone upon admission for an AECOPD.
One of the analytes in the profile comparing day 0 to controls was consistent with tryptophan. We used SRM to accurately measure tryptophan and its main metabolite kynurenine. We found that tryptophan levels are reduced early in the course of an AECOPD (day 0) compared to “healthy” COPD patients. This decrease in tryptophan is consistent with an increased catabolism through the IDO pathway as demonstrated by an increase in Kyn/Trp. After 30 days of recovery from an AECOPD, tryptophan levels remained significantly lower compared to control subjects; however, IDO activity was no longer increased at that time. This suggests that tryptophan catabolism was decreasing by day 30, but was incomplete. In this study, longitudinal samples were limited to 30 days; therefore, we do not know whether tryptophan levels eventually normalized, similar to controls.
Tryptophan is an essential amino acid and its deficiency limits protein synthesis, resulting in cellular dysfunction and decreased proliferation. Teleologically, it is felt that tryptophan catabolism is beneficial during infection, where a decline in tryptophan levels inhibits bacterial proliferation. Recent studies have also implicated tryptophan catabolism through the IDO pathway as having antimicrobial effects. The list of pathogens sensitive to tryptophan catabolism via IDO includes respiratory pathogens common in AECOPD such as Streptococci.12 A decrease in serum tryptophan levels has been reported in pulmonary infections and predicts prognosis in both tuberculosis and community-acquired pneumonia.13,14 Since AECOPD is often due to respiratory tract infections, it is a possibility that tryptophan catabolism in that setting is actually a biomarker for infection.
Tryptophan catabolism is also an important factor in the lung microenvironment that influences immune responses. Tryptophan catabolism occurs predominantly through the activation of the enzyme IDO,15,16 producing metabolites of the kynurenine pathway. Most of the effects of tryptophan catabolism come from accumulation of its active metabolites, such as kynurenine, rather than tryptophan depletion.15,16 The generation of kynurenine through IDO activation leads to immune tolerance and an anti-inflammatory effect through the proliferation of Treg FoxP3 cells and suppression of Th17 cells.16,17 The immune tolerance effect of IDO activation has been implicated in lung cancer and HIV infection.18–22 Thus, tryptophan depletion and IDO activation have both antimicrobial and anti-inflammatory effects.12
Although decreases in tryptophan and IDO activation have been reported in lung cancer and certain lung infections, little is known of its role in COPD. Perturbations in amino acids in both serum and exhaled breath have been described in COPD using mass spectrometry and NMR.23,24 Ubhi et al24 measured amino acid metabolism using mass spectrometry in COPD patients from the ECLIPSE cohort and found tryptophan levels were decreased in the serum of COPD patients with emphysema.24 However, they did not assess IDO activity. However, Maneechotesuwan et al25 found IDO activity decreased in the sputum of COPD patients that correlated with severity of disease and a reversal between the IL-10 and IL-17A balance. This suggests that a decrease in IDO activity within sputum creates an environment supporting neutrophilic inflammation.25 In our study, we found tryptophan levels to be decreased in the plasma of patients with an AECOPD consistent with an activation of IDO, as measured by kynurenine and tryptophan ratios. This increase in IDO activity was still present at day 30, but to a lesser extent. A decrease in tryptophan would have an antimicrobial effect that would be beneficial in AECOPD, along with an anti-inflammatory effect to mitigate airway injury. The role of tryptophan catabolism in COPD and possible link to lung cancer remains unknown.
Many of the analytes that were common between the two biosignatures were multiply charged and had a retention time consistent with peptides consisting of 2–4 amino acids. Peptides as biomarkers for lung disease is not a new concept – over 30 years ago, Kucich et al26 detected elevated levels of unspecified serum peptides in COPD patients as measured by immunoassays. Using metabolomic profiling, protein degradation products have been detected in the serum of COPD patients, particularly those with emphysema and cachexia.27 We have reported peptides in bronchoalveolar lavage fluid in COPD, many consistent with elastase activity.28 Further studies are necessary to determine if these would serve as a biomarker for AECOPD.
There are several limitations of this study. First, our longitudinal samples were limited to day 30 post-AECOPD. Therefore, we do not know whether tryptophan levels remained low or continued to increase relative to controls. To identify biomarkers of AECOPD, we matched controls for lung function who were also frequent exacerbators, but who had not experienced an exacerbation for at least 1 month. Therefore, we do not know whether frequent exacerbators had different tryptophan levels and catabolism relative to healthy controls or COPD patients who do not experience exacerbations. Therefore, the role of tryptophan catabolism in frequent or prolonged exacerbations warrants future investigation.
Conclusion
Patients with an AECOPD have a unique plasma metabolomic signature at the initiation of their exacerbation. This signature includes an increase in the Kyn/Trp ratio consistent with an increase in IDO activity. The role of tryptophan catabolism during AECOPD warrants further investigation.
Acknowledgments
We thank the University of Minnesota Supercomputing Institute for technical support and the University of Minnesota Chemistry Department for use of the Waters Synapt G2 HDMS quadrupole orthogonal acceleration time of flight mass spectrometer that was used in the discovery phase, and Dr Connett and Helen Voekler of the MACRO and LEUKO data coordinating center for samples and database information. We thank Drs Richard Albert and Stephen Lazarus for critical review of the manuscript. This work was supported by grants from the National Heart, Lung, and Blood Institute of the National Institutes of Health (U10 HL074407, U10 HL074408, U10HL074409, U10 HL074416, U10 HL074418, U10 HL074422, U10 HL074424, U10 HL074428, U10 HL074431, U10 HL074439, and U10 HL074441) and NIH T32 HL07741 (Sandri).
Author contributions
CW, MG, and TG conceptualized the project; MG, CB, BW, SH, and BS carried out experiments; CW, MG, CR, and CB carried out data analysis, CW and MG participated in writing the manuscript, and TG, PW, CB, BW, and BS critically reviewed the manuscript. All authors contributed toward data analysis, drafting and critically revising the paper and agree to be accountable for all aspects of the work.
Disclosure
The authors report no conflicts of interests in this work.
References
Lozano R, Naghavi M, Foreman K, et al. Global and regional mortality from 235 causes of death for 20 age groups in 1990 and 2010: a systematic analysis for the Global Burden of Disease Study 2010. Lancet. 2012;380(9859):2095–2128. | ||
Minino AM, Xu J, Kochanek KD. Deaths: preliminary data for 2008. National vital statistics reports: from the Centers for Disease Control and Prevention, National Center for Health Statistics. National Vital Statistics System. 2010;59(2):1–52. | ||
Seemungal TA, Donaldson GC, Paul EA, Bestall JC, Jeffries DJ, Wedzicha JA. Effect of exacerbation on quality of life in patients with chronic obstructive pulmonary disease. Am J Respir Crit Care Med. 1998;157(5 Pt 1):1418–1422. | ||
Donaldson GC, Seemungal TA, Bhowmik A, Wedzicha JA. Relationship between exacerbation frequency and lung function decline in chronic obstructive pulmonary disease. Thorax. 2002;57(10):847–852. | ||
Soler-Cataluna JJ, Martinez-Garcia MA, Roman Sanchez P, Salcedo E, Navarro M, Ochando R. Severe acute exacerbations and mortality in patients with chronic obstructive pulmonary disease. Thorax. 2005;60(11):925–931. | ||
Kanner RE, Anthonisen NR, Connett JE; Lung Health Study Research G. Lower respiratory illnesses promote FEV(1) decline in current smokers but not ex-smokers with mild chronic obstructive pulmonary disease: results from the lung health study. Am J Respir Crit Care Med. 2001;164(3):358–364. | ||
Woodruff PG, Albert RK, Bailey WC, et al. Randomized trial of zileuton for treatment of COPD exacerbations requiring hospitalization. COPD. 2011;8(1):21–29. | ||
Albert RK, Connett J, Bailey WC, et al. Azithromycin for prevention of exacerbations of COPD. N Engl J Med. 2011;365(8):689–698. | ||
Broeckling CD, Afsar FA, Neumann S, Ben-Hur A, Prenni JE. RAMClust: a novel feature clustering method enables spectral-matching-based annotation for metabolomics data. Anal Chem. 2014;86(14):6812–6817. | ||
Storey JD. A direct approach to false discovery rates. J R Soc Stat Soc. 2002;B(64):479–498. | ||
Sharif R, Parekh TM, Pierson KS, Kuo YF, Sharma G. Predictors of early readmission among patients 40 to 64 years of age hospitalized for chronic obstructive pulmonary disease. Ann Am Thorac Soc. 2014;11(5):685–694. | ||
MacKenzie CR, Heseler K, Muller A, Daubener W. Role of indoleamine 2,3-dioxygenase in antimicrobial defence and immuno-regulation: tryptophan depletion versus production of toxic kynurenines. Curr Drug Metab. 2007;8(3):237–244. | ||
Suzuki Y, Suda T, Asada K, et al. Serum indoleamine 2,3-dioxygenase activity predicts prognosis of pulmonary tuberculosis. Clin Vaccine Immunol. 2012;19(3):436–442. | ||
Suzuki Y, Suda T, Yokomura K, et al. Serum activity of indoleamine 2,3-dioxygenase predicts prognosis of community-acquired pneumonia. J Infect. 2011;63(3):215–222. | ||
Takikawa O. Biochemical and medical aspects of the indoleamine 2,3-dioxygenase-initiated L-tryptophan metabolism. Biochem Biophys Res Commun. 2005;338(1):12–19. | ||
Stone TW, Stoy N, Darlington LG. An expanding range of targets for kynurenine metabolites of tryptophan. Trends Pharmacol Sci. 2013;34(2):136–143. | ||
Moffett JR, Namboodiri MA. Tryptophan and the immune response. Immunol Cell Biol. 2003;81(4):247–265. | ||
Jenabian MA, Patel M, Kema I, et al. Distinct tryptophan catabolism and Th17/Treg balance in HIV progressors and elite controllers. PLoS One. 2013;8(10):e78146. | ||
Maneglier B, Malleret B, Guillemin GJ, et al. Modulation of indoleamine-2,3-dioxygenase expression and activity by HIV-1 in human macrophages. Fundam Clin Pharmacol. 2009;23(5):573–581. | ||
Platten M, Wick W, Van den Eynde BJ. Tryptophan catabolism in cancer: beyond IDO and tryptophan depletion. Cancer Res. 2012;72(21):5435–5440. | ||
Prendergast GC. Immune escape as a fundamental trait of cancer: focus on IDO. Oncogene. 2008;27(28):3889–3900. | ||
Engin AB, Ozkan Y, Fuchs D, Yardim-Akaydin S. Increased tryptophan degradation in patients with bronchus carcinoma. Eur J Cancer Care. 2010;19(6):803–808. | ||
Bertini I, Luchinat C, Miniati M, Monti S, Tenori L. Phenotyping COPD by 1H NMR metabolomics of exhaled breath condensate. Metabolomics. 2014;10:302–311. | ||
Ubhi BK, Cheng KK, Dong J, et al. Targeted metabolomics identifies perturbations in amino acid metabolism that sub-classify patients with COPD. Mol biosyst. 2012;8(12):3125–3133. | ||
Maneechotesuwan K, Kasetsinsombat K, Wongkajornsilp A, Barnes PJ. Decreased indoleamine 2,3-dioxygenase activity and IL-10/IL-17A ratio in patients with COPD. Thorax. 2013;68(4):330–337. | ||
Kucich U, Christner P, Lippmann M, et al. Immunologic measurement of elastin-derived peptides in human serum. Am Rev Respir Dis. 1983;127(2):S28–S30. | ||
Ubhi BK, Riley JH, Shaw PA, et al. Metabolic profiling detects biomarkers of protein degradation in COPD patients. Eur Respir J. 2012;40(2):345–355. | ||
Wendt CH, Nelsestuen G, Harvey S, Gulcev M, Stone M, Reilly C. Peptides in bronchoalveolar lavage in chronic obstructive pulmonary disease. PloS One. 2016;11(5):e0155724. |
Supplementary materials
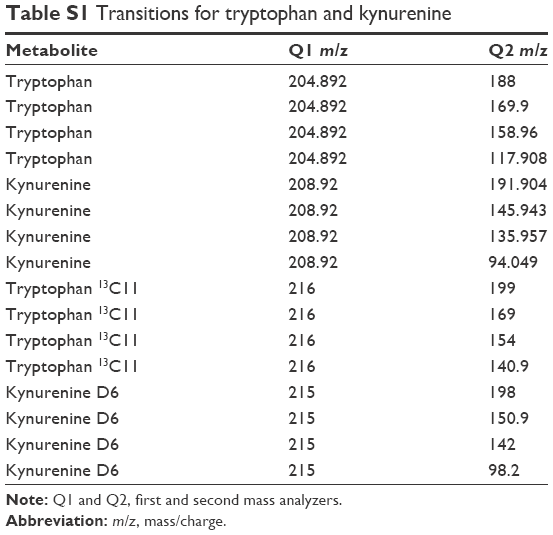 | Table S1 Transitions for tryptophan and kynurenine |
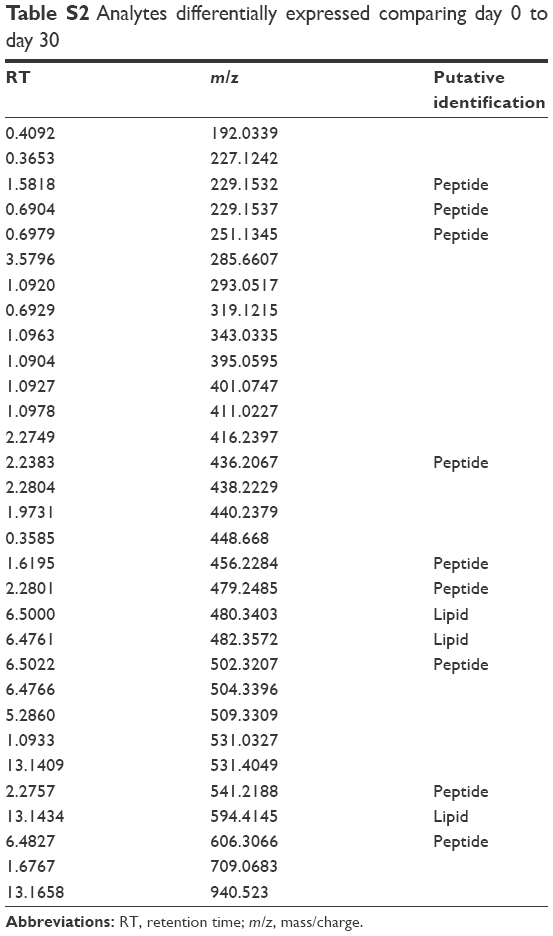 | Table S2 Analytes differentially expressed comparing day 0 to day 30 |
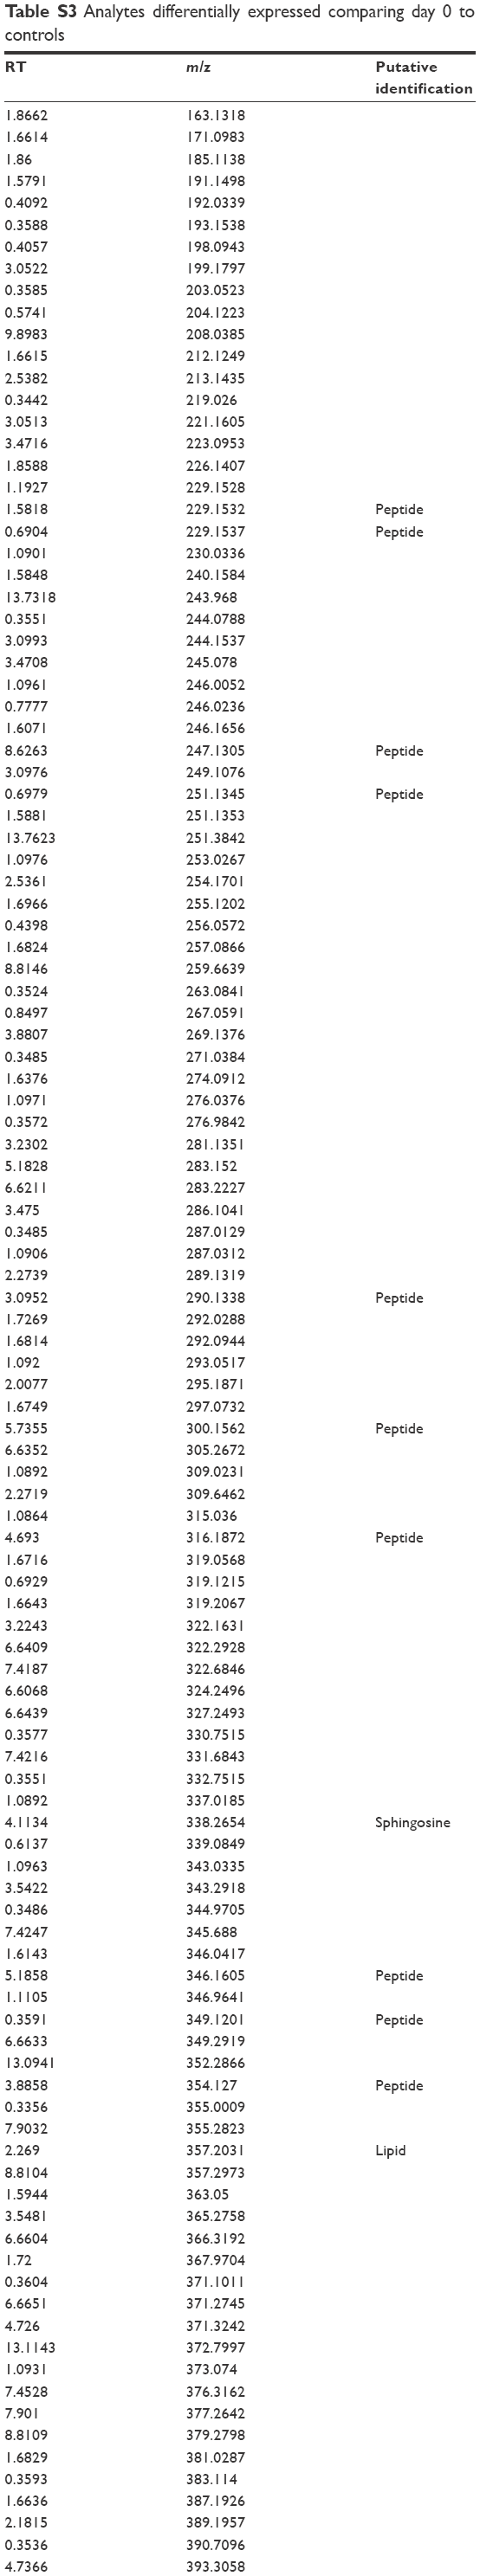 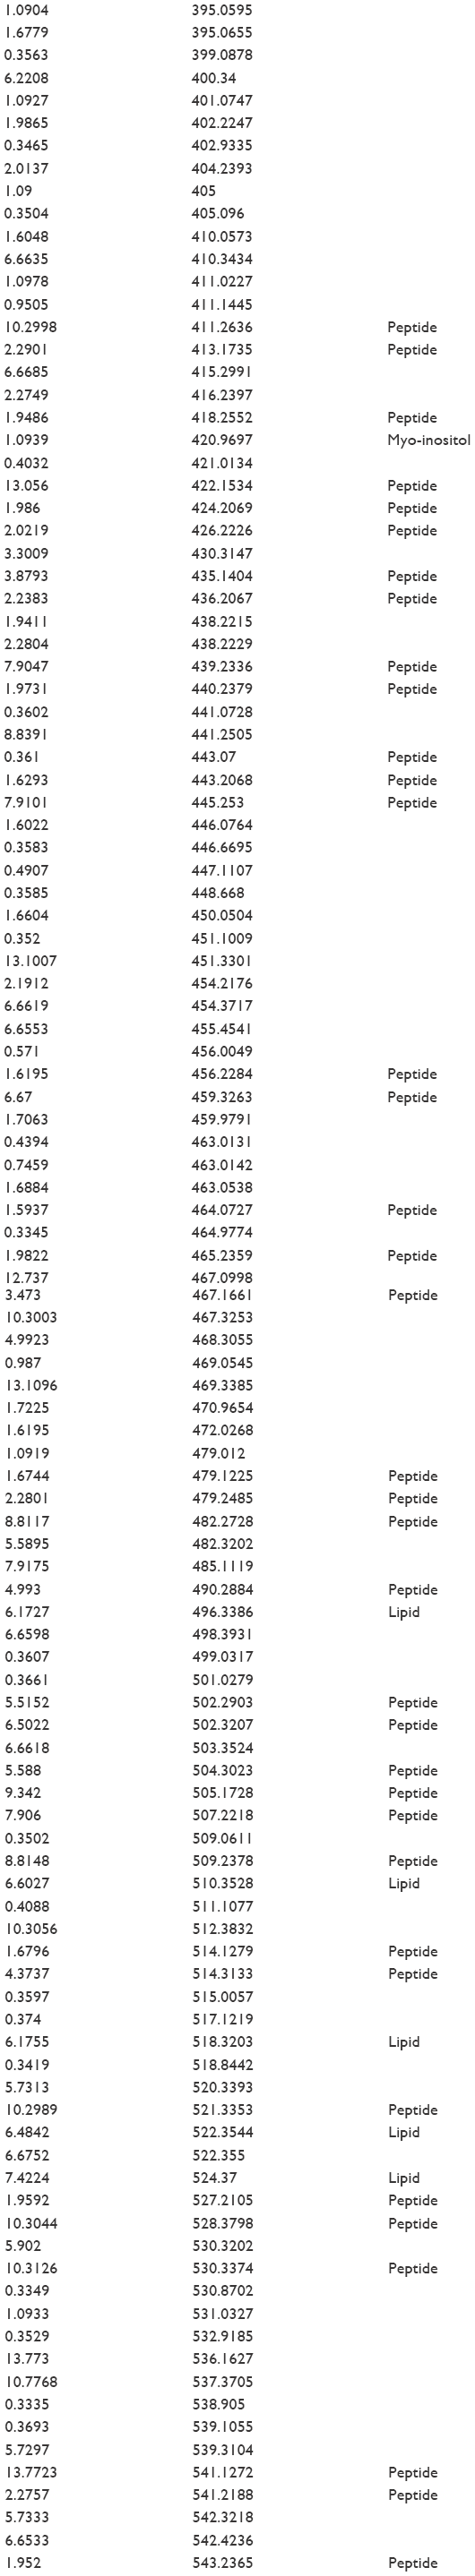 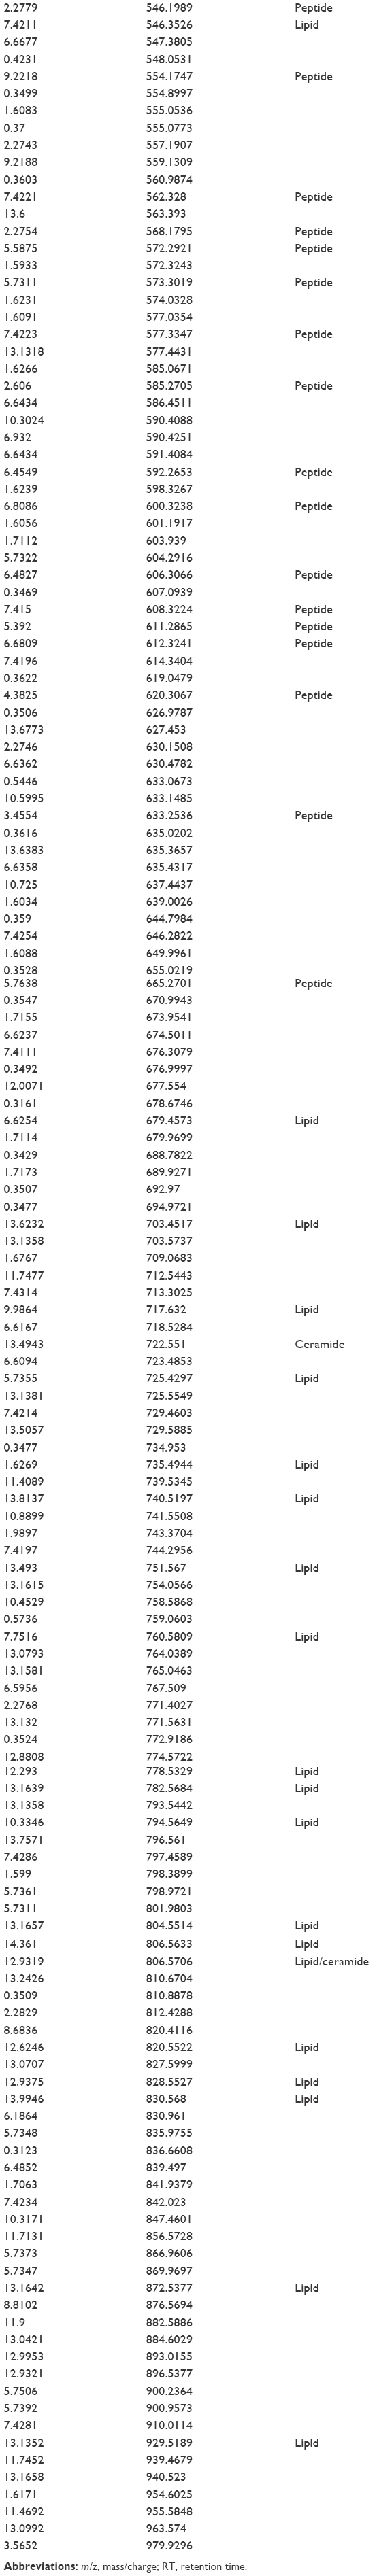 | Table S3 Analytes differentially expressed comparing day 0 to controls |
 © 2016 The Author(s). This work is published and licensed by Dove Medical Press Limited. The full terms of this license are available at https://www.dovepress.com/terms.php and incorporate the Creative Commons Attribution - Non Commercial (unported, v3.0) License.
By accessing the work you hereby accept the Terms. Non-commercial uses of the work are permitted without any further permission from Dove Medical Press Limited, provided the work is properly attributed. For permission for commercial use of this work, please see paragraphs 4.2 and 5 of our Terms.
© 2016 The Author(s). This work is published and licensed by Dove Medical Press Limited. The full terms of this license are available at https://www.dovepress.com/terms.php and incorporate the Creative Commons Attribution - Non Commercial (unported, v3.0) License.
By accessing the work you hereby accept the Terms. Non-commercial uses of the work are permitted without any further permission from Dove Medical Press Limited, provided the work is properly attributed. For permission for commercial use of this work, please see paragraphs 4.2 and 5 of our Terms.