Back to Journals » Patient Related Outcome Measures » Volume 10
Truthfulness in patient-reported outcomes: factors affecting patients’ responses and impact on data quality
Authors Chang EM ![]() , Gillespie EF, Shaverdian N
, Gillespie EF, Shaverdian N
Received 24 January 2019
Accepted for publication 2 May 2019
Published 11 June 2019 Volume 2019:10 Pages 171—186
DOI https://doi.org/10.2147/PROM.S178344
Checked for plagiarism Yes
Review by Single anonymous peer review
Peer reviewer comments 2
Editor who approved publication: Dr Robert Howland
Eric M Chang,1 Erin F Gillespie,2 Narek Shaverdian2
1Department of Radiation Oncology, University of California Los Angeles, Los Angeles, CA, USA; 2Department of Radiation Oncology, Memorial Sloan Kettering Cancer Center, New York, NY, USA
Abstract: The use of patient-reported outcome (PRO) measures in research and clinical care has expanded dramatically, reflective of an increasing recognition of patient-centeredness as an important aspect of high-quality health care. Given this rapid expansion, ensuring that data collected using PRO measures is of high quality is crucial for their continued successful application. Because of the subjective nature of the outcomes assessed, there are many factors that may influence patients’ responses and thus challenge the overall quality of the data. In this review, we discuss the multiple factors that may affect patients’ responses on PRO measures. These factors may arise during instrument development and administration or secondary to patient-level response behaviors. We further examine the relevant literature to delineate how these factors may impact data quality and review methods for accounting for these factors. Consideration of such factors is critical to ensuring data collected truthfully reflects patients’ evaluations and provides accurate conclusions.
Keywords: patient-reported outcomes, data quality, bias, research practices
Introduction
Historically, formal evaluations of disease symptoms or treatment-related toxicity from the patient’s perspective have been undervalued. Potentially due to its inherently subjective nature, misperceptions were held by clinicians regarding the reliability of this approach, further hindered by traditions favoring clinician-assessed outcome measures.1 However, in recent years, inclusion of an assessment of the patient’s experience of a disease or treatment, also known as patient-reported outcomes (PRO), has become increasingly valued in the clinical trial setting and within routine care. For instance, the 36-item Short-Form Health Survey (SF36) is a classic example of a PRO readily used to assess a respondent’s health-related quality of life (HRQOL). The SF36 evaluates eight generic health concepts, such as physical functioning and mental health, and has been employed for multiple purposes, from use as a trial end point in academic research to routine monitoring of outcomes by managed-care organizations, including Medicare.2,3
Proliferation in the use of PROs reflects increasing recognition of HRQOL as an important outcome in the evaluation of a treatment, as well as greater understanding of the discrepancy between clinicians’ and patients’ reports of outcomes. In effect, the subjective nature of PRO evaluation has become an advantage of the approach, as multiple studies have demonstrated that clinician-reported assessments tend to underestimate burden and severity of symptoms compared with patient ratings.4 This discordance may be particularly pronounced for symptoms not directly observable by the clinician, such as pain and fatigue, and certain conditions, such as sexual dysfunction and emotional disorders, may only be reasonably assessed via patient report.5 Furthermore, there is evidence of wide variation in the symptom burden, adverse effects, and function of patients with similar physiological measures.1 Importantly, the uptake of PROs signifies an increasing focus on patient-centeredness as a critical component of high-quality health care, with use of PROs allowing the measurement of outcomes most significant to patients, beyond survival and major morbid events.6 Evidence suggests PRO use increases patient satisfaction and improves patient–provider communication, as well as overall patient HRQOL.7
As recognition of the importance of the patient experience has increased, applications of PRO measures have expanded as well. In routine care, by giving an assessment of the patient’s perspective of treatment, PROs may assist patients in making informed decisions about their care and aid clinicians in monitoring the progress of care. PROs may be additionally used to evaluate the quality of health services, and thus provide policy makers, payers, and other stakeholders metrics for setting reimbursement policies and tracking the performance of health-care organizations.8 In the clinical trial setting, by providing a measure to quantify how a patient feels or functions, PROs can be used as primary or secondary trial end points or serve to supplement adverse-event data collection. Application of PROs for these purposes is becoming more common, with an analysis of the ClinicalTrials.gov database indicating that 27% of all trials from 2007 to 2013 were identified as using one or more PRO measures.9 A pronounced increase was seen in oncology trials, with inclusion of PROs rising from 27% of trials in 2007 to 33% in 2013.9 In the US, increased PRO uptake has in part been driven by the Food and Drug Administration (FDA), which was mandated under the FDA Safety and Innovation Act “to develop and implement strategies to solicit the views of patients during the medical product development process and consider the perspectives of patients during regulatory discussions”. This commitment was further established under the fifth and sixth authorizations of the Prescription Drug User Fee Act as well as the 21st Century Cures Act, which include provisions for the FDA to support and provide guidance on patient-focused drug development.10,11 In 2009, the agency issued a final guidance for industry, promoting the use of PROs to support labeling claims in medical product development; however, labeling approvals on this basis remain rare.1,12 In an analysis of PRO-label claims rejected by the FDA from 2006 to 2010, primary reasons for denial included issues of fitness for purpose, study design, and data quality or interpretation, suggesting concerns about the overall validity of PRO measures.13,14
Given the rapid expansion in collection of PROs, assurance of high-quality data is paramount in their successful application toward improvement in health-care quality and policy. Various agencies and task forces have put forth guidelines for validation of PRO measures and review of data quality to ensure appropriate application of PRO findings in treatment and policy decisions and to support the continued drive for the use of PROs as trial end points.11,15 Due to the subjective nature of many of the outcomes assessed, there are multiple factors that may affect patients’ responses and thus threaten the overall quality of the data. Development of PROs is a complex process, involving iterative review and careful analysis of validity. Better understanding of these steps is critical in ensuring high-quality data are collected without introducing bias or misrepresenting patient reports.1 Following development of a PRO, factors in administration and data collection may further impact patient responses. The purpose of this review is to analyze the relevant literature examining the factors affecting patients’ responses in PROs and their impact on data quality. We review how PROs are developed and employed, and then examine how factors at each stage of this process can affect results.
PRO development: approach
In assessing the patient’s experience of a disease or treatment, PRO data are influenced by the patient’s values and attitudes, typically relying on the respondent’s self-report.16 Such self-report measures have recognized dependence on content-irrelevant factors that may affect responses.16–18 Significant research has gone into determining optimal methods for the development of PROs, in order to minimize bias and ensure the measures provide a valid estimate of the targeted construct.1 Therefore, in order to assess how bias may be introduced into results, it is first important to understand the process by which PROs are developed. PRO development is a multistep process, first involving the conceptualization of a model to assess the target construct, followed by defining specific measures and clinical validation (Figure 1).1 Multiple best-practice standards exist that have been set forth by various working groups to guide the development of novel PRO measures.16
 | Figure 1 The PRO instrument–development process. |
Once the need for a new PRO is identified, development begins with the definition of a conceptual model to describe the construct to be assessed. The broader understanding of an experience of disease or treatment must be focused to include only the concepts of interest, eg, in evaluating fatigue, certain components may be deemed relevant, such as energy level and impact on work, while other components may be considered less relevant, such as need for caregiver assistance.1 This process is facilitated by input from multiple sources, including literature reviews to assess how the construct has been previously described and domain experts to determine components of the construct that are commonly shared among patients and are clinically significant. Of key importance at this stage is gathering patient input, such as through individual interviews or focus groups.1 Patient input is critical to ensuring the components of the model are of interest to patients, speak to the patient experience, and capture concerns that may be less evident to researchers. For example, in adapting the PROversion of the Common Terminology Criteria for Adverse Events for patients undergoing radiation therapy, researchers conducted 389 extensive patient interviews to ensure solicited symptoms adequately reflected patient-reported toxicities while on treatment.19 The 2009 FDA guidance for industry on the use of PROs to support labeling claims strongly suggested sponsors include documentation of patient input in the development of the chosen PRO to support its validity.12
After the conceptual model has been defined, specific items to measure are generated and evaluated for inclusion. Items should be designed to evaluate a single idea to limit confounding and patient confusion. Significant consideration is required to select the appropriate scale and recall period that best capture the concept being evaluated.1 As PROs are often widely employed, researchers must ensure not only that items are comprehensible but also that they can be presented in a fashion accessible to a diverse population.20 At this stage, generated items undergo an iterative process of revision and refinement toward improvement. This may include an assessment of the items’ reading level and a linguistic review to identify aspects that may complicate translation into other languages.1 Cognitive interviews are employed, in which patients are asked to complete an item and then asked a series of questions to assess their understanding of the item and thought processes in choosing their response.1 These interviews may help identify remaining points of confusion and verify respondents’ understanding of an item is the same as researchers intended.
Once items have been selected, a PRO instrument then undergoes testing to gain a better understanding of its functionality and assess its validity. This generally involves administration to target populations and comparisons with other previously validated similar instruments if available.8 Clinical validation studies are essential to confirming the instrument reliably and accurately assesses the targeted construct across a wide variety of applications. In truth, PRO validation is a continuous process that is essentially never finished.1 Modifications made to the instrument throughout its life span must be reassessed, and performance in new settings or populations must be validated. For reference, a summary of characteristics reviewed by the FDA in evaluating PROs for labeling claims is included in Figure 2.
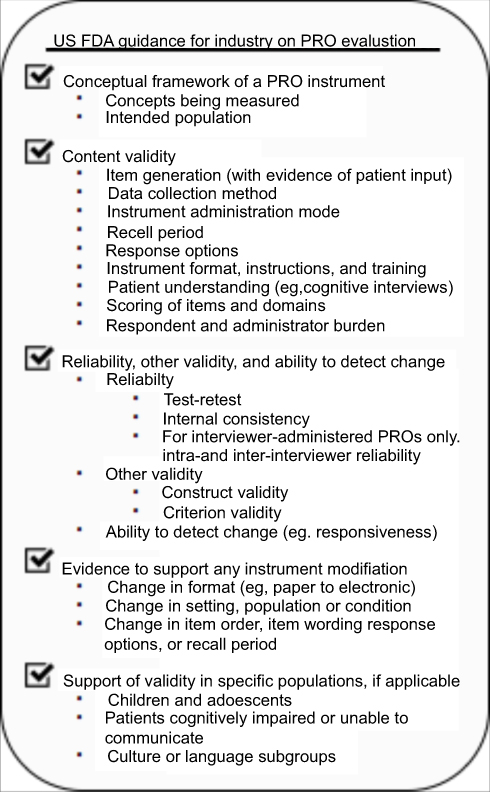 | Figure 2 US Food and Drug Administration (FDA) guidance for industry on PRO evaluation. Note: Data from FDA.12 Abbreviation: PRO, patient-reported outcome. |
PRO-development: factors affecting patient responses
Item design and selection
In designing a novel PRO, care must be taken at each step of the development process to account for factors that may affect patient responses (Figure 3). Likewise, in selecting a PRO instrument for use in the clinic or research, review of these efforts is crucial to understand how it will perform in the desired setting and to guide interpretation of the results. The specific wording, scales, and format of the instrument may significantly impact the quality of data collected. While guidance from regulatory bodies and working groups exists for this process, it is important to realize that decisions of which concepts are relevant to measure depend on the judgment of the researchers involved; therefore, in addition to understanding the particular performance of a PRO, evaluation of the level of patient input in the process is essential to ensuring patient-centeredness has been maintained.12,20–22 We detail key factors in item design and selection impacting patient responses here.
 | Figure 3 Factors impacting patient responses to PRO measures. Notes: Factors may occur during PRO-instrument development, during administration and data collection, or secondary to patient-level response behaviors. Abbreviation: PRO, patient-reported outcome. |
At the outset of development, researchers must decide whether the proposed PRO measure should be generic (ie, applicable to a wide range of conditions) or condition-specific (ie, designed for a particular disease, population, or function).8 This is often determined by the target population, as well as the outcomes of interest to be measured. For instance, a generic instrument may be used to assess more general QOL domains, such as satisfaction with social functioning, whereas condition-specific instruments may focus on symptoms unique to the treatment of a certain condition, such as ability to perform self-care in patients with neck pain. Generic instruments hold certain advantages, such as the ability to generalize results over multiple populations, allowing for comparison across groups.23 Given their wide applicability, including in groups without specific health conditions, reference values may be available, facilitating interpretation of scores and evaluation against population norms.8 However, due to their broad focus, generic instruments may be more time-consuming to complete, particularly for respondents for whom the concepts may be less relevant.23 Furthermore, generic measures may be less responsive than condition-specific measures to health changes in the target population. This may be of particular importance in the trial setting, where the aim may be to detect a clinically significant difference in outcome between treatment groups. For example, in a study comparing use of various measures of HRQOL in stroke survivors, the HRQOL in Stroke Patients, a condition-specific instrument, performed better on multiple parameters of validity and exhibited no significant floor/ceiling effects compared with the SF36, a generic instrument.24 With benefits and limitations to each approach, many advocate the use of both generic and condition-specific measures in a study to provide a comprehensive assessment.8 Hybrid measures, such as the Functional Assessment of Chronic Illness Therapy and the National Institutes of Health’s Patient Reported Outcomes Measurement Information System (PROMIS), include generic measures as well as condition-specific subscales to simplify the combination, and methods have been proposed for the efficient development of combined measures.8,25
Survey-based methods have an extensive history of use across multiple fields, with known sensitivity to the way in which respondents are asked to evaluate their experience; therefore, careful choice of the response scale used in an instrument is important to ensuring high-quality data.16 Multiple response scales have been used in PRO measures, though the most common include the verbal rating scale (VRS), numeric rating scale (NRS), and visual analogue scale (VAS; Figure 4). In the VRS, patients are presented with a list of adjectives describing various levels of intensity and asked to mark the adjective that best describes their experience. The NRS, in contrast, provides a numeric scale (eg, 0 for no pain and 10 for worst possible pain) and asks respondents to rate their experience using this scale. In the VAS, the scale is depicted as a vertical or horizontal line anchored at both ends with verbal descriptors (eg, “not at all tired” to “extremely tired”). Respondents are asked to put a mark on the line that best describes their experience.26 The chosen response scale may have important downstream effects on the usability of the instrument, its level of precision, quantitative properties of the data obtained (including range, SD, scoring, interpretation guidelines, and ability to detect change), and its applicability across different populations and collection methods. Factors in how the scale is employed may impact results as well, such as via the wording of the response options or placement of the anchors. For instance, in the use of the VRS, evidence indicates that response scales using the verbal descriptors of none/mild/moderate/severe/very severe and not at all/a little bit/moderately/quite a bit/very much are interpreted by respondents with the least variation from presumed fixed intervals compared with other descriptors. Of note, interpretation of certain descriptors may also depend on demographic and clinical factors, with implications for statistical adjustments.27 In the use of the VAS, consideration must be given to the length of the line provided, as the resultant score is determined by the distance between the lower anchor and the respondent’s mark.26 Once the type of scale has been chosen, researchers must also determine the optimal number of responses offered. For example, with the VRS, evidence indicates a 5-point scale may discriminate among respondents more effectively than a 3-point scale. Conversely, in the pediatric population, there is evidence children may be able to understand fewer response options than adults.26 The number of responses may additionally impact data completeness, with suggestions in the literature that 5-point scales reduce frustration and improve response rates compared with 7-point scales, though with the potential to reduce accuracy.28,29 If a Likert-type scale is used, an odd number of responses may allow respondents to choose a neutral response, whereas an even number can force patients to choose one side when describing their experience. Despite the importance of scale selection in influencing overall data quality, there is inconsistent empirical evidence suggesting which response scale may be best for assessing a targeted construct.26 Regardless, particularly in the trial setting, guidance recommends researchers make an effort to provide evidence justifying scale selection for the intended context.12
 | Figure 4 Examples of response scales used in PRO measures. Abbreviations: PRO, patient-reported outcome; VRS, verbal rating scale; NRS, numeric rating scale; VAS, visual analogue scale. |
In addition to selecting a response scale for an item, researchers must decide which specific time period respondents will be asked to characterize their health status, as this may influence the data collected.30 This recall period may be immediate (eg, “Rate your level of fatigue now"), in the recent past (eg, “Rate your level of fatigue over the past week"), or over more prolonged periods. The reliability and validity of a PRO may be impacted if the selected recall period is too long for respondents to recall their experience accurately. Conversely, a recall period that is too short may give insufficient time for an outcome of interest to develop or resolve.30 Systematic error introduced via inaccurate or incomplete recollection of events by respondents is known as “recall bias”.31 Factors that influence recall can be considered in two categories: those associated with the characteristics of the outcome itself (recency of the event, attributes of the event, or complexity of the event) and those associated with the meaning of the outcome to the patient (the significance of the event to the respondent, experiences that change how a patient values an event over time, or the patient’s mood at evaluation).30 In general, empirical evidence suggests rating variance increases and accuracy decreases as recall period is increased.30 Many PRO tools have large bodies of evidence dedicated to the nuances of how recall period impacts the data collected specific to that PRO. For instance, in a study evaluating the validity of the irritable-bowel syndrome version of the Work Productivity and Activity Impairment questionnaire (WPAI:IBS), scores using a 1-week recall period demonstrated significant correlation with 7-day average scores from daily symptom diaries; however, researchers noted that the most severe day in the 7-day diary had stronger influence on the WPAI:IBS score than the most recent day, suggesting respondents were not truly providing a summary of their experiences over the week, but rather were influenced by the most salient event.32 Given significant variation in how recall period impacts data quality, the optimal recall period will depend on the outcome assessed and the aim of the study at hand. No single recall period is applicable across all outcomes, though frameworks to assist in the selection of recall period have been devised.30 Care should be taken during validation studies to ensure the chosen recall period accurately captures the outcome of interest.
Data collected using self-report measures are known to be influenced by response-style effects, in which respondents systematically select options that do not reflect their true opinions.17 For example, extreme response style refers to the tendency to select the highest and lowest response categories of a scale, regardless of the underlying trait level or specific item content.16 While research suggests a respondent’s response style may be consistent across different scales and over time, there is evidence that how a question is presented may also drive response style.16,17 Multiple types of response styles have been described, with extreme response style, acquiescence response style, disacquiescence response style, and midpoint response style most studied in the literature (Table 1).17 Stimuli that may drive response style include the format of a scale, the way in which an instrument is administered, the cognitive effort required to understand a question, the wording of a question, and the relevance of a question to the target population. For instance, research indicates that selection of nine or more response categories may promote a midpoint response style, in which respondents are driven to choose the middle response on the scale.17 Response-style effects may have a wide impact on the data collected, affecting both univariate distributions (ie, means and variances) and multivariate distributions (ie, the magnitude of correlations between variables), with the impact determined by the characteristics of the response style. For example, in driving responses toward the midpoint, midpoint response style may bring means closer to the midpoint, decrease variance, and increase the magnitude of multivariate relationships. Response style is also heavily dependent on the personal characteristics of the respondent. These patient-level factors are discussed later in this review.
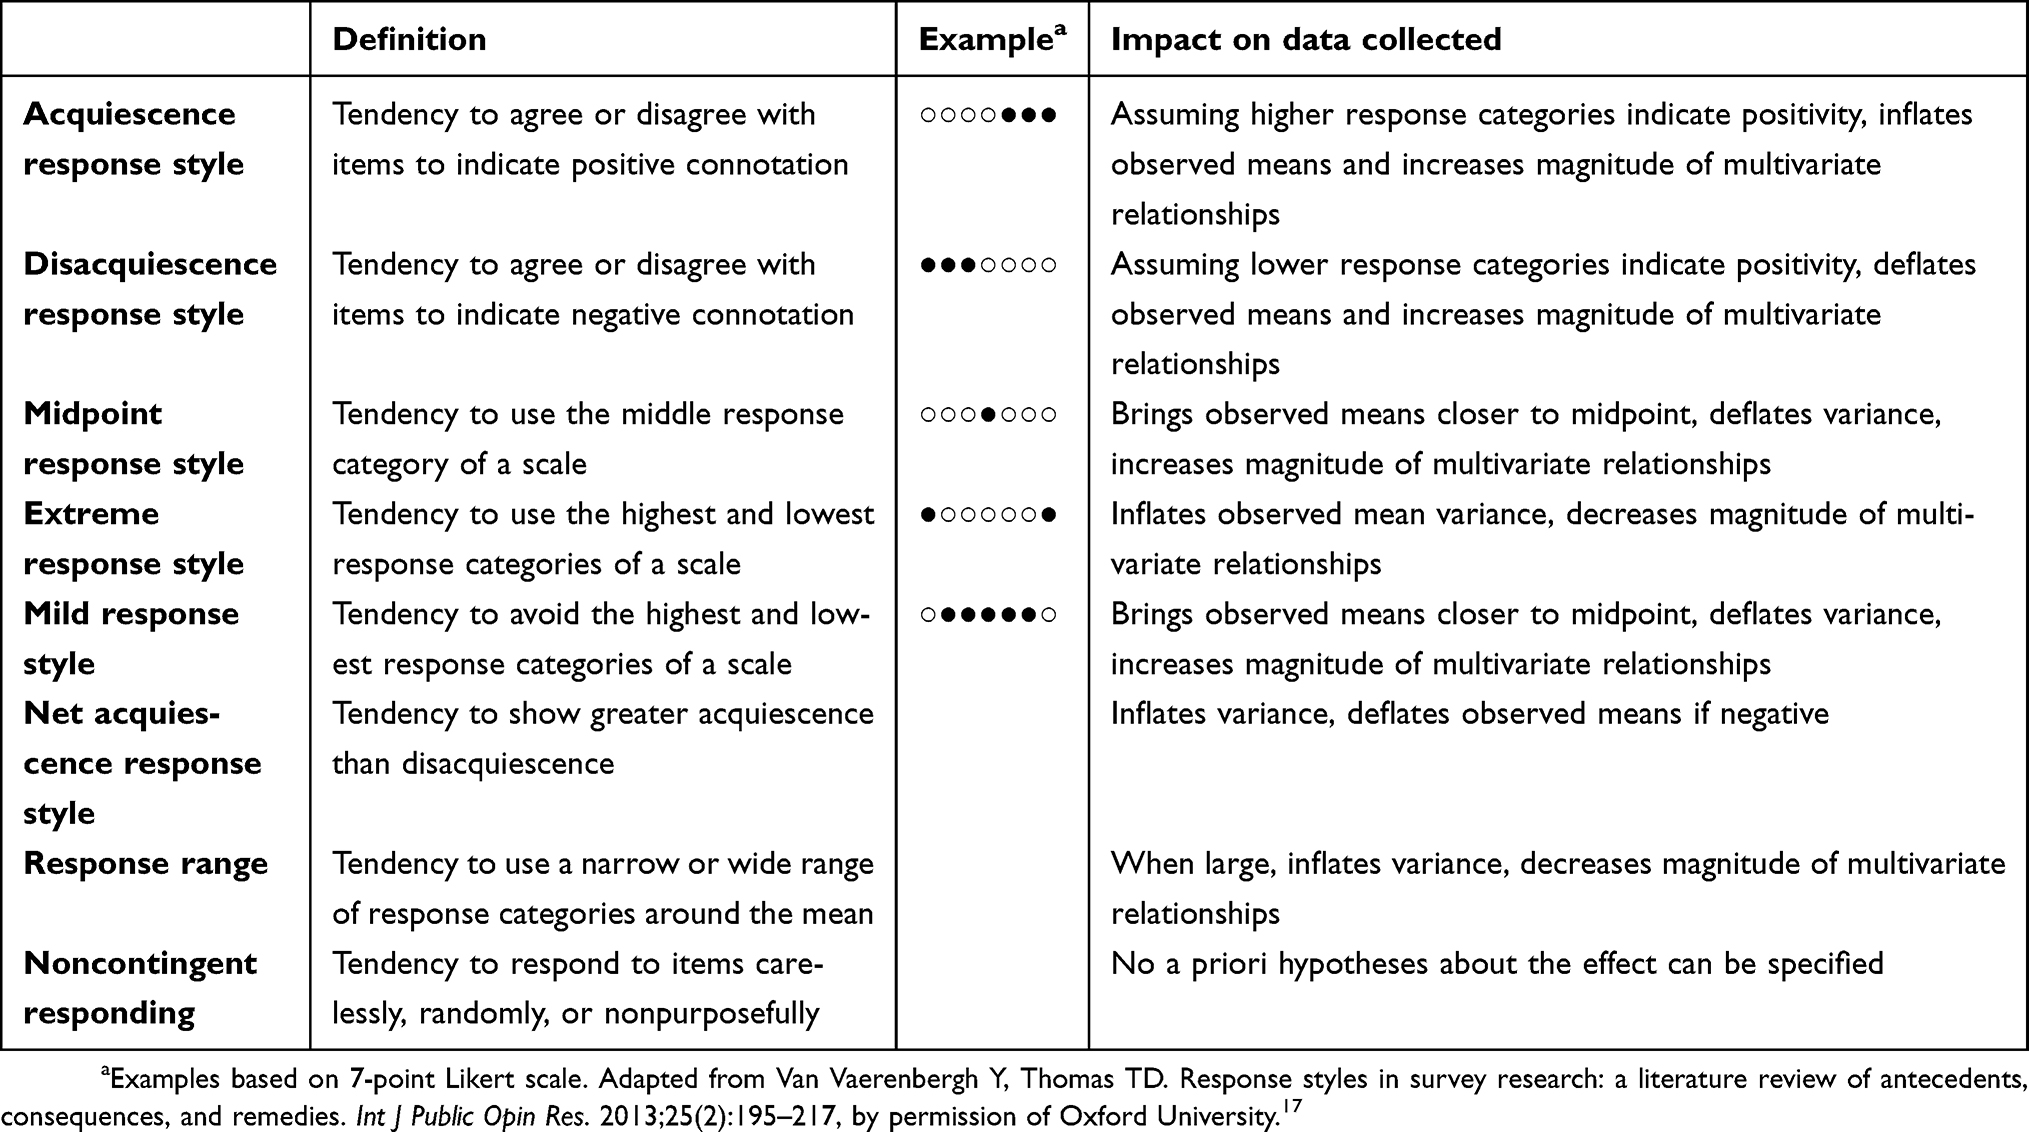 | Table 1 Types of response styles and impact on the data collected |
Initial testing and validation
Initial testing and validation serve to demonstrate that an instrument is measuring what it is proposed to measure, and thus are key steps in establishing the “truthfulness” of PRO data captured by an instrument.6 For example, in a review of 162 articles of PRO results in rotator-cuff disease, studies using PRO measures with less available evidence for their psychometric properties were found to have larger estimates of treatment effect than those using PRO measures with more available evidence, suggesting a potential impact of validation on conclusions made.33 While review of the methodology is beyond the scope of this review, we discuss certain concepts that need to be addressed during validation to give examples of how validation is crucial to ensuring data quality.
Validity is defined as the extent to which an instrument measures the intended construct.6 While modern validity theory subsumes these concepts into a single unified model, validity has classically been considered in three aspects: content validity, construct validity, and criterion validity.34 In initial testing and validation, content validity is the first to be examined, defined as the extent to which an instrument measures the relevant and representative aspects of the targeted construct.35 Evaluation of content validity involves a review of the development of a PRO and its underlying conceptual model. Qualitative work is an essential component, with the validity often dependent on the degree of patient and expert involvement in the elicitation of relevant concepts for inclusion.35 The International Society of Pharmacoeconomics and Outcomes Research (ISPOR) Good Research Practices Task Force has put forth recommendations to guide this process.21,22 For establishing content validity, the FDA recommends documentation of multiple aspects of an instrument’s development and attributes, such as item generation and scoring of items.12 While it may not supplant qualitative input, quantitative data collected during initial testing regarding item performance may help address core questions of content validity, such as whether the distribution of item responses collected adequately reflects the range of the targeted construct in the intended population.35 Establishing content validity is a critical aspect of PRO validation, with a study of the Fatigue Impact Scale, a widely used PRO measure of fatigue, finding the measure to be reliable and valid based on standard quantitative evaluations, but failing qualitative evaluation of content validity. The authors argued this may be why some fatigue treatments have been found ineffective in quantitative- but not in qualitative-based studies or clinical practice.36
Whereas content validity demonstrates that an instrument reflects the relevant aspects of a construct, construct validity indicates how well the instrument actually measures the construct it claims to evaluate.34 When previously validated instruments exist, construct validity can be demonstrated via correlation with similar instruments and divergence with dissimilar instruments.37 In rare cases, an established gold-standard criterion for self-report may exist (usually a longer version of the same instrument) to compare scores against. In these instances, this is defined as assessing criterion validity.37 However, in the absence of other instruments, evaluation of construct validity involves an assessment of how strongly an instrument supports predefined hypotheses between or among groups relevant to the targeted construct. This may be based on purely hypothetical relationships, eg, in breast cancer patients, demonstration of correlation between self-esteem scores and choice of breast-conserving versus mastectomy surgery may support the construct validity of the self-esteem score.37 Construct validity may also be demonstrated via confirmation of relationships with physical metrics. For example, in an evaluation of the Western Ontario and McMaster Universities Osteoarthritis Index (WOMAC), a measure of function in patients with osteoarthritis, WOMAC scores were able to differentiate between patients with mild/moderate versus severe osteoarthritis based on clinical assessment.38
An important aspect to consider when assessing the quality of data collected using a PRO is the instrument’s reliability, defined as the extent to which an instrument provides consistent results when the measured construct has not changed.37 Examination of reliability typically includes test–retest reliability, which evaluates the correlation between scores on repeat measures given to the same group of respondents over a period in which the respondents’ condition does not change.37 Evaluation of reliability may also involve estimation of internal consistency, defined as the extent of correlation between items that measure similar constructs, eg, a patient experiencing severe pain should rate the statements “My pain has been so bad it stopped me from what I was doing” and “My pain has been so bad it was hard to finish what I was doing” similarly.37 In general, assuming some correlation between items, increasing the number of items can enhance the reliability of an instrument, with researchers typically setting a minimum threshold of reliability instruments must meet for acceptable use.37 More recently, evaluation of reliability may further include an assessment of how an instrument performs at different levels along its underlying trait continuum. For instance, the statement “I don’t seem to care what happens to me” may provide more reliable results in patients experiencing high levels of depression compared to undepressed patients, with the potential for collection of misleading data if applied in an inappropriate population.37
As PROs are more widely applied in the trial setting, a key aspect to evaluate is the responsiveness of a PRO, defined as its ability to detect changes in an outcome over time. To provide valid outcomes, a measure needs to be able to distinguish patients who remain the same, improve, or deteriorate over the course of a study. Without demonstration of responsiveness, an instrument may fail to detect the benefit of an intervention, leading to false-negative results.6 As a component of construct validity, methods for evaluating responsiveness typically involve longitudinal assessments of whether changes in scores are consistent with predefined hypotheses between or among groups relevant to the targeted construct; however, methods vary in how respondents are classified in terms of who improved and who did not.8,39 Beyond statistical significance, more recent efforts have focused on determining whether a difference in score is clinically meaningful. This threshold, called the minimally important difference (MID), is defined as the smallest change in score that would be perceived by patients as important. The minimum clinically important difference, a category of the MID, further specifies that the change in score be perceived as beneficial or harmful and would in absence of troublesome side effects and excessive cost mandate a change in the patient’s management.8,40 While multiple different methods exist for determining the MID, recent consensus supports the use of anchor-based methods, in which an external criterion or “anchor” is used to establish the magnitude of score change that reflects the MID, based on the change experienced by those who report a meaningful difference using the anchor, eg, using the patient global impression of severity (PGIS) method, patients may be asked to rate the overall severity of their condition pre- and posttreatment concurrently with the PRO, with the score difference between the two PGIS assessments used as the anchor for determining meaningful change.41 In the discussion document from the FDA’s workshop for its third guidance document on patient-focused drug development, the agency recommended focus on anchor-based methods to establish meaningful within-patient change, supplemented by other methods.42
Overall, when selecting a PRO or when interpreting collected data, one should review the clinical validation studies to ensure validity, reliability, and responsiveness have been evaluated so as not to introduce bias in the results. Contemporary validity theory further underscores that evaluation of validity must be ongoing beyond initial studies to provide supportive evidence for the use of a PRO in each new context, though this often must be balanced against the practical demands of efficient PRO uptake.34 This notion that the validity of a PRO must be readdressed for each new application will be important to consider as we discuss factors that may impact patient responses during PRO administration and data collection.
Administration and data collection: factors affecting patient responses
Following development, a PRO may be widely employed across a variety of indications and settings. Beyond instrument design, however, the way in which a PRO is administered can also influence response behavior. Therefore, when applying a PRO, researchers and clinicians must give consideration to the source of the responses, the mode and method of administration, and the setting of administration, each of which may impact the data collected (Table 2).8
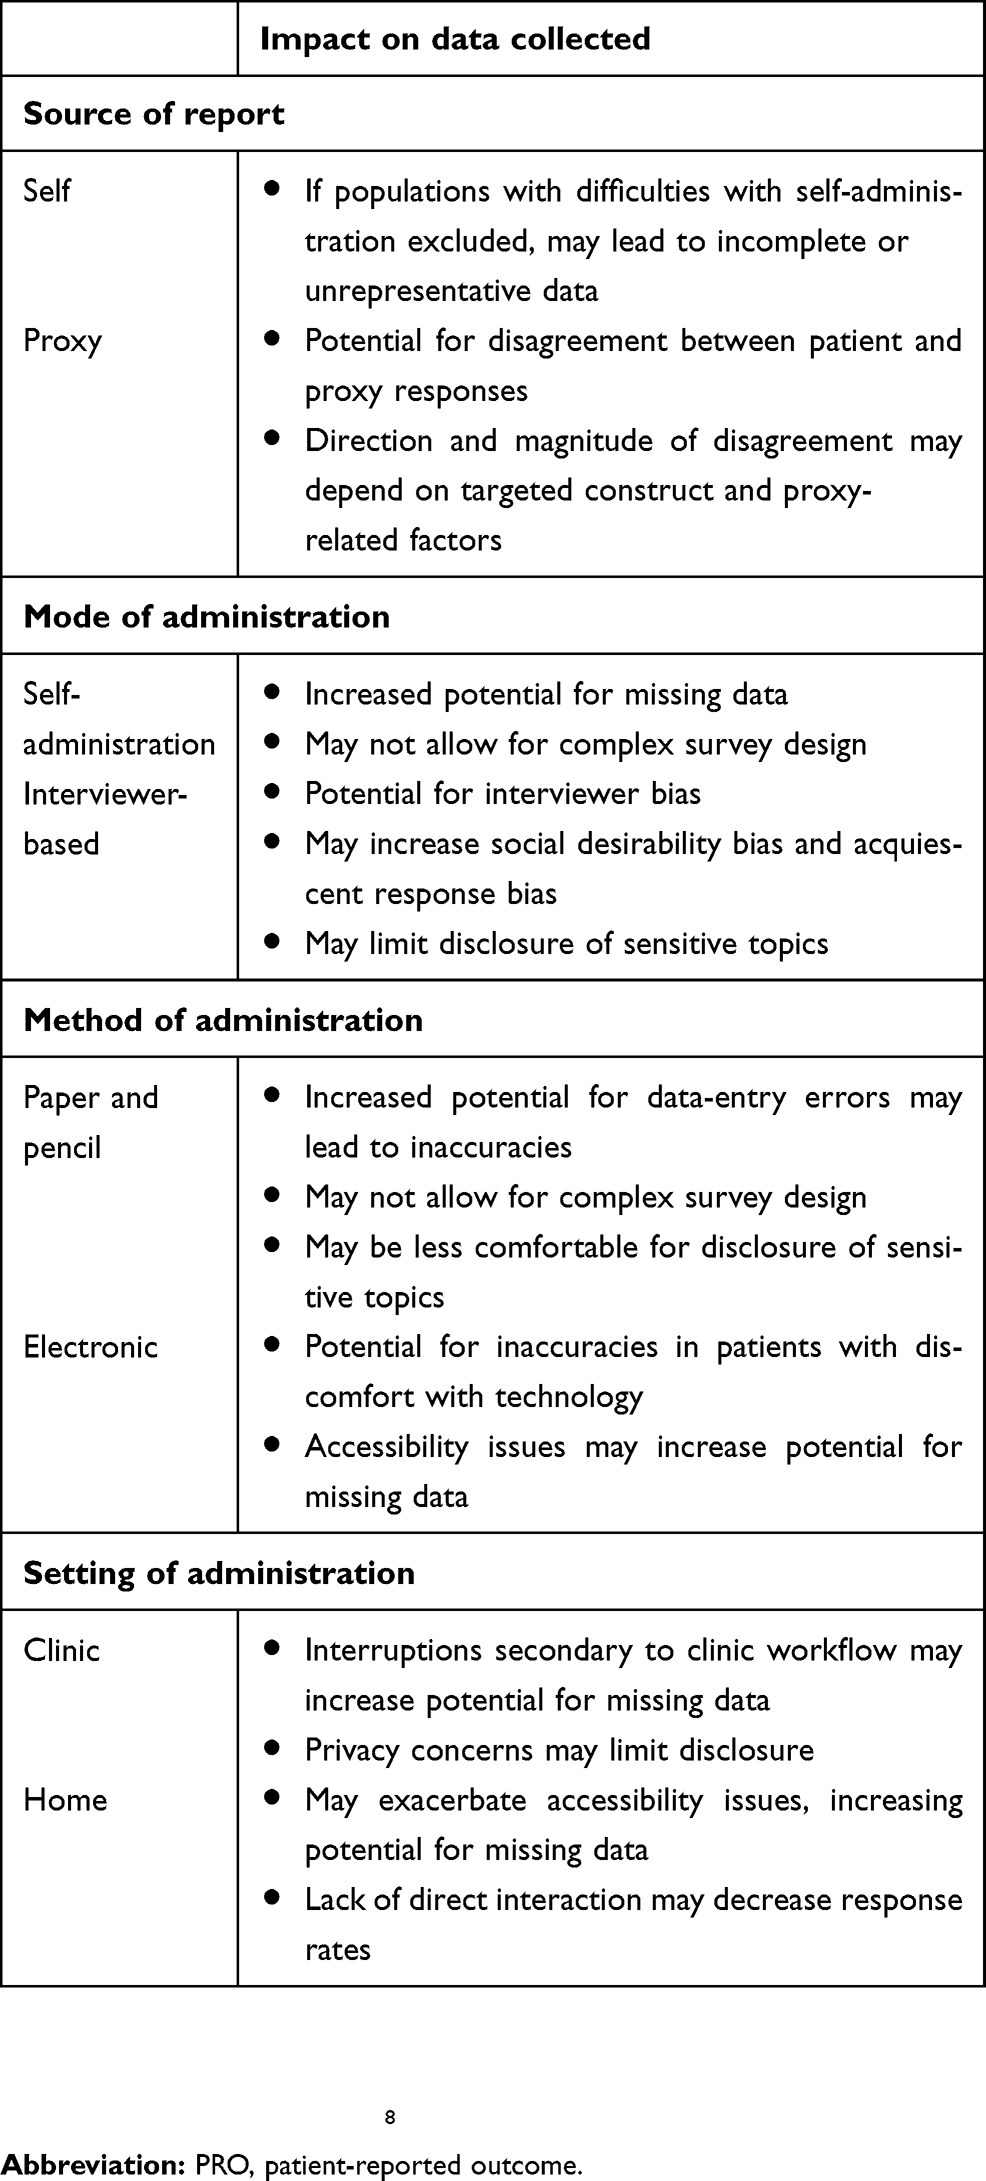 | Table 2 Factors impacting responses during PRO administration and data collection |
A fundamental aspect that distinguishes PROs is that the source of data is patients themselves, without interpretation by outside parties. However, there are instances in which evaluation of the patient perspective may be prohibitively difficult, such as in the setting of cognitive or communication deficits or in certain populations, such as children or the very elderly.8 To omit these groups would potentially lead to misleading conclusions or overlook important perspectives. As such, alternative proxy sources have been trialed. These typically include those familiar with the patient’s experience, such as family members or formal caregivers. In general, evidence suggests proxy responders demonstrate higher agreement with patient responses when rating observable physical dimensions, such as motor function, thanpsychosocial dimensions, such as emotional well-being, and the extent of disagreement tends to increase as the severity of illness or disability rises.8 For example, in a systematic review of studies evaluating the reliability of proxy respondents for stroke patients, stroke severity and the objective nature of questions were the most consistent determinants of disagreement between patients and proxy respondents.43 The direction of disagreement may depend on the specific symptom evaluated, with proxy respondents generally rating patients as having more functional difficulties and negative HRQOL, but underreporting pain.8 Proxy-related factors may impact responses as well, such as type (eg, family versus caregiver), age, education, and stress level.8 For instance, in a comparison of patient and proxy responses using five PRO measures in multiple sclerosis patients, caregiver strain was found to be the most substantial contributor to differences between patient and proxy scores, with proxy depression and sex also contributing.44 Given these multiple factors, a comparison of patient and proxy responses should be undertaken when feasible prior to use to ensure bias is not introduced to the data collected: comparisons may be made at the item, subscale, and group levels to assess degree of agreement.8 In general, when disagreement between patient and proxy reports is found, the degree tends to be small, suggesting proxy use may be appropriate as long as an evaluation of validity is undertaken.8
When administering a PRO, researchers and clinicians must decide the mode in which information will be recorded, either via self-administration or via a trained interviewer reading aloud questions and recording responses. Self-administration has typically been favored, due to both its cost-effectiveness and ease of use. However, self-administration may not be feasible for certain populations, such as those with difficulty with reading or writing. By serving as a guide for instrument completion, interviewers may improve access for these populations, as well as allow for more complex survey design and reduce rates of missing data, though this comes at the cost of potential interviewer bias.8 Interviewer bias is defined as a distortion in responses resulting from differential reactions to the presence of an interviewer.45 Bias may be introduced due to differences in the ways individual interviewers present questions or may impact the group of respondents as a whole, eg, while both sources of self-report introduce bias in general, social desirability bias (the tendency to give a favorable picture of one’s self) and acquiescent response bias (the tendency to agree or disagree with statements regardless of context to indicate a positive connotation) may be enhanced by the presence of an interviewer.8 The anonymity of self-administration may facilitate disclosure of sensitive topics, such as sexual function. For example, in a study comparing multiple methods of data collection about sensitive topics, self-administration tended to reduce the disparity between men and women in the number of sexual partners reported and increased the proportion disclosing illicit-drug use.46 Generally, the magnitude and direction of response effects with self- versus interviewer-based administration have been inconsistent in the literature, with some evidence that bias can be overcome with proper interviewer selection and training or may not have meaningful impact with repeat administration.8,47 Comparisons between self-administered and interviewer-collected data can be made during the validation process to determine the potential response effect prior to use.
Within each mode, there are multiple methods of capturing information that may impact data quality as well. PRO data were historically collected using paper-and-pencil questionnaires, though as technology has evolved, telephone and computer-based administration have become increasingly common, also known as electronic PRO (ePRO) data collection.6,48 These methods generally vary in terms of feasibility of administration, with ePRO collection facilitating data entry and scoring, but potentially requiring greater investment in technology-based platforms.ePRO collection may further allow for more complex survey design, including computer-adaptive testing, in which instruments are targeted based on the patient’s responses to minimize time burden.8,49 Due to its many advantages, ePRO is becoming the gold standard for PRO collection in the clinical trial setting, in part supported by guidance from the FDA.48 However, researchers should be aware of alterations in how questions are presented or conceptualized by respondents when translating between methods. Certain respondents may not have access to certain technologies if not provided or may have varying levels of comfort with navigating electronic platforms.8 Intriguingly, research suggests respondents may perceive the “virtual world” provided by electronic administration as more anonymous than paper and pencil, and thus exhibit greater disclosure of sensitive topics.50 Regardless, barring significant changes to the instrument during migration, evidence generally supports equivalence of ePRO and paper administration, with two large meta-analyses suggesting high degrees of agreement in data collected between the methods. In the more recent meta-analysis, agreement was found to be greater in more recent and randomized studies and in respondents of mean age 28–55 years compared with those younger or older.51,52 Therefore, ISPOR guidelines suggest quantitative equivalence studies are not required when only minor changes are made during migration to an electronic format, instead reserved for when moderate or substantial changes are made.53
A final consideration is the setting of administration, whether at home, in the clinic, or in another environment. This is of particular importance as PRO use in routine care becomes more common.8 Selection of setting may have important pragmatic effects on data collection. While administration in the clinic has the potential to improve response rate and facilitate real-time action based on results, inefficient incorporation into the clinic workflow may actually increase interruptions or heighten the cognitive burden placed on respondents, resulting in missing data or increased patient anxiety.8 This may be pronounced when tools validated for research purposes are instituted in the clinic without evaluation in context, eg, in a case study of implementation of PRO collection at the University of Alabama at Birmingham, the chosen instrument took 90 minutes to complete and led to a clinic bottleneck.7 While an argument could be made that discrepancies reflect true differences in PROs, consideration should be given to how characteristics of the individual setting may also impact results. For example, in a comparison of PROs across multiple practices, patients receiving care from practices with highly patient-centered cultures reported better physical functioning and borderline better emotional functioning than those receiving care at less patient-centered practices.54
Patient-level response behaviors: factors affecting patient responses
Due to the subjective nature of PROs, significant consideration has gone into assessing how respondents’ backgrounds and personalities may influence their responses. For instance, in an analysis of responses to the Hospital Consumer Assessments of Health Care Providers and Systems Survey, a standardized instrument to measure patients’ assessments of hospital care, Spanish language spoken at home was highly predictive of higher patient-satisfaction scores. Notably, older age, less education, and better self-reported health status were also predictive of higher satisfaction.55 When these factors are examined at the group level, differences between groups may reflect true differences in the measured construct (eg, increased levels of fatigue in elderly versus nonelderly patients) or differences in how respondents interpret the instrument (eg, poor translations resulting in differential responses from speakers of other languages). While both types of differences are discussed here, the latter has received considerable focus, as differences in interpreting instruments among respondents introduces bias into the collected results. Specific methods exist for examining differences between groups due to interpretation issues, named differential item function (DIF) testing.37 There are multiple methods of DIF testing, which aim to quantify whether associations between the items in the instrument and the estimated underlying attribute vary by subgroup.56 Ideally, characteristics of a target population that may lead to variations in the results should be examined in advance, including thorough quantitative DIF testing and follow-up qualitative analysis to determine the underlying cause of uncovered DIF.37 In general, patient-level factors that may impact responses can be considered in two categories: those related to the patient’s background and generic factors related to the subjective nature of PRO testing itself.
Patient-level response behaviors: patient background
As PRO use has broadened to increasingly diverse settings, significant attention has been paid to understanding how patients’ backgrounds may influence their responses. This influence may occur at the cultural level, via differential interpretations of a question’s meaning or differential value placed on certain items, or at the linguistic level, via inappropriate translation into other languages. For example, in a summary of the challenges in translating and adapting the SF36 into Japanese, authors noted a greater preponderance of patients than expected scoring highly on measures of physical functioning using an initial translation of the instrument. However, through focus-group discussions, it was discovered many respondents were likely interpreting the word “limited” to mean “limited by a doctor”. Revising the instrument by replacing “limited” with “difficult to do” resulted in a normalization of responses.57 Given the potential for differential functioning, appropriate efforts to ensure instruments are cross-culturally and cross-linguistically equivalent are important to ensure differences found in outcomes reflect true treatment differences and (equally important) to allow data pooling across different cultural applications.8 Beyond review of translation, full adaptation requires that the scaling and psychometric properties of a new-language version of a PRO be assessed.58 ISPOR previously put forth guidelines for the translation and cultural adaptation of PROs, though more modern and comprehensive frameworks have been suggested.59–61
A notable impact of cultural background is its effect on response style. As discussed previously, response style refers to the tendency to answer questions in certain ways regardless of content, potentially causing systematic error.17 While a patient’s response style may be influenced by the design of an instrument, it is also strongly associated with the personal characteristics of the patient. This effect may be seen through demographic variables, such as education level or age, or aspects of the patient’s personality, such as anxiety or decisiveness.16,17 Overall, however, evidence from cross-cultural studies suggests the impact of demographic and personality variables is relatively small compared to the cultural background of the respondent.17 The influence of cultural background on response style has been examined both via characteristics of the culture (eg, more individualistic countries may show decreased rates of extreme response and acquiescence response styles) and at the country level, eg, in an analysis of responses to 7-point Likert scales among high school students, students from Japan and Taiwan were more likely than students from Canada and the US to select the midpoint, with students from the US more likely than other groups to use extreme values.17,62 Importantly, DIF testing may actually yield between-group differences in response style, though this falls outside the standard definition of DIF, defined as group differences in relationship to the features or content of an item. Elucidation of the underlying cause of DIF in follow-up is important in making accurate decisions regarding item modification and bias interpretation.16 For example, in a study examining the impact of sex on responses to the Revised Neuroticism Extraversion Openness Personality Inventory, both sex-DIF and response style were found independently to influence item responses; however, when controlling for response style, the magnitude of DIF and classification of items as DIF altered, reinforcing the importance of accounting for response style.63
In the US, limitations with literacy may serve as a potential barrier to PRO completion for many patients, with 14% of respondents having low literacy and 22% only basic literacy on the National Assessment of Adult Literacy on last assessment in 2003.1 Low levels of health literacy, defined as “the degree to which individuals have the capacity to obtain, process, and understand basic health information and services needed to make appropriate health decisions”, may prove even more limiting due to the unfamiliar context and vocabulary of the health-care system.8 Multiple readability indices and minimum-level guidelines for health literature exist, though with varying levels of compliance among PRO, eg, in an analysis of ten commonly used PROs in rheumatology, only six were found to meet the recommended reading level.64 However, beyond readability indices, comprehensive evaluation of readability may be more difficult, as respondents must be able both to recognize words and comprehend them in the context of the writing.64 Misunderstanding of a PRO could lead to inaccuracies in the data collected. For instance, in a study evaluating the ability of patients to self-complete the Epworth Sleepiness Scale, 33.8% of first-time respondents made errors during completion, with 22.5% requiring assistance to complete the instrument.65 Furthermore, in a study evaluating the impact of literacy on PROs in patients with systemic lupus erythematosus, respondents with low health literacy reported worse status across multiple PROs, even after accounting for physician-assessed disease, income, education, and race/ethnicity, though the authors noted it was unclear whether differences were due to unmeasured effects of low health literacy or to differential interpretation of PROs by respondents.66 Given the potential impact of low health literacy on PRO results, efforts should be made to evaluate readability during validation. In the absence of a single validated metric, researchers have advocated the use of multiple readability measures to evaluate a passage.67
Functional limitations associated with disability also pose a potential barrier to PRO completion.8 As people with disabilities represent a significant portion of the population, estimated at about one in five people in the US, omission of this group may lead to substantially incomplete data.68 Furthermore, people with disabilities are more likely to develop health conditions, and thus their inclusion is important to ensuring data collected are adequately representative of all health-care consumers.8 As discussed, the impact of functional ability may depend heavily on the selected mode and method of PRO administration, with common functional limitations affecting PRO collection including hearing and vision problems, impaired motor skills, and cognitive deficits.8 There are multiple means to improve access for people with functional limitations, such as interactive voice-response systems or pictorial response scales, though efforts should be made to validate that collected scores are comparable to those from traditional instruments.8 Beyond the potential impact on accessibility and comprehension, comorbid conditions may produce clinically meaningful differences in PRO measures of HRQOL. For instance, in an analysis of data collected as part of PROMIS-item calibration, the presence of a chronic condition was associated with poorer scores across multiple domains of HRQOL, even after controlling for age, sex, relationship status, race, and education. Notably, this effect was compounded for those with multiple chronic conditions, with the magnitude of detriment more pronounced for respondents with two or more chronic conditions than those with a single or no reported conditions.69 Therefore, this impact should be considered when interpreting results, particularly when using generic instruments that may be more affected than condition-specific measures.
Review of these patient-level factors highlights the importance of including a heterogeneous population in PRO validation and measurement, with efforts to include vulnerable populations. Vulnerability may be multifaceted, extending beyond cultural background, literacy, and functional ability to include age, sex, gender, financial circumstances, or place of residence.8 Making sure certain PRO measures are valid and employed in these populations is crucial to ensuring differential health outcomes are not overlooked, and is key to delivering true patient-centered care.8
Patient-level response behaviors: generic factors
In addition to those related to patient background, generic patient-level factors arising during data collection may impact responses as well. These typically are related to the context or meaning of the phenomenon assessed, including its personal and social relevance to the patient.30 If these factors alter the accuracy of a patient’s recollection, recall bias may be introduced into the data collected. For instance, the salience of an event, defined as its significance to the patient, has been shown to influence recall, with major symptoms usually more easily recalled than minor symptoms.30 Interestingly, while salient events may be more easily recalled, evidence indicates respondents may misremember a salient event as occurring more recently than it actually did, also known as “telescoping”.30 This has the potential to bias results toward overestimation if events that occurred before the recall period are incorrectly counted. Telescoping may be counteracted via setting bounds to the recall period with specific anchors (eg, since the last clinic visit).30 Of note, the meaning of an event may change secondarily to the patient’s state at the time of survey, with some suggestion that a patient’s mood may influence recall. Patients may be more likely to report negative emotional content when in a negative mood, potentially introducing bias.30 For example, in a study of self-reported pain in patients with chronic headaches, patients with high present pain intensity were more likely to rate maximal, usual, and minimum levels of prior pain as more severe than hourly pain diaries. Similarly, patients with low present pain were more likely to recall pain levels as being less severe than diary scores.70
An assumption made during PRO assessment is that respondents are evaluating health states using the same personal criteria over time. However, research suggests that experiences may alter a patient’s internal metrics for evaluating a health state: when a patient experiences a change in perspective that systematically alters how a health state is evaluated from one time point to another, this is known as “response shift”.8 Response shift may occur due to a recalibration of the respondent’s internal standards of measurement, a change in how the respondent values certain health domains, or reconceptualization of how the respondent understands the targeted construct.8 For example, in a study examining recall of HRQOL in patients undergoing prostatectomy, multiple months after surgery patients tended to remember their baseline HRQOL scores as being higher than their actual scores rated before surgery. The authors hypothesized this may have been in part due to adaptation to their health state over time.71 In this example, if this adaptation led patients to rate their current health higher as well, a comparison with actual baseline scores prior to adaptation would lead to underestimation of treatment toxicity. Importantly, response shifts may not be uniform across patients: in a study examining response shift in HRQOL scores in patients with multiple myeloma, differences in the magnitude and direction of response shift were seen between patients who felt improved versus those who deteriorated over time.72 Response shifts both challenge the validity, reliability, and responsiveness of longitudinal PRO assessment and confound score interpretation, as change may occur due to response shift, treatment effect, or both.8 Multiple strategies have been proposed for monitoring and controlling for response shift, though as each carries certain limitations, this is an active area of research.8,31
Conclusion
The development and administration of PRO instruments can introduce many factors that influence patients’ responses, which is then further driven by patient-level response behaviors. Their impact on the quality of data collected may be counteracted in part by thorough instrument testing and validation, including continued reevaluation as the instrument is adapted for new contexts and populations. With multiple factors to account for, this is not a trivial undertaking, and thus joint efforts to standardize methodology, such as via cooperative research groups, should be encouraged. Regardless of these efforts to preserve data quality, it is important to recognize that all assessments, even physiological metrics, such as laboratory values, are affected by a degree of measurement error.73 Given the importance of incorporating the patient’s perspective in health-care evaluations, a reasonable level of imperfection may be acceptable, and should not serve as a deterrent to continued uptake of PRO measures.
Disclosure
The authors report no conflicts of interest in this work.
References
1. Rothrock NE, Kaiser KA, Cella D. Developing a valid patient-reported outcome measure. Clin Pharmacol Ther. 2011;90(5):737–742. doi:10.1038/clpt.2011.195
2. Ware JE, Sherbourne CD. The MOS 36-item short-form health survey (SF-36): conceptual framework and item selection. Med Care. 1992;30(6):473–483.
3. Jones N, Jones SL, Miller NA. The medicare health outcomes survey program: overview, context, and near-term prospects. Health Qual Life Outcomes. 2004;2:33. doi:10.1186/1477-7525-2-33
4. Bass M, Morris S, Neapolitan R. Utilizing multidimensional computer adaptive testing to mitigate burden with patient reported outcomes. AMIA Annu Symp Proc. 2015;2015:320–328.
5. Quinten C, Maringwa J, Gotay CC, et al. Patient self-reports of symptoms and clinician ratings as predictors of overall cancer survival. J Natl Cancer Inst. 2011;103(24):1851–1858. doi:10.1093/jnci/djr485
6. Johnston BC, Patrick DL, Busse JW, Schünemann HJ, Agarwal A, Guyatt GH. Patient-reported outcomes in meta-analyses–part 1: assessing risk of bias and combining outcomes. Health Qual Life Outcomes. 2013;11(1):109. doi:10.1186/1477-7525-11-83
7. Locklear T, DeBar LL, Willig J, et al. Case studies from the clinic: initiating and implementing patient-reported outcome measures. EGEMS (Wash DC). 2017;5(1):7.
8. Cella DF, Hahn EA, Jensen SE, et al. Patient-Reported Outcomes in Performance Measurement. Research Triangle Park, NC: RTI Press/RTI International; 2015.
9. Vodicka E, Kim K, Devine EB, Gnanasakthy A, Scoggins JF, Patrick DL. Inclusion of patient-reported outcome measures in registered clinical trials: evidence from ClinicalTrials.gov (2007–2013). Contemp Clin Trials. 2015;43:1–9. doi:10.1016/j.cct.2015.04.004
10.
11. CDER Patient-Focused Drug Development [Website on the Internet]. Silver Spring: United States Food and Drug Administration; 2018. Available from:
12.
13. DeMuro C, Clark M, Mordin M, Fehnel S, Copley-Merriman C, Gnanasakthy A. Reasons for rejection of patient-reported outcome label claims: a compilation based on a review of patient-reported outcome use among new molecular entities and biologic license applications, 2006–2010. Value Health. 2012;15(3):443–448. doi:10.1016/j.jval.2012.01.010
14. Fallowfield L, Payne H, Jenkins V. Patient-reported outcomes in metastatic castration-resistant prostate cancer. Nat Rev Clin Oncol. 2016;13(10):643–650. doi:10.1038/nrclinonc.2016.100
15.
16. Dowling NM, Bolt DM, Deng S, Li C. Measurement and control of bias in patient reported outcomes using multidimensional item response theory. BMC Med Res Methodol. 2016;16(1):63. doi:10.1186/s12874-016-0161-z
17. Van Vaerenbergh Y, Thomas TD. Response styles in survey research: a literature review of antecedents, consequences, and remedies. Int J Public Opin Res. 2013;25(2):195–217. doi:10.1093/ijpor/eds021
18. Brossart DF, Clay DL, Wilson VL. Methodological and statistical considerations for threats to internal validity in pediatric outcome data: response shift in self-report outcomes. J Pediatr Psychol. 2002;27(1):97–107.
19. Sandler KA, Mitchell SA, Basch E, et al. Content validity of anatomic site-specific patient-reported outcomes version of the common terminology criteria for adverse events (PRO-CTCAE) item sets for assessment of acute symptomatic toxicities in radiation oncology. Int J Radiat Oncol Biol Phys. 2018;102(1):44–52. doi:10.1016/j.ijrobp.2018.04.048
20. Basch E, Abernethy AP, Reeve BB. Assuring the patient centeredness of patient-reported outcomes: content validity in medical product development and comparative effectiveness research. Value Health. 2011;14(8):965–966. doi:10.1016/j.jval.2011.10.002
21. Patrick DL, Burke LB, Gwaltney CJ, et al. Content validity–establishing and reporting the evidence in newly developed patient-reported outcomes (PRO) instruments for medical product evaluation: ISPOR PRO good research practices task force report: part 1–eliciting concepts for a new PRO instrument. Value Health. 2011;14(8):967–977. doi:10.1016/j.jval.2011.06.014
22. Patrick DL, Burke LB, Gwaltney CJ, et al. Content validity–establishing and reporting the evidence in newly developed patient-reported outcomes (PRO) instruments for medical product evaluation: ISPOR PRO good research practices task force report: part 2–assessing respondent understanding. Value Health. 2011;14(8):978–988. doi:10.1016/j.jval.2011.06.013
23. Wiklund I, Dimenäs E, Wahl M. Factors of importance when evaluating quality of life in clinical trials. Control Clin Trials. 1990;11(3):169–179.
24. Owolabi MO. Which is more valid for stroke patients: generic or stroke-specific quality of life measures? Neuroepidemiology. 2010;34(1):8–12. doi:10.1159/000255460
25. Schifferdecker KE, Yount SE, Kaiser K, et al. A method to create a standardized generic and condition-specific patient-reported outcome measure for patient care and healthcare improvement. Qual Life Res. 2018;27(2):367–378. doi:10.1007/s11136-017-1675-5
26. Gries K, Berry P, Harrington M, et al. Literature review to assemble the evidence for response scales used in patient-reported outcome measures. J Patient Rep Outcomes. 2018;2(1):41. doi:10.1186/s41687-018-0056-3
27. Mutebi A, Slack M, Warholak TL, Hudgens S, Coons SJ. Interpretation of verbal descriptors for response options commonly used in verbal rating scales in patient-reported outcome instruments. Qual Life Res. 2016;25(12):3181–3189. doi:10.1007/s11136-016-1333-3
28. Babakus E, Mangold WG. Adapting the SERVQUAL scale to hospital services: an empirical investigation. Health Serv Res. 1992;26(6):767–786.
29. Finstad K. Response interpolation and scale sensitivity: evidence against 5-point scales. J Usability Stud. 2010;5(3):104–110.
30. Stull DE, Leidy NK, Parasuraman B, Chassany O. Optimal recall periods for patient-reported outcomes: challenges and potential solutions. Curr Med Res Opin. 2009;25(4):929–942. doi:10.1185/03007990902774765
31. McPhail S, Haines T. Response shift, recall bias and their effect on measuring change in health-related quality of life amongst older hospital patients. Health Qual Life Outcomes. 2010;8(1):65. doi:10.1186/1477-7525-8-65
32. Reilly MC, Bracco A, Ricci J-F, Santoro J, Stevens T. The validity and accuracy of the Work Productivity And Activity Impairment questionnaire–irritable bowel syndrome version (WPAI:IBS). Aliment Pharmacol Ther. 2004;20(4):459–467. doi:10.1111/j.1365-2036.2004.02091.x
33. Gagnier JJ, Lai J, Robbins C Bias arising from the use of patient-reported outcome measures [abstract].
34. Hawkins M, Elsworth GR, Osborne RH. Application of validity theory and methodology to patient-reported outcome measures (PROMs): building an argument for validity. Qual Life Res. 2018;27(7):1695–1710. doi:10.1007/s11136-018-1815-6
35. Cappelleri JC, Jason Lundy J, Hays RD. Overview of classical test theory and item response theory for the quantitative assessment of items in developing patient-reported outcomes measures. Clin Ther. 2014;36(5):648–662. doi:10.1016/j.clinthera.2014.04.006
36. Hobart J, Cano S, Baron R, et al. Achieving valid patient-reported outcomes measurement: a lesson from fatigue in multiple sclerosis. Mult Scler. 2013;19(13):1773–1783. doi:10.1177/1352458513483378
37. Frost MH, Reeve BB, Liepa AM, Stauffer JW, Hays RD. What Is sufficient evidence for the reliability and validity of patient-reported outcome measures? Value Health. 2007;10:S94–S105. doi:10.1111/j.1524-4733.2007.00272.x
38. Brazier JE, Harper R, Munro J, Walters SJ, Snaith ML. Generic and condition-specific outcome measures for people with osteoarthritis of the knee. Rheumatology (Oxford). 1999;38(9):870–877.
39. Sayers A, Wylde V, Lenguerrand E, et al. A unified multi-level model approach to assessing patient responsiveness including; return to normal, minimally important differences and minimal clinically important improvement for patient reported outcome measures. BMJ Open. 2017;7(7):e014041. doi:10.1136/bmjopen-2016-014041
40. Grøvle L, Haugen AJ, Hasvik E, Natvig B, Brox JI, Grotle M. Patients’ ratings of global perceived change during 2 years were strongly influenced by the current health status. J Clin Epidemiol. 2014;67(5):508–515. doi:10.1016/j.jclinepi.2013.12.001
41. Coon CD, Cook KF. Moving from significance to real-world meaning: methods for interpreting change in clinical outcome assessment scores. Qual Life Res. 2018;27(1):33–40. doi:10.1007/s11136-017-1616-3
42.
43. Oczkowski C, O’Donnell M. Reliability of proxy respondents for patients with stroke: a systematic review. J Stroke Cerebrovasc Dis. 2010;19(5):410–416. doi:10.1016/j.jstrokecerebrovasdis.2009.08.002
44. Sonder JM, Holman R, Knol DL, Bosma LVAE, Polman CH, Uitdehaag BMJ. Analyzing differences between patient and proxy on patient reported outcomes in multiple sclerosis. J Neurol Sci. 2013;334(1–2):143–147. doi:10.1016/j.jns.2013.08.014
45. Bowling A. Mode of questionnaire administration can have serious effects on data quality. J Public Health (Oxf). 2005;27(3):281–291. doi:10.1093/pubmed/fdi031
46. Tourangeau R, Smith TW. Asking sensitive questions: the impact of data collection mode, question format, and question context. Public Opin Q. 1996;60(2):275–304. doi:10.1086/297751
47. Puhan MA, Ahuja A, Van Natta ML, Ackatz LE, Meinert C. The studies of ocular complications of AIDS research group. Interviewer versus self-administered health-related quality of life questionnaires - does it matter? Health Qual Life Outcomes. 2011;9(1):30. doi:10.1186/1477-7525-9-40
48. Coons SJ, Eremenco S, Lundy JJ, O’Donohoe P, O’Gorman H, Malizia W. Capturing patient-reported outcome (PRO) data electronically: the past, present, and promise of ePRO measurement in clinical trials. Patient. 2015;8(4):301–309. doi:10.1007/s40271-014-0090-z
49. Morris S, Bass M, Lee M, Neapolitan RE. Advancing the efficiency and efficacy of patient reported outcomes with multivariate computer adaptive testing. J Am Med Inform Assoc. 2017;24(5):897–902. doi:10.1093/jamia/ocx003
50. Gnambs T, Kaspar K. Disclosure of sensitive behaviors across self-administered survey modes: a meta-analysis. Behav Res Methods. 2015;47(4):1237–1259. doi:10.3758/s13428-014-0533-4
51. Gwaltney CJ, Shields AL, Shiffman S. Equivalence of electronic and paper-and-pencil administration of patient-reported outcome measures: a meta-analytic review. Value Health. 2008;11(2):322–333. doi:10.1111/j.1524-4733.2007.00231.x
52. Muehlhausen W, Doll H, Quadri N, et al. Equivalence of electronic and paper administration of patient-reported outcome measures: a systematic review and meta-analysis of studies conducted between 2007 and 2013. Health Qual Life Outcomes. 2015;13:167. doi:10.1186/s12955-015-0362-x
53. Coons SJ, Gwaltney CJ, Hays RD, et al. Recommendations on evidence needed to support measurement equivalence between electronic and paper-based patient-reported outcome (PRO) measures: ISPOR ePRO good research practices task force report. Value Health. 2009;12(4):419–429. doi:10.1111/j.1524-4733.2008.00470.x
54. Ivey SL, Shortell SM, Rodriguez HP, Wang YE. Patient engagement in ACO practices and patient-reported outcomes among adults with co-occurring chronic disease and mental health conditions. Med Care. 2018;56(7):551–556. doi:10.1097/MLR.0000000000000927
55. Elliott MN, Zaslavsky AM, Goldstein E, et al. Effects of survey mode, patient mix, and nonresponse on CAHPS hospital survey scores. Health Serv Res. 2009;44(2 Pt 1):501–518. doi:10.1111/j.1475-6773.2008.00914.x
56. Teresi JA, Ramirez M, Lai J-S, Silver S. Occurrences and sources of differential item functioning (DIF) in patient-reported outcome measures: description of DIF methods, and review of measures of depression, quality of life and general health. Psychol Sci Q. 2008;50(4):538.
57. Fukuhara S, Bito S, Green J, Hsiao A, Kurokawa K. Translation, adaptation, and validation of the SF-36 health survey for use in Japan. J Clin Epidemiol. 1998;51(11):1037–1044.
58. McKenna SP, Doward LC. The translation and cultural adaptation of patient-reported outcome measures. Value Health. 2005;8(2):89–91. doi:10.1111/j.1524-4733.2005.08203.x
59. Wild D, Grove A, Martin M, et al. Principles of good practice for the translation and cultural adaptation process for patient-reported outcomes (PRO) measures: report of the ISPOR task force for translation and cultural adaptation. Value Health. 2005;8(2):94–104. doi:10.1111/j.1524-4733.2005.04054.x
60. Regnault A, Herdman M. Using quantitative methods within the Universalist model framework to explore the cross-cultural equivalence of patient-reported outcome instruments. Qual Life Res. 2015;24(1):115–124. doi:10.1007/s11136-014-0722-8
61. Alonso J, Bartlett SJ, Rose M, et al. The case for an international patient-reported outcomes measurement information system (PROMIS®) initiative. Health Qual Life Outcomes. 2013;11:210. doi:10.1186/1477-7525-11-83
62. Chen C, Lee S-Y, Stevenson HW. Response style and cross-cultural comparisons of rating scales among East Asian and North American students. Psychol Sci. 1995;6(3):170–175. doi:10.1111/j.1467-9280.1995.tb00327.x
63. Wetzel E, Böhnke JR, Carstensen CH, Ziegler M, Ostendorf F. Do individual response styles matter?: assessing differential item functioning for men and women in the NEO-PI-R. J Individ Differ. 2013;34(2):69–81. doi:10.1027/1614-0001/a000102
64. Adams J, Chapman J, Bradley S, Ryan SJ. Literacy levels required to complete routinely used patient-reported outcome measures in rheumatology. Rheumatology (Oxford). 2013;52(3):460–464. doi:10.1093/rheumatology/kes296
65. Ghiassi R, Murphy K, Cummin AR, Partridge MR. Developing a pictorial epworth sleepiness scale. Thorax. 2011;66(2):97–100. doi:10.1136/thx.2010.136879
66. Katz PP, Dall’Era M, Trupin L, et al. The impact of limited health literacy on patient-reported outcomes (PROs) in systemic lupus erythematosus. Arthritis Rheumatol. 2017;69(suppl10). Available from:
67. Perez JL, Mosher ZA, Watson SL, et al. Readability of orthopaedic patient-reported outcome measures: is there a fundamental failure to communicate? Clin Orthop Relat Res. 2017;475(8):1936–1947. doi:10.1007/s11999-017-5339-0
68. Courtney-Long EA, Carroll DD, Zhang QC, et al. Prevalence of disability and disability type among adults–united States, 2013. MMWR Morb Mortal Wkly Rep. 2015;64(29):777–783.
69. Rothrock NE, Hays RD, Spritzer K, Yount SE, Riley W, Cella D. Relative to the general US population, chronic diseases are associated with poorer health-related quality of life as measured by the patient-reported outcomes measurement information system (PROMIS). J Clin Epidemiol. 2010;63(11):1195–1204. doi:10.1016/j.jclinepi.2010.04.012
70. Eich E, Reeves JL, Jaeger B, Graff-Radford SB. Memory for pain: relation between past and present pain intensity. Pain. 1985;23(4):375–380.
71. Litwin MS, McGuigan KA. Accuracy of recall in health-related quality-of-life assessment among men treated for prostate cancer. J Clin Oncol. 1999;17(9):2882–2888. doi:10.1200/JCO.1999.17.9.2882
72. Kvam AK, Wisløff F, Fayers PM. Minimal important differences and response shift in health-related quality of life; a longitudinal study in patients with multiple myeloma. Health Qual Life Outcomes. 2010;8(1):79. doi:10.1186/1477-7525-8-79
73. Atherton PJ, Sloan JA. Rising importance of patient-reported outcomes. Lancet Oncol. 2006;7(11):883–884. doi:10.1016/S1470-2045(06)70914-7
 © 2019 The Author(s). This work is published and licensed by Dove Medical Press Limited. The
full terms of this license are available at https://www.dovepress.com/terms
and incorporate the Creative Commons Attribution
- Non Commercial (unported, 3.0) License.
By accessing the work you hereby accept the Terms. Non-commercial uses of the work are permitted
without any further permission from Dove Medical Press Limited, provided the work is properly
attributed. For permission for commercial use of this work, please see paragraphs 4.2 and 5 of our Terms.
© 2019 The Author(s). This work is published and licensed by Dove Medical Press Limited. The
full terms of this license are available at https://www.dovepress.com/terms
and incorporate the Creative Commons Attribution
- Non Commercial (unported, 3.0) License.
By accessing the work you hereby accept the Terms. Non-commercial uses of the work are permitted
without any further permission from Dove Medical Press Limited, provided the work is properly
attributed. For permission for commercial use of this work, please see paragraphs 4.2 and 5 of our Terms.